1. Introduction
Porous carbons are synthesized by various methods such as: chemical and physical activation [
1]; catalytic activation of carbon precursor using metal salts or organometallic compounds; carbonization of polymer blends; carbonization in presence of inorganic templates [
2]. The obtained porosity can be classified according to the origin (interparticle, intraparticle pores), state (open, closed pores) and dimension of pores [
3]. Based on the dimension, IUPAC [
4] classifies pores in micropores (diameter less than 2 nm), mesopores (diameter between 2 and 50 nm) and macropores (diameter larger than 50 nm). Porosity and surface functional groups influence carbon adsorption capacity [
5]. Due to the possibility to tailor their properties, porous carbons are widely applied. For instance, they can be employed in pollutant removal from water and soil [
6] and in gas adsorption [
7,
8].
The main feature of activated carbons is their large surface area (800–1200 m
2/g), originated by the activation process which favors pore formation. Jung et al. [
9] compared carbons produced by the same precursors but in different working conditions. Surface areas of pyrolyzed carbons, 100–250 m
2/g (calculated by BET equation), are definitely lower than activated carbon ones, 700–1130 m
2/g. Nevertheless in the work of Carrier et al. [
10] pyrolyzed and activated carbons show the same performance in the adsorption of cationic dyes. The structure of these carbons is a mixture of organized phase graphite-like and non-organized phase composed of aromatic and aliphatic forms [
5]. The relative amount of crystalline and amorphous regions depends on the chemical composition of polymers used as precursors and on the carbonization parameters [
11]. In amorphous carbon, the defective plane layers are crosslinked by aliphatic bridging groups producing a twisted network, in which few layers (from two to four) are stacked producing crystallites. Gaps between stacked layers and between stacks are responsible for carbon porosity [
12].
There are many ways to produce porous carbon as well as biochar [
13], among them pyrolysis technologies are prevalent to prevent resulting secondary pollution and ensure established circular bioeconomy [
14]. In particular, biomass pyrolysis is the most important [
15]. Since the biomasses are mainly composed of polysaccharides, it follows that the polymeric structures made up of glucosidic units linked together with glycosidic linkages constitute the main precursors for the pyrolytic production of carbons.
Polysaccharides are, in general, composed of monosaccharide units, and are the most abundant hydrocarbon resource on the earth. Since the crystallinities and the molecular orientations of some polysaccharides can be easily controlled by chemical or physical modifications, one can tailor it to desired shapes such as fiber, film or more complicated ones. If the as-formed shapes of polysaccharide precursors are kept unchanged after carbonization, one can expect development of novel carbon products from raw biomass materials with highly controlled morphology [
16]. Polysaccharides are inexpensive, non-toxic and biodegradable, they are found in nearly every geographical location on the planet and are the main chemical components of several kinds of agro-wastes, including food processing residues and agricultural wastes.
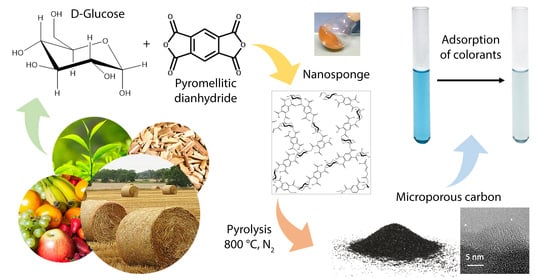
In order to increase the effectiveness of porous carbons it is necessary to control their morphology and porosity during synthesis, in particular a narrow distribution of porosity can make them more selective in the use of the removal of pollutants. From this point of view it becomes of fundamental importance to master the structure of the precursor. This approach will be able to inform new potential applications of polysaccharide resources other than their typical charcoal use. In the last years there has been an increasing interest in cyclodextrins based nanosponges (CD-NSs). This kind of crosslinked polymer with nanoscale pores is produced from cyclodextrin (CD) and bi- or polyfunctional chemicals, including dianhydrides, diisocyanates, active carbonyl compounds, and carboxylic acids [
17]. CD-NSs were also demonstrated to be good precursors of microporous carbons: CD-NSs synthesized using pyromellitic dianhydride (PMDA) as cross linker and β-cyclodextrin as a building block lead to the formation of microporous carbon through a pyrolysis treatment with a carbon yield of 28 wt% and pores with a range size between 0.5 nm and 1.6 nm [
18].
CDs are truncated cone-shaped cyclic oligosaccharides composed of glucopyranose units arranged around a hydrophobic cavity which can accommodate guest molecules through the formation of inclusion complexes. These nano-sized cavities render CDs suitable building blocks for organic NSs. Reactive hydroxyl groups oriented towards the exterior side of CDs allows them to act as polyfunctional monomers, able to be cross-linked using a wide variety of bi- or poly-functional chemicals, including dianhydrides, diisocyanates, active carbonyl compounds, epoxides, carboxylic acids, etc., consequently resulting in insoluble three-dimensional covalent networks [
19]. The cross-linked polymers thus obtained will be characterized by the presence of lipophilic cavities, intrinsic to the cyclodextrins used as monomers, and by the presence of porosity intrinsic to the cross-linked structure whose polarity will depend on the nature of the cross-linker used and on the degree of cross-linking that occurs. In the pharmaceutical field, CD-NSs allows inclusion of lipophilic or hydrophilic drugs and their slow release into physiological media [
20], while in the environmental field, CD-NSs enable the removal of organic pollutants from water [
21,
22,
23].
More recently, nanosponges synthesized using high amylose content maltodextrins as building blocks and PMDA as a crosslinker have been shown to be an excellent precursor for the production of porous carbon via pyrolytic processes [
24,
25]. The carbon thus obtained was completely comparable to that produced starting from CD-NSs, indicating that the pore size and the particularly narrow distribution observed probably derive from the glucopyranoside units present in both nanosponges. Inspired by this, in the present study we synthesized a new nanosponge based on D-glucose (GLU) using PMDA as crosslinker, with the aim to produce porous carbon via pyrolysis, considering that GLU is the most abundant monosaccharide in biomass, being the building block of starch, cellulose and glycogen and existing in nature solely as D enantiomer and mainly arranged in pyranoside structures.
2. Materials and Methods
2.1. Synthesis of Nanosponges
Pyromellitic dianhydride (PMDA), dimethyl sulfoxide (DMSO), acetone, triethylamine (TEA) and methylene blue (MB) were purchased from Sigma-Aldrich (Munich, Germany) and used without any further purification. D-glucose (GLU) was purchased from Sigma-Aldrich and was dried before use.
Four nanosponges with different molar ratios of PMDA/GLU were synthesized. Approximately 2 g of GLU was solubilized under continued stirring in 10 mL of DMSO, then an adequate quantity of PMDA (
Table 1) was added. After solubilization of the reagents, 1 mL of TEA was added to trigger the crosslinking reaction. Gelation occurred in a matter of minutes. When the reaction was complete, the polymers were ground in a mortar and repeatedly washed with deionized water; the washing was ended in 2 h to avoid polymers hydrolysis. Samples were then rinsed with acetone in a Buchner funnel, until finally they were purified in a Soxhlet extractor with acetone for a total time of 24 h. After purification, the polymers were dried in air.
The nanosponges are coded with NSx, where x denotes the molar ratio PMDA/GLU (
Table 1).
2.2. Nanosponges-Derived Carbon Materials
The nanosponges (ca. 3 g) were placed in an alumina boat and then pyrolyzed using a Lenton 1200 tubular furnace. Samples were heated to 800 °C with a heating rate of 10 °C/min under nitrogen or air flow (100 mL/min), treated at 800 °C for 30 min and then cooled to room temperature.
Carbons are coded CharX, where X is the molar ratio PMDA/GLU of the corresponding nanosponge (Char1.5, Char2, Char2.5 and Char3, respectively).
2.3. Characterization Methods
FTIR spectra of the nanosponges were collected in ATR mode by a Perkin–Elmer Spectrum 100. In the typical experiment, 8 scans/spectrum were recorded in the range 4000–650 cm−1 at 4 cm−1 resolution.
Thermogravimetric analysis (TGA) was performed with a TA Instruments Q500 (New Castle, DE, USA) using an alumina pan. Then, 5 mg of nanosponge was heated up to 800 °C with a heating rate of 10 °C/min under nitrogen flow (60 mL/min).
Elemental analysis was performed with a Thermo Scientific FlashEA 1112 analyzer (168 Third Avenue Waltham, MA, USA). A suitable quantity of sample (approximately 2.5 mg for nanosponges, 1 mg for charred materials) and catalyst (V2O5) were loaded in a tin capsule.
Adsorption properties of Char1.5 were tested using MB solution 3.24 ppm. Then, 3 mL of solution and 10 mg of char were loaded in a UV-Vis glass cell and stirred. Spectra were recorded after 15 and 30 min using a Perkin Elmer Lambda 25 UV/Vis Spectrometer (Waltham, MA, USA). Absorbance was recorded at 664 nm, the maximum absorption peak of MB, and MB concentration was calculated by a calibration curve. The percentage of dye removed from the aqueous solution was calculated by the following equation [
26]:
where
C0 and
Ce are the initial and the equilibrium concentrations, respectively. To compare adsorption properties of Char1.5 to a commercial carbon, Carboxen 569 was tested.
N2-adsorption/desorption isotherms were obtained at 77 K on a Micromeritics ASAP 2020 instrument to determine the porosity of the pyrolyzed polymers. Samples were outgassed overnight at 400 °C before analysis. The surface area value (SBET) was calculated by the Brunauer–Emmett–Teller (BET) equation (in the relative pressure range of 0.05–0.25 p/p0). The same range was adopted for SLangmuir evaluation. Total pore volume (VTOT) was determined from the amount of N2 adsorbed at the 0.98 p/p0. Micropore surface area and volume were calculated from N2 adsorption isotherms using the Carbon Black STSA t-plot equation. Mesopore volume (Vmeso) was calculated by subtracting the micropore volume (Vmicro) from the total pore volume (Vtot). The pore size distributions (PSDs) were derived from the N2 adsorption isotherms using a non-negative least squares fitting on the adsorption isotherm data by applying the Density Functional Theory (DFT) method (N2-DFT model, slit geometry) employing the MicroActive Datamaster 5 software (Micromeritics, Norcross, GA, USA).
X-ray diffraction (XRD) patterns of pyrolyzed samples were obtained with a PAN Analytical PW3050/60 X’Pert PRO MPD diffractometer (Malvern, Worcestershire, UK) having a Cu anode and Ni filter by using a Bragg–Brentano configuration. Diffractograms were acquired in the 10° ≤ 2θ ≤ 60° interval with an acquisition step of 0.02°. Samples were ground before analysis.
Raman spectra were acquired using a Renishaw inVia Raman Microscope spectrometer (Wotton-under-Edge, Gloucestershire, UK), equipped with a 20× objective and 785 nm, 514 nm and 442 nm laser lines. The laser power was minimized (i.e., 1% or 5%) during the acquisition to avoid damaging the sample.
High-resolution transmission electron microscopy (HRTEM) images were obtained with a JEOL 3010-UHR HRTEM microscope (Musashino Akishima, Japan) operating at 200 kV with a point-to-point resolution of 0.12 nm, equipped with 2 k × 2 k pixels Gatan US1000 CCD camera (Pleasanton, CA, USA). Only thin regions extending over the support holes film were imaged.
3. Results and Discussion
Four nanosponges were synthesized by reacting PMDA with GLU in different molar ratios (1.5:1, 2:1, 2.5:1 and 3:1). As network polymers are insoluble in all solvents, solubility tests of the nanosponges were carried out in water and organic solvents (DMSO, N,N-dimethylformamide, ethanol) to verify their crosslinked structure. As expected, all of the nanosponges were found to be insoluble.
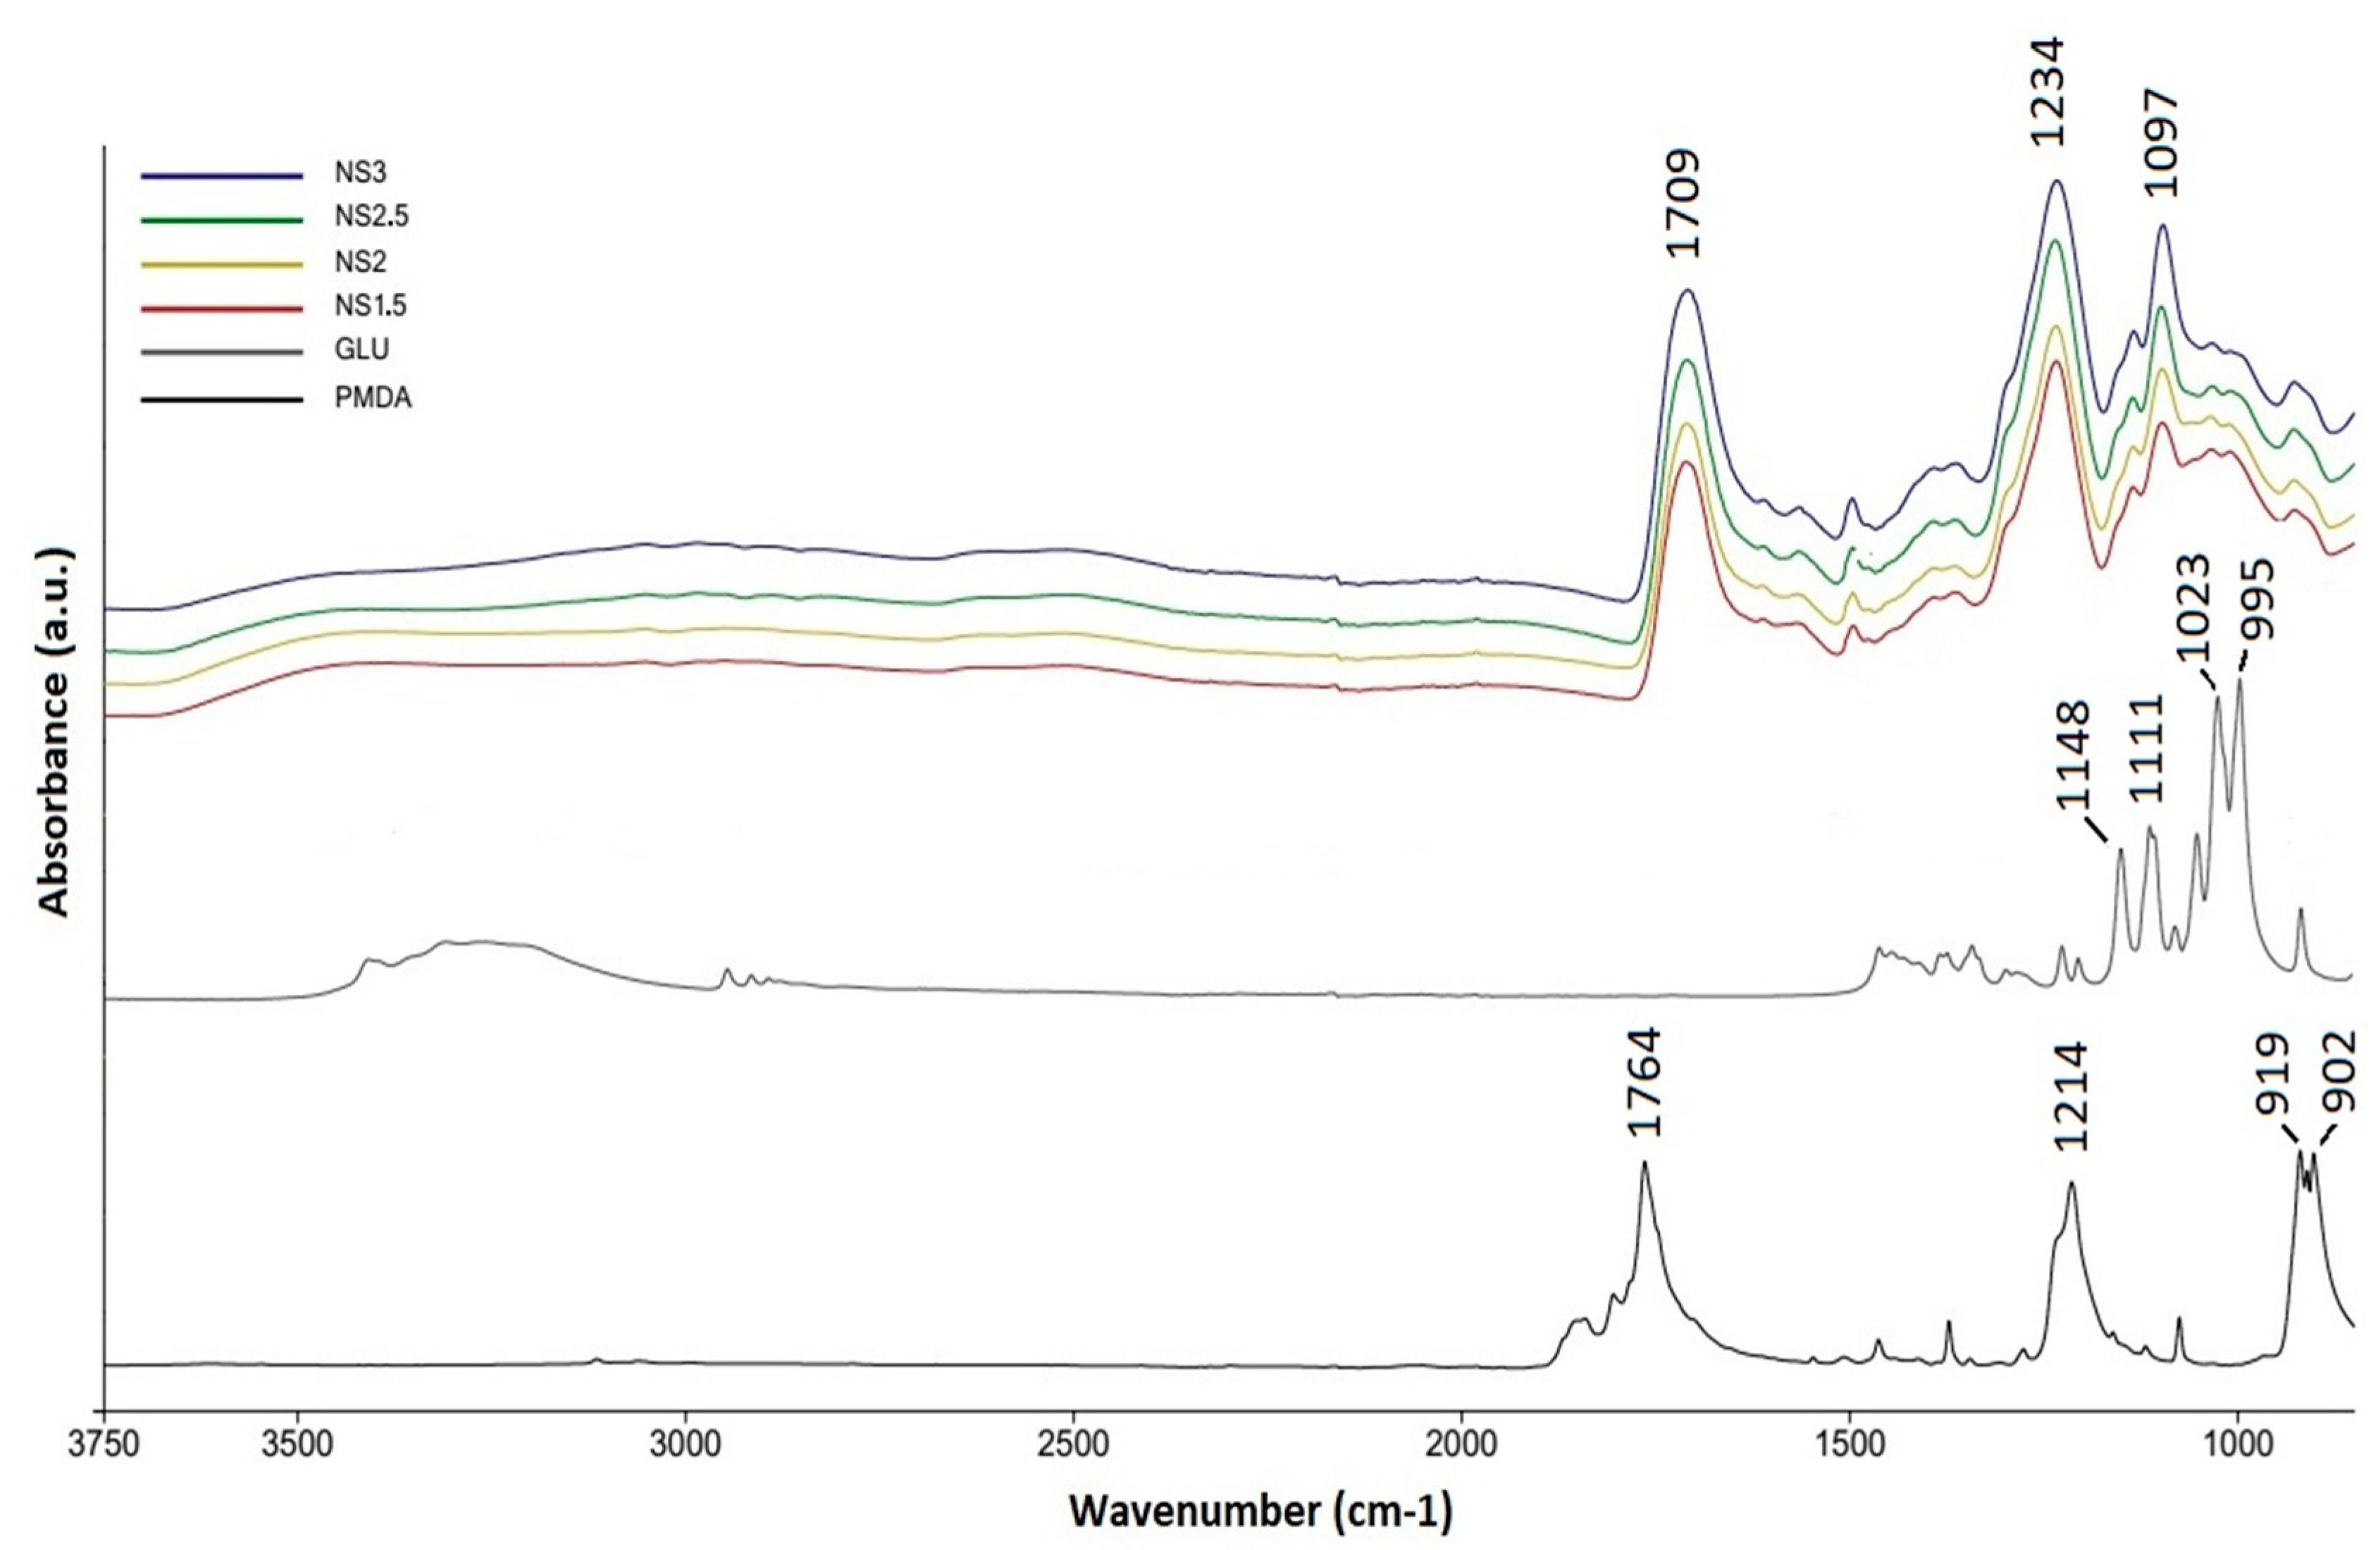
The reaction between PMDA and GLU generates ester and acidic groups, and the FTIR technique can confirm polymerization occurred. FTIR spectra of the nanosponges and the two precursors are compared in
Figure 1.
The FTIR spectra of the synthesized nanosponges show an absorption band near 1709 cm
−1. This signal assigned to υ (C=O) is shifted to a lower frequency compared to that of the anhydride (1770 cm
−1) [
27], due to the convolution of ester and carboxylic group vibrational modes [
28]. Furthermore, the peaks at 1234 cm−1 and 1097 cm
−1 are mainly due to symmetric and asymmetric υ (C–O) of ester groups [
29]. On the contrary, the ATR spectrum of PMDA showed very strong absorption bands at 1764 cm−1 and 919 cm
−1, assigned, respectively, to υ (C=O) and υ (C–O) of the five-membered rings [
29], while the GLU spectrum exhibited a broad band in the 3000–3500 cm
−1 range due to υ (O–H) of hydroxyl groups, and signals in the region of an 800–1200 cm
−1 interval originate from coupling of stretching and bending vibrations of C–O and C–C bonds [
30].
Elemental analysis (
Table 2) states the presence of TEA (column 2) in the nanosponges, indicating that the catalyst partially salified the acidic groups of PMDA, formed after ring opening.
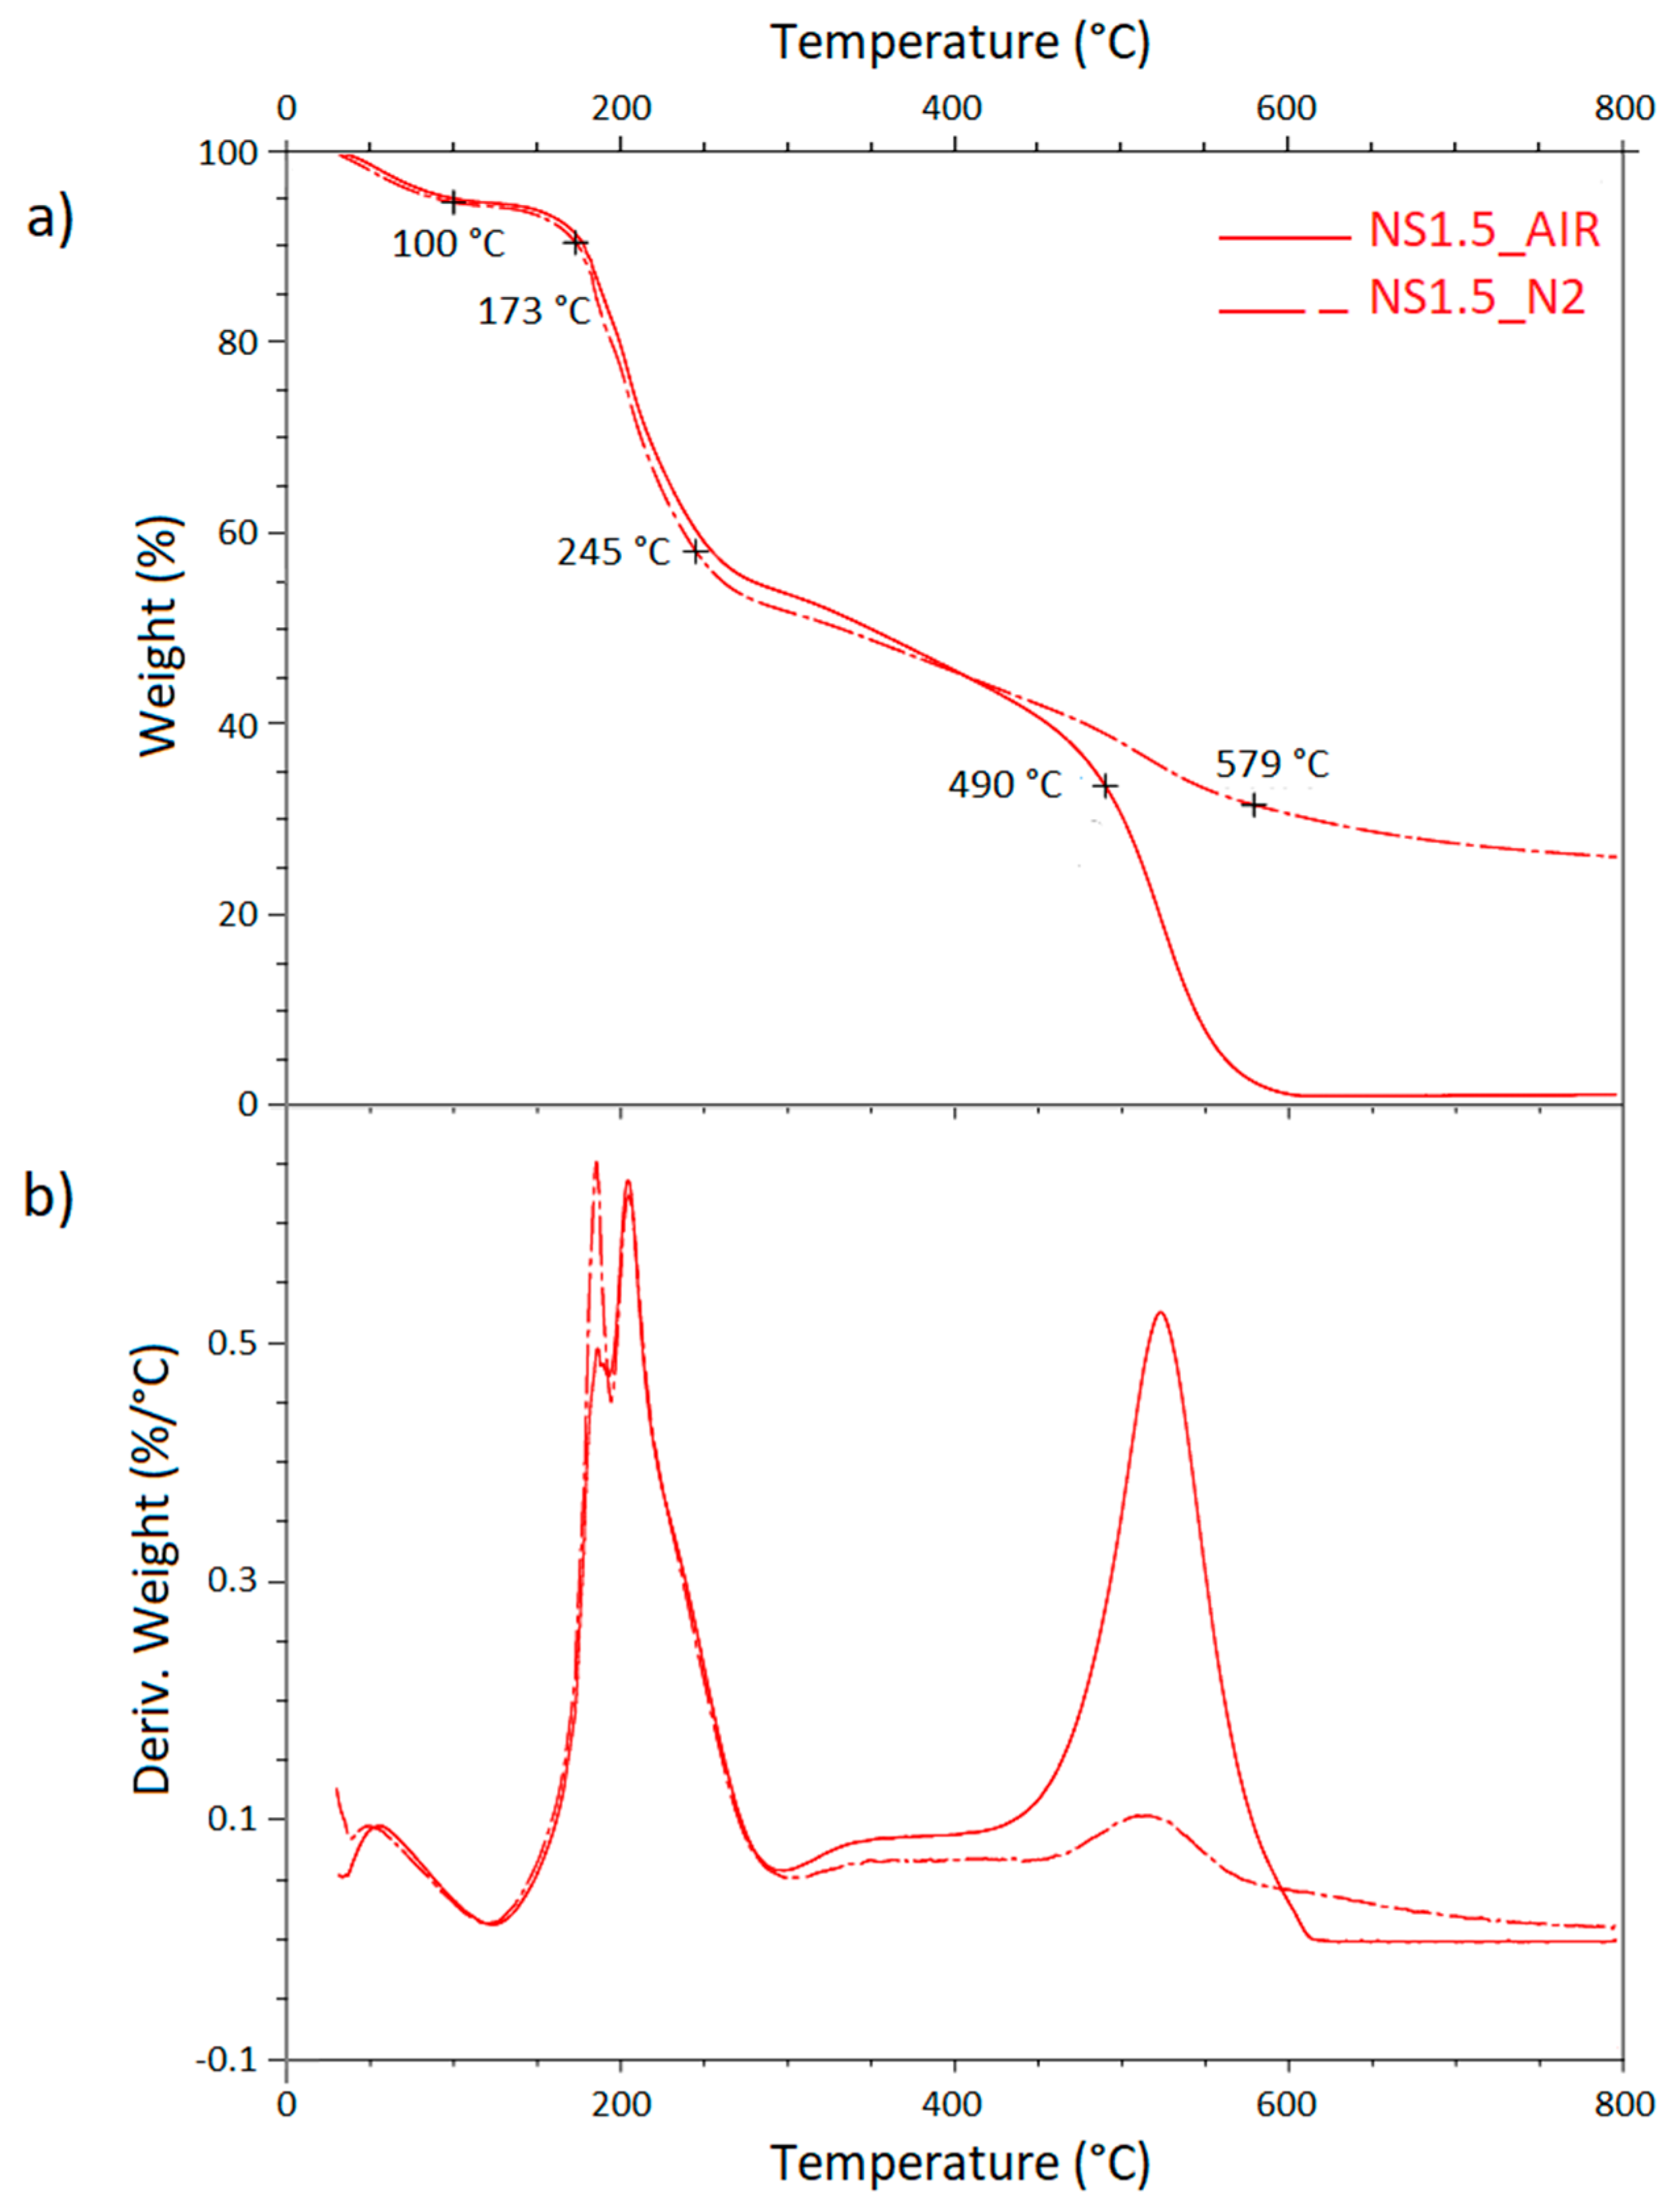
In these figures, the thermograms obtained in nitrogen and air appear to be very similar up to about 250 °C, but above this temperature samples are more stable in nitrogen.
Degradation in nitrogen (
Figure 2) occurs in four steps, and the onset and offset degradation temperatures are calculated drawing tangents to the curves. The first weight loss (from room temperature to 100 °C) is associated with evaporation of moisture and varies from sample to sample (
Figure S1,
Supplementary Data). The second (173–245 °C) and the third (245–579 °C) steps are due to volatilization; NS1.5 loses, at 245 °C and 579 °C, respectively, 42% and 68% of the initial weight. During volatilization, heat promotes bond cleavage, at lower temperatures (second step) cleavage involves less energetic bonds than those broken at higher temperatures (third step).
In the last stage (579–800 °C) there is a broad weight loss related to char rearrangement with a final yield in carbon (
Table 3) of 20–30 wt%. It is noteworthy that pyrolysis of the synthesized polymers is proceeded by two competitive processes (volatilization and char formation) and the residue at 800 °C is higher than that obtained from its precursors, the glucose and PMDA (
Figure S2,
Supplementary Data), suggesting that polymer promotes the carbonization during the pyrolysis process [
18].
The degradation of NS1.5 in the presence of oxidant gas (
Figure 2, solid line) occurs similarly to the degradation in inert gas (
Figure 2, dotted line) up to 400 °C; indeed, solid and dotted curves overlap from room temperature up to about 400 °C. Above this temperature, NS1.5 is more stable in nitrogen: oxygen burns completely the char formed during thermal degradation, not leaving any residue at 600 °C.
Char obtained at 800 °C are made essentially of carbon, however a small amount of N is detected in the carbon residue (column 2 in
Table 4). This N belongs to TEA; during the pyrolysis TEA decomposes, producing N-containing volatile products, however degradation is not complete and/or non-volatile nitrogen-based products are formed as confirmed by the small amount of N in Char1.5 (1.4% against 4.3% calculated).
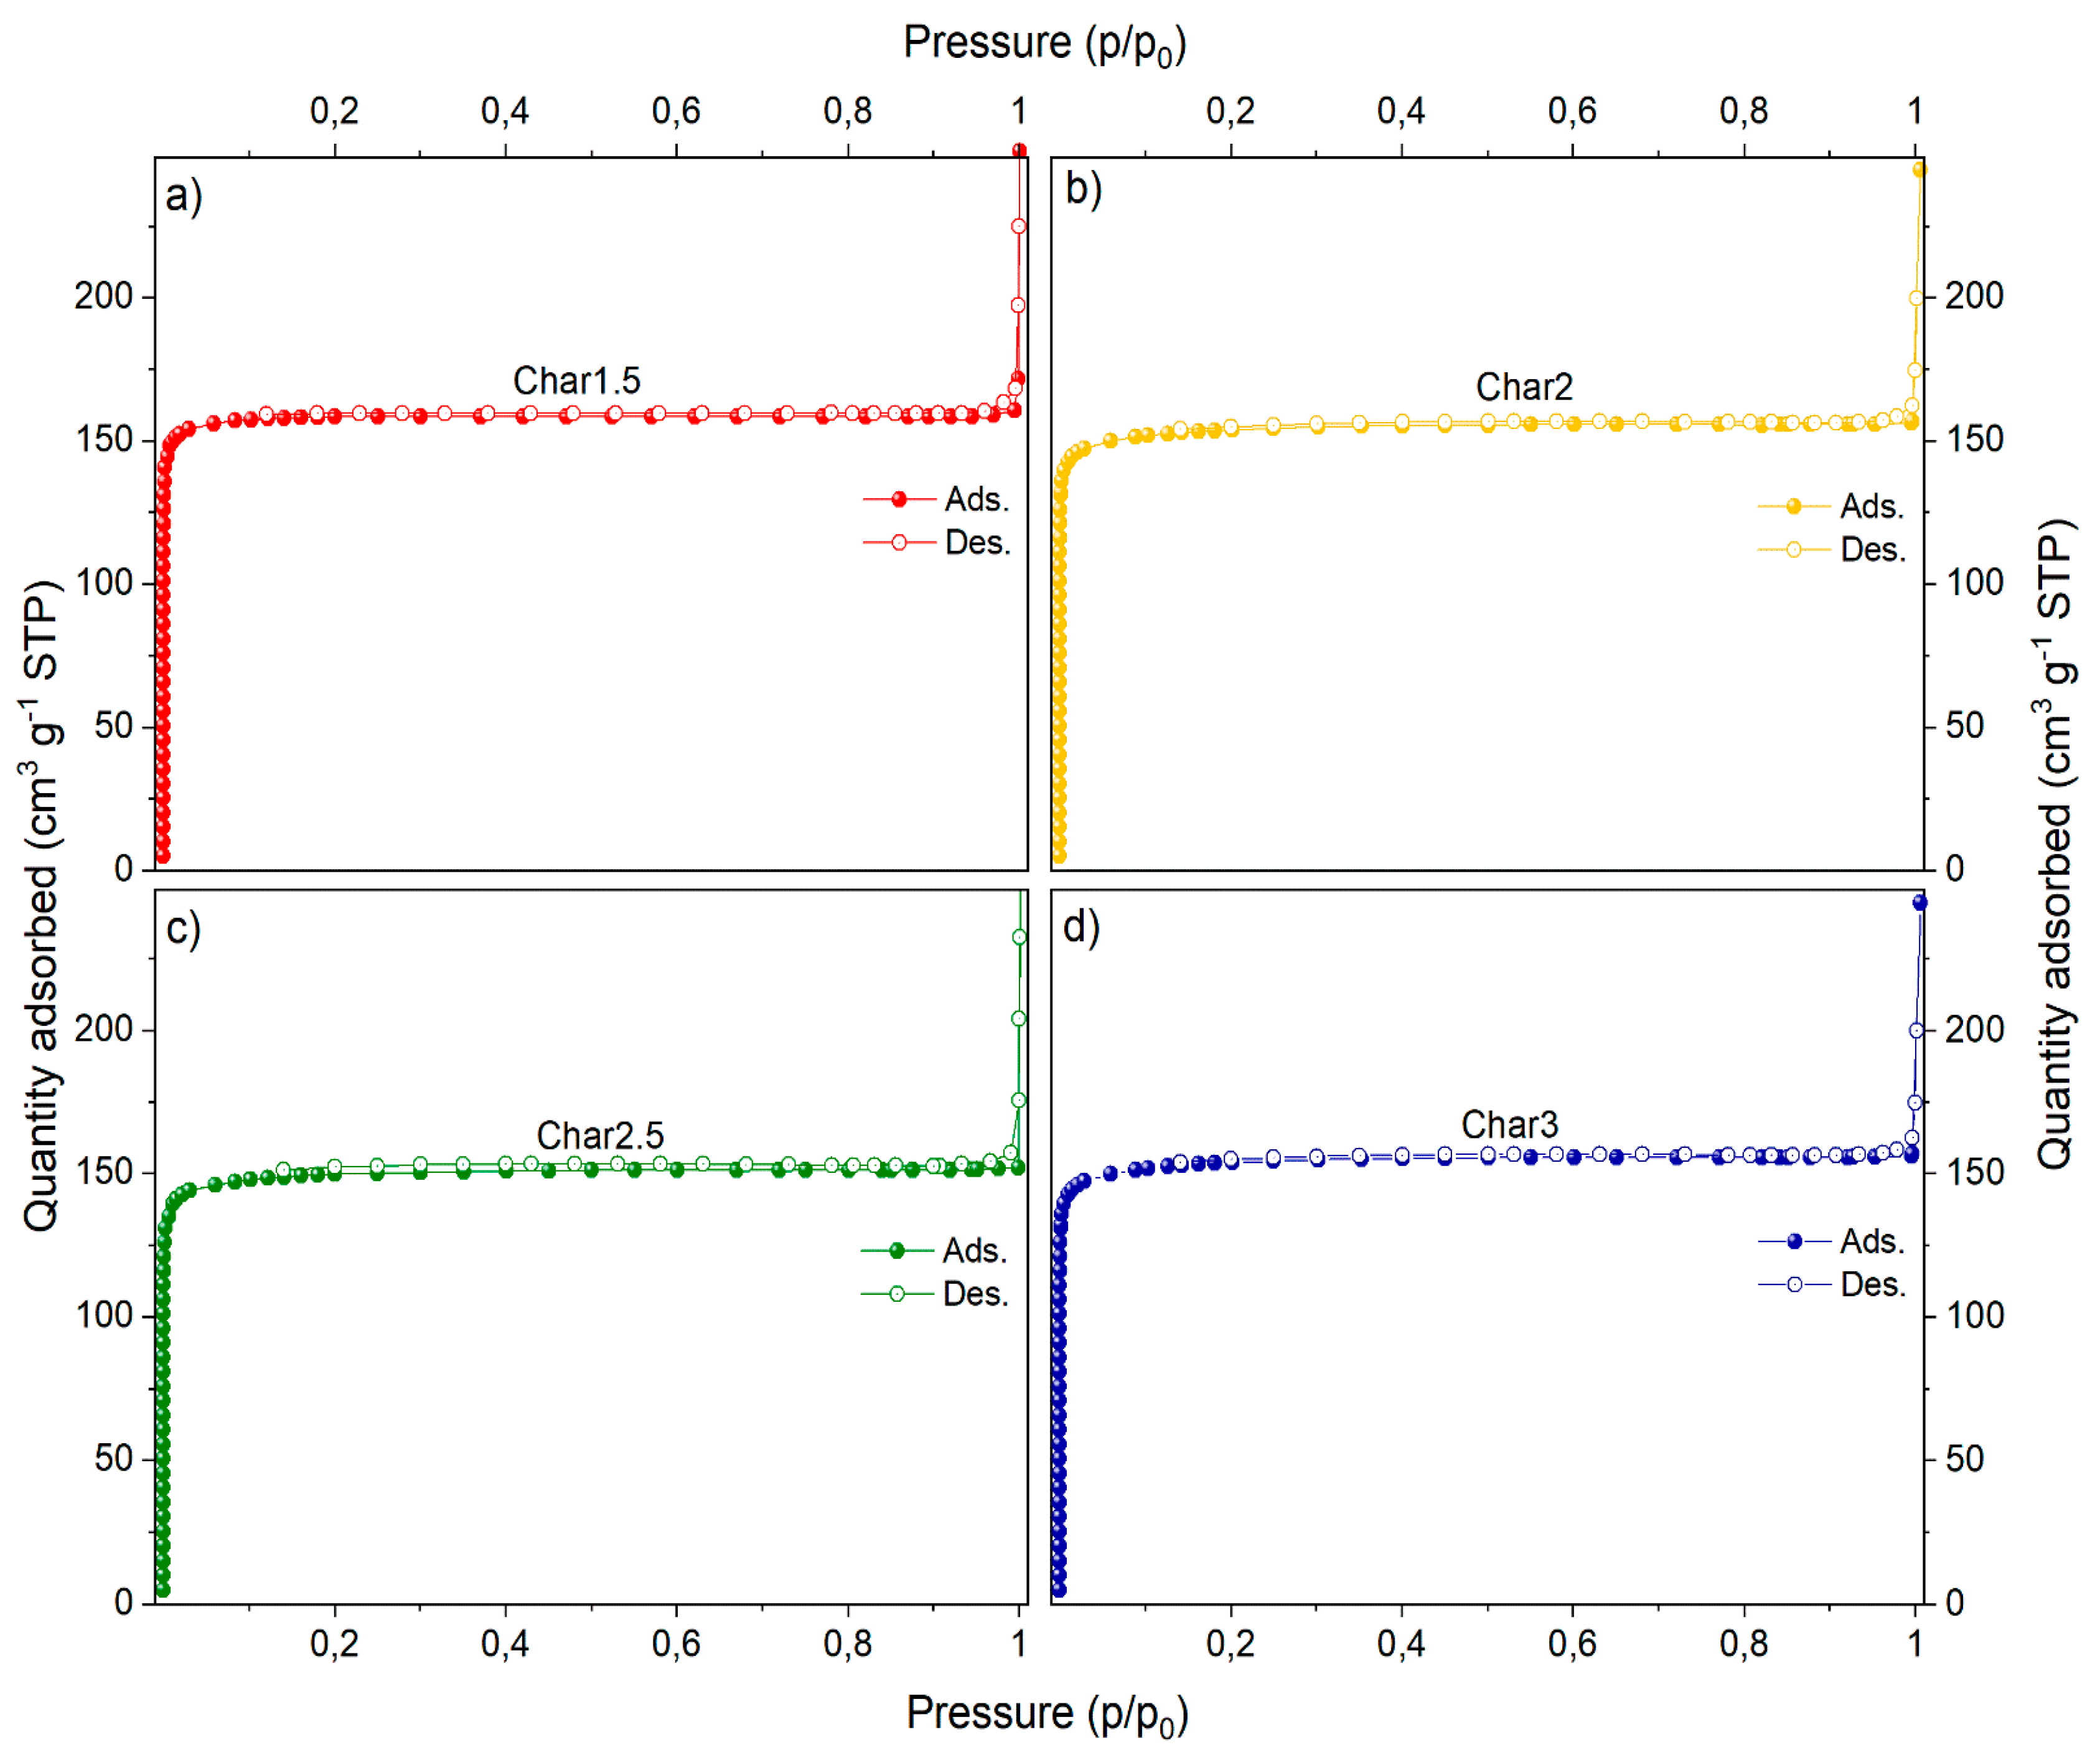
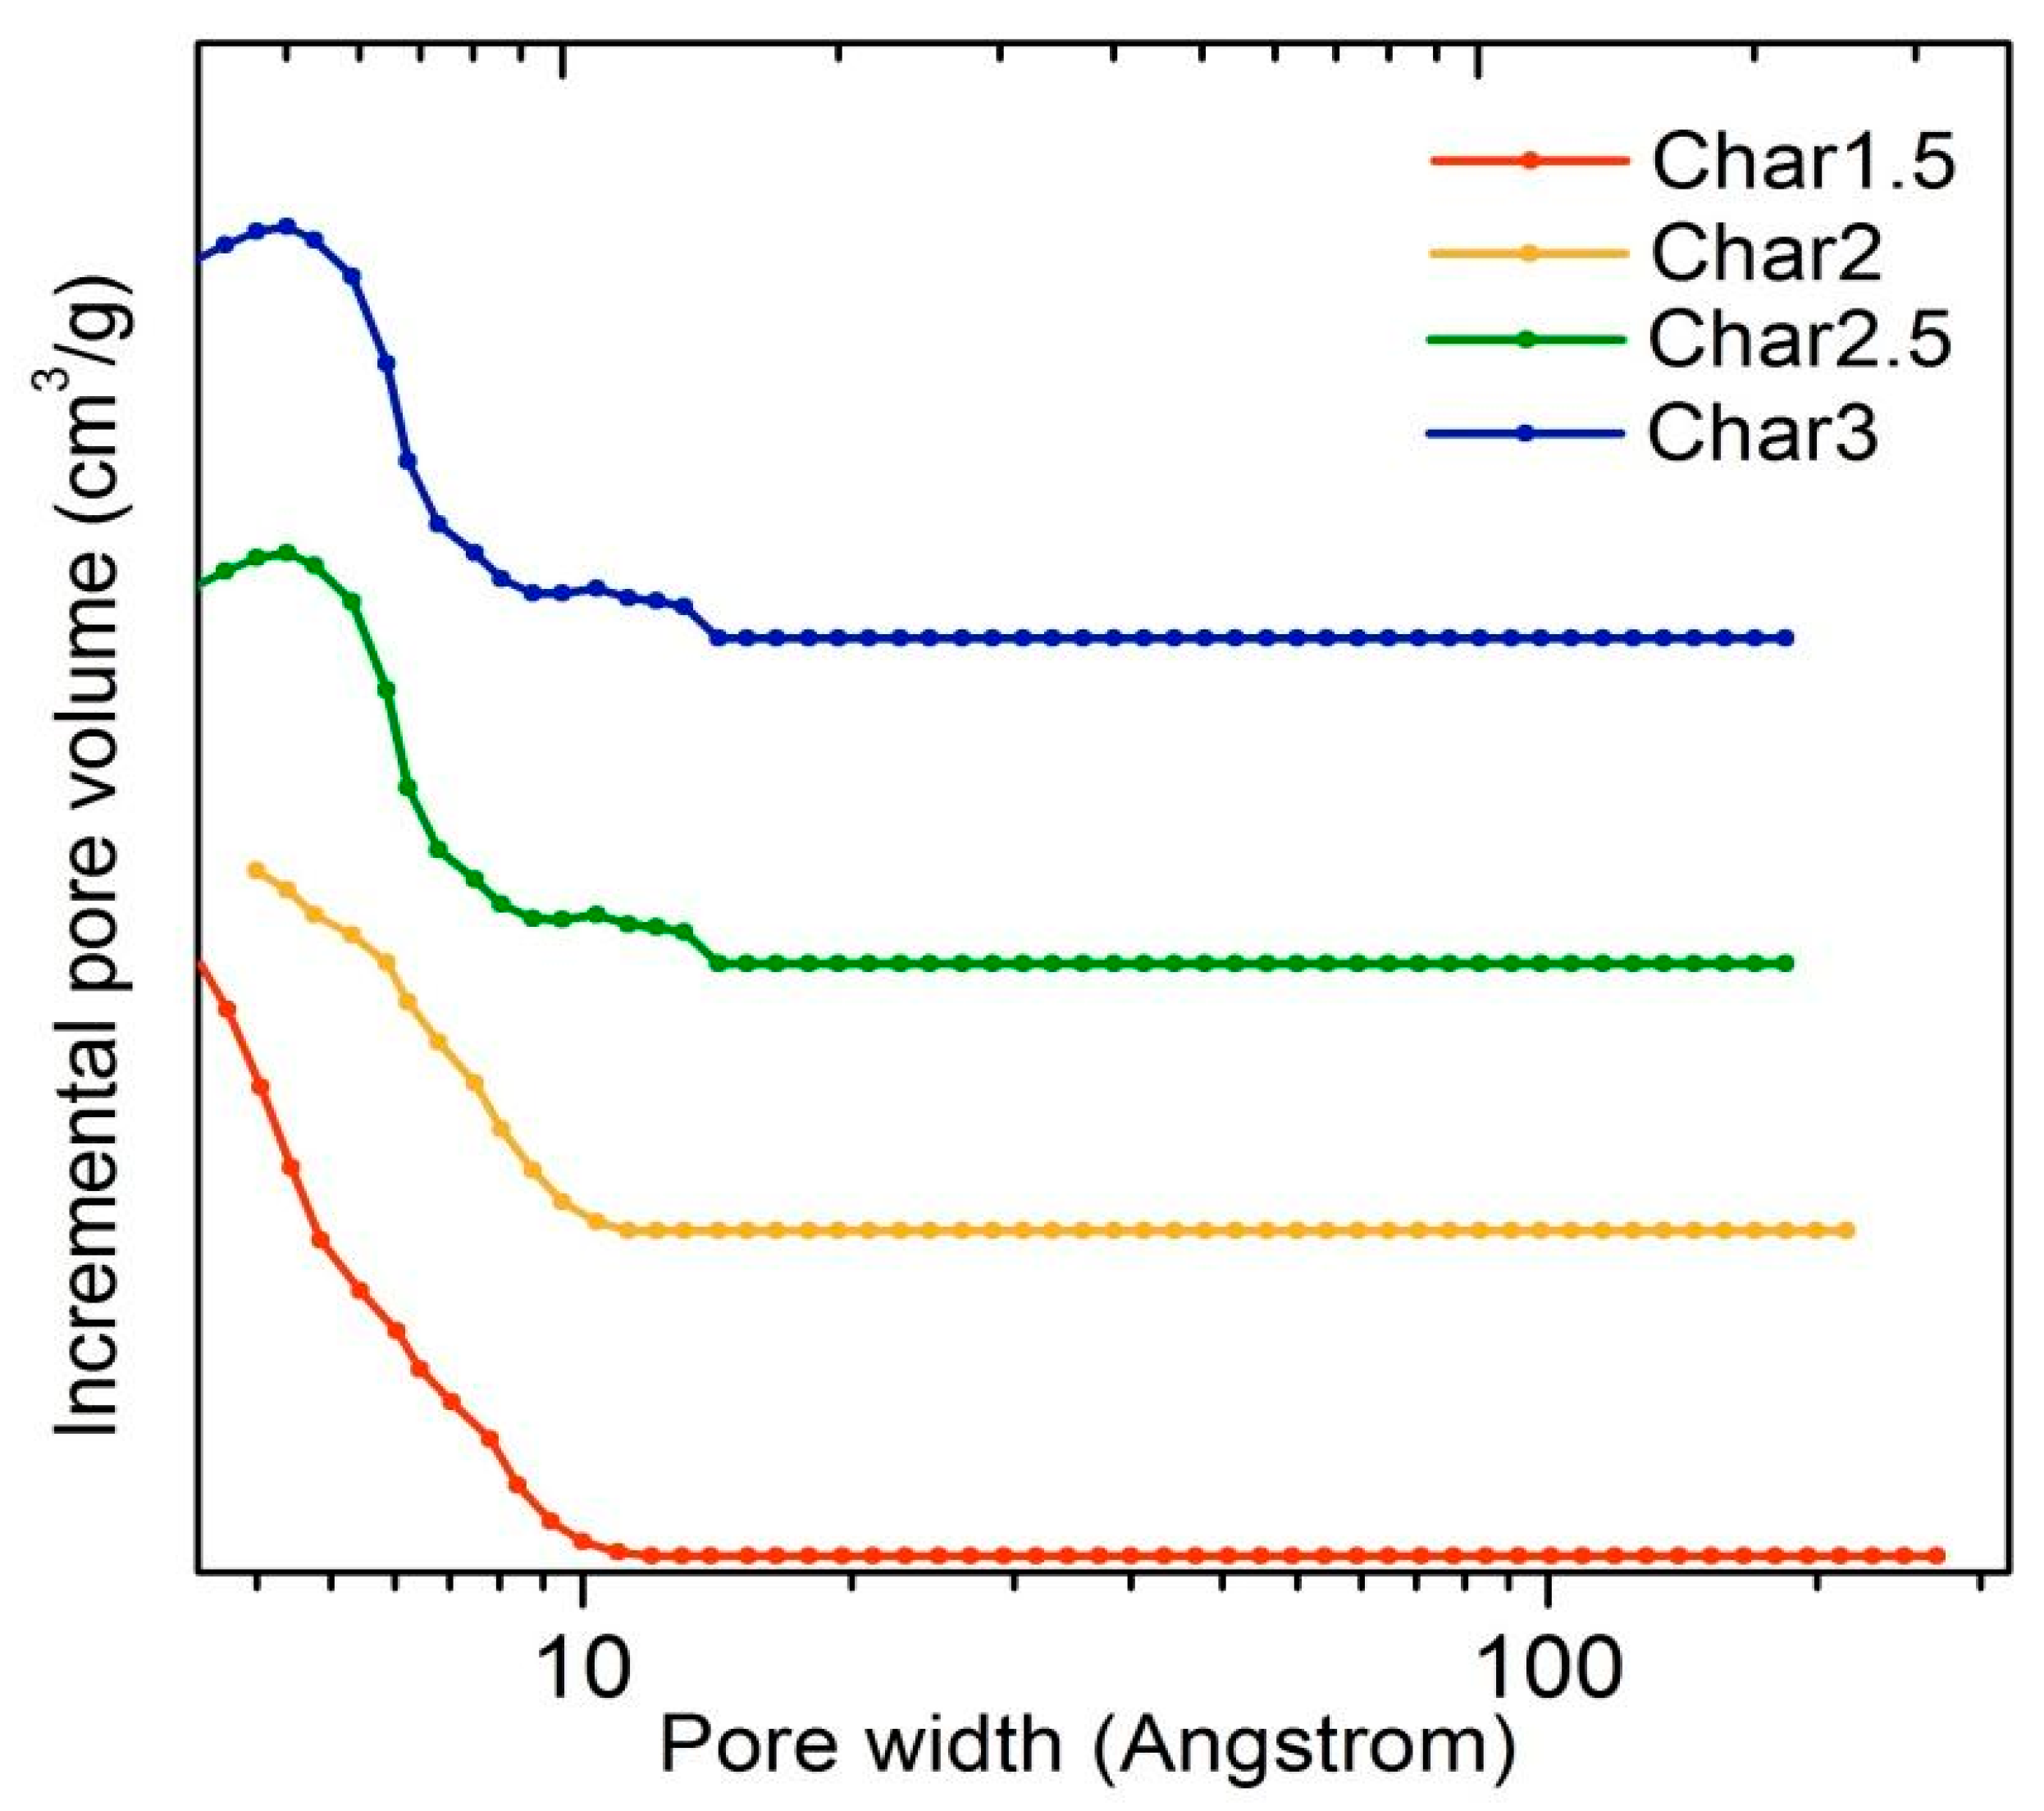
The N
2 adsorption/desorption isotherms and pore size distributions of the nanosponges pyrolyzed at 800 °C and from different PMDA/GLU molar ratios (1.5, 2, 2.5 and 3) are shown in
Figure 3 and
Figure 4, while the porosity properties are summarized in
Table 5.
All of the pyrolyzed nanosponges show a type-I isotherm with a rectangular shape and an elongated horizontal slope that can be associated with the presence of narrow micropores. The relatively low uptake of N
2 also indicates a relatively small volume generated during the pyrolysis step, and the micropore size is smaller than about 10 Å. The presence of micropores inaccessible to N
2 gas cannot be ruled out. However, the surface area could be further increased with physical (vapor, air or other gas) or with chemical activating agents [
31,
32]. It is worth mentioning that the porous texture of the pyrolyzed nanosponges was not remarkably affected by the different PMDA/GLU molar ratios. Moreover, the data are fully consistent with TEM images and with porosity properties of glucose, sucrose and lactose carbonized at similar temperatures [
33,
34,
35].
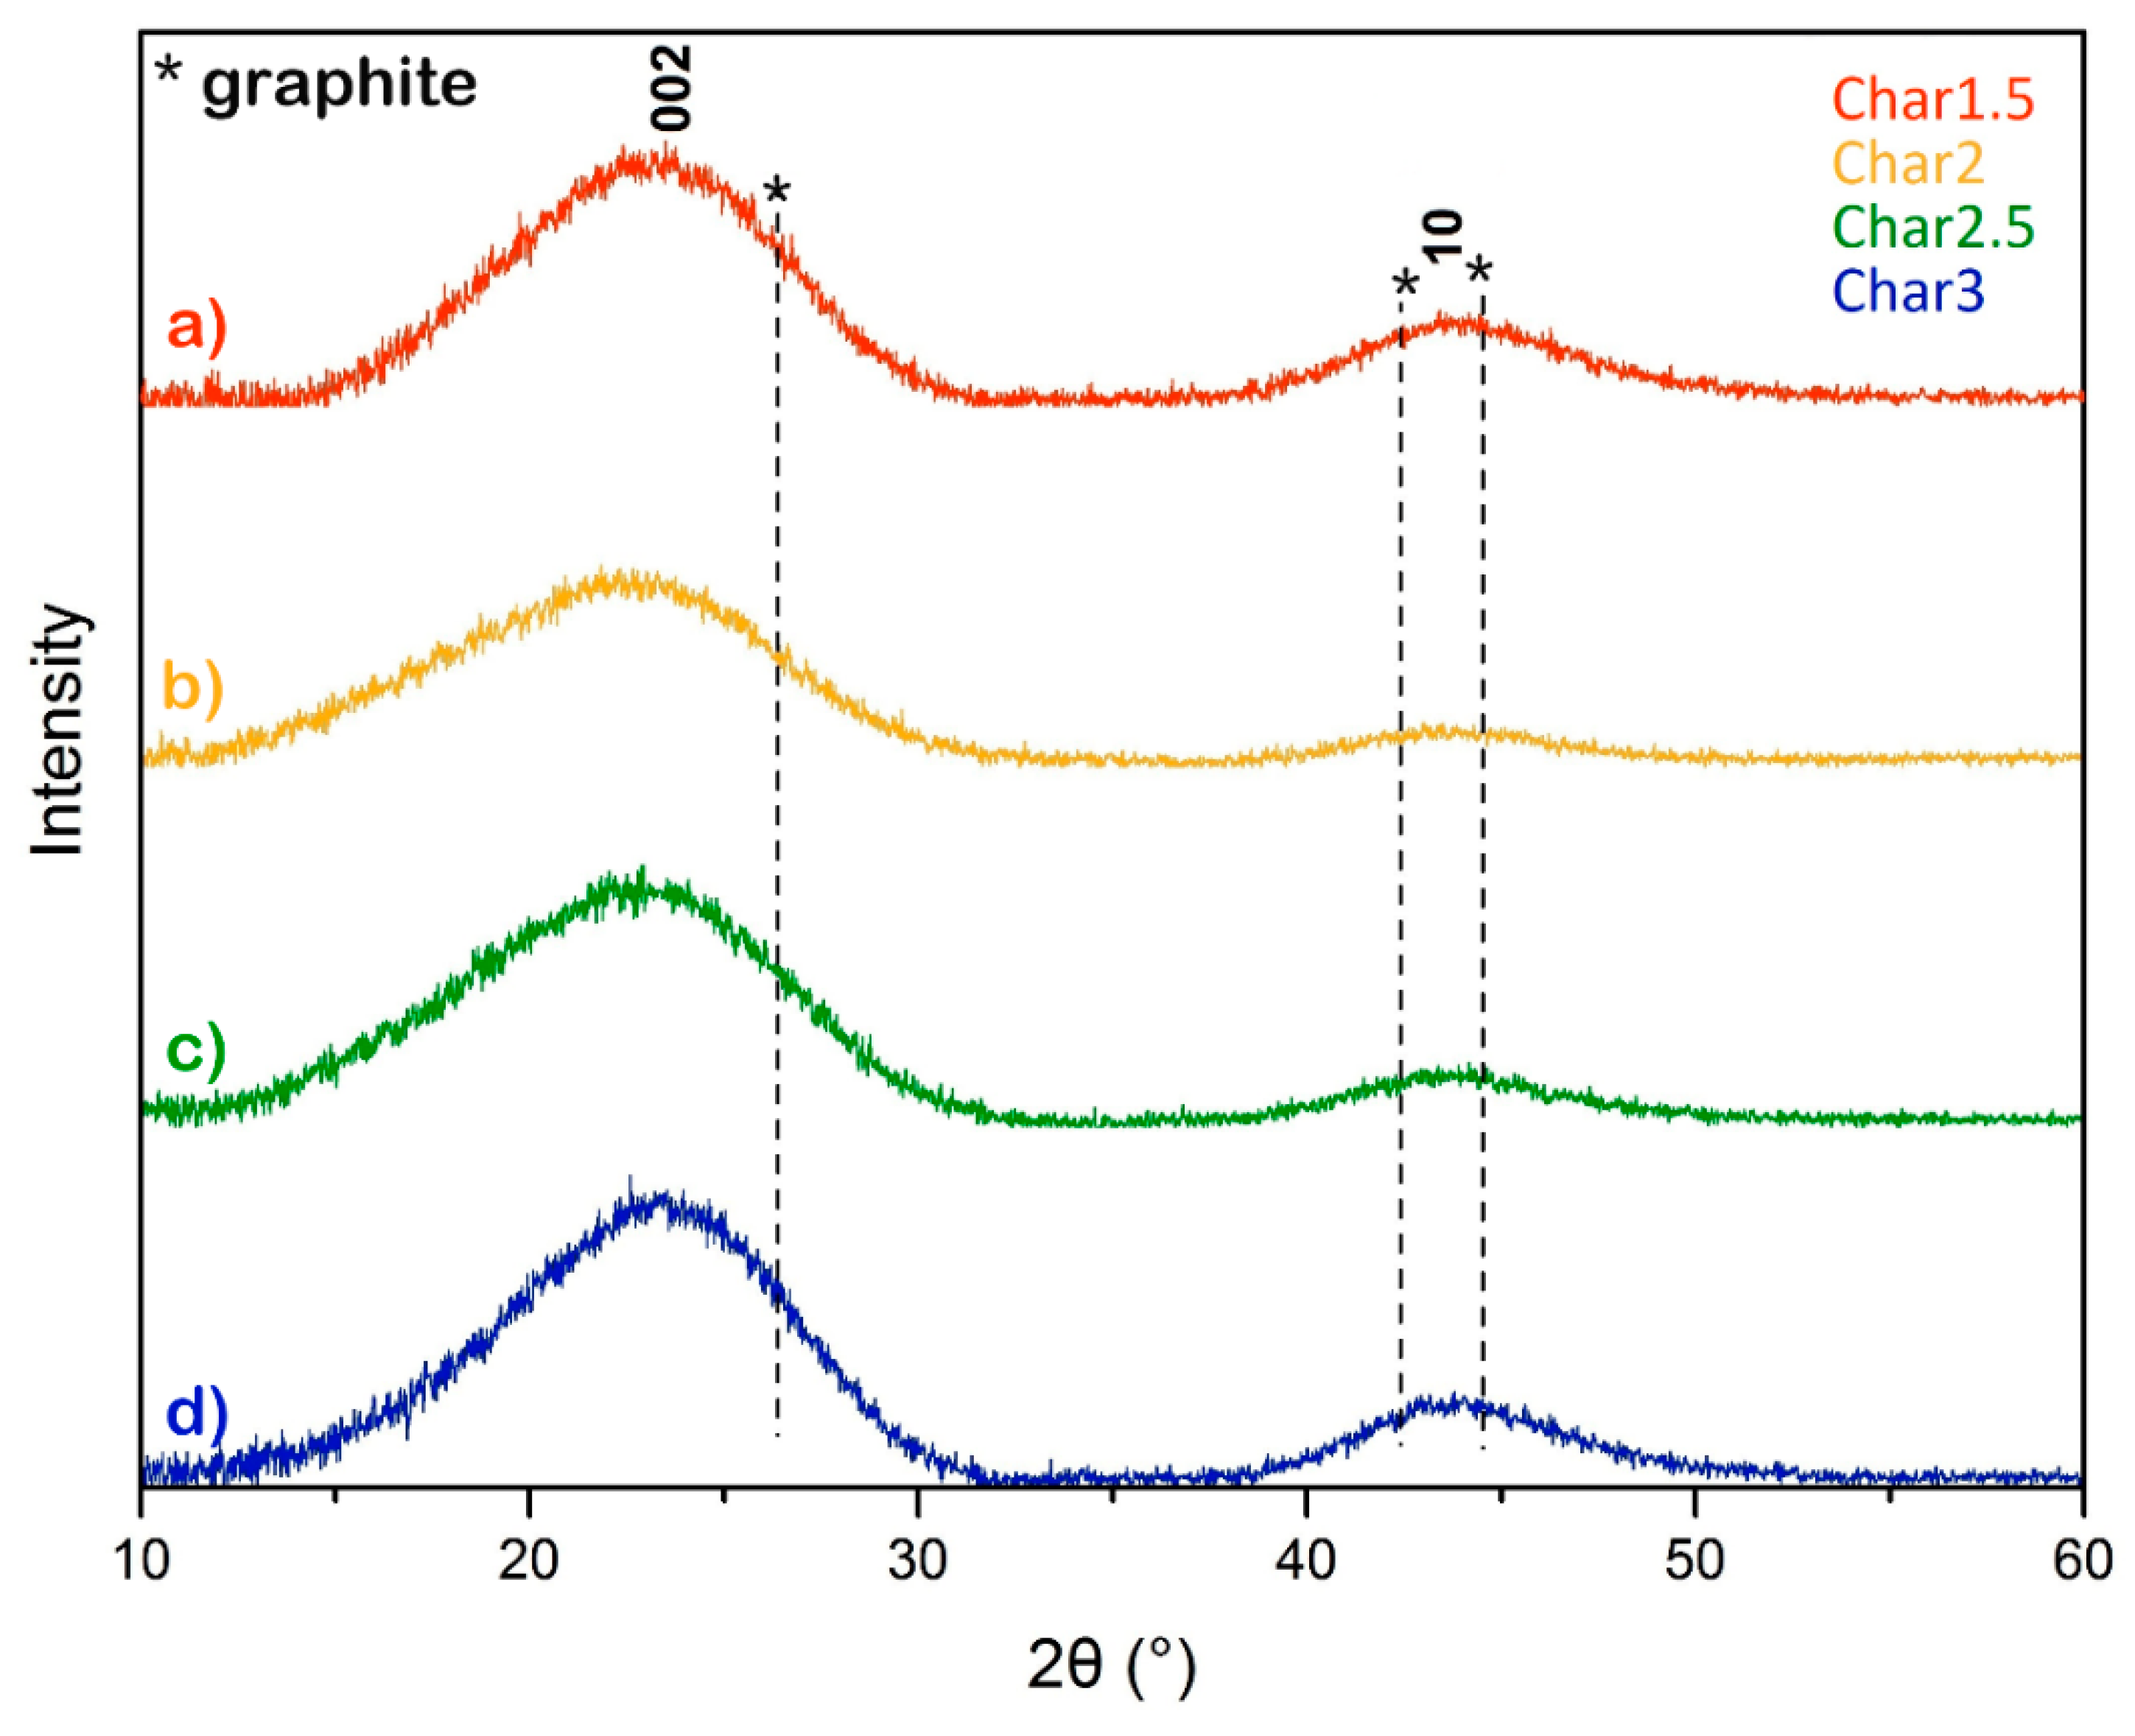
XRD patterns of the pyrolyzed nanosponges are shown in
Figure 5.
These XRD patterns exhibit wide diffraction peaks with maxima at about 2θ–23° and 44°, which can be associated with the (002) and with the convolution of (100)/(101) reflections (the so-called 10 band) [
36], respectively. The presence of broad peaks located near the positions of the XRD graphite planes (marked with asterisks in
Figure 5) corroborates the very low crystallinity of the carbons obtained from nanosponges after thermal treatment at 800 °C, as confirmed also by the small crystalline domain sizes along the c-axis (
Lc) of about 0.8 nm estimated by Scherrer equations applied to the full-width-at-half-maximum (FWHM) of the (002) sp
2-C diffraction peak. Furthermore, the mean interlayer distance d
002 corresponds to 0.39 nm for all carbon materials. From this observation, we can remark that the larger interlayer distance nearly corresponds to what was observed in the TEM images, and it is considerably larger than that of graphite [
34,
36].
As the pyrolyzed nanosponges obtained from different amounts of PMDA and GLU present similar porosity, composition and texture properties as evidenced by TGA, XRD, N2 adsorption/desorption isotherms at 77 K, TEM and Raman investigations were performed only on a selection of samples.
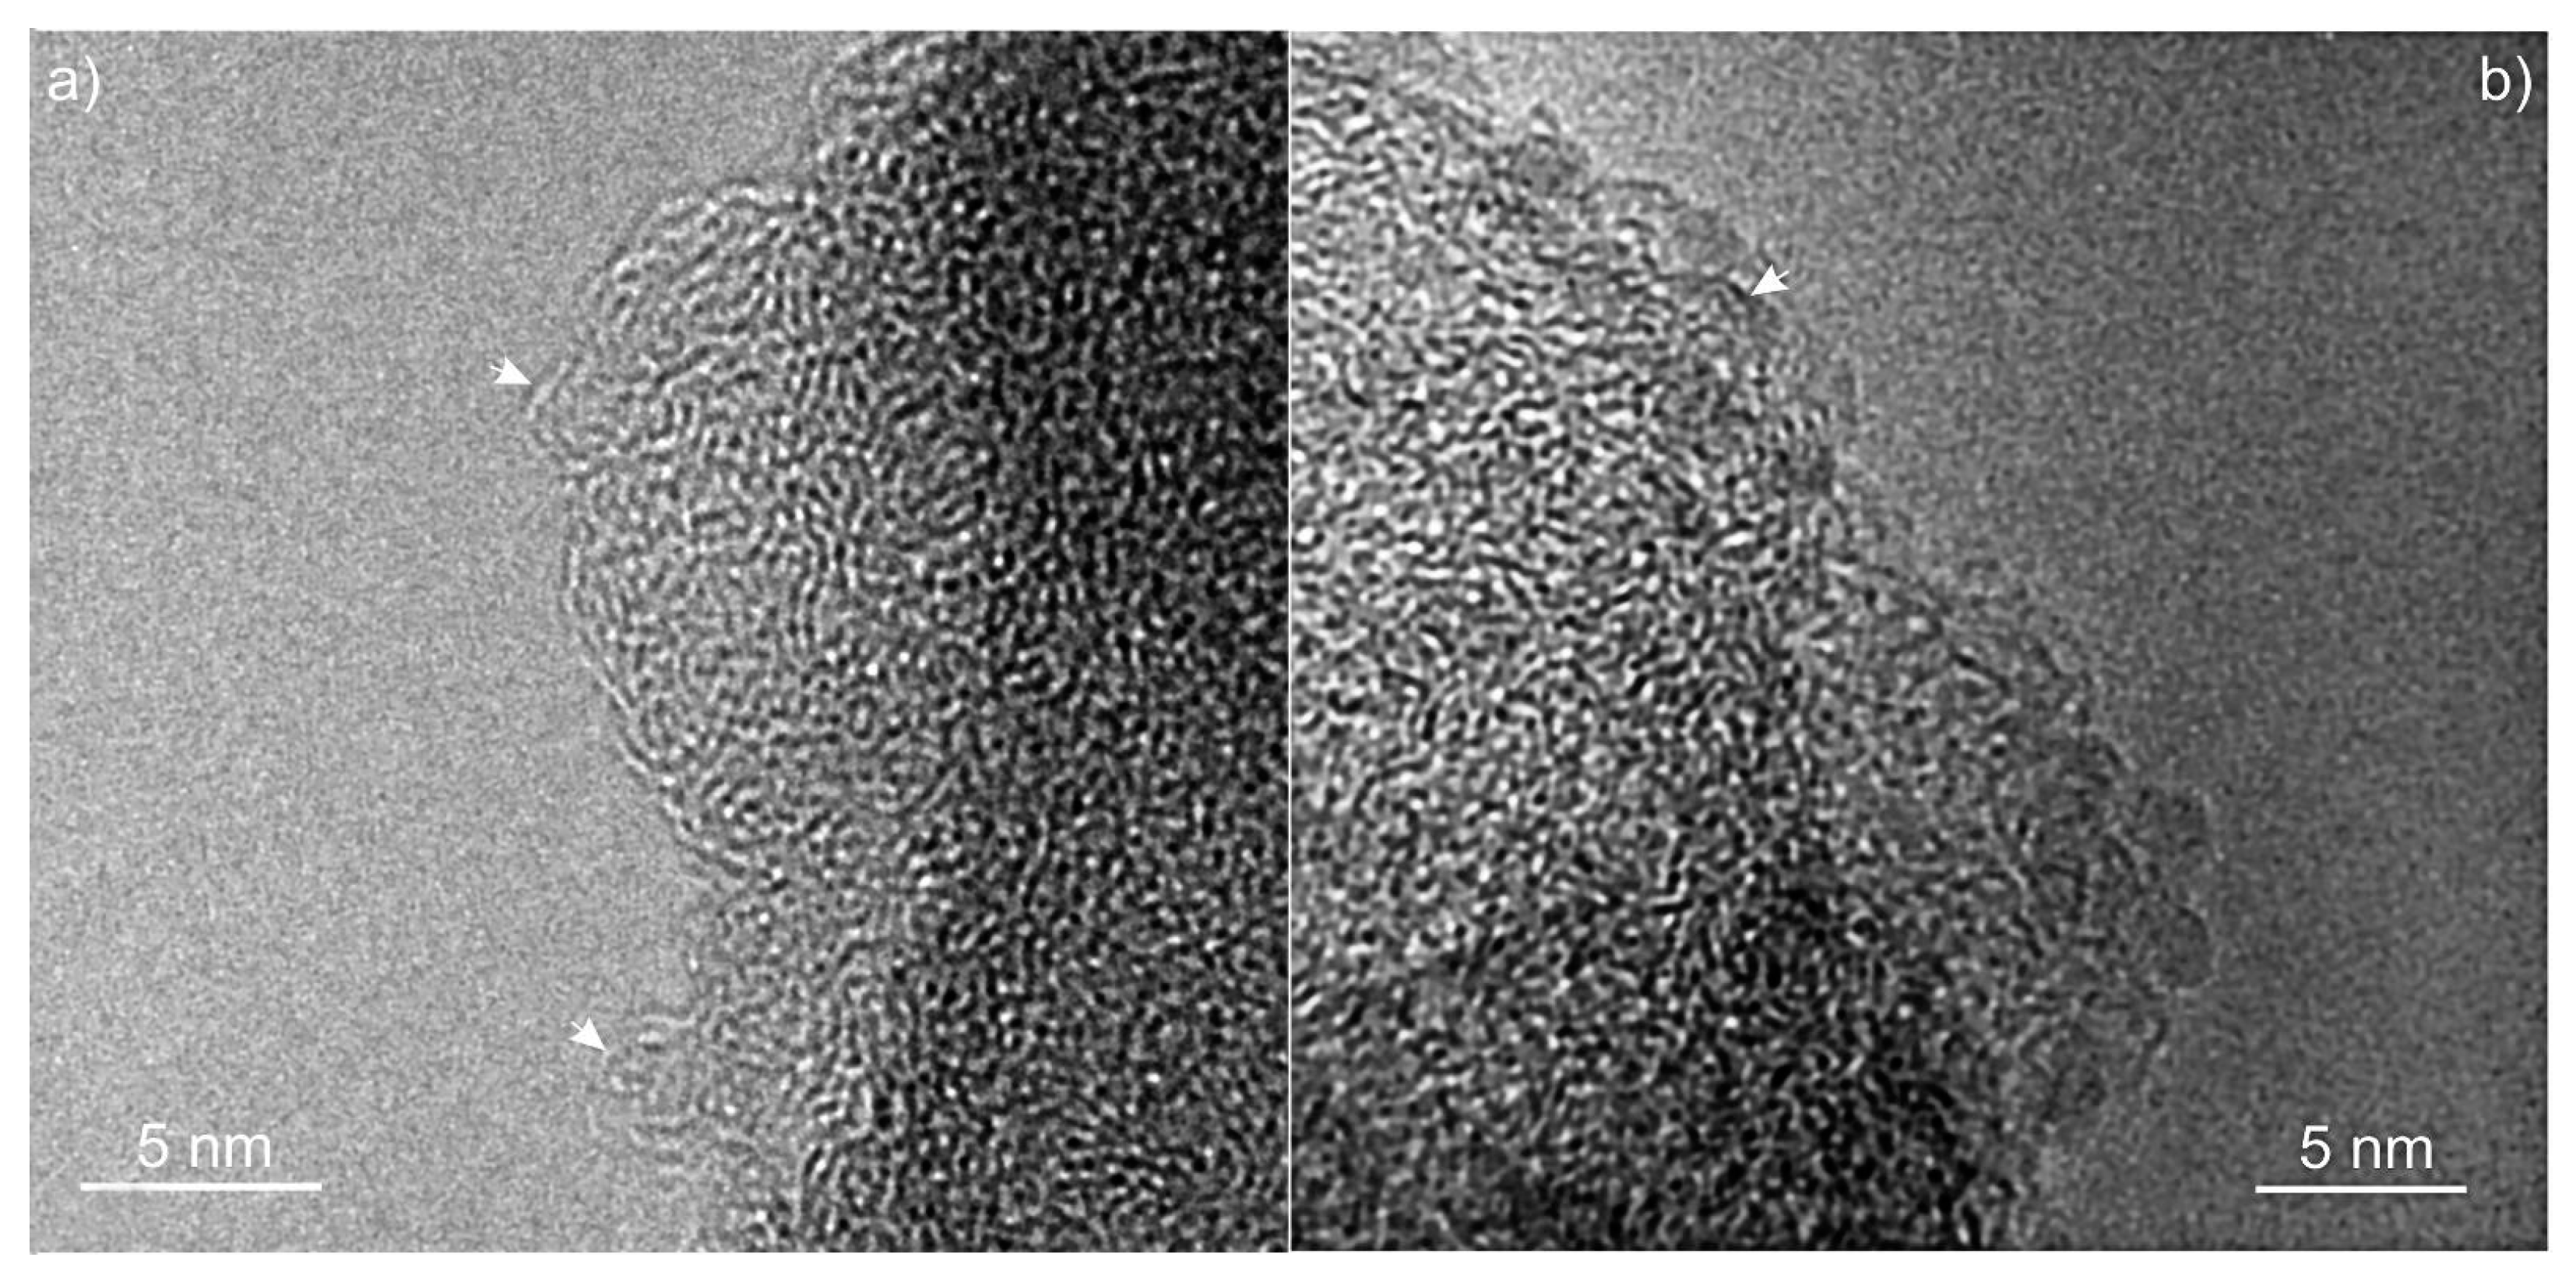
In
Figure 6, the structure of Char1.5 and Char2.5 is illustrated. In these high-resolution images, dark regions represent the carbon sheets oriented nearly parallel to the direction of the electron beam. These disordered structures consist of tightly curled single atomic layers of carbon atoms enclosing micropores in the sub-nanometer scale range, typically observed for non-graphitizing carbons, called glassy carbons or hard carbons. The absence of interference fringes arranged with a high degree of alignment corroborates the hypothesis of a structure with no crystalline order. The isotropic and disordered arrangement is confirmed by the presence of broadly diffused diffraction rings in the diffraction pattern [
37]. The interlayer spacings are found to be ca. 4–5 Å in the regions where an onion-like arrangement of layers is visible (see arrows in
Figure 6). Such layer separation distance, typical of glassy carbons [
38], is considerably larger than what is observed for graphite along the c direction (3.4 Å). The separation between adjacent sheets is irregular due to the curvature, crosslinking and interconnections of fragments across multiple planes [
37,
38]. Other authors assign this microporosity to slit-like pores with a ribbon structure [
36]. The length of linear planes appears to be as low as 1–2 nm. A similar texture can be observed for carbons obtained from pure glucose treated at a similar carbonization temperature [
34,
36,
39]. It is difficult to gain more structural indications from our images due to the limited contrast, even in the thin regions.
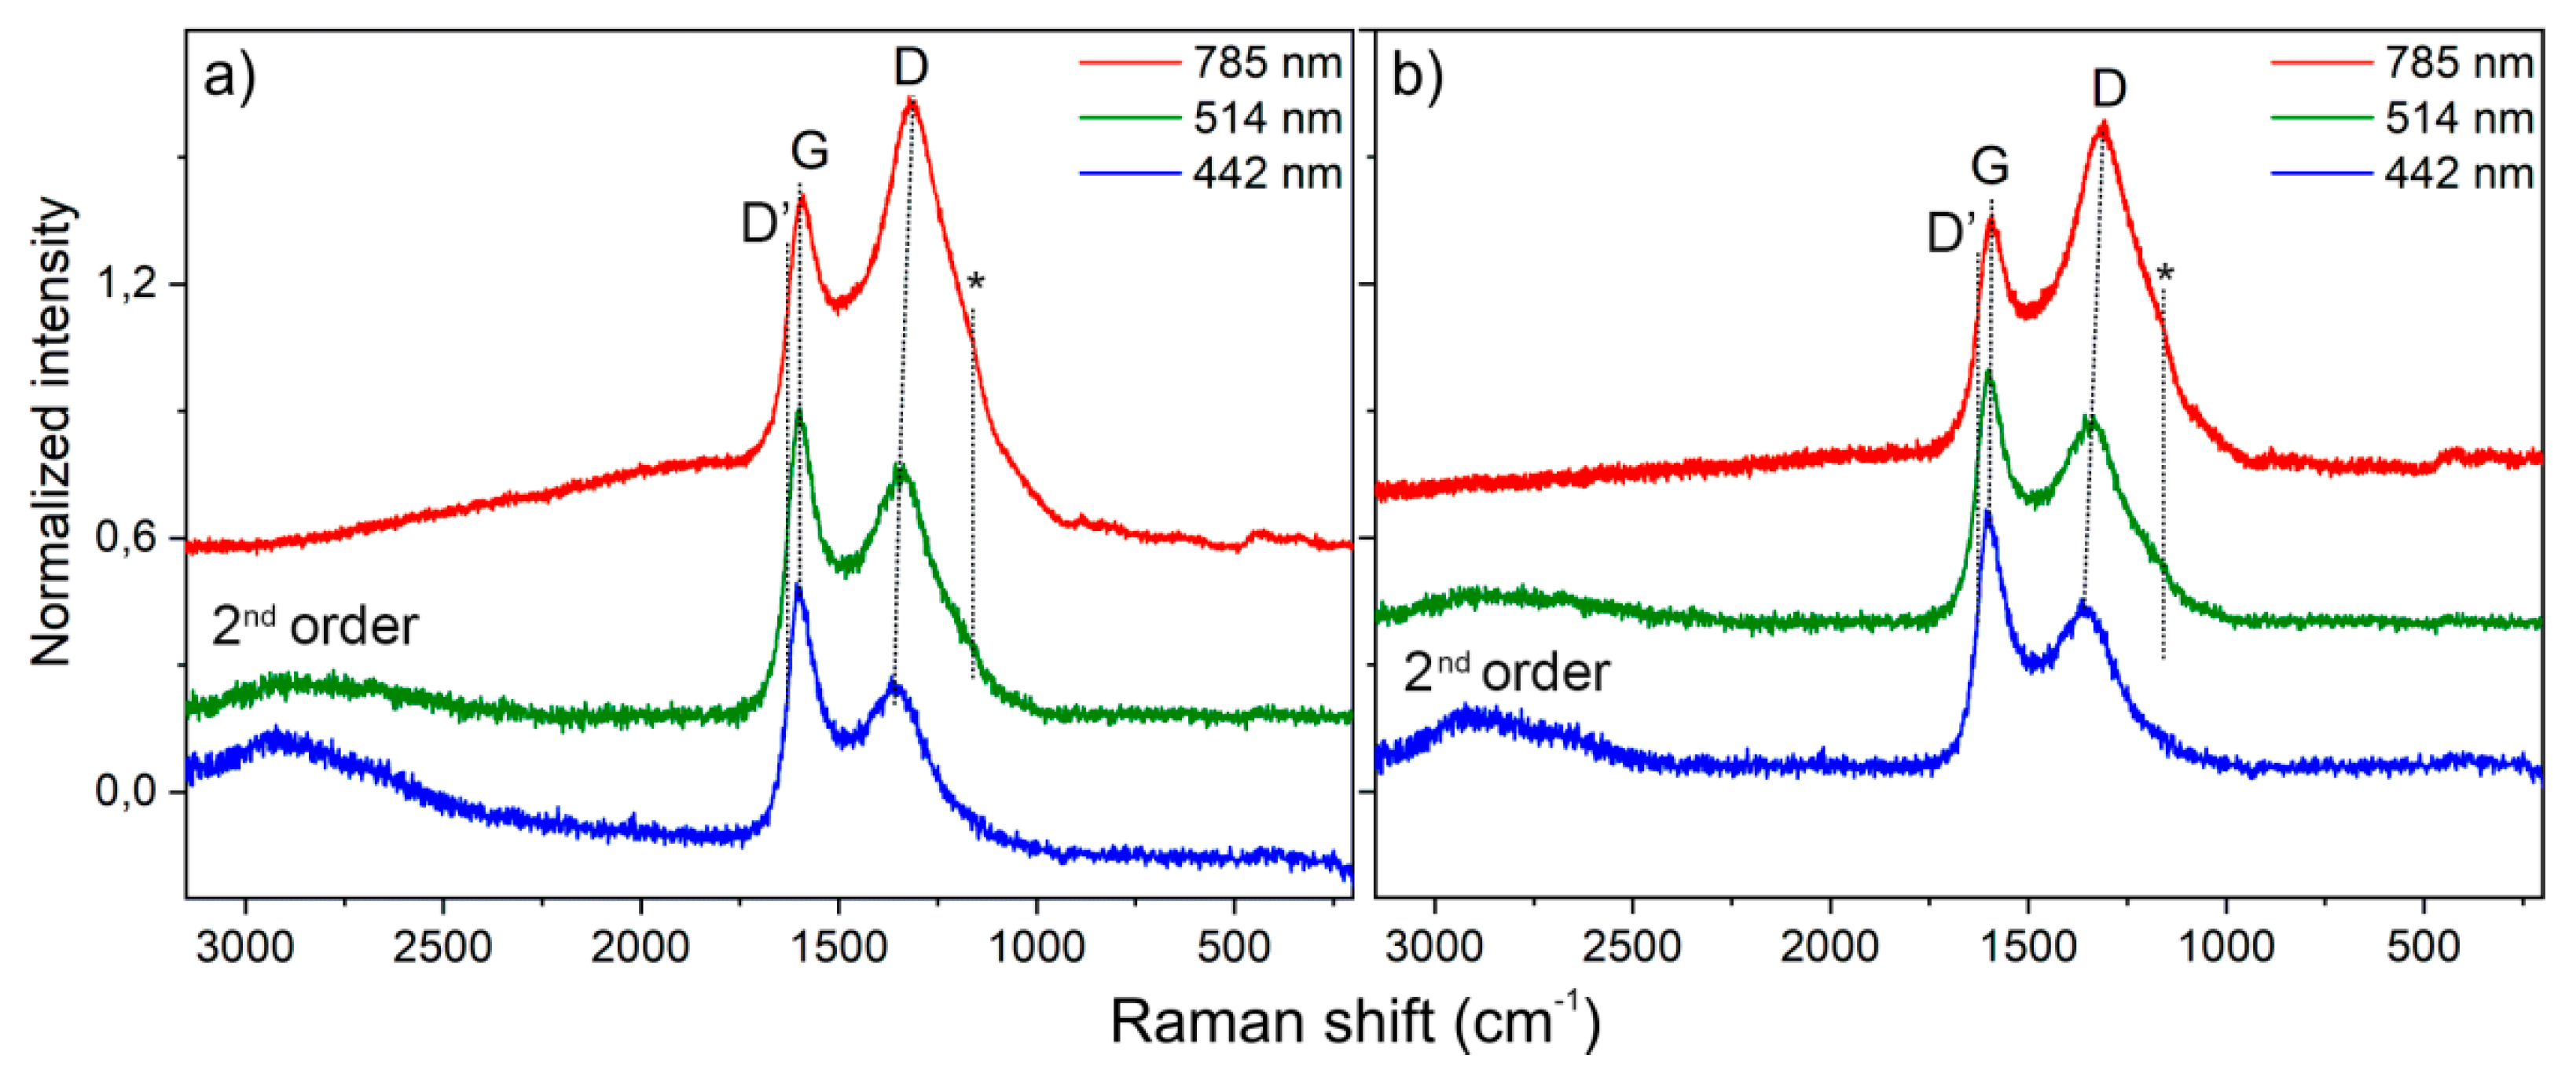
Two intense bands called G- and D-bands dominate spectra in the first-order Raman scattering region (1100–1650 cm
−1) and other minor features in the second-order Raman spectra. The first Raman fingerprint with a maximum at ca. 1599 cm
−1 (G-band, E2g symmetry) is upward shifted of ca. 20 cm
−1 with respect to the G-band of graphite (1582 cm
−1), which results from the breathing vibration of 6-membered carbon rings [
40,
41]. The second band located at about 1315–1360 cm
−1 (D-band, A1g symmetry) is due to the stretching vibration of sp
2 C–C bonds, and it is forbidden in the perfect graphite, but becomes Raman active in the presence of defects [
42]. The observed D band undergoes a progressive red-shifting (maxima at 1316 cm
−1, 1339 cm
−1 or 1367 cm
−1) with a laser wavelength increasing (785, 514 and 442 nm, respectively) due to structural perfection, and is independent from the carbon [
43,
44]. Therefore, the stacking of the graphene patches is very irregular and the structure results in being very defective at well-matching a sp
2-carbon with a low sp
3-carbon contribution, commonly found in glassy carbons [
34,
45,
46,
47]. The D-band at c.a. 1620 cm
−1, attributed to a maximum in the vibrational density of states, is absent due to the very small graphitic domains as usually found in defective graphitic carbons [
44,
48]. Furthermore, a broad low frequency shoulder of the D-band observed at c.a. 1050–1200 cm
−1 (see asterisks in
Figure 7a,b) is usually found in highly defective carbons and originates from the vibrations of non-hexagonal carbon rings and C–C sp
3 [
43,
49]. In the low-frequency region, broad bands are present in the 300–470 cm
−1 range for the laser excitation with 785 nm. These bands can be assigned to small curved structures that are typically present in glassy carbons [
45,
48]. Another very broad feature appears in the second-order Raman region (2500–2800 cm
−1 range) corresponding to the second order Raman scattering with harmonic and anharmonic combinations [
42]. It is noteworthy that the different laser sources play a remarkable role in the different spectral manifestations.
Raman spectra of Char1.5 and Char2.5, obtained employing three laser lines (785 nm, 514 nm, and 442 nm), are illustrated in
Figure 7.
Based on the characteristics of morphology, structure, chemical composition and porosity, higher than most of the pyrolyzed biochars reported in the literature [
50], pyrolyzed PMDA/GLU nanosponges can be exploited in the removal of organic pollutants from water, such as MB.
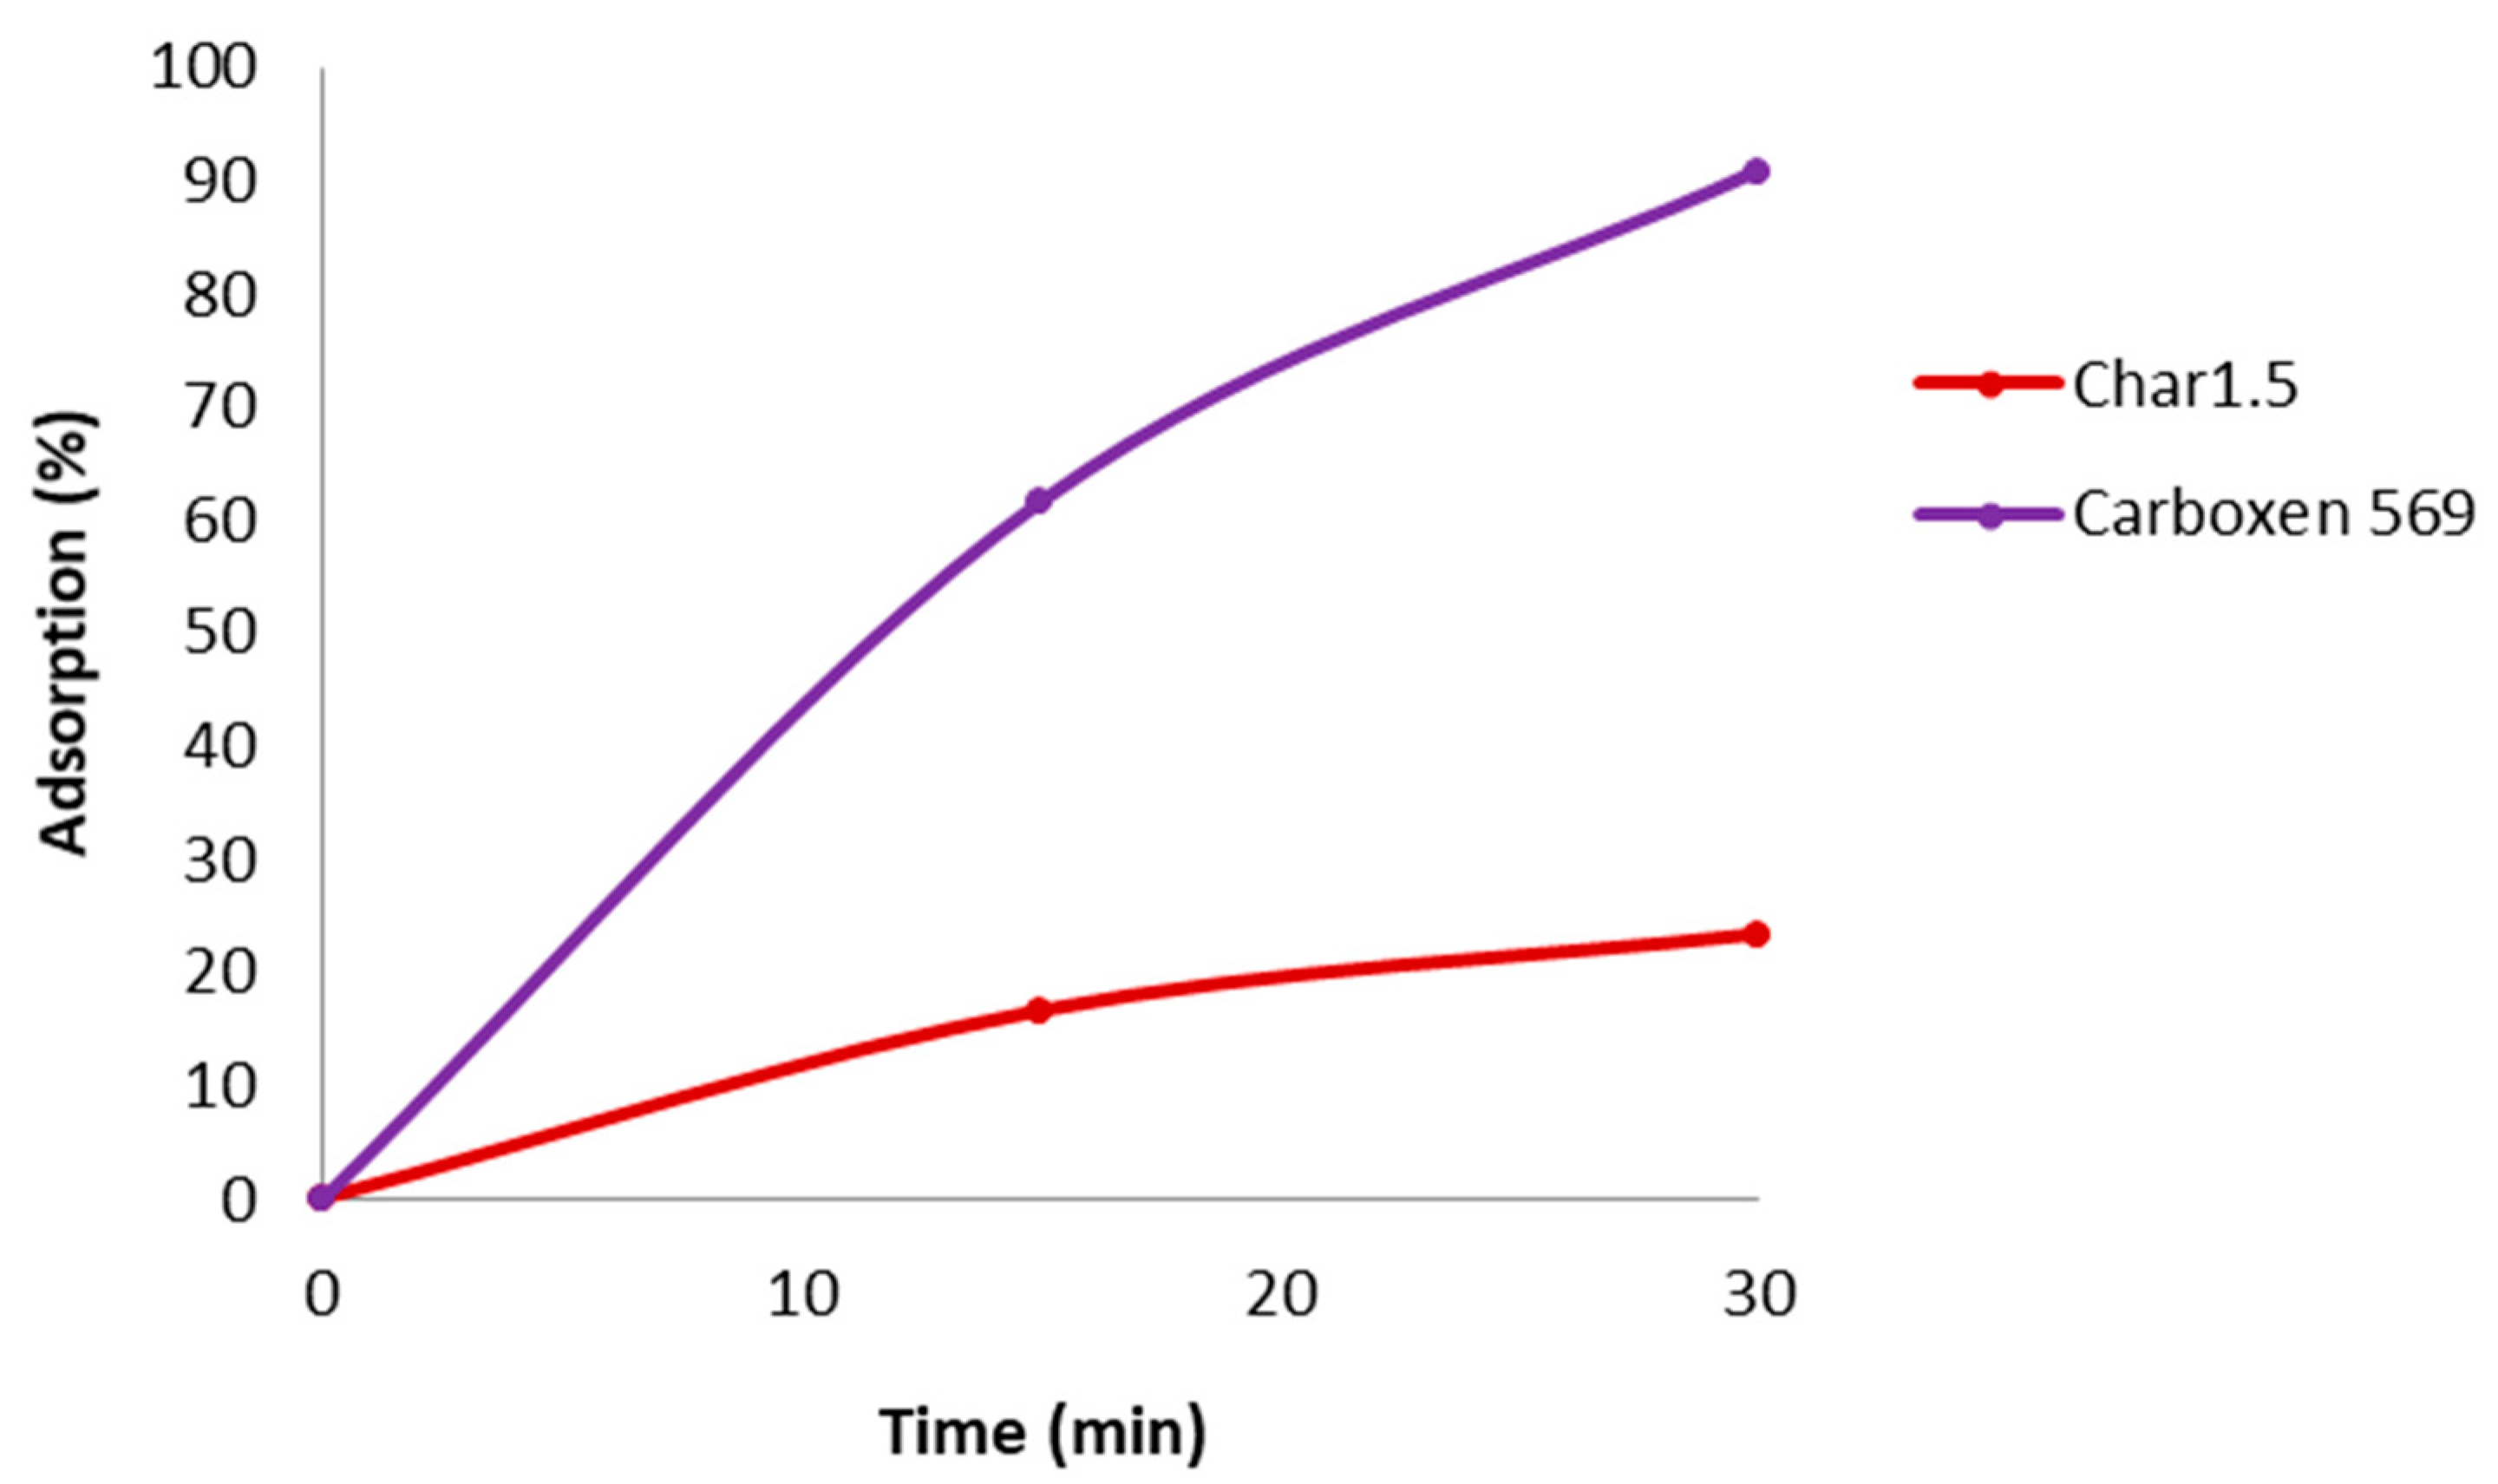
Table 6 reports the percentage of MB removal from water after adsorption on Char1.5 (column 2) and Carboxen 569 (column 3).
Carboxen 569 is a commercial carbon with porosity (BET Surface area: 485 m2/g, micropore volume: 0.20 cm3/g, micropore diameter: 5–8 Å) similar to Char1.5.
Table 6 highlights weaker MB adsorption on Char1.5; this phenomenon could be explained by the presence of larger pores in Carboxen 569, such as mesopores, more suited to hosting MB molecules [
51]. Furthermore, the rate of adsorption, corresponding to the slope of the lines in
Figure 8, is lower for Char1.5 in the whole interval investigated.


 ,
, 


