Article

Changes of Antioxidant and Functional Components in Various Salt-Aged and Fresh Radishes after Fermentation

Department of Food Science, National Chiayi University, #300 Xuefu, Chiayi City 600, Taiwan
*
Author to whom correspondence should be addressed.
Fermentation 2024, 10(9), 479; https://doi.org/10.3390/fermentation10090479
Submission received: 1 August 2024 / Revised: 11 September 2024 / Accepted: 12 September 2024 / Published: 14 September 2024
(This article belongs to the Special Issue Antioxidant Activity of Fermented Foods)

Abstract

:
Many studies have found that salted radishes offer various health benefits, such as enhancing antioxidant levels and increasing GABA. This study fermented a mixture of 20-year-old salted radishes (20-S. radishes), 2-year-old salted radishes (2-S. radishes), 20-year-old salted radishes combined with fresh radishes (R + 20-radishes), and fresh radishes with eight whole grains fermentation as a starter (EGS) for 8 weeks. EGS was derived from the saccharified fermentation of millet, wheat, sorghum, black rice, buckwheat, pearled rice, black glutinous rice, and quinoa, serving as a carbon source for microorganisms and replacing the traditional sugar-based fermentation method. During the fermentation process, the bacterial count of the 20-year-old salted radishes significantly increased to 11.08 ± 0.03 log CFU/mL, which was much higher than the other three groups. Pichia manshurica LYC1722 was identified in all four groups after isolation. After 8 weeks of fermentation, 20-S. radishes showed the highest concentrations of gamma-aminobutyric acid (GABA) and glucuronic acid in functional components, at 18.40 ± 0.69 ppm and 14,162.84 ± 48.22 ppm, respectively. In terms of antioxidant components, 20-S. radishes exhibited a total phenolic content (TPC) and total flavonoid content (TFC) of 0.81 ± 0.01 mg/mL and 42.78 ± 0.60 mg/L, respectively. Regarding antioxidant capability, 20-S. radishes displayed ABTS radical scavenging activity and DPPH radical scavenging activity at 184.42 ± 0.28 μg/mL and 9.13 ± 0.28 μg/mL, respectively. These values were the highest among the four groups evaluated. Fresh radishes exhibited the highest angiotensin-converting enzyme (ACE) inhibition after fermentation among the four groups, reaching 69.04 ± 2.82%, slightly higher than 20-S. radishes. These results show that 20-S. radishes are expected to become a novel health beverage in the future.

1. Introduction

Raphanus sativus, commonly known as radish, is highly valued by many Western and Eastern cultures, with numerous countries using it as both food and medicine [1]. Radishes are widely used around the world as traditional remedies for various ailments and imbalances caused by factors such as anemia, female (and/or male) infertility, gastrointestinal issues, respiratory problems, skin conditions, urinary tract problems, and more [2]. Radishes also have a low calorie count and high nutritional value: 100 g of radish contains 18 calories, 4.1 g of carbohydrates, 2.5 g of sugar, 1.6 g of dietary fiber, 0.1 g of fat, and 0.6 g of protein. Radishes also boast vitamins B1, B2, B6, B5, B9, and C, along with thiamine, riboflavin, niacin, and pantothenic acid. They are also rich in minerals such as calcium, iron, magnesium, manganese, phosphorus, potassium, sodium, and zinc [3]. Studies have found that extracts of radish can stimulate the gastrointestinal activity of rodents [4]. Additionally, experiments have shown that consuming Raphanus sativus may be associated with cancer prevention, possibly due to its antioxidant properties [5].
Pickled radish is one of the most popular and traditional dishes in Asian countries due to a scarcity of vegetables in winter. Pickled radish offers unique nutritional components and health benefits. Many studies have shown that the bioactive compounds in radishes produce more antibacterial and/or antioxidant substances during the pickling process, such as phenolic compounds [6,7]. Phenolic compounds, such as phenols, are commonly used as natural antioxidants and can also inhibit the growth of microorganisms such as Escherichia coli, Klebsiella pneumoniae, Bacillus cereus, Aspergillus flavus, and parasitic molds [6]. The traditional method of pickling radishes primarily involves dehydration through salting or sun-drying. The making of salted radishes involves fresh radishes being dehydrated and salt-treated before being placed in a sealed container to undergo anaerobic fermentation [8]. Dehydration of salted radishes has been shown to increase the concentration of gamma-aminobutyric acid (GABA). GABA plays a significant role as a neurotransmitter in the nervous system and has various functions such as antioxidant, anxiolytic, anti-aging, hepatoprotective, and hypotensive effects [9]. Salted pickles of sun-dried radish can help prevent high blood pressure. Additionally, consuming 0.3% sun-dried radish root powder can prevent increases in systolic blood pressure [10].
Although fermentation is generally recognized as a food processing method that enhances antioxidant and functional components, there is a lack of research specifically examining the fermentation of radishes of different pickling vintage years using whole-grain fermentation liquid as agents, and investigating the changes in related bioactive and functional components. Previously, we reported that fermenting with eight whole grains (millet, wheat, sorghum, black rice, buckwheat, germinated rice, black glutinous rice, and red quinoa) as a fermenting starter (EGS), followed by a second fermentation with the same eight whole grains, resulted in significant increases in total polyphenols, total flavonoids, gamma-aminobutyric acid (GABA), glucuronic acid, and angiotensin-converting enzyme (ACE) inhibition after fermentation [11]. Glucuronic acid eliminates various toxic substances in the human body through the urinary system, including exogenous chemicals and excess steroid hormones [12]. This study will utilize the EGS as a starter to ferment various batches including 20-year-old salted radishes (20-S. radishes), 2-year-old salted radishes (2-S. radishes), a combination of 20-year-old salted radishes with fresh radishes (R + 20-radishes), and fresh radishes over an eight-week period, each batch fermented separately. It aims to investigate changes in microbial species and counts, organic components (fructose, glucose, acetic acid, ethanol), antioxidant components (total phenols, flavonoids), antioxidant capacity (DPPH, ABTS), and functional components (GABA, glucuronic acid and ACE inhibition) during fermentation. Through this study, we can understand whether aged salted radishes have better health effects after fermentation, which can be used as a reference for future functional drinks.

2. Materials and Methods

2.1. Chemicals and Reagents

Quercetin was acquired from Tokyo Chemical Industry Co. (Osaka, Japan). Methanol was sourced from Macron Fine Chemicals (Center Valley, PA, USA). Sodium chloride (NaCl) was obtained from Sigma Aldrich (Saint Louis, MO, USA). L-ascorbic acid (vitamin C) was sourced from Riedel-de Haën (Seelze, Germany). Sodium hydroxide (NaOH), acetonitrile, and ortho-phosphoric acid were acquired from Honeywell (Muskegon, MI, USA). Gallic acid was purchased from Alfa Aesar (Santa Ana, CA, USA).
All reagents were of the highest commercially available purity.

2.2. Materials

The EGS was purchased from Hanyang Technology Co. Chiayi. Radishes were purchased from PX MART, Chiayi. The 2-S. radishes and 20-S. radishes were purchased from Xinju Shop Chiayi.

2.3. Fermentation

The fermentation process was carried out in three identical 10 L glass jars over a period of 8 weeks. Each jar was stirred twice daily and maintained at a temperature of 30 °C. After stirring for 15 min, a 120 mL sample was taken from each jar once a week, filtered, and stored at 4 °C for subsequent experiments. For the determination of TPC, TFC, ABTS, and DPPH, the four groups of samples were added to ultrapure water at a 1:1 and 1:10 ratio and extracted for one hour.

2.4. Yeast Count Test and Identification

The yeast cell count test (CFU/mL) involved serial dilution of the fermentation sample, which was then triple-plated on YM agar and cultured at 25 °C for 48 h before counting.
A single colony was selected and cultured for one day. Subsequently, colony PCR was conducted using 16S primers (16F: GTATTACCGCTGCTG/16R: AGAGTTTGATCCTGGCTCAG). DNA fragments were amplified under the following conditions: initial denaturation at 95 °C for 5 min, followed by 35 cycles of denaturation at 94 °C for 1 min, annealing at 36 °C for 1 min, extension at 72 °C for 1 min, and a final extension step at 72 °C for 5 min. The PCR products were sequenced at The National Cheng Kung University Center for Genomics Medicine.

2.5. Total Phenolic Content (TPC) Determination

The procedure was as follows: 25 μL of the sample was added to 1.0 mL of 2% Na2CO3 and allowed to react for 2 min. Then, 250 μL of 50% Folin–Ciocalteu reagent was added, and the mixture was left to react at 25 °C in the dark for 30 min. The absorbance was then measured at 750 nm using a spectrophotometer (Metertech SP-830 Plus, Taipei, Taiwan). The standard solution contains gallic acid concentrations ranging from 0.125 mg/mL to 1.0 mg/mL [11].

2.6. Total Flavonoid Content (TFC) Determination

We mixed 0.2 mL of the sample with 0.8 mL of 95% ethanol, 400 µL of 10% aluminum nitrate, 400 µL of 1 M potassium acetate, and 200 mL of distilled water. The mixture was then allowed to react in the dark at 25 °C for 40 min. After the reaction, the absorbance was measured at 415 nm using a spectrophotometer (Metertech SP-830 Plus, Taipei, Taiwan). The standard solution contains quercetin concentrations ranging from 4.69 mg/L to 300 mg/L [13].

2.7. ABTS (2,2′-Azino-bis(3-ethylbenzothiazoline-6-sulfonic acid) Radical Scavenging Assay

We dissolved 14 mM ABTS salt and 4.9 mM K2S2O8 separately in ultrapure water and adjusted each solution to a volume of 10 mL. Then, we mixed the solutions and allowed them to react in the dark for 16 h. We adjusted the completed ABTS+ solution with ultrapure water to achieve an absorbance value of 0.7 ± 0.005 at 734 nm. After adjustment, we mixed 0.05 mL of the sample with 1.95 mL of the ABTS+ solution, allowed the reaction to proceed in the dark at 25 °C for 6 min, and then measured the absorbance at 734 nm. The standard solution included Trolox concentrations ranging from 0.0025 mg/mL to 0.2 mg/mL [13].

2.8. DPPH (Di(phenyl)-(2,4,6-trinitrophenyl)iminoazanium) Radical Scavenging Assay

We mixed 0.4 mL of the sample with 1 mL of a 0.2 mM DPPH methanol solution, allowed the reaction to proceed in the dark at 25 °C for 50 min, and measured the absorbance at 517 nm. The standard solution included Trolox concentrations ranging from 0.0025 mg/mL to 0.2 mg/mL [13].

2.9. pH Value and Total Titratable Acidity (TTA) Determination

The pH values of different samples were measured using a pH meter (pH 2–11, Hanna, Padova, Italy). The total titratable acidity method was carried out following the procedure by Barbosa et al. [14]. In short, each 1 mL sample was diluted with 20 mL of distilled water and titrated using a 0.1 M NaOH solution with 1% phenolphthalein as the indicator. The mixture was continuously stirred until the first noticeable pink change occurred. The findings were presented as the concentration of lactic acid in the sample.

2.10. Organic Acid and Carbohydrate Analysis

After centrifuging the samples to obtain supernatant, they were filtered through a 0.22 μm sterile membrane and transferred into sample bottles for preparation. All analyses were conducted using the same HPLC system (Shimadzu sci-10a, Kyoto, Japan).
Organic acid analysis conditions: A 10 μL sample was injected into a C-18 column (4.6 mm × 250 mm, 5 μm; Hitachi High-Tech Fielding Corporation, Tokyo, Japan) at a column temperature of 30 °C. Mobile phase A was acetonitrile, and mobile phase B was 0.05 M H3PO4 for an isocratic elution. The system flow rate was 0.6 mL/min, and UV detection was performed at 210 nm. Lactic acid, acetic acid, and gluconic acid standard solutions were prepared at concentrations of 10,000, 5000, 2500, 1250, 625, and 312.5 ppm. Standard curves were plotted using the peak areas from the different concentrations of these acids, and the peak areas from the samples were used in the formula to calculate their contents [15].
Carbohydrate analysis conditions: A 10 μL sample was injected into an NH2 column (4.6 mm × 250 mm, 5 μm; YMC Co., Ltd., Japan) at a column temperature of 40 °C. The mobile phase consisted of 75% acetonitrile and ultrapure water for an isocratic elution. The system flow rate was 1 mL/min, and detection was conducted using a refractive index detector (RI). Fructose and glucose standard solutions were prepared at concentrations of 10,000, 5000, 2500, 1250, 625, and 312.5 ppm. Standard curves were plotted using the peak areas from the different concentrations of these sugars, and the peak areas from the samples were used in the formula to calculate their contents [15].

2.11. GABA Measurements

GABA stock standard solutions at 1000 ppm were prepared by dissolving standards in individual 10 mL volumetric flasks and storing them in a dark environment. Working solutions for each concentration level (1000, 500, 250, 125, and 62.5 ppm) were then created by diluting the stock solutions with water. Each working solution (1 mL) underwent treatment with 1 mL of 2-hydroxynaphthaldehyde (0.3% w/v) in methanol, followed by the addition of 0.5 mL of boric acid–NaOH buffer (pH 8.5) in a 5 mL volumetric flask. The resulting mixture was heated at 85 °C for 15 min in a water bath and then allowed to cool to room temperature. The volumes were adjusted to 5 mL with methanol and stored at 4 °C until analysis, following the protocols outlined by [16,17]. Subsequently, the samples were filtered using a 0.22 μm sterile microfilter, and 10 μL of the filtrate was injected into the HPLC system (Shimadzu sci–10a, Japan).

2.12. ACE Inhibition Activity Assay

The ACE inhibition activity of the samples was assessed using a modified version of the previous method [18]. In each test, 9 μL of 0.1 M potassium phosphate buffer (containing 0.3 M NaCl, pH 8.2) was combined with 15 μL of Hippuryl–Histidyl–Leucine (4 mmol/L Hip-His-Leu in 0.1 M potassium phosphate buffer), along with 6 μL of the sample and 30 μL of ACE, making a total volume of 60 μL. This mixture was then incubated in a water bath at 37 °C for 1 h. After incubation, 50 μL of 1 N HCl was added to halt the reaction. Subsequently, 100 μL of the coloring agent Pyridine and 50 μL of BSC were added, followed by shaking and rapid cooling to room temperature using an ice bath. Finally, 200 μL of the resulting solution was transferred to a 96-well plate, and its absorbance at 410 nm was measured using an absorbance spectrophotometer (BMG LABTECH, SPECTROstar Nano, Offenburg, Germany).

2.13. Statistical Analysis

The data were presented as mean ± standard deviation (SD). Statistical significance was assessed through one-way analysis of variance (ANOVA) using IBM SPSS 10.0. Differences were considered significant at p < 0.05. Duncan’s multiple range tests were employed to rank the significantly distinct groups. All statistical analyses were conducted using Sigma Plot 10.

3. Results and Discussion

3.1. Variability in Yeast Counts and Identification after Fermentation

The bacterial counts of the four groups were very close, ranging from 1.26 ± 0.02 to 1.40 ± 0.01 log CFU/mL in week 0. During the first week of fermentation, the bacterial count of 20-S. radishes experienced a notable surge, rising from 1.40 ± 0.01 log CFU/mL to 8.06 ± 0.06 log CFU/mL (Table 1). Subsequently, the increase occurred at a slower pace, culminating in 11.08 ± 0.03 log CFU/mL by the 8th week. During the 8-week fermentation period, the remaining three groups exhibited comparable bacterial growth, with only minor fluctuations. This indicates that 20-S. radishes provide the best environment for yeast growth. Throughout the entire fermentation process, one strain of yeast was isolated, sequenced, and identified from the four samples as Pichia manshurica LYC1722. In our previously published study, it was found that EGS undergoes changes in bacterial strains during the fermentation process [11]. When different materials are added for secondary fermentation, for example, using Chin-Shin Oolong teas for fermentation as mentioned in our previous study [15], Acetobacter pasteurianus becomes the dominant strain. In this study, different radishes were used for secondary fermentation. It is likely that the components in the radishes caused the fermentation broth to be dominated by Pichia manshurica. Yeast has various applications in the functional food industry, such as (i) serving as live cells for probiotics, (ii) its cell wall components having nutritional and health value (e.g., β-glucans), (iii) active metabolites (such as folic acid, carotenoids, γ-aminobutyric acid), and (iv) producing specific enzymes for the biotransformation of food metabolites, thereby generating high-value nutrients [19]. In fermented vegetable sauce, the presence of Pichia manshurica showed a strong correlation with the total volatile esters [20]. The Pichia kudrivazevii strain possesses high phytate hydrolysis ability, aiding in the enhancement of vitamin and mineral content. Additionally, the starter cultures also have the capability to survive and adhere to intestinal epithelial cells in the gastrointestinal tract (GIT) [21]. Due to the notably higher yeast count in the fermented 20-S. radishes in comparison to the other three groups, the post-fermentation taste and potential health benefits may be even more pronounced.

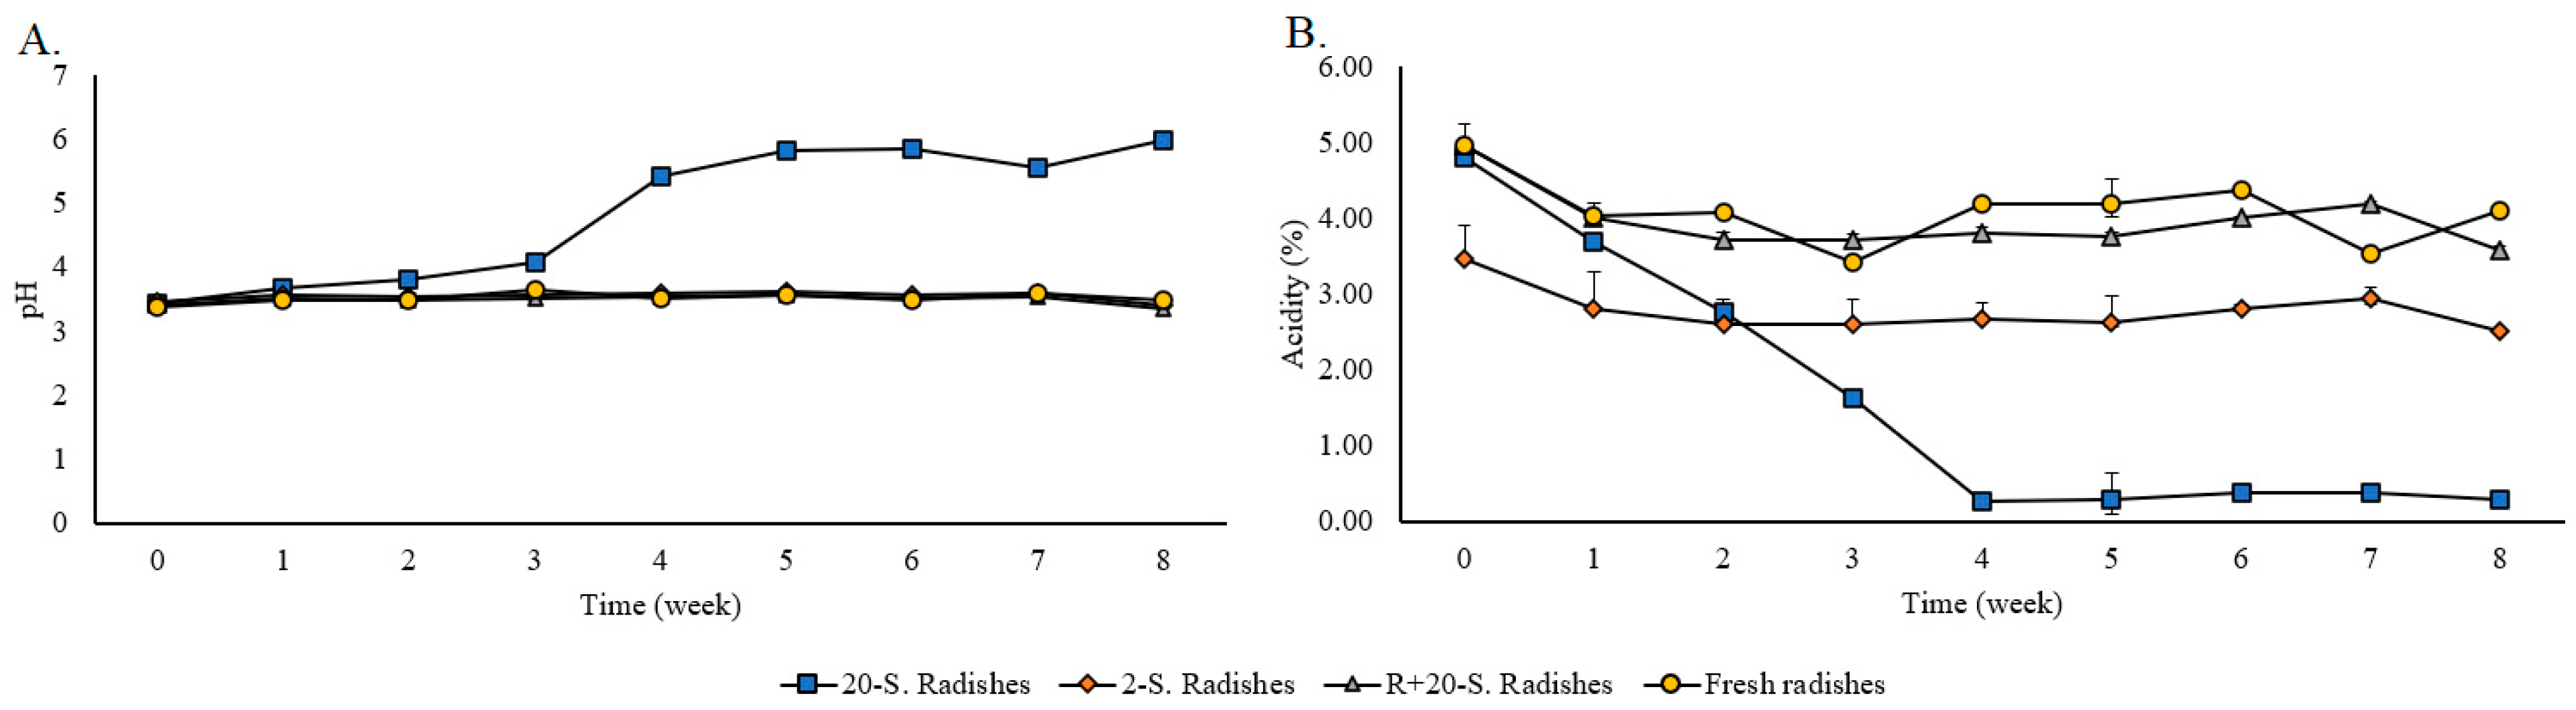
3.2. Variation of pH, Acidity, Glucose, Fructose, and Acetic Acid

The pH of 20-S. radishes increased notably from 4.07 to 5.42 during week 4, and it continued to rise throughout fermentation (Figure 1A). Conversely, the pH levels of the other three groups remained fairly constant over the 8-week period. The reason for the increase in pH value could be attributed to a significant increase in yeast, leading to an increase in amino acids. Additionally, the carbon dioxide generated by yeast metabolism reacts with the fermentation of 20-S. radishes, indirectly leading to the formation of carbonates and causing the pH value to rise. The pH values and acidity of 20-S. radishes were negatively correlated. During week 4, the acidity of 20-S. radishes reached its lowest point at 0.26 ± 0.04%, and it remained stable throughout the subsequent fermentations, reaching 0.29 ± 0.02% by the 8th week (Figure 1B). The acidity of the other three groups remained within the range of 3.43 to 4.96% during the 8-week fermentation process. In week 8, in 2-S, the acidity of radishes measured at 2.51 ± 0.04%, was slightly lower compared to R + 20-S radishes at 3.58 ± 0.04% and fresh radishes at 4.11 ± 0.02%. This indicates that as the radishes ferment for longer periods, the pH value tends to increase while the acidity decreases.
In all groups, glucose levels showed a significant decrease throughout the fermentation process (Table 2). After 8 weeks of fermentation, the glucose concentration in 20-S. radishes decreased to 45.68 ± 0.50 ppm, while the concentrations in the remaining three groups dropped to between 20.81 ± 0.3 and 28.55 ± 0.45 ppm. Regarding the variation in fructose, there was little change in all four groups before and after fermentation. The fructose in 20-S. radishes increased faster in the first week of fermentation compared to the other three groups, reaching 867.34 ± 27.69 ppm, but by the 8th week, it decreased to 819.17 ± 16.72 ppm (Table 3). The amount in fresh radishes increased to 956.76 ± 36.36 ppm in the second week but decreased to 788.94 ± 15.05 ppm by the 8th week, while the other two groups showed only marginal increases throughout the fermentation process. Due to yeast’s preference for glucose utilization, there was a decrease in glucose levels across all four groups. As glucose levels declined, the utilization of fructose began. This can be observed in the significant reduction in glucose levels in the three groups, 2-S. radishes, R + 20-S. radishes, and fresh radishes, coinciding with the decrease in fructose levels.
Except for 20-S. radishes, the acetic acid in the other three groups significantly decreased during week 1 of fermentation. Additionally, 20-S. radishes also exhibited a significant decrease in week 2, and by the 8th week, acetic acid levels were the lowest among the four groups. In the 0th week of fermentation, acetic acid was primarily derived from the EGS. Due to the absence of involvement from lactic acid bacteria and acetic acid bacteria during fermentation, acetic acid was utilized by yeast as a carbon source, resulting in a decrease in its concentration. Moreover, ethanol and acetic acid produced by yeast fermentation undergo esterification to generate ethyl acetate, further reducing the concentration of acetic acid (Table 4).

3.3. Performance of Functional Components

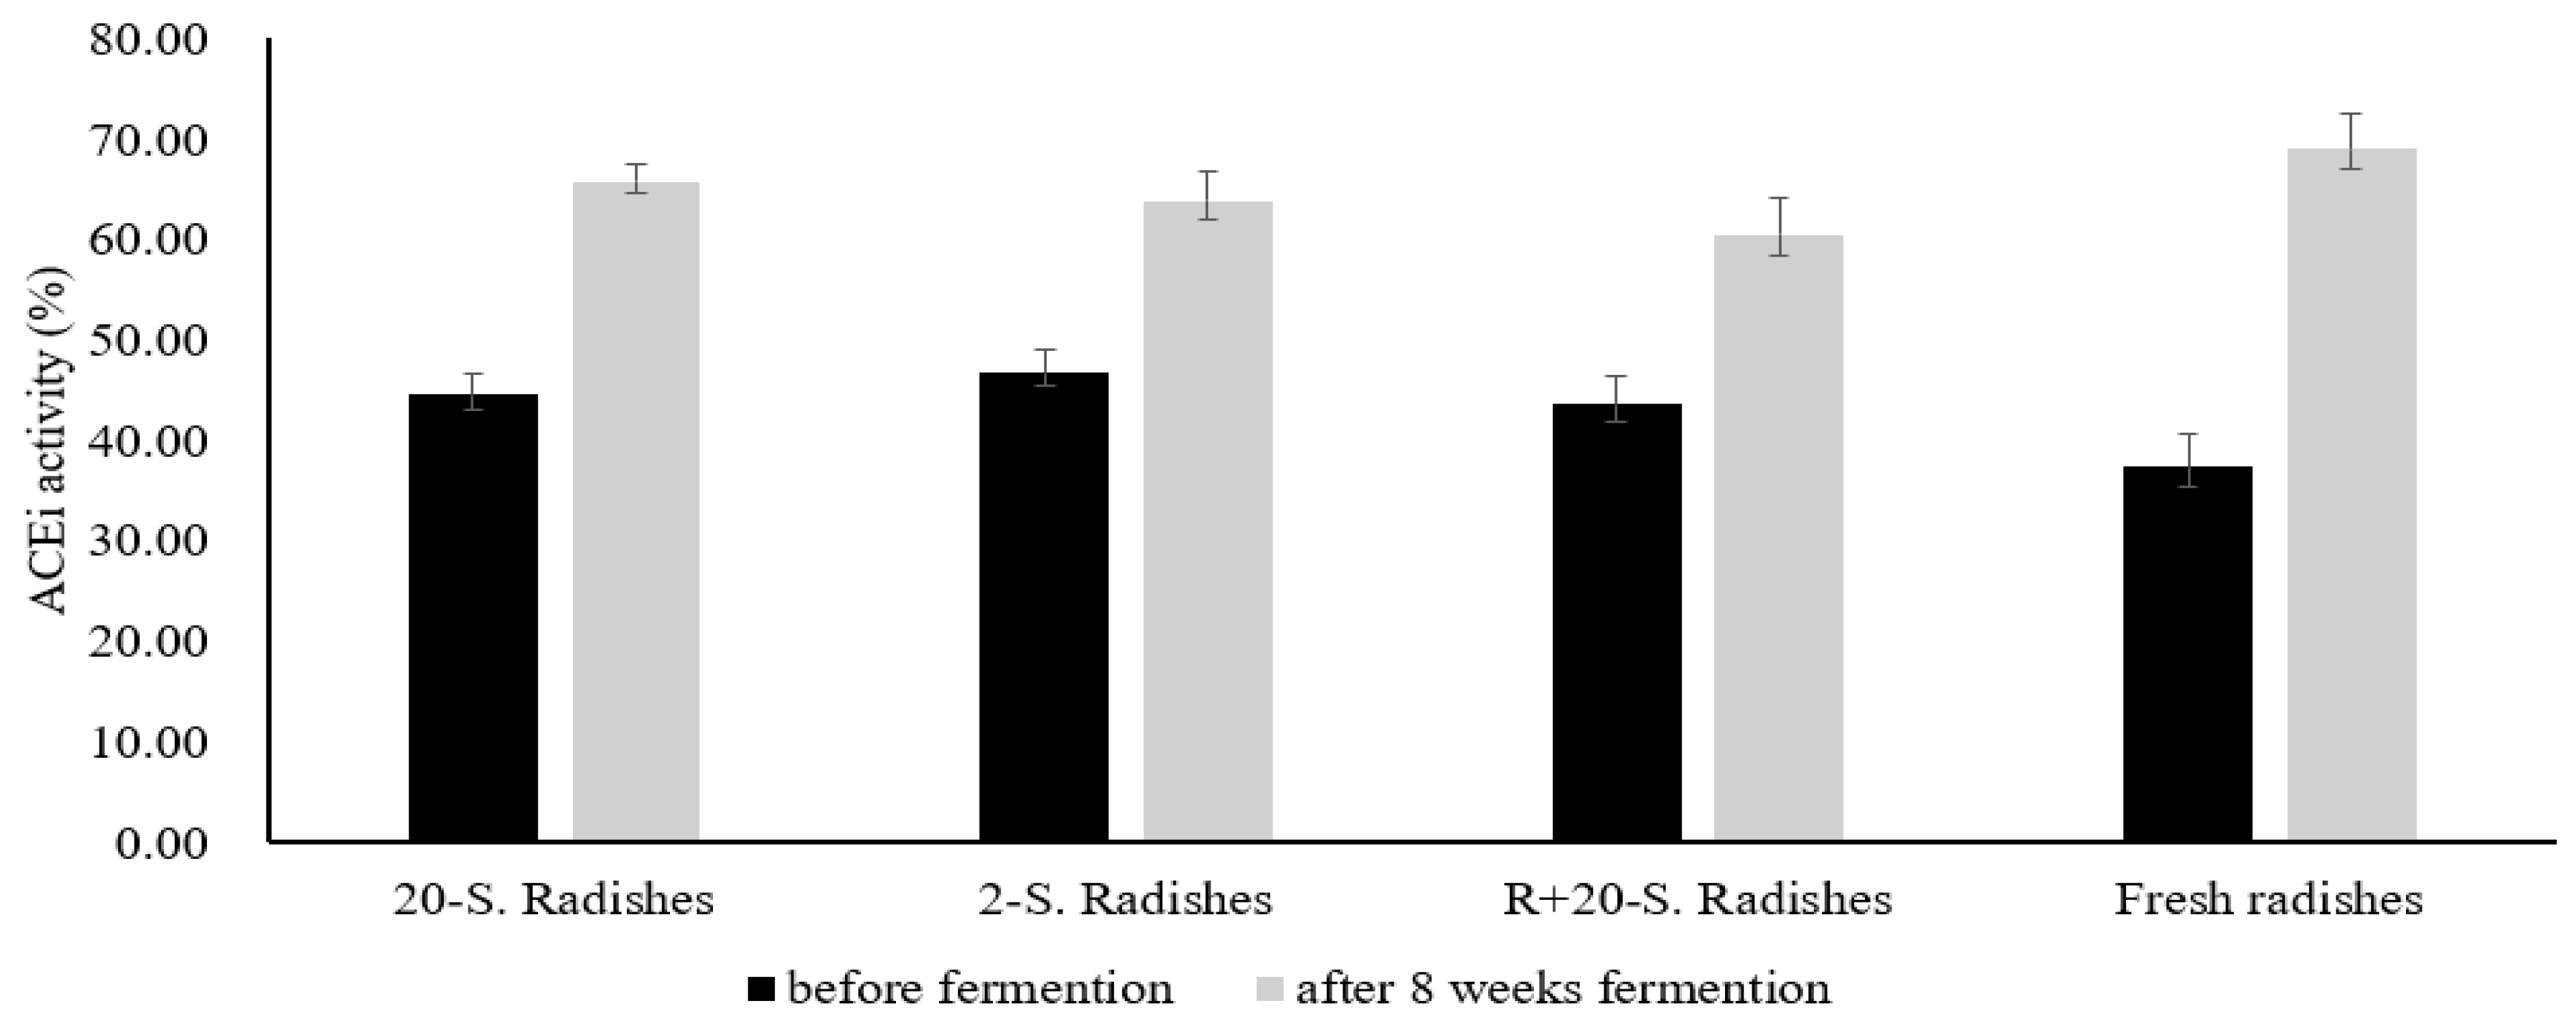
3.3.1. Effects of ACE Inhibition Capacity

In the 0th week of fermentation, 2-S. radishes showed the highest ACE inhibition activity (46.75 ± 2.26%), followed closely by 20-S. radishes (44.52 ± 1.80%) and R + 20-S. radishes (43.63 ± 1.87%) (Figure 2). This indicates that the fermentation products containing salted radishes had higher ACE inhibition activity before fermentation. Numerous peptides found in food exhibit ACE-inhibitory activity [22]. Before fermentation, the dehydration and pickling process of pickled radish may lead to protein degradation, potentially resulting in the production of peptides. According to the study by [10], sun-dried radish root and salted sun-dried kimchi showed strong ACE-inhibitory activity, with IC50 values of 0.57 mg/mL and 0.43 mg/mL, respectively. In contrast, raw radish root exhibited relatively weak activity, with an IC50 value of 1.32 mg/mL. However, after 8 weeks of fermentation, fresh radish unexpectedly exhibited the highest ACE inhibition activity among the four groups.

3.3.2. Effects of GABA Concentration

Microorganisms, including yeast, fungi, and bacteria, primarily generate GABA through the fermentation process of food products [12]. According to Liu and colleagues’ 2011 findings, a daily intake of 1.36 mg GABA/kg body weight was shown to reduce blood pressure [23]. In week 0, the GABA concentrations were similar across the four groups. After 8 weeks of fermentation, the GABA concentration was highest in 20-S. radishes, followed by 2-S. radishes, with concentrations of 18.40 ± 0.69 ppm and 12.88 ± 0.10 ppm, respectively. R + 20-S. radishes and fresh radishes had the lowest concentrations, at 5.89 ± 0.13 ppm and 5.36 ± 0.63 ppm, respectively (Figure 3A). Glutamate decarboxylase (GAD, EC 4.1.1.15) is responsible for catalyzing the irreversible removal of a carboxyl group from glutamate, resulting in the production of GABA [11]. The 20-S. radishes may contain more glutamate than the other three groups, thus converting it into more GABA during the fermentation process. Since glutamate is the precursor of GABA, this study demonstrates that 20-S might contain the most glutamate among all groups, resulting in the highest concentration of GABA.

3.3.3. Effects of Glucuronic Acid Concentration

The main benefits of glucuronic acid for health are primarily manifested in its promotion of the excretion of harmful substances and its promotion of intestinal health. Glucuronidation is employed to activate crucial fat-soluble vitamins and to detoxify external substances [24]. In the 0th week of fermentation, the concentrations of glucuronic acid were similar among the four groups. By the 5th week, the 20-S. radishes rapidly increased to 14,139.09 ± 78.27 ppm, with no significant change in subsequent fermentation. By the 8th week, it remained notably higher at 14,162.84 ± 48.22 ppm compared to the other three groups (Figure 3B). Among the four groups, 20-S. radishes had the highest concentration of glucuronic acid. According to Hung et al. [25], 20-S. radishes had the highest yeast count, leading to a high number available to metabolize glucose into glucuronic acid. In the fourth week, fructose in 20-S decreased by 16.70%, which may be due to yeasts utilizing fructose as a carbon source to synthesize glucuronic acid. The second highest was the 2-S. radishes, reaching 11,513.99 ± 35.18 ppm by the 8th week, while fresh radishes were the lowest (8915.82 ± 24.79 ppm). It is worth noting that the 2-S. radishes still showed an upward trend by the 8th week, suggesting that with longer fermentation times, the glucuronic acid concentrations may become closer to those of the 20-S. radishes.

3.4. Performance of Antioxidant Capacity

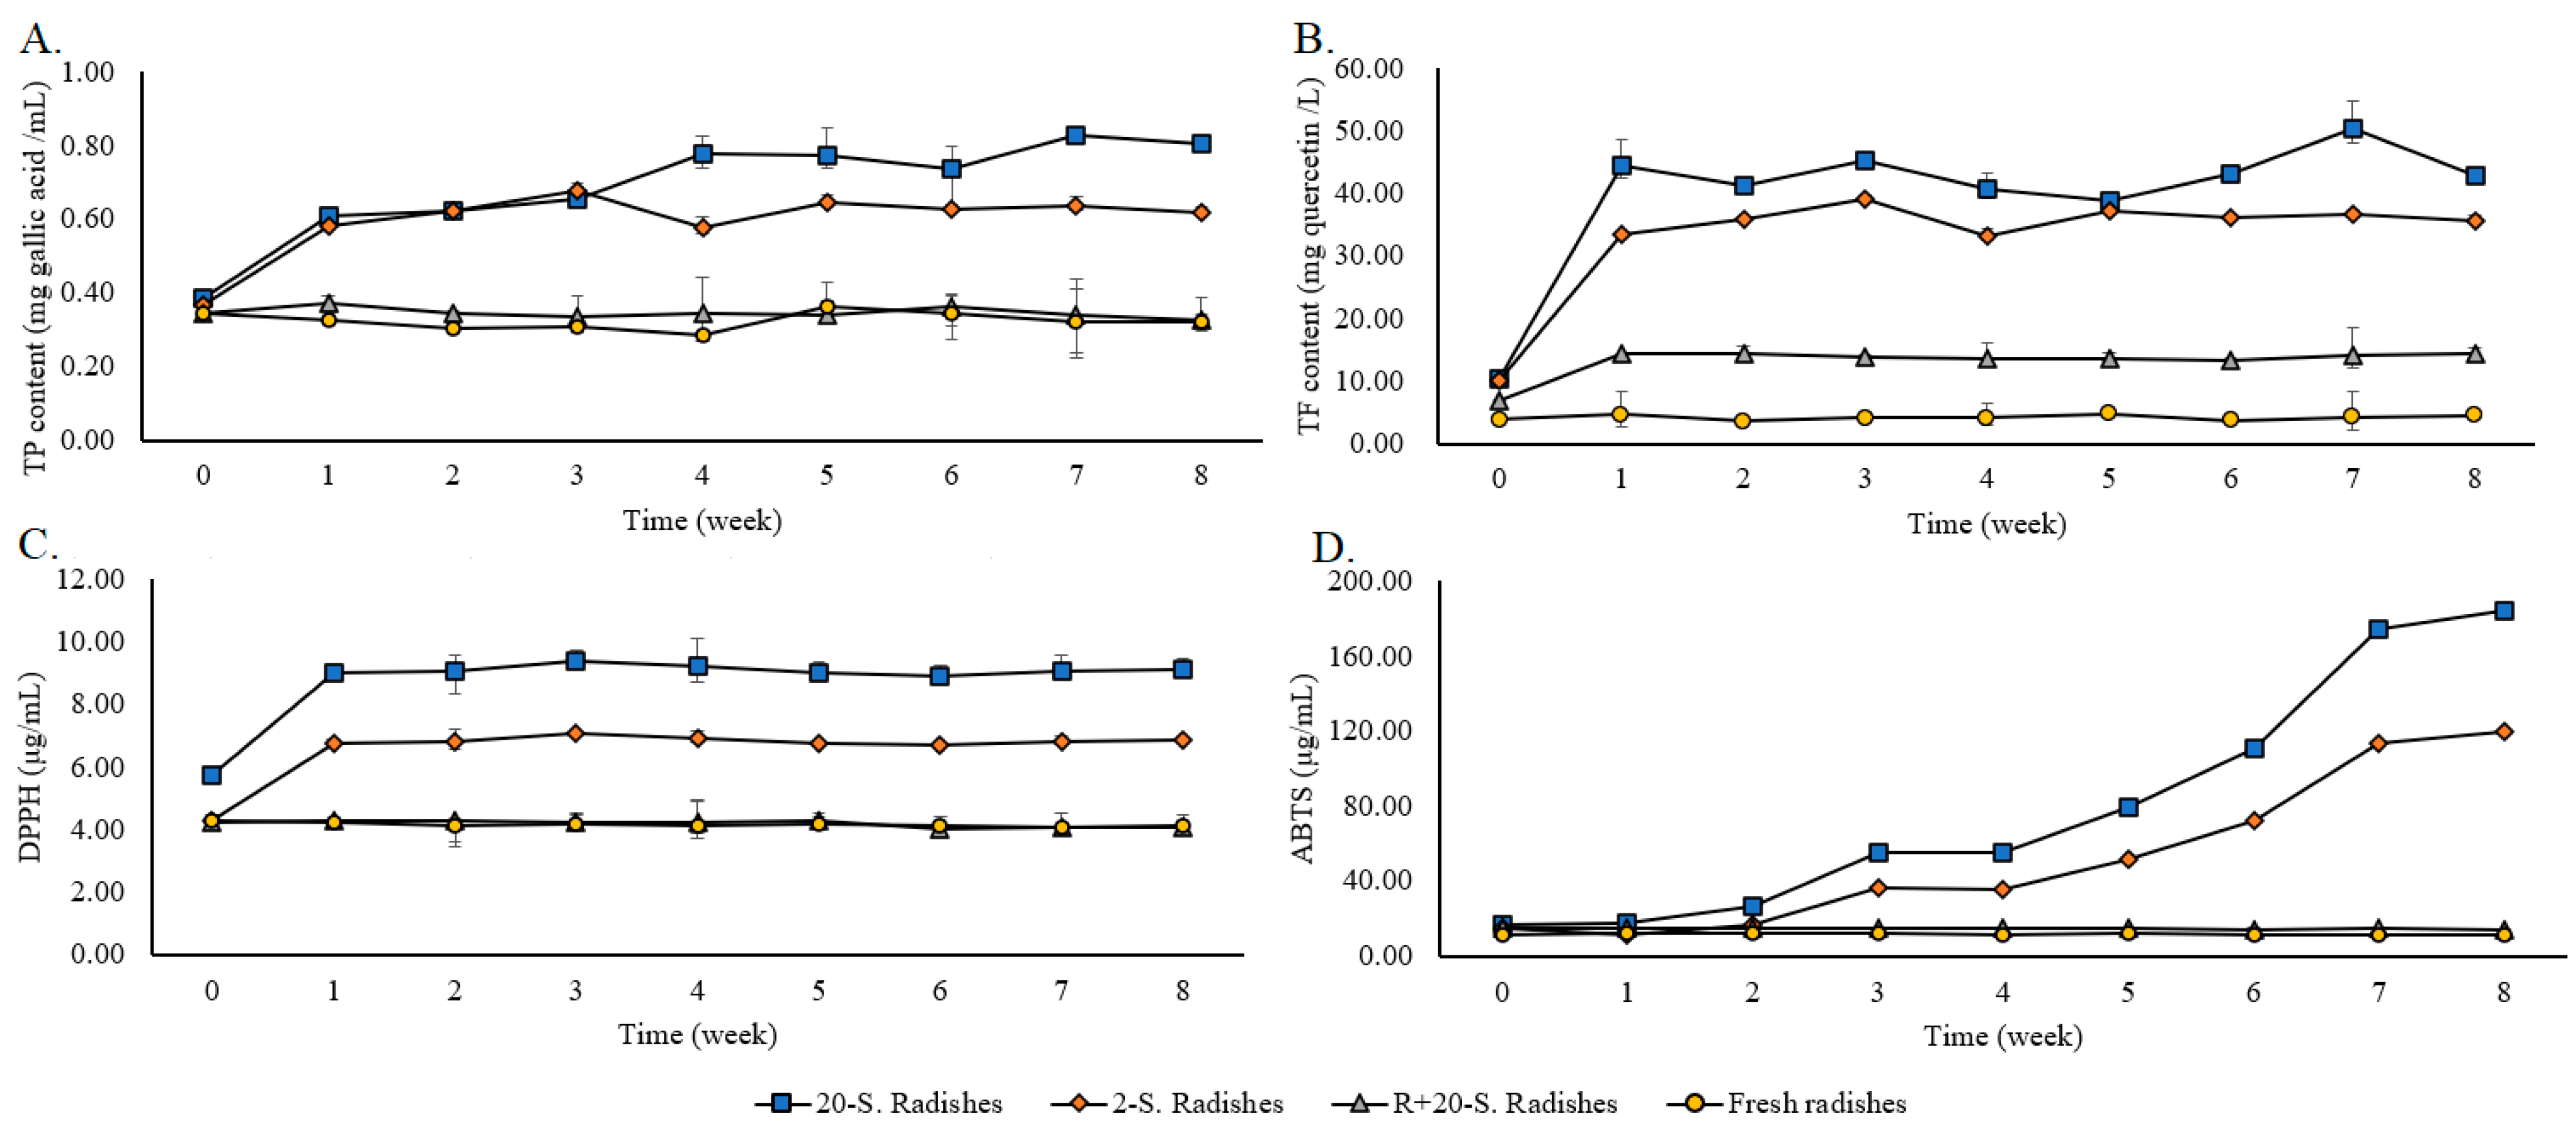
3.4.1. Effects of TPC Concentration

Polyphenolic compounds found in fruits and vegetables have the capability to exhibit antioxidant effects in living organisms [25]. Three weeks into fermentation, the TPC performance of 20-S. radishes and 2-S. radishes was very close. By the fourth week, significant differences began to emerge between the two. After 8 weeks of fermentation, the highest TPC was observed in 20-S. radishes, reaching 0.81 ± 0.01 mg/mL (Figure 4A), followed by 2-S. radishes at 0.62 ± 0.01 mg/mL. R + 20-S. radishes and fresh radishes were both very close to each other but significantly lower than the other two groups, with values of 0.33 ± 0.05 mg/mL and 0.32 ± 0.01 mg/mL, respectively. The increase in TPC may be due to the enzymes released by yeast breaking down the cell walls of salted and fresh radishes.

3.4.2. Effects of TFC Concentration

Fresh radishes showed the least variation in TFC after 8 weeks of fermentation, ranging from 3.87 ± 0.21 mg/L to 4.50 ± 0.54 mg/L. Among the four groups, 20-S. radishes exhibited the greatest change in TFC in the first week, increasing from 10.35 ± 0.23 mg/L to 42.78 ± 0.60 mg/L, while 2-S. radishes and R + 20-S. radishes ranged from 6.94 ± 0.14 mg/L to 35.68 ± 0.60 mg/L and from 6.94 ± 0.14 mg/L to 14.36 ± 0.86 mg/L, respectively (Figure 4B). After 8 weeks of fermentation, the TFC of 20-S. radishes and 2-S. radishes was significantly higher than the other two groups, with values of 42.78 ± 0.60 g/L and 35.68 ± 0.60 mg/L, respectively. This may be attributed to salted radishes being rich in polysaccharides, proteins, carbohydrates, and organic compounds, leading to the generation of more flavonoids during the fermentation process. Flavonoid molecules typically possess numerous hydroxyl groups and often exhibit significant antioxidant properties [26].

3.4.3. Effects of ABTS Radical Scavenging Activity

In the first week of fermentation, the ABTS radical scavenging performance of the four groups was similar. From the second week onwards, the 20-S. radishes gradually increased, reaching 184.42 ± 0.28 μg/mL by the eighth week, a 1003.12% increase (Figure 4D). The 2-S. radishes followed at 119.87 ± 0.38 μg/mL, while R + 20-S. radishes and fresh radishes showed little change during the fermentation process. This indicates that aged radishes, both before and after fermentation, had a stronger ability to remove free radicals compared to fresh radishes. The increased scavenging activity of aged garlic extract compared to fresh garlic extract was found to be akin to the antioxidant capacity of ascorbic acid, possibly due to the elevated polyphenolic content in aged garlic extract [27].
Although the TFC of 20-S. radishes decreased in the 8th week, leading to the conversion into other polyphenolic compounds, its antioxidant capacity did not decrease as a result [28,29]. This outcome established strong associations between antioxidant activity and the generation of phenols and flavonoids, highlighting these components as primary factors contributing to antioxidant capacity.

3.4.4. Effects of DPPH Radical Scavenging Activity

The DPPH radical is one of the most effective methods for antioxidant assessment and determining the free radical scavenging activity of plant extracts. In week 0 of fermentation, the DPPH radical scavenging activity of 20-S. radishes was slightly higher at 5.74 ± 0.19 μg/mL compared to the other three groups. By the 1st week of fermentation, it reached 9.03 ± 0.02 μg/mL, and by the 8th week, there was no significant change (9.13 ± 0.28 μg/mL) (Figure 4C). The DPPH radical scavenging activity of 2-S. radishes also increased slightly in the 1st week (6.78 ± 0.10 μg/mL) and remained relatively stable by the 8th week (6.84 ± 0.09 μg/mL). The data for the other two groups, R + 20-S. radishes and fresh radishes, were similar, with values of 4.05 ± 0.08 μg/mL and 4.12 ± 0.26 μg/mL, respectively, by the 8th week. The limited alteration in DPPH radical levels compared to ABTS radical levels can be attributed to the superior solubility and reactivity of ABTS+ radicals in both water and organic solvents, whereas DPPH exhibits lower reaction efficiency in aqueous solutions. The 20-S. radishes and 2-S. radishes contain more polar phenolic compounds with multiple phenolic hydroxyl groups in their molecules. Therefore, the ABTS+ method may be more sensitive and able to more clearly detect the antioxidant activity of polyphenolic compounds.

4. Conclusions

This study separately fermented 20-S. radishes, 2-S. radishes, R + 20-S. radishes, and fresh radishes in EGS for 8 weeks. All groups were identified as Pichia manshurica LYC1722. R + 20-S. radishes had the highest microbial count in the 8th week, with a significant difference compared to the other three groups. Among the functional components after 8 weeks of fermentation, GABA and glucuronic acid in R + 20-S. radishes were much higher than the other three groups. However, fresh radishes showed slightly higher ACE inhibition activity than the other three groups. In terms of antioxidant components, TPC and TFC in R + 20-S. radishes were the highest among the four groups. In antioxidant capacity, ABTS and DPPH radical scavenging activity was also significantly higher in R + 20-S. radishes compared to the other three groups. As a result, 20-S. radishes fermented with EGS as a starter present a novel opportunity for creating a functional beverage: a natural, healthful, and innovative option.

Author Contributions

Conceptualization, C.-F.W. and Y.-C.L.; methodology, Y.-C.L.; software, C.-R.H.; validation, C.-F.W. and Y.-C.L.; formal analysis, C.-R.H.; investigation, C.-R.H.; resources, C.-F.W. and Y.-C.L.; data curation, C.-R.H.; writing—original draft preparation, C.-F.W.; writing—review and editing, Y.-C.L.; visualization, C.-R.H.; supervision, Y.-C.L.; project administration, Y.-C.L.; funding acquisition, C.-F.W. and Y.-C.L. All authors have read and agreed to the published version of the manuscript.

Funding

This research received no external funding.

Data Availability Statement

The original contributions presented in the study are included in the article, further inquiries can be directed to the corresponding author.

Conflicts of Interest

The authors declare no conflict of interest.

References

  1. Meyer, C. Vegetarian Medicines; Spanner Books: Morgantown, WV, USA, 1981; ISBN 0914875493. [Google Scholar]
  2. Lim, H.-W.; Song, K.-Y.; Chon, J.-W.; Jeong, D.; Seo, K.-H. Antimicrobial Action of Raphanus raphanistrum Subsp. Sativus (Radish) Extracts against Foodborne Bacteria Present in Various Milk Products: A Preliminary Study. J. Milk Sci. Biotechnol. 2019, 37, 187–195. [Google Scholar] [CrossRef]
  3. Sevindik, M.; Onat, C.; Mohammed, F.S.; Uysal, İ.; Koçer, O. Antioxidant and Antimicrobial Activities of White Radish. Turkish J. Agric.-Food Sci. Technol. 2023, 11, 372–375. [Google Scholar] [CrossRef]
  4. Shukla, S.; Chatterji, S.; Mehta, S.; Rai, P.K.; Singh, R.K.; Yadav, D.K.; Watal, G. Antidiabetic Effect of Raphanus Sativus Root Juice. Pharm. Biol. 2011, 49, 32–37. [Google Scholar] [CrossRef] [PubMed]
  5. Ippoushi, K.; Takeuchi, A.; Ito, H.; Horie, H.; Azuma, K. Antioxidative Effects of Daikon Sprout (Raphanus sativus L.) and Ginger (Zingiber Officinale Roscoe) in Rats. Food Chem. 2007, 102, 237–242. [Google Scholar] [CrossRef]
  6. Li, J.; Huang, S.Y.; Deng, Q.; Li, G.; Su, G.; Liu, J.; David Wang, H.M. Extraction and Characterization of Phenolic Compounds with Antioxidant and Antimicrobial Activities from Pickled Radish. Food Chem. Toxicol. 2020, 136, 111050. [Google Scholar] [CrossRef]
  7. Jing, P.; Song, L.H.; Shen, S.Q.; Zhao, S.J.; Pang, J.; Qian, B.J. Characterization of Phytochemicals and Antioxidant Activities of Red Radish Brines during Lactic Acid Fermentation. Molecules 2014, 19, 9675–9688. [Google Scholar] [CrossRef]
  8. Sawada, K.; Koyano, H.; Yamamoto, N.; Yamada, T. The Effects of Vegetable Pickling Conditions on the Dynamics of Microbiota and Metabolites. PeerJ 2021, 9, e11123. [Google Scholar] [CrossRef]
  9. Gong, L.; Li, T.; Feng, J.; Yin, J.; Zou, X.; Wang, J.; Wang, B. Enhanced DPPH Radical Scavenging Activity and Enriched γ-Aminobutyric Acid in Mulberry Juice Fermented by the Probiotic Lactobacillus Brevis S3. Fermentation 2023, 9, 829. [Google Scholar] [CrossRef]
  10. Tashiro, K.; Sakakibara, H.; Yokoyama, D.; Uehara, T.; Matsuura, Y.; Sakono, M. Consumption of Salted Pickles of Sun-Dried Radish Roots (Raphanus Sativus Cv. YR-Hyuga-Risou) Attenuates Blood Pressure in Spontaneously Hypertensive Rats. Food Sci. Technol. Res. 2017, 23, 757–763. [Google Scholar] [CrossRef]
  11. Wang, C.F.; Huang, C.R.; Lu, Y.C. Changes in Bio-Functional Compounds, ACE Inhibition, and Antioxidant Capacity after Mixed Fermentation of Eight Whole Grains. Fermentation 2023, 9, 209. [Google Scholar] [CrossRef]
  12. Lee, D.H.; Kim, S.H.; Lee, C.Y.; Jo, H.W.; Lee, W.H.; Kim, E.H.; Choi, B.K.; Huh, C.K. Screening of Acetic Acid Bacteria Isolated from Various Sources for Use in Kombucha Production. Fermentation 2024, 10, 18. [Google Scholar] [CrossRef]
  13. Samsonowicz, M.; Regulska, E.; Karpowicz, D.; Leśniewska, B. Antioxidant Properties of Coffee Substitutes Rich in Polyphenols and Minerals. Food Chem. 2019, 278, 101–109. [Google Scholar] [CrossRef] [PubMed]
  14. de Souza Gois Barbosa, M.; dos Santos Scholz, M.B.; Kitzberger, C.S.G.; Benassi, M.d.T. Correlation between the Composition of Green Arabica Coffee Beans and the Sensory Quality of Coffee Brews. Food Chem. 2019, 292, 275–280. [Google Scholar] [CrossRef] [PubMed]
  15. Wang, C.F.; Huang, C.R.; Lu, Y.C. Changes in the Bio-Compounds and Biological Activities of Eight Whole Grains Fermentation Starter with Different Oxidized Chin-Shin Oolong Teas. Foods 2023, 12, 1643. [Google Scholar] [CrossRef]
  16. Hayat, A.; Jahangir, T.M.; Khuhawar, M.Y.; Alamgir, M.; Hussain, Z.; Haq, F.U.; Musharraf, S.G. HPLC Determination of Gamma Amino Butyric Acid (GABA) and Some Biogenic Amines (BAs) in Controlled, Germinated, and Fermented Brown Rice by Pre-Column Derivatization. J. Cereal Sci. 2015, 64, 56–62. [Google Scholar] [CrossRef]
  17. Hayat, A.; Jahangir, T.M.; Khuhawar, M.Y.; Alamgir, M.; Siddiqui, A.J.; Musharraf, S.G. Simultaneous HPLC Determination of Gamma Amino Butyric Acid (GABA) and Lysine in Selected Pakistani Rice Varieties by Pre-Column Derivatization with 2-Hydroxynaphthaldehyde. J. Cereal Sci. 2014, 60, 356–360. [Google Scholar] [CrossRef]
  18. Je, J.; Park, J.; Jung, W.; Park, P.; Kim, S. Isolation of Angiotensin I Converting Enzyme (ACE) Inhibitor from Fermented Oyster Sauce, Crassostrea Gigas. Food Chem. 2005, 90, 809–814. [Google Scholar] [CrossRef]
  19. Rai, A.K.; Pandey, A.; Sahoo, D. Biotechnological Potential of Yeasts in Functional Food Industry. Trends Food Sci. Technol. 2019, 83, 129–137. [Google Scholar] [CrossRef]
  20. Xiao, Y.; Zhang, S.; Liu, Z.; Wang, T.; Cai, S.; Chu, C.; Hu, X.; Yi, J. Effect of Inoculating Pichia Spp. Starters on Flavor Formation of Fermented Chili Pepper: Metabolomics and Genomics Approaches. Food Res. Int. 2023, 173, 113397. [Google Scholar] [CrossRef]
  21. Greppi, A.; Saubade, F.; Botta, C.; Humblot, C.; Guyot, J.P.; Cocolin, L. Potential Probiotic Pichia Kudriavzevii Strains and Their Ability to Enhance Folate Content of Traditional Cereal-Based African Fermented Food. Food Microbiol. 2017, 62, 169–177. [Google Scholar] [CrossRef]
  22. Hong, F.; Ming, L.; Yi, S.; Zhanxia, L.; Yongquan, W.; Chi, L. The Antihypertensive Effect of Peptides: A Novel Alternative to Drugs? Peptides 2008, 29, 1062–1071. [Google Scholar] [CrossRef] [PubMed]
  23. Liu, C.F.; Tung, Y.T.; Wu, C.L.; Lee, B.H.; Hsu, W.H.; Pan, T.M. Antihypertensive Effects of Lactobacillus-Fermented Milk Orally Administered to Spontaneously Hypertensive Rats. J. Agric. Food Chem. 2011, 59, 4537–4543. [Google Scholar] [CrossRef] [PubMed]
  24. Vīna, I.; Linde, R.; Patetko, A.; Semjonovs, P. Glucuronic Acid from Fermented Beverages: Biochemical Functions in Humans and Its Role in Health Protection. Int. J. Recent Res. Appl. Stud. 2013, 14, 217–230. [Google Scholar]
  25. Hung, R.J.; Chien, H.S.; Lin, R.Z.; Lin, C.T.; Vatsyayan, J.; Peng, H.L.; Chang, H.Y. Comparative Analysis of Two UDP-Glucose Dehydrogenases in Pseudomonas Aeruginosa PAO1. J. Biol. Chem. 2007, 282, 17738–17748. [Google Scholar] [CrossRef]
  26. Villaño, D.; Lettieri-Barbato, D.; Guadagni, F.; Schmid, M.; Serafini, M. Effect of Acute Consumption of Oolong Tea on Antioxidant Parameters in Healthy Individuals. Food Chem. 2012, 132, 2102–2106. [Google Scholar] [CrossRef]
  27. Kim, J.S.; Kang, O.J.; Gweon, O.C. Comparison of Phenolic Acids and Flavonoids in Black Garlic at Different Thermal Processing Steps. J. Funct. Foods 2013, 5, 80–86. [Google Scholar] [CrossRef]
  28. Elosta, A.; Slevin, M.; Rahman, K.; Ahmed, N. Aged Garlic Has More Potent Antiglycation and Antioxidant Properties Compared to Fresh Garlic Extract in Vitro. Sci. Rep. 2017, 7, 39613. [Google Scholar] [CrossRef]
  29. El-Beltagi, H.S.; Ahmed, O.K.; El-Desouky, W. Effect of Low Doses γ-Irradiation on Oxidative Stress and Secondary Metabolites Production of Rosemary (Rosmarinus officinalis L.) Callus Culture. Radiat. Phys. Chem. 2011, 80, 968–976. [Google Scholar] [CrossRef]
Figure 1. Changes in (A) pH value and (B) acidity during the fermentation process of 20-S. radishes, 2-S. radishes, R + 20-radishes, and fresh radishes. The mean values ± standard variation of three replications indicate a significant difference at p < 0.05.
Fermentation 10 00479 g001
Figure 2. Effect of ACE inhibition activity of 20-S. radishes, 2-S. radishes, R + 20-S. radishes, and fresh radishes fermented with two different oxidized levels: before fermentation and after 8 weeks.
Fermentation 10 00479 g002
Figure 3. Changes in (A) GABA content and (B) glucuronic acid content during the fermentation process of 20-S. radishes, 2-S. radishes, R + 20-radishes, and fresh radishes. The mean values ± standard variation of three replications indicated a significant difference at p < 0.05.
Fermentation 10 00479 g003
Figure 4. Changes in the antioxidant contents and capacity of 20-S. radishes, 2-S. radishes, R + 20-S. radishes, and fresh radishes during fermentation. (A) Total phenol (TP) content, (B) total flavonoid (TF) content, (C) DPPH antioxidant capacity, and (D) ABTS antioxidant capacity. The mean values ± standard variation of three replications indicated a significant difference at p < 0.05.
Fermentation 10 00479 g004
Table 1. The variation in bacteria counts of Pichia manshurica (log CFU/mL) during the fermentation of different oxidized teas.
Week20-S. Radishes2-S. RadishesR + 20-S. RadishesFresh Radishes
01.40 ± 0.02 aC1.43 ± 0.03 fC1.32 ± 0.03 aB1.26 ± 0.01 aA
18.06 ± 0.06 bB1.30 ± 0.01 abA1.48 ± 0.02 bcA1.43 ± 0.02 deA
29.42 ± 0.06 cB1.34 ± 0.02 bcA1.50 ± 0.02 cdA1.40 ± 0.02 bcA
39.99 ± 0.03 dC1.28 ± 0.01 aA1.46 ± 0.02 bB1.46 ± 0.02 eB
410.39 ± 0.01 deD1.40 ± 0.03 eB1.34 ± 0.04 aA1.56 ± 0.02 fC
510.49 ± 0.04 efB1.51 ± 0.02 gA1.53 ± 0.01 dA1.53 ± 0.03 fA
610.87 ± 0.02 fgD1.38 ± 0.02 deA1.50 ± 0.02 cdC1.41 ± 0.02 cdB
711.07 ± 0.04 gD1.52 ± 0.02 gB1.45 ± 0.02 bA1.56 ± 0.02 fC
811.08 ± 0.03 gC1.36 ± 0.02 cdA1.51 ± 0.02 cdB1.38 ± 0.01 bA
Values are expressed as the mean ± SD. Means in the same line followed by different letters are significantly different (p < 0.05). (p < 0.05) based on the one-way analysis of variance (ANOVA). The letters “a, b, c, d, e, f and g” mark significant differences in single samples. The letters “A, B, C and D” mark significant differences in different samples.
Table 2. Glucose value (ppm) changes in different samples from weeks 0 to 8 of fermentation.
Week20-S. Radishes2-S. RadishesR + 20-S. RadishesFresh Radishes
063.31 ± 0.42 d53.33 ± 0.99 d56.14 ± 0.66 e69.60 ± 0.59 e
151.16 ± 0.61 abc55.43 ± 2.56 d58.34 ± 3.84 e67.95 ± 3.45 e
242.52 ± 3.25 a34.45 ± 0.69 bc36.26 ± 0.58 cd48.62 ± 0.88 c
352.52 ± 0.83 c37.12 ± 3.20 c28.55 ± 2.56 abc58.46 ± 2.30 d
448.19 ± 1.76 abc38.87 ± 0.65 c30.39 ± 5.51 bcd42.07 ± 0.50 b
551.63 ± 3.26 bc34.42 ± 2.20 c36.23 ± 3.26 d37.23 ± 2.93 b
653.33 ± 0.86 bc20.56 ± 0.36 a21.64 ± 1.57 a29.03 ± 1.43 a
742.63 ± 0.81 a26.69 ± 2.66 ab28.10 ± 2.68 abc34.68 ± 2.41 ab
845.68 ± 0.50 ab20.81 ± 0.33 a21.90 ± 0.08 ab28.55 ± 0.45 a
Values are expressed as the mean ± SD. Means in the same line followed by different letters are significantly different (p < 0.05). (p < 0.05) based on the one-way analysis of variance (ANOVA). The letters “a, b, c, d, e” mark significant differences.
Table 3. Fructose value (ppm) changes in different samples from weeks 0 to 8 of fermentation.
Week20-S. Radishes2-S. RadishesR + 20-S. RadishesFresh Radishes
0798.46 ± 17.01 a740.79 ± 22.40 a779.78 ± 36.94 a798.03 ± 60.31 ab
1867.34 ± 27.69 bcd747.79 ± 23.68 a787.14 ± 20.05 a754.81 ± 42.92 a
2832.92 ± 40.29 abc740.86 ± 33.09 a779.85 ± 79.71 a956.76 ± 36.36 d
3916.13 ± 80.82 d818.86 ± 28.91 b861.96 ± 19.70 a755.00 ± 72.73 a
4763.06 ± 8.57 a821.46 ± 21.73 b833.11 ± 59.16 a775.98 ± 7.71 a
5913.45 ± 26.16 cd811.07 ± 14.66 b853.75 ± 31.58 a897.54 ± 23.55 cd
6927.25 ± 3.53 d782.37 ± 44.89 ab823.55 ± 58.42 a853.51 ± 3.18 bc
7953.06 ± 1.93 d777.53 ± 30.46 ab818.45 ± 14.12 a789.37 ± 1.73 ab
8819.17 ± 16.72 ab793.43 ± 39.73 ab835.19 ± 10.81 a788.94 ± 15.05 ab
Values are expressed as the mean ± SD. Means in the same line followed by different letters are significantly different (p < 0.05). (p < 0.05) based on the one-way analysis of variance (ANOVA). The letters “a, b, c, d” mark significant differences.
Table 4. Acetic acid content (ppm) changes in different samples from weeks 0 to 8 of fermentation.
Week20-S. Radishes2-S. RadishesR + 20-S. RadishesFresh Radishes
021,505.70 ± 21.13 e20,947.74 ± 47.01 f22,050.25 ± 89.71 f20,433.12 ± 90.92 f
118,796.49 ± 18.67 d14,211.13 ± 89.14 b14,959.08 ± 75.64 b15,632.74 ± 16.80 de
213,593.60 ± 42.04 c14,872.83 ± 25.55 c15,655.61 ± 52.61 c15,248.65 ± 78.39 cd
312,606.09 ± 23.73 b15,576.34 ± 13.68 de16,396.14 ± 25.94 d15,194.00 ± 21.57 bcd
412,578.19 ± 77.35 b15,528.11 ± 22.73 d16,345.38 ± 33.07 d15,011.49 ± 96.18 abc
513,516.56 ± 61.32 c15,993.26 ± 40.15 e16,835.01 ± 99.41 e15,906.17 ± 55.19 e
613,423.70 ± 39.47 c13,500.57 ± 23.12 a14,211.13 ± 65.42 a15,007.43 ± 55.28 abc
713,267.86 ± 34.50 c14,129.19 ± 51.31 b14,872.83 ± 89.66 b14,638.70 ± 31.54 ab
810,089.53 ± 71.49 a14,797.52 ± 45.07 c15,576.34 ± 38.59 c14,586.24 ± 64.34 a
Values are expressed as the mean ± SD. Means in the same line followed by different letters are significantly different (p < 0.05). (p < 0.05) based on the one-way analysis of variance (ANOVA). The letters “a, b, c, d, e, f” mark significant differences.
Disclaimer/Publisher’s Note: The statements, opinions and data contained in all publications are solely those of the individual author(s) and contributor(s) and not of MDPI and/or the editor(s). MDPI and/or the editor(s) disclaim responsibility for any injury to people or property resulting from any ideas, methods, instructions or products referred to in the content.

