
Growth of Lactiplantibacillus plantarum BG112 in Batch and Continuous Culture with Camellia sinensis as Prebiotic

 ,
, 
Abstract
:1. Introduction
2. Materials and Methods
2.1. Microorganisms and Growth Conditions
2.2. Camellia Sinensis Extract
2.3. Batch Experiments
2.4. Continuous Experiments
2.5. Growth and Analyte Determination
2.6. Mathematical Model
2.7. Improvement Analysis
2.8. Statistical Analyses
3. Results
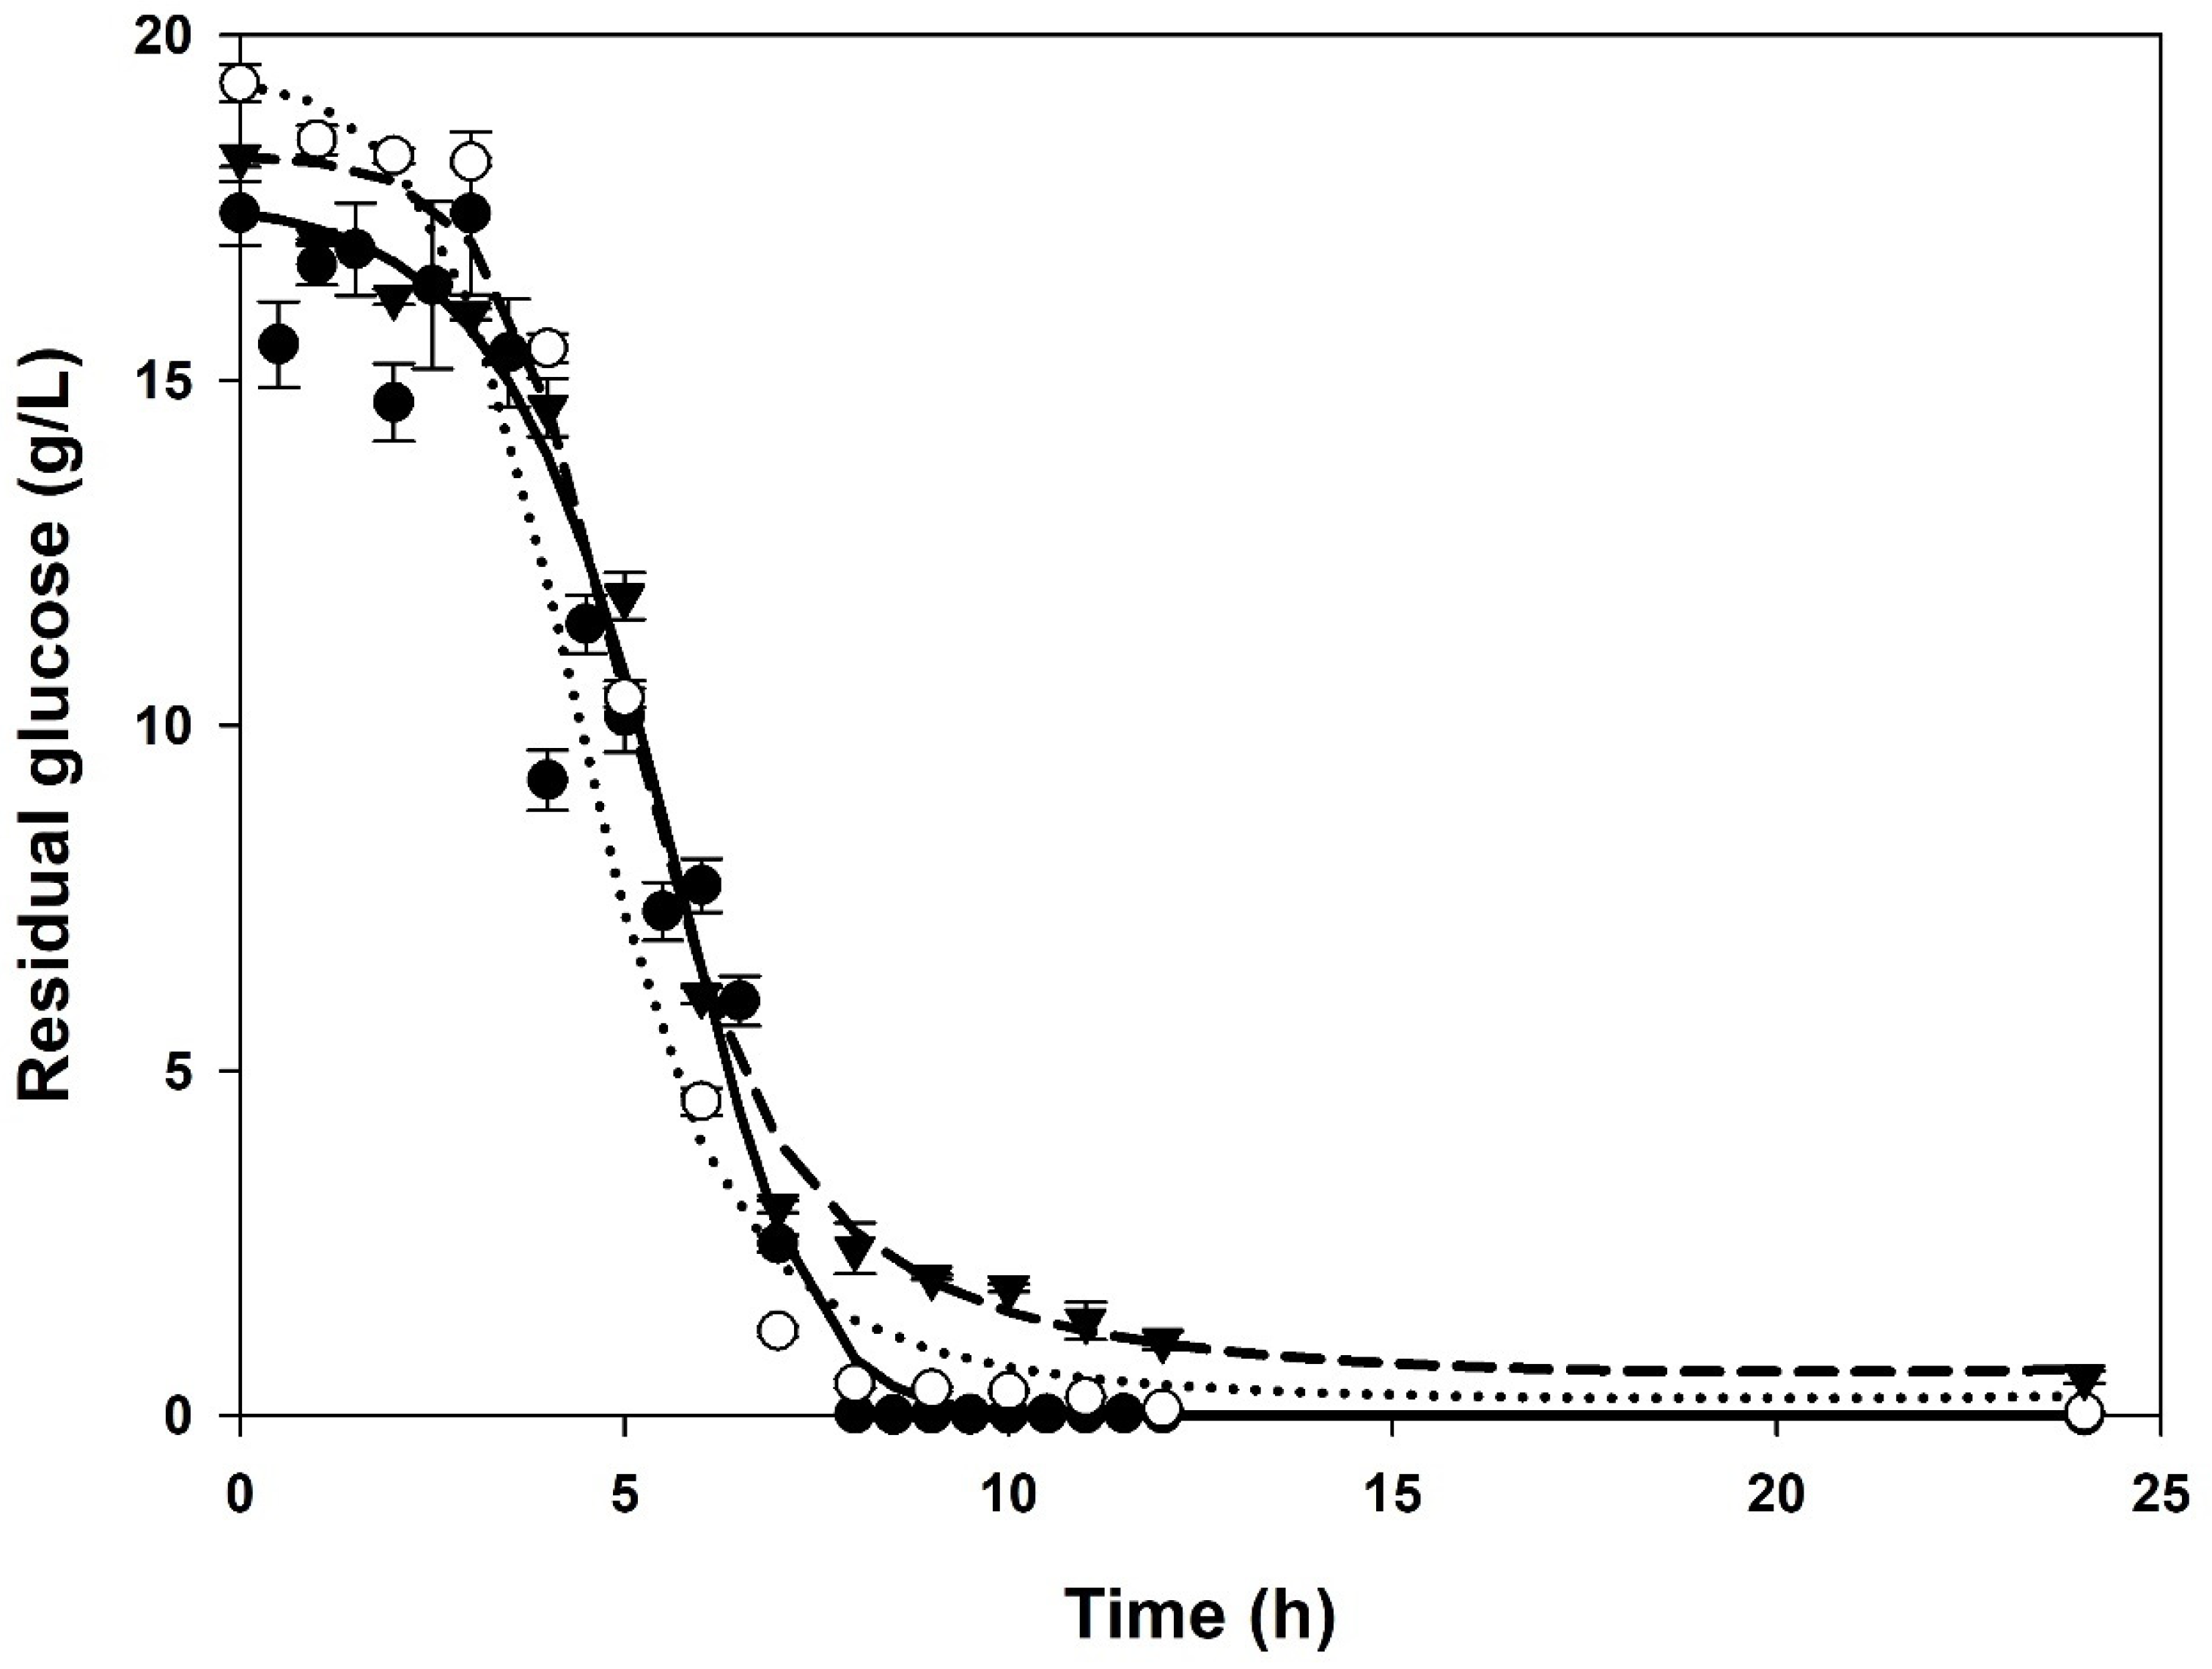
3.1. Batch Cultures
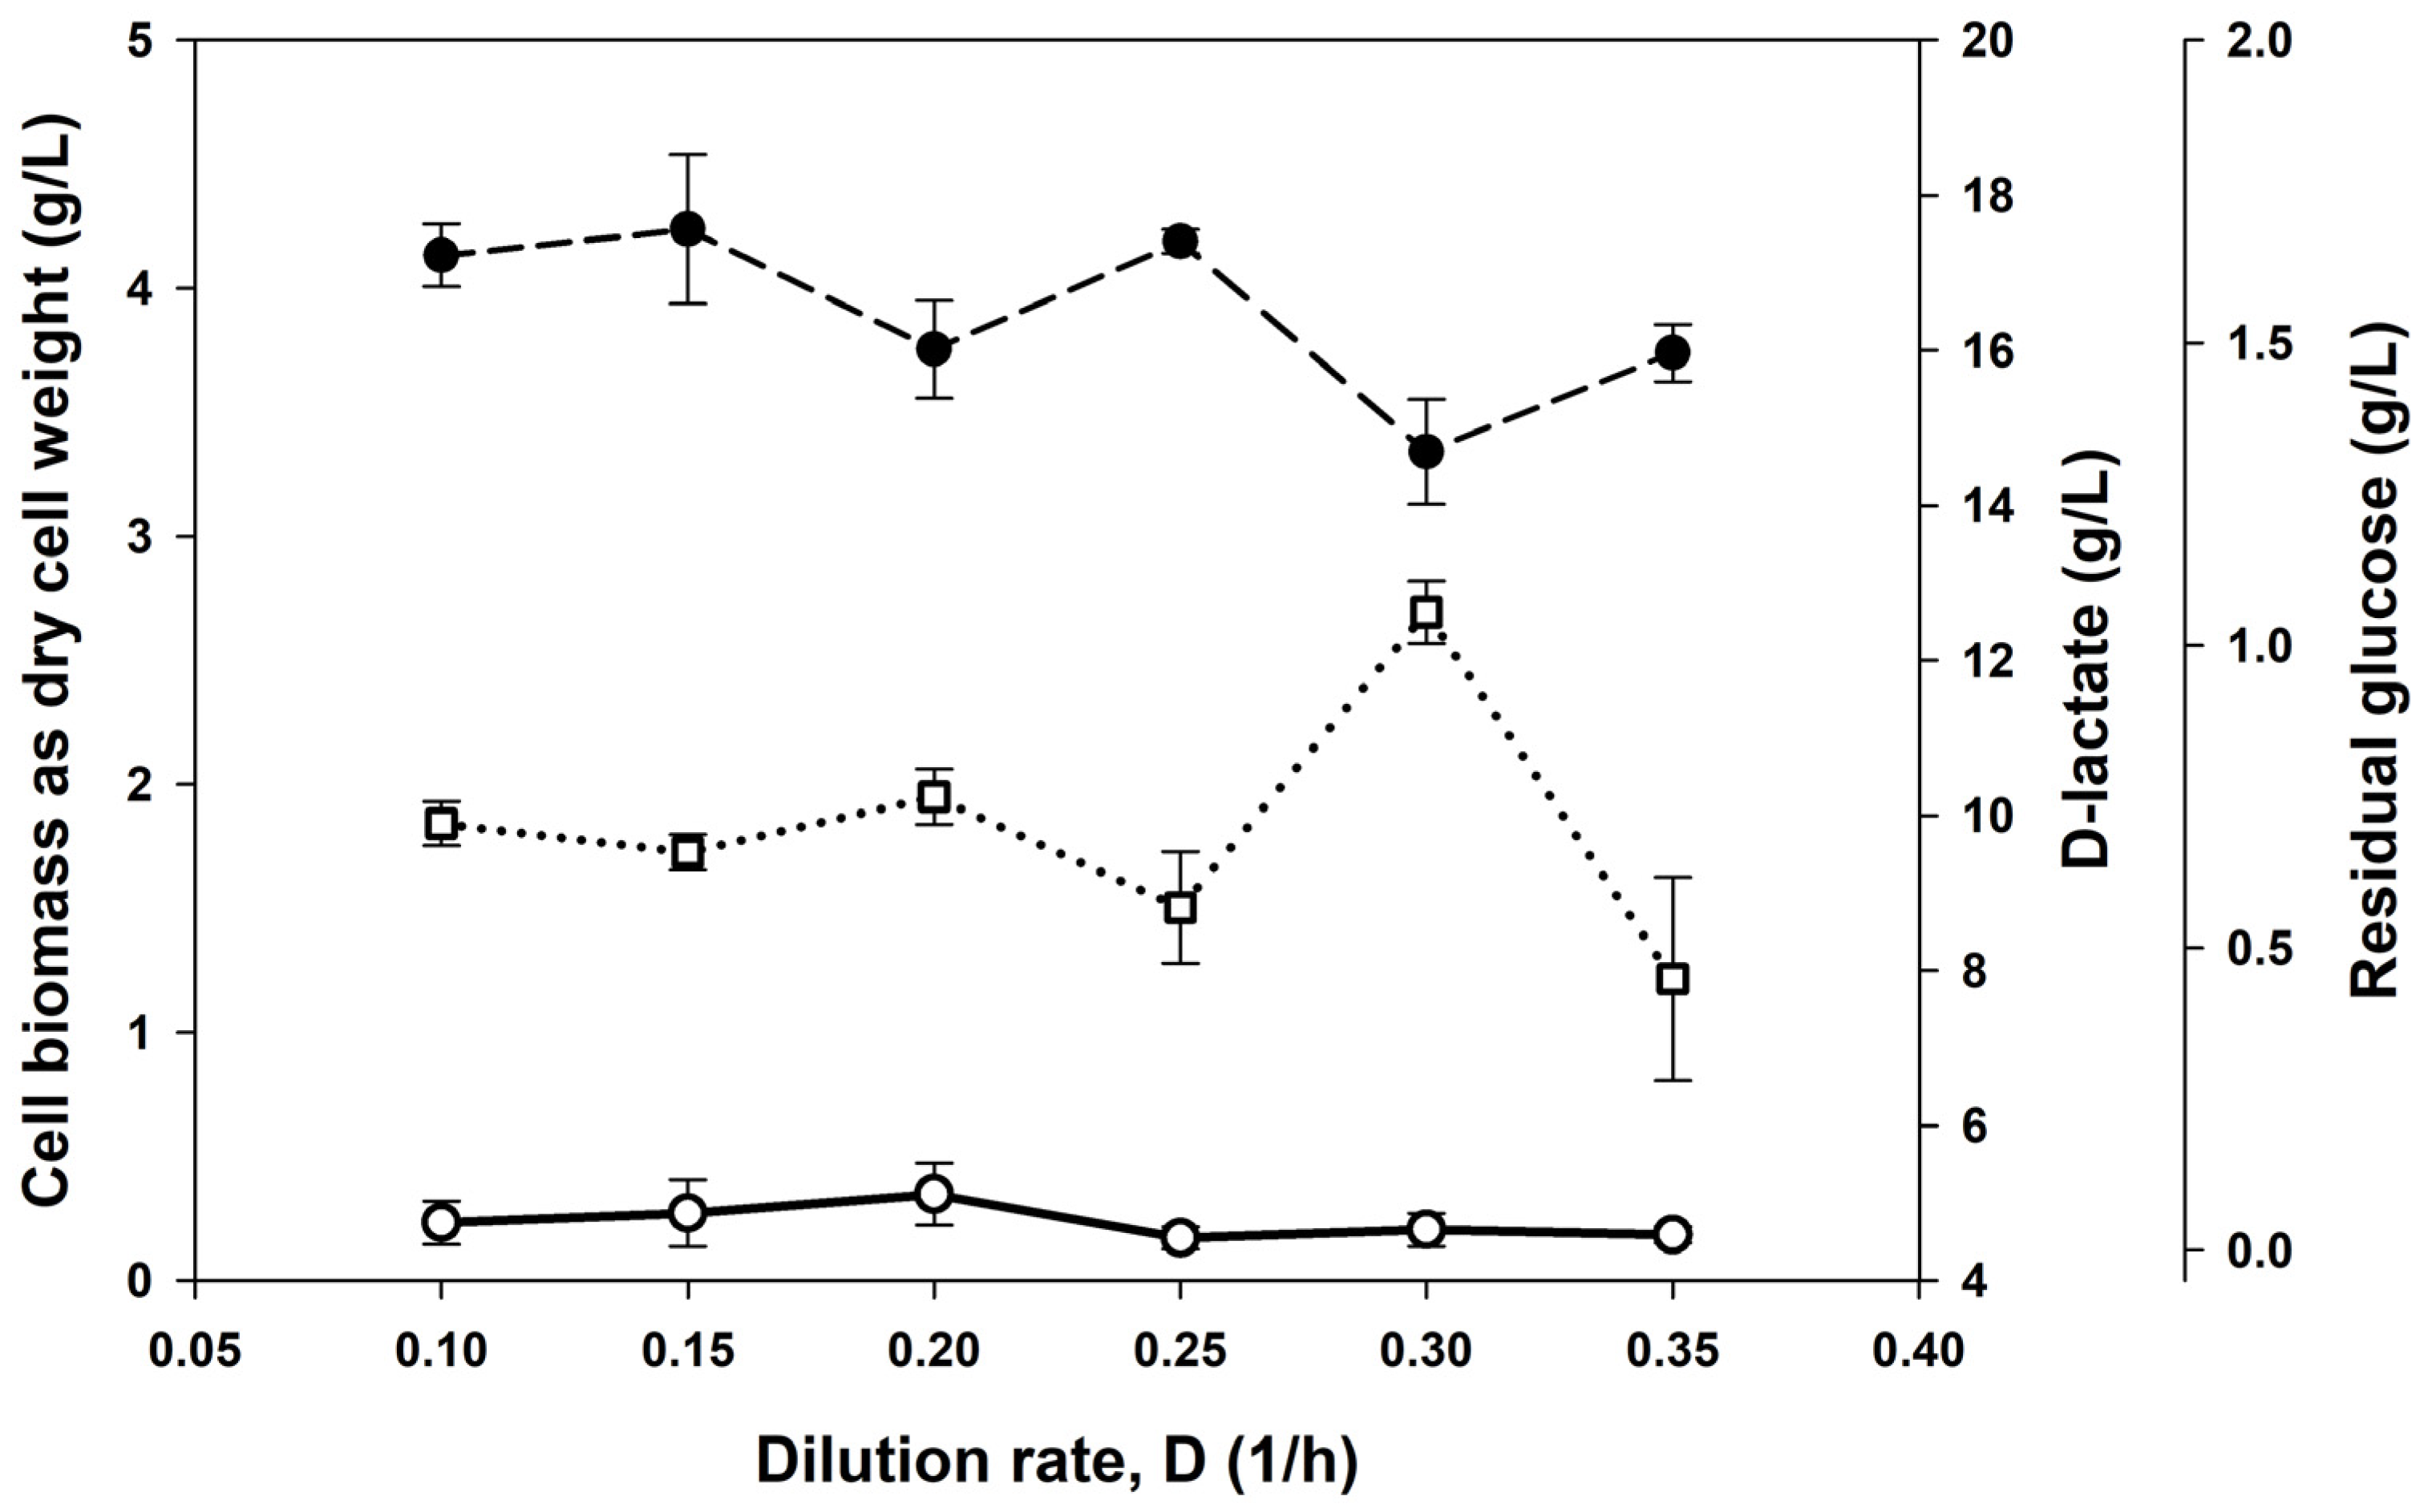
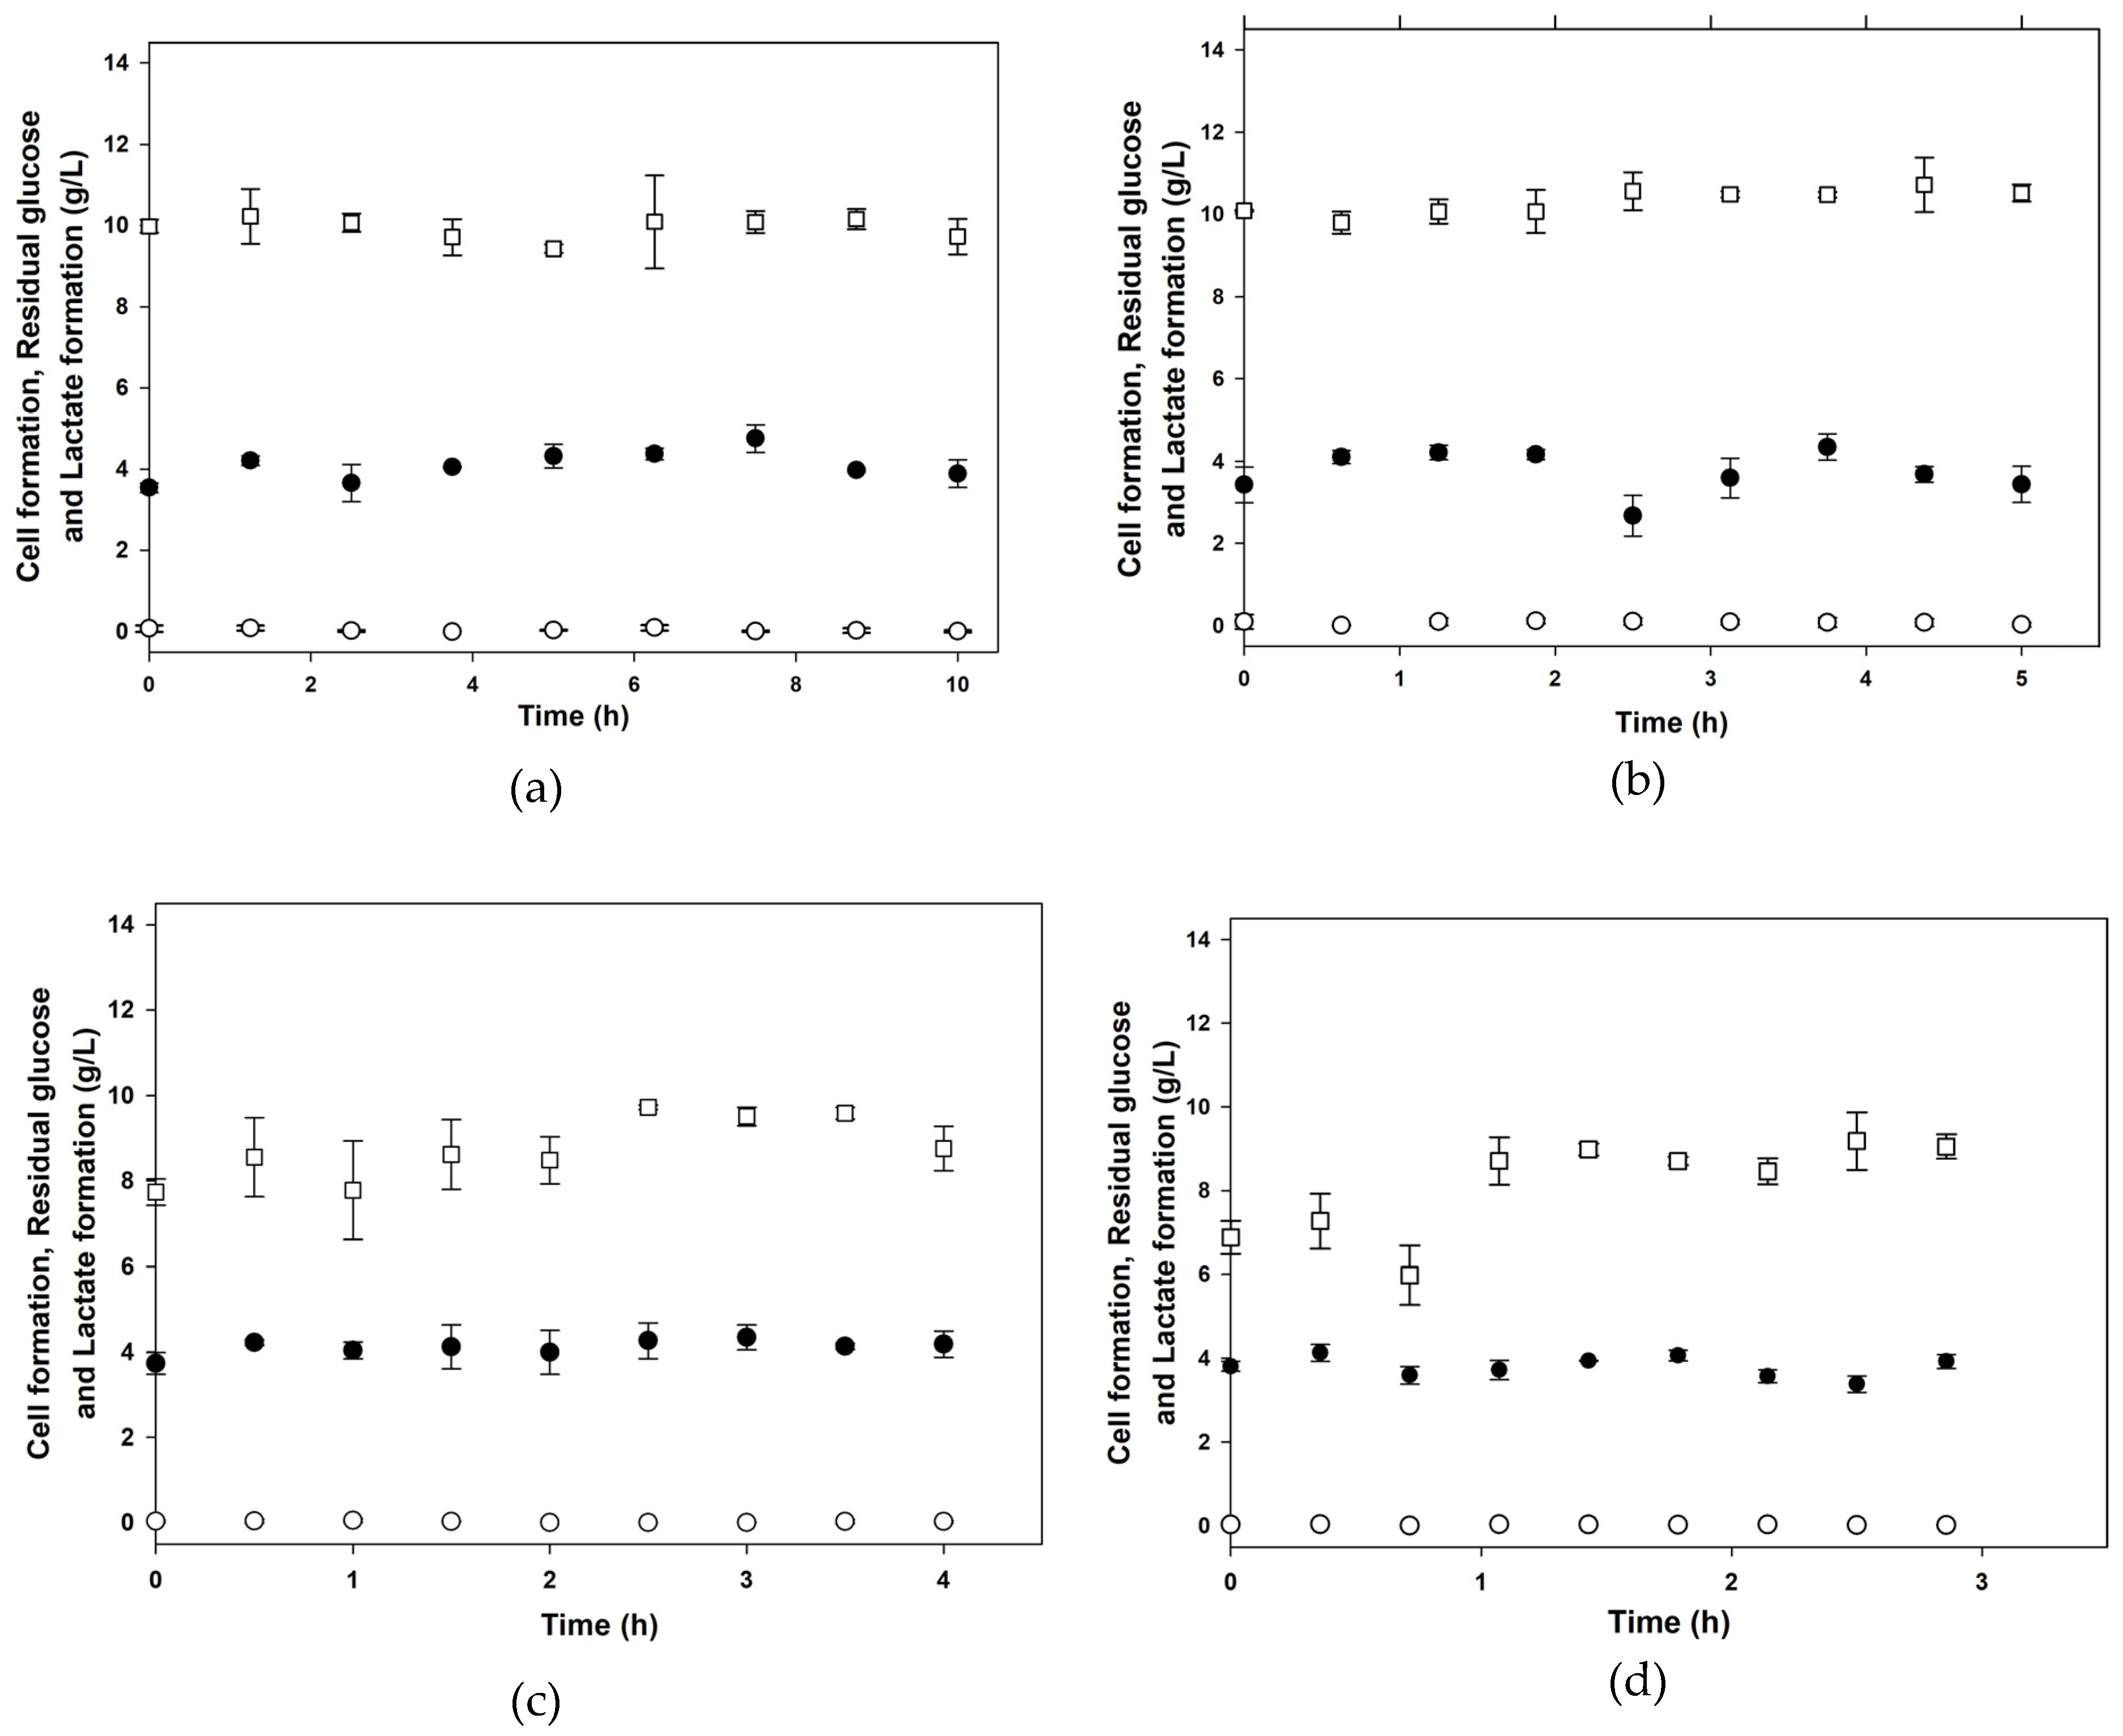
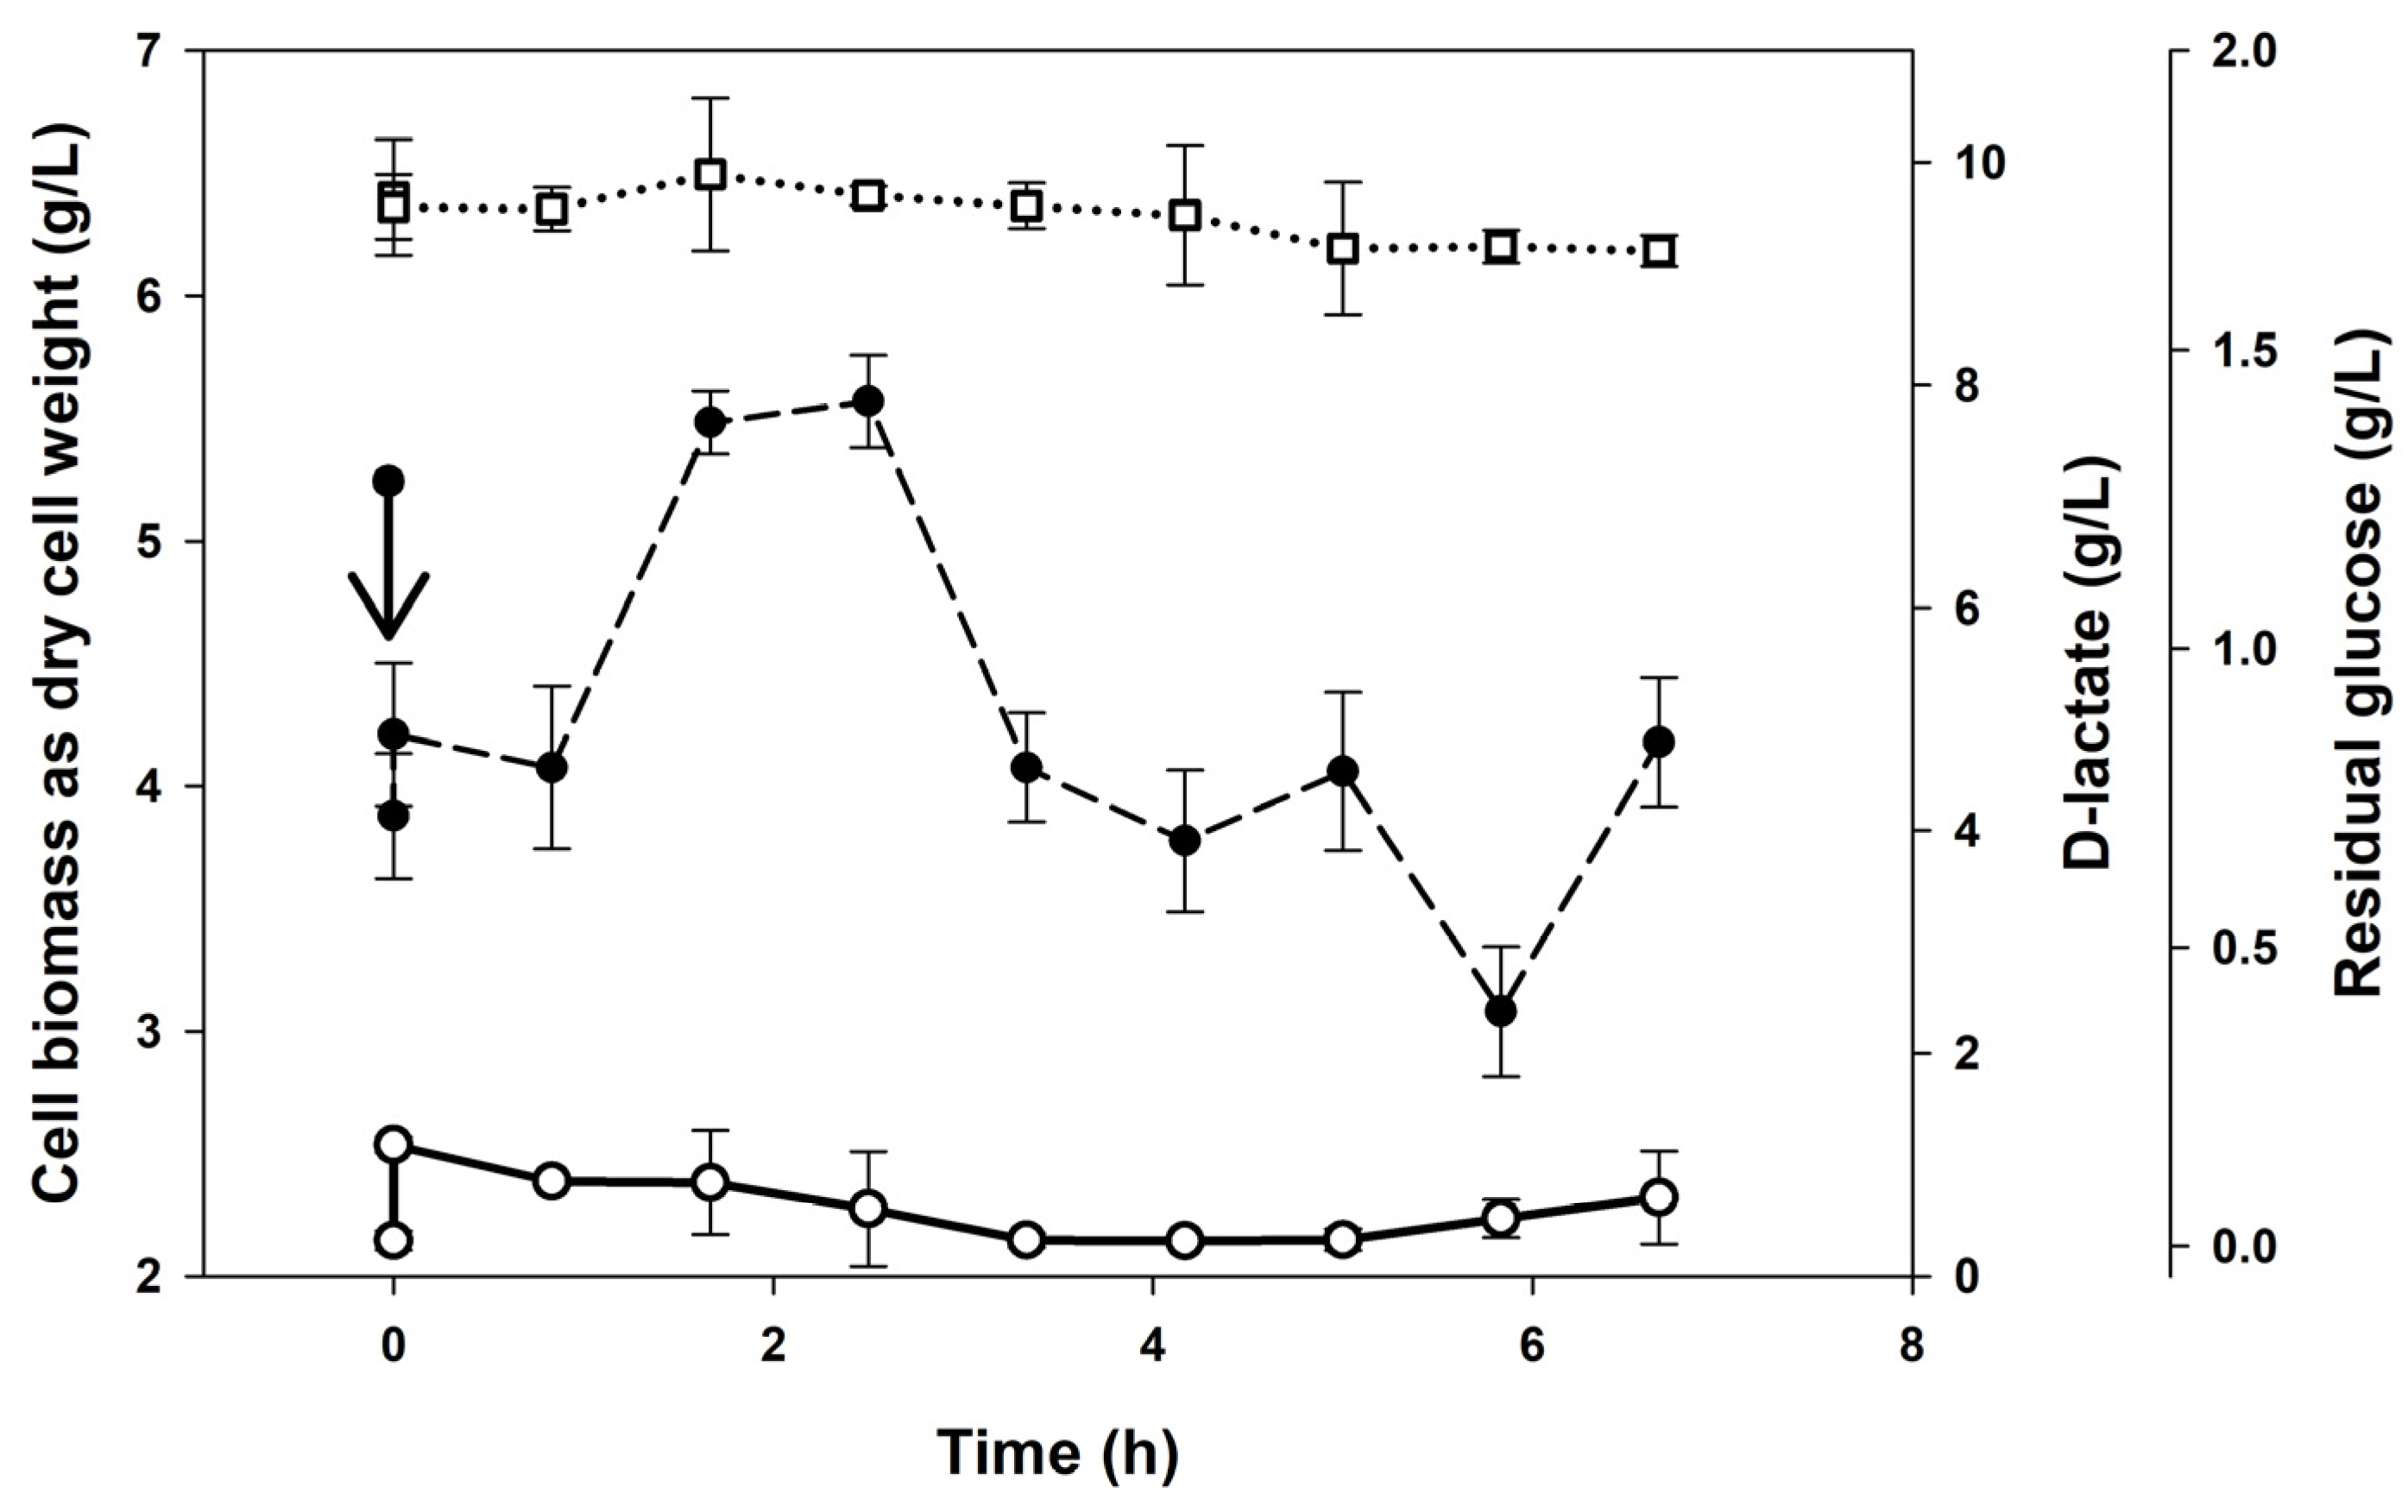
3.2. Continuous Cultures
4. Discussion
5. Conclusions
Author Contributions
Funding
Institutional Review Board Statement
Informed Consent Statement
Data Availability Statement
Acknowledgments
Conflicts of Interest
References
- Saarela, M.; Mogensen, G.; Fondén, R.; Mättö, J.; Mattila-Sandholm, T. Probiotic Bacteria: Safety, Functional and Technological Properties. J. Biotechnol. 2000, 84, 197–215. [Google Scholar] [CrossRef]
- Hill, M. Probiotics: The Scientific Basis in Gut, 1st ed.; Fuller, R., Ed.; BMJ Publishing Group: Rockville Pike MD, USA, 1993; Volume 34, pp. 863–864. [Google Scholar]
- John, R.P.; Nampoothiri, K.M.; Pandey, A. Fermentative Production of Lactic Acid from Biomass: An Overview on Process Developments and Future Perspectives. Appl. Microbiol. Biotechnol. 2007, 74, 524–534. [Google Scholar] [CrossRef]
- Kim, S.W.; Park, K.Y.; Kim, B.; Kim, E.; Hyun, C.K. Lactobacillus rhamnosus GG Improves Insulin Sensitivity and Reduces Adiposity in High-Fat Diet-Fed Mice through Enhancement of Adiponectin Production. Biochem. Biophys. Res. Commun. 2013, 431, 258–263. [Google Scholar] [CrossRef]
- Azad, M.A.K.; Sarker, M.; Li, T.; Yin, J. Probiotic Species in the Modulation of Gut Microbiota: An Overview. BioMed Res. Int. 2018, 2018, 9478630. [Google Scholar] [CrossRef]
- Melgar-Lalanne, G.; Rivera-Espinoza, Y.; Hernández-Sánchez, H. Lactobacillus Plantarum: An Overview with Emphasis in Biochemical and Healthy Properties. In Lactobacillus: Classification, Uses and Health Implications, 1st ed.; Perez-Campos, A., Mena, A.L., Eds.; Nova Publishing: New York, NY, USA, 2012; pp. 1–31. [Google Scholar]
- He, M.; Shi, B. Gut Microbiota as a Potential Target of Metabolic Syndrome: The Role of Probiotics and Prebiotics. Cell Biosci. 2017, 7, 54. [Google Scholar] [CrossRef]
- Åkerberg, C.; Hofvendahl, K.; Hahn-Hägerdal, B.; Zacchi, G. Modelling the Influence of pH, Temperature, Glucose and Lactic Acid Concentrations on the Kinetics of Lactic Acid Production by Lactococcus lactis Ssp. Lactis ATCC 19435 in Whole-Wheat Flour. Appl. Microbiol. Biotechnol. 1998, 49, 682–690. [Google Scholar] [CrossRef]
- Lejeune, R.; Callewaert, R.; Crabbé, K.; De Vuyst, L. Modelling the Growth and Bacteriocin Production by Lactoba-cillus amylovorus DCE 471 in Batch Cultivation. J. Appl. Microbiol. 1998, 84, 159–168. [Google Scholar] [CrossRef]
- Ouwehand, A.C.; Sherwin, S.; Sindelar, C.; Smith, A.B.; Stahl, B. Production of Probiotic Bifidobacteria. In The Bifidobacteria and Related Organisms, 1st ed.; Matarelli, P., Biavati, B., Holzapfel, W., Wood, B., Eds.; Academic Press: Cambridge, MA, USA, 2018; pp. 261–269. [Google Scholar]
- Cheirsilp, B.; Suksawang, S.; Yeesang, J.; Boonsawang, P. Co-Production of Functional Exopolysaccharides and Lactic Acid by Lactobacillus kefiranofaciens Originated from Fermented Milk, Kefir. J. Food Sci. Technol. 2018, 55, 331–340. [Google Scholar] [CrossRef]
- Forssten, S.D.; Sindelar, C.W.; Ouwehand, A.C. Probiotics from an Industrial Perspective. Anaerobe 2011, 17, 410–413. [Google Scholar] [CrossRef]
- Brinques, G.B.; Do Carmo Peralba, M.; Ayub, M.A.Z. Optimization of Probiotic and Lactic Acid Production by Lac-tobacillus plantarum in Submerged Bioreactor Systems. J. Ind. Microbiol. Biotechnol. 2010, 37, 205–212. [Google Scholar] [CrossRef]
- Gibson, G.R.; Probert, H.M.; Loo, J.V.; Rastall, R.A.; Roberfroid, M.B. Dietary Modulation of the Human Colonic Microbiota: Updating the Concept of Prebiotics. Nutr. Res. Rev. 2004, 17, 259–275. [Google Scholar] [CrossRef]
- Dahiya, D.K.; Renuka; Puniya, M.; Shandilya, U.K.; Dhewa, T.; Kumar, N.; Kumar, S.; Puniya, A.K.; Shukla, P. Gut Microbiota Modulation and Its Relationship with Obesity Using Prebiotic Fibers and Probiotics: A Review. Front. Microbiol. 2017, 8. [Google Scholar] [CrossRef]
- Megías-Pérez, R.; Shevchuk, A.; Zemedie, Y.; Kuhnert, N. Characterization of Commercial Green Tea Leaves by the Analysis of Low Molecular Weight Carbohydrates and Other Quality Indicators. Food Chem. 2019, 290, 159–167. [Google Scholar] [CrossRef]
- Lee, M.K.; Kim, H.W.; Lee, S.H.; Kim, Y.J.; Asamenew, G.; Choi, J.; Lee, J.W.; Jung, H.A.; Yoo, S.M.; Kim, J.B. Characterization of Catechins, Theaflavins, and Flavonols by Leaf Processing Step in Green and Black Teas (Camellia sinensis) Using UPLC-DAD-QToF/MS. Eur. Food Res. Technol. 2019, 245, 997–1010. [Google Scholar] [CrossRef]
- Chen, I.J.; Liu, C.Y.; Chiu, J.P.; Hsu, C.H. Therapeutic Effect of High-Dose Green Tea Extract on Weight Reduction: A Randomized, Double-Blind, Placebo-Controlled Clinical Trial. Clin. Nutr. 2016, 35, 592–599. [Google Scholar] [CrossRef]
- Li, S.; Gong, G.; Ma, C.; Liu, Z.; Cai, J. Study on the Influence of Tea Extract on Probiotics in Skim Milk: From Pro-biotics Propagation to Metabolite. J. Food Sci. 2016, 81, M1981–M1986. [Google Scholar] [CrossRef]
- Liu, Z.; Vincken, J.P.; de Bruijn, W.J.C. Tea Phenolics as Prebiotics. Trends Food Sci. Technol. 2022, 127, 156–168. [Google Scholar] [CrossRef]
- Nazzaro, F.; Fratianni, F.; De Feo, V.; Battistelli, A.; Da Cruz, A.G.; Coppola, R. Polyphenols, the New Frontiers of Prebiotics. In Advances in Food and Nutrition Research; Gomes da Cruz, A., Schwinden, E., Almeida, E., da Silva, C., Eds.; Academic Press Inc.: Cambridge, MA, USA, 2020; Volume 94, pp. 35–89. [Google Scholar]
- Plamada, D.; Vodnar, D.C. Polyphenols—Gut Microbiota Interrelationship: A Transition to a New Generation of Prebiotics. Nutrients 2022, 14, 137. [Google Scholar] [CrossRef]
- Boulangé, C.L.; Neves, A.L.; Chilloux, J.; Nicholson, J.K.; Dumas, M.E. Impact of the Gut Microbiota on Inflamma-tion, Obesity, and Metabolic Disease. Genome Med. 2016, 8, 42. [Google Scholar] [CrossRef]
- Gharaei-Fathabad, E.; Eslamifar, M. Isolation and Applications of One Strain of Lactobacillus paraplantarum from Tea Leaves (Camellia sinensis). Am. J. Food Technol. 2011, 6, 429–434. [Google Scholar] [CrossRef]
- Salgado, J.M.; Rodríguez, N.; Cortés, S.; Domínguez, J.M. Development of Cost-Effective Media to Increase the Economic Potential for Larger-Scale Bioproduction of Natural Food Additives by Lactobacillus rhamnosus, Debary-omyces Hansenll, and Aspergillus Niger. J. Agric. Food Chem. 2009, 57, 10414–10428. [Google Scholar] [CrossRef]
- Trigueros, D.E.G.; Fiorese, M.L.; Kroumov, A.D.; Hinterholz, C.L.; Nadai, B.L.; Assunção, G.M. Medium Optimiza-tion and Kinetics Modeling for the Fermentation of Hydrolyzed Cheese Whey Permeate as a Substrate for Saccha-romyces cerevisiae var. boulardii. Biochem. Eng. J. 2016, 110, 71–83. [Google Scholar] [CrossRef]
- Jaramillo, L.; Santos, D.; Borges, E.; Dias, D.; Pereira, N. Low-Cost Effective Culture Medium Optimization for d-Lactic Acid Production by Lactobacillus coryniformis subsp. torquens under Oxygen-Deprived Condition. Ann. Microbiol. 2018, 68, 547–555. [Google Scholar] [CrossRef]
- Avonts, L.; Uytven, E.V.; Vuyst, L. De Cell Growth and Bacteriocin Production of Probiotic Lactobacillus Strains in Different Media. Int. Dairy, J. 2004, 14, 947–955. [Google Scholar] [CrossRef]
- Aguirre-Ezkauriatza, E.J.; Aguilar-Yáñez, J.M.; Ramírez-Medrano, A.; Alvarez, M.M. Production of Probiotic Biomass (Lactobacillus casei) in Goat Milk Whey: Comparison of Batch, Continuous and Fed-Batch Cultures. Bioresour. Technol. 2010, 101, 2837–2844. [Google Scholar] [CrossRef]
- Schiraldi, C.; Adduci, V.; Valli, V.; Maresca, C.; Giuliano, M.; Lamberti, M.; Cartenì, M.; De Rosa, M. High Cell Density Cultivation of Probiotics and Lactic Acid Production. Biotechnol. Bioeng. 2003, 82, 213–222. [Google Scholar] [CrossRef]
- Castillo Martinez, F.A.; Balciunas, E.M.; Salgado, J.M.; Domínguez González, J.M.; Converti, A.; Oliveira, R.P.d.S. Lactic Acid Properties, Applications and Production: A Review. Trends Food Sci. Technol. 2013, 30, 70–83. [Google Scholar] [CrossRef]
- Ghaffar, T.; Irshad, M.; Anwar, Z.; Aqil, T.; Zulifqar, Z.; Tariq, A.; Kamran, M.; Ehsan, N.; Mehmood, S. Recent Trends in Lactic Acid Biotechnology: A Brief Review on Production to Purification. J. Radiat. Res. Appl. Sci. 2014, 7, 222–229. [Google Scholar] [CrossRef]
- Berry, A.R.; Franco, C.M.M.; Zhang, W.; Middelberg, A.P.J. Growth and Lactic Acid Production in Batch Culture of Lactobacillus rhamnosus in a Defined Medium. Biotechnol. Lett. 1999, 21, 163–167. [Google Scholar] [CrossRef]
- Tripathi, M.K.; Giri, S.K. Probiotic Functional Foods: Survival of Probiotics during Processing and Storage. Journal of Functional Foods 2014, 9, 225–241. [Google Scholar] [CrossRef]
- De Man, J.C.; Rogosa, M.; Sharpe, M.E. Medium for the Cultivation of Lactobacilli. J. Appl. Bacteriol. 1960, 23, 130–135. [Google Scholar] [CrossRef]
- Monod, J. The Growth of Bacterial Cultures. Annu. Rev. Microbiol. 1949, 3, 371–394. [Google Scholar] [CrossRef]
- Levenspiel, O. The Monod Equation: A Revisit and a Generalization to Product Inhibition Situations. Biotechnol. Bioeng. 1980, 22, 1671–1687. [Google Scholar] [CrossRef]
- Luedeking, R.; Piret, E.L. Kinetic Study of the Lactic Acid Fermentation. Batch Process at Controlled pH. Biotechnol. Bioeng. 2000, 67, 636–644. [Google Scholar] [CrossRef]
- Rojas-Rejón, O.A.; Poggi-Varaldo, H.M.; Ramos-Valdivia, A.C.; Martínez-Jiménez, A.; Cristiani-Urbina, E.; De La Torre Martínez, M.; Ponce-Noyola, T. Production of Cellulases and Xylanases under Catabolic Repression Conditions from Mutant PR-22 of Cellulomonas flavigena. J. Ind. Microbiol. Biotechnol. 2011, 38, 257–264. [Google Scholar] [CrossRef]
- Fu, W.; Mathews, A.P. Lactic Acid Production from Lactose by Lactobacillus plantarum: Kinetic Model and Effects of pH, Substrate, and Oxygen. Biochem. Eng. J. 1999, 3, 163–170. [Google Scholar] [CrossRef]
- Malek, R.A.; Hamdan, S.; Enshasy, H.a.E.; Othman, N.Z. Production of Lactobacillus salivarius, a New Probiotic Strain Isolated from Human Breast Milk, in Semi-Industrial Scale and Studies on Its Functional Characterization. Appl. Microbiol. Microb. Biotechnol. 2010, 2, 1196–1204. [Google Scholar]
- Chaturvedula, V.S.P.; Prakash, I. The Aroma, Taste, Color and Bioactive Constituents of Tea. J. Med. Plants Res. 2011, 5, 2110–2124. [Google Scholar]
- Vodnar, D.C.; Ranga, F.; Pop, O.; Socaciu, C. Catechin-Rich Tea Extracts Improve the Lactobacillus casei Growth During Lactic fermentation. Bull. Univ. Agric. Sci. Vet. Med. Cluj-Napoca–Agric. 2012, 69, 447–453. [Google Scholar] [CrossRef]
- Bergillos-Meca, T.; Costabile, A.; Walton, G.; Moreno-Montoro, M.; Ruiz-Bravo, A.; Ruiz-López, M.D. In Vitro Evaluation of the Fermentation Properties and Potential Probiotic Activity of Lactobacillus plantarum C4 in Batch Culture Systems. LWT–Food Sci. Technol. 2015, 60, 420–426. [Google Scholar] [CrossRef]
- Rossi, M.; Corradini, C.; Amaretti, A.; Nicolini, M.; Pompei, A.; Zanoni, S.; Matteuzzi, D. Fermentation of Fruc-tooligosaccharides and Inulin by Bifidobacteria: A Comparative Study of Pure and Fecal Cultures. Appl. Environ. Microbiol. 2005, 71, 6150–6158. [Google Scholar] [CrossRef]
- Akalin, A.S.; Erişir, D. Effects of Inulin and Oligofructose on the Rheological Characteristics and Probiotic Culture Survival in Low-Fat Probiotic Ice Cream. J. Food Sci. 2008, 73, M184–M188. [Google Scholar] [CrossRef]
- Axling, U.; Olsson, C.; Xu, J.; Fernandez, C.; Larsson, S.; Ström, K.; Ahrné, S.; Holm, C.; Molin, G.; Berger, K. Green Tea Powder and Lactobacillus plantarum Affect Gut Microbiota, Lipid Metabolism and Inflammation in High-Fat Fed C57BL/6J Mice. Nutr. Metab. 2012, 9, 105. [Google Scholar] [CrossRef]
- Campos, D.; Betalleluz-Pallardel, I.; Chirinos, R.; Aguilar-Galvez, A.; Noratto, G.; Pedreschi, R. Prebiotic Effects of Yacon (Smallanthus Sonchifolius Poepp. & Endl), a Source of Fructooligosaccharides and Phenolic Compounds with Antioxidant Activity. Food Chem. 2012, 135, 1592–1599. [Google Scholar] [CrossRef]
- Panesar, P.S.; Bali, V. Prebiotics. In Encyclopedia of Food and Health, 1st ed.; Caballero, B., Finglas, P., Toldrá, F., Eds.; Academic Press: Cambridge, MA, USA, 2016; Volume 18, pp. 464–471. [Google Scholar]
- Slavin, J. Fiber and Prebiotics: Mechanisms and Health Benefits. Nutrients 2013, 5, 1417–1435. [Google Scholar] [CrossRef]
- Rinker, K.D.; Han, C.J.; Kelly, R.M. Continuous Culture as a Tool for Investigating the Growth Physiology of Het-erotrophic Hyperthermophiles and Extreme Thermoacidophiles. J. Appl. Microbiol. Symp. Suppl. 1999, 85, 118–127. [Google Scholar] [CrossRef]
- Herbert, B.Y.D.; Elsworth, R. The Continuous Culture of Bacteria; A Theoretical and Experimental Study. Gen. Microbiol. 1956, 601–622. [Google Scholar] [CrossRef]
- Hoskisson, P.A.; Hobbs, G. Continuous Culture--Making a Comeback? Microbiology. 2005, 151, 3153–3159. [Google Scholar] [CrossRef]
- Vees, C.A.; Neuendorf, C.S.; Pflügl, S. Towards Continuous Industrial Bioprocessing with Solventogenic and Acetogenic Clostridia: Challenges, Progress and Perspectives. J. Ind. Microbiol. Biotechnol. 2020, 47, 753–757. [Google Scholar] [CrossRef]
- Yasemi, M.; Jolicoeur, M. Modelling Cell Metabolism: A Review on Constraint-Based Steady-State and Kinetic Ap-proaches. Processes 2021, 9, 322. [Google Scholar] [CrossRef]
- Afschar, A.S.; Biebl, H.; Schaller, K.; Schügerl, K. Production of Acetone and Butanol by Clostridium acetobutylicum in Continuous Culture with Cell Recycle. Appl. Microbiol. Biotechnol. 1985, 22, 394–398. [Google Scholar] [CrossRef]
- Marhamatizadeh, M.H.; Ehsandoost, E.; Gholami, P. The Influence of Green Tea (Camellia sinensis L.) Extract on Characteristic of Probiotic Bacteria in Milk and Yoghurt during Fermentation and Refrigerated Storage. Int. J. Farming Allied Sci. 2013, 2, 599–606. [Google Scholar]
- Jaziri, I.; Ben Slama, M.; Mhadhbi, H.; Urdaci, M.C.; Hamdi, M. Effect of Green and Black Teas (Camellia sinensis L.) on the Characteristic Microflora of Yogurt during Fermentation and Refrigerated Storage. Food Chem. 2009, 112, 614–620. [Google Scholar] [CrossRef]


| XMAX 1 (g/L) | PMAX 2 (g/L) | µMAX (1/h) | KS (g/L) | YX/S (g/g) | α (g/g) | β (g/(g∙h)) | |
|---|---|---|---|---|---|---|---|
| Control | 3.57 ± 0.06 | 10.42 ± 0.32 | 0.82 ± 0.01 | 0.68 ± 0.00 | 0.19 ± 0.00 | 2.33 ± 0.01 | 0.05 ± 0.00 |
| 1% (v/v) | 4.80 ± 0.00 | 20.98 ± 0.01 | 1.27 ± 0.04 | 2.76 ± 0.12 | 0.22 ± 0.01 | 4.60 ± 0.03 | 0.00 ± 0.00 |
| 10% (v/v) | 6.10 ± 0.01 | 19.76 ± 0.00 | 1.95 ± 0.03 | 9.89 ± 0.21 | 0.32 ± 0.01 | 3.11 ± 0.04 | 0.01 ± 0.00 |
| CSExt | Cell Biomass Formation | Substrate Consumption | D-Lactate Production |
|---|---|---|---|
| 1% (v/v) vs. control | 33.66 ± 1.05 | 3.93 ± 0.18 | 111.56 ± 2.53 |
| 10% (v/v) vs. control | 69.13 ± 2.01 | 22.85 ± 1.10 | 89.39 ± 0.68 |
| 10% (v/v) vs. 1% (v/v) | 26.54 ± 2.54 | 18.20 ± 0.98 | −11.27 ± 0.45 |
Disclaimer/Publisher’s Note: The statements, opinions and data contained in all publications are solely those of the individual author(s) and contributor(s) and not of MDPI and/or the editor(s). MDPI and/or the editor(s) disclaim responsibility for any injury to people or property resulting from any ideas, methods, instructions or products referred to in the content. |
© 2024 by the authors. Licensee MDPI, Basel, Switzerland. This article is an open access article distributed under the terms and conditions of the Creative Commons Attribution (CC BY) license (https://creativecommons.org/licenses/by/4.0/).
Share and Cite
Rojas-Rejón, Ó.A.; Gonzalez-Figueredo, C.; Quintero-Covarrubias, A.R.; Saldaña-Jáuregui, A. Growth of Lactiplantibacillus plantarum BG112 in Batch and Continuous Culture with Camellia sinensis as Prebiotic. Fermentation 2024, 10, 487. https://doi.org/10.3390/fermentation10090487
Rojas-Rejón ÓA, Gonzalez-Figueredo C, Quintero-Covarrubias AR, Saldaña-Jáuregui A. Growth of Lactiplantibacillus plantarum BG112 in Batch and Continuous Culture with Camellia sinensis as Prebiotic. Fermentation. 2024; 10(9):487. https://doi.org/10.3390/fermentation10090487
Chicago/Turabian StyleRojas-Rejón, Óscar Ariel, Carlos Gonzalez-Figueredo, Ana Ruth Quintero-Covarrubias, and Alejandro Saldaña-Jáuregui. 2024. "Growth of Lactiplantibacillus plantarum BG112 in Batch and Continuous Culture with Camellia sinensis as Prebiotic" Fermentation 10, no. 9: 487. https://doi.org/10.3390/fermentation10090487