Article

Alterations in the Growth Responses of Pelargonium × hortorum Irrigated with Microalgae Production Wastewater

by
Alejandro Rápalo-Cruz
1,2,
Cintia Gómez-Serrano
3,
Cynthia Victoria González-López
3,
Mohammad Bagher Hassanpouraghdam
4 and
Silvia Jiménez-Becker
1,*
1
Department of Agronomy, Higher Engineering School, Agrifood Campus of International Excellence (CeiA3), Ctra. Sacramento s/n, 04120 Almería, Spain
2
Faculty of Agricultural Sciences, Universidad Nacional de Agricultura, Road to Dulce Nombre de Culmí, Km 215, Barrio El Espino, Catacamas 16201, Honduras
3
Department of Chemical Engineering, Higher Engineering School, Agrifood Campus of International Excellence (CeiA3), Ctra. Sacramento s/n, 04120 Almería, Spain
4
Department of Horticultural Sciences, University of Maragheh, Maragheh 55181-83111, Iran
*
Author to whom correspondence should be addressed.
Horticulturae 2024, 10(9), 921; https://doi.org/10.3390/horticulturae10090921
Submission received: 6 August 2024 / Revised: 23 August 2024 / Accepted: 28 August 2024 / Published: 29 August 2024
(This article belongs to the Section Floriculture, Nursery and Landscape, and Turf)

Abstract

:
The utilization of treated wastewater can enhance the crops’ irrigation efficacy by offering an extra source of water and nutrients for agricultural purposes. This methodology helps alleviate the pressure on conventional water resources and can be a sustainable strategy to address the challenges of water scarcity. However, it is essential to ensure that wastewater is properly treated to meet quality and safety standards before its application to agricultural crops. This study focuses on exploring the reuse of wastewater from microalgae production and its impact on Pelargonium × hortorum growth during two seasons (autumn and spring). The established treatments were as follows: tap water (control 1); 100% IW—inlet wastewater (control 2); 100% OW—outlet from the reactor; 75% OW + 25% W—75% outlet from the reactor and 25% tap water; and 50% OW + 50%W—50% outlet from the reactor and 50% tap water. Irrigation with wastewater in autumn did not have a significant negative effect (p > 0.05) on plant height, plant diameter, leaf dry weight, roots, or total dry weight, and it was comparable to the control in all applied percentages. On the other hand, wastewater irrigation during spring had a meaningful positive (p < 0.05) impact on plant growth compared to the control. These wastewater resources have a high concentration of nutrients, making them a valuable source of essential and/or beneficial elements. The levels of nutrients such as NO3 range from 144.08 ppm to 82.10 ppm, PO43− ranges from 14.14 ppm to 7.11 ppm, and K+ ranges from 36.83 ppm to 29.71 ppm. Therefore, the obtained results support the viability and effectiveness of using wastewater after microalgae production in agriculture to reduce water demand, mitigate water pollution, and substitute chemical fertilizer input, contributing to more sustainable agricultural practices. These results, with more detailed evaluations, would be applicable to other related plant species and are even applicable to the commercial production sectors.

1. Introduction

The global water demand is increasing due to population growth, urbanization, industrialization, and agricultural expansion [1]. Pollution and water scarcity pose serious threats to the development of human society [2]. Available water resources are not sufficient in many countries to meet the progressively increasing demand for agricultural production [3]. This issue is exacerbated by a rapidly growing population that will require a 60% increase in agricultural production in the next 30 years [4]. With the increasing water demand, improper wastewater management can have increasingly negative environmental impacts [1]. The discharge of nutrient-rich effluent into aquatic systems causes eutrophication, eventually disturbing the aquatic system [5]. The eutrophication of aquatic environments, induced by an excessive influx of phosphorus (P) and nitrogen (N), raises environmental concerns, including the generation of solid waste and the emission of unpleasant substances into the air [6]. The Water Framework Directive of the European Union requires the good chemical and ecological status of water resources in the EU Member States. Therefore, the reuse of wastewater has become a prevailing need for sustainable development worldwide [7].
Five key components have been identified in cleaner production, namely, the conservation of raw materials, water, and energy, as well as the elimination of toxic emissions and waste reduction [8]. Industrial water production technologies, such as desalination and water reuse, are crucial tools for addressing water scarcity, adapting to climate change, and promoting a circular economy [9]. The water recycling technology involves capturing and recycling irrigation water to enhance water productivity in crops, bolstering supply security, and reducing contaminants at production sites [10]. In developing countries, farmers often resort to using untreated wastewater directly for irrigation, which raises health concerns for both workers and consumers. To address this problem, a microalgae-based wastewater treatment is suggested as a strategy to recover nutrients and produce clean water [11,12]. Microalgae-–bacterium consortia in wastewater treatment processes offer a dual function by removing nutrients and contaminants while producing valuable biomass [11,13], with the potential to serve as sustainable sources of food, animal feed, fuel, biostimulants, and biofertilizers [13,14]. It has been demonstrated that microalgae-based wastewater treatment is an economical and sustainable solution [6]. Microalgae play a crucial role in removing various types of toxins through biosorption, bioaccumulation, and biodegradation processes [6]. Wastewater serves as a readily available, low-cost, and nutrient-rich medium for cultivating algae [5]. Additionally, due to their ability to remove organic matter, nutrients (such as N and P), and certain contaminants [13,15], microalgae hold a dominant role in microalgae-based wastewater treatment and in ensuring reduced nutrient inputs to receiving water bodies [5]. Thus, microalgae-based techniques have recently gained significant attention for treating municipal, industrial, agro-industrial, and livestock wastewater [6].
Wastewater can be an alternative to replace freshwater use in agriculture, as it is rich in macro- and micronutrients for crop fertigation [16]. It reduces fertilizer application rates, which brings economic benefits to farmers [3]. Ornamental plant cultivation is a lucrative and continuously evolving sector that aims to integrate production efficiency with a more sustainable and environmentally friendly use of resources [17]. The production of ornamental plants is considered a safe destination for effluents, as these plants are not used for food [1]. Currently, the global ornamental sector is characterized by a significant expansion in both production and consumption, driving the growth of international trade and globalization, with Europe as the largest consumer market [18]. Among the most demanded species is Pelargonium × hortorum, commonly known as geranium, an ornamental plant originating from South Africa that is cultivated globally and has gained recognition for its widespread use in gardens and terraces, leading to increasing commercial interest worldwide [19]. This study focuses on exploring the reuse of wastewater from the production of Scenedesmus microalgae (collected at the University of Almeria from domestic sources) and its impact on the growth responses of Pelargonium × hortorum during two seasons (autumn and spring).

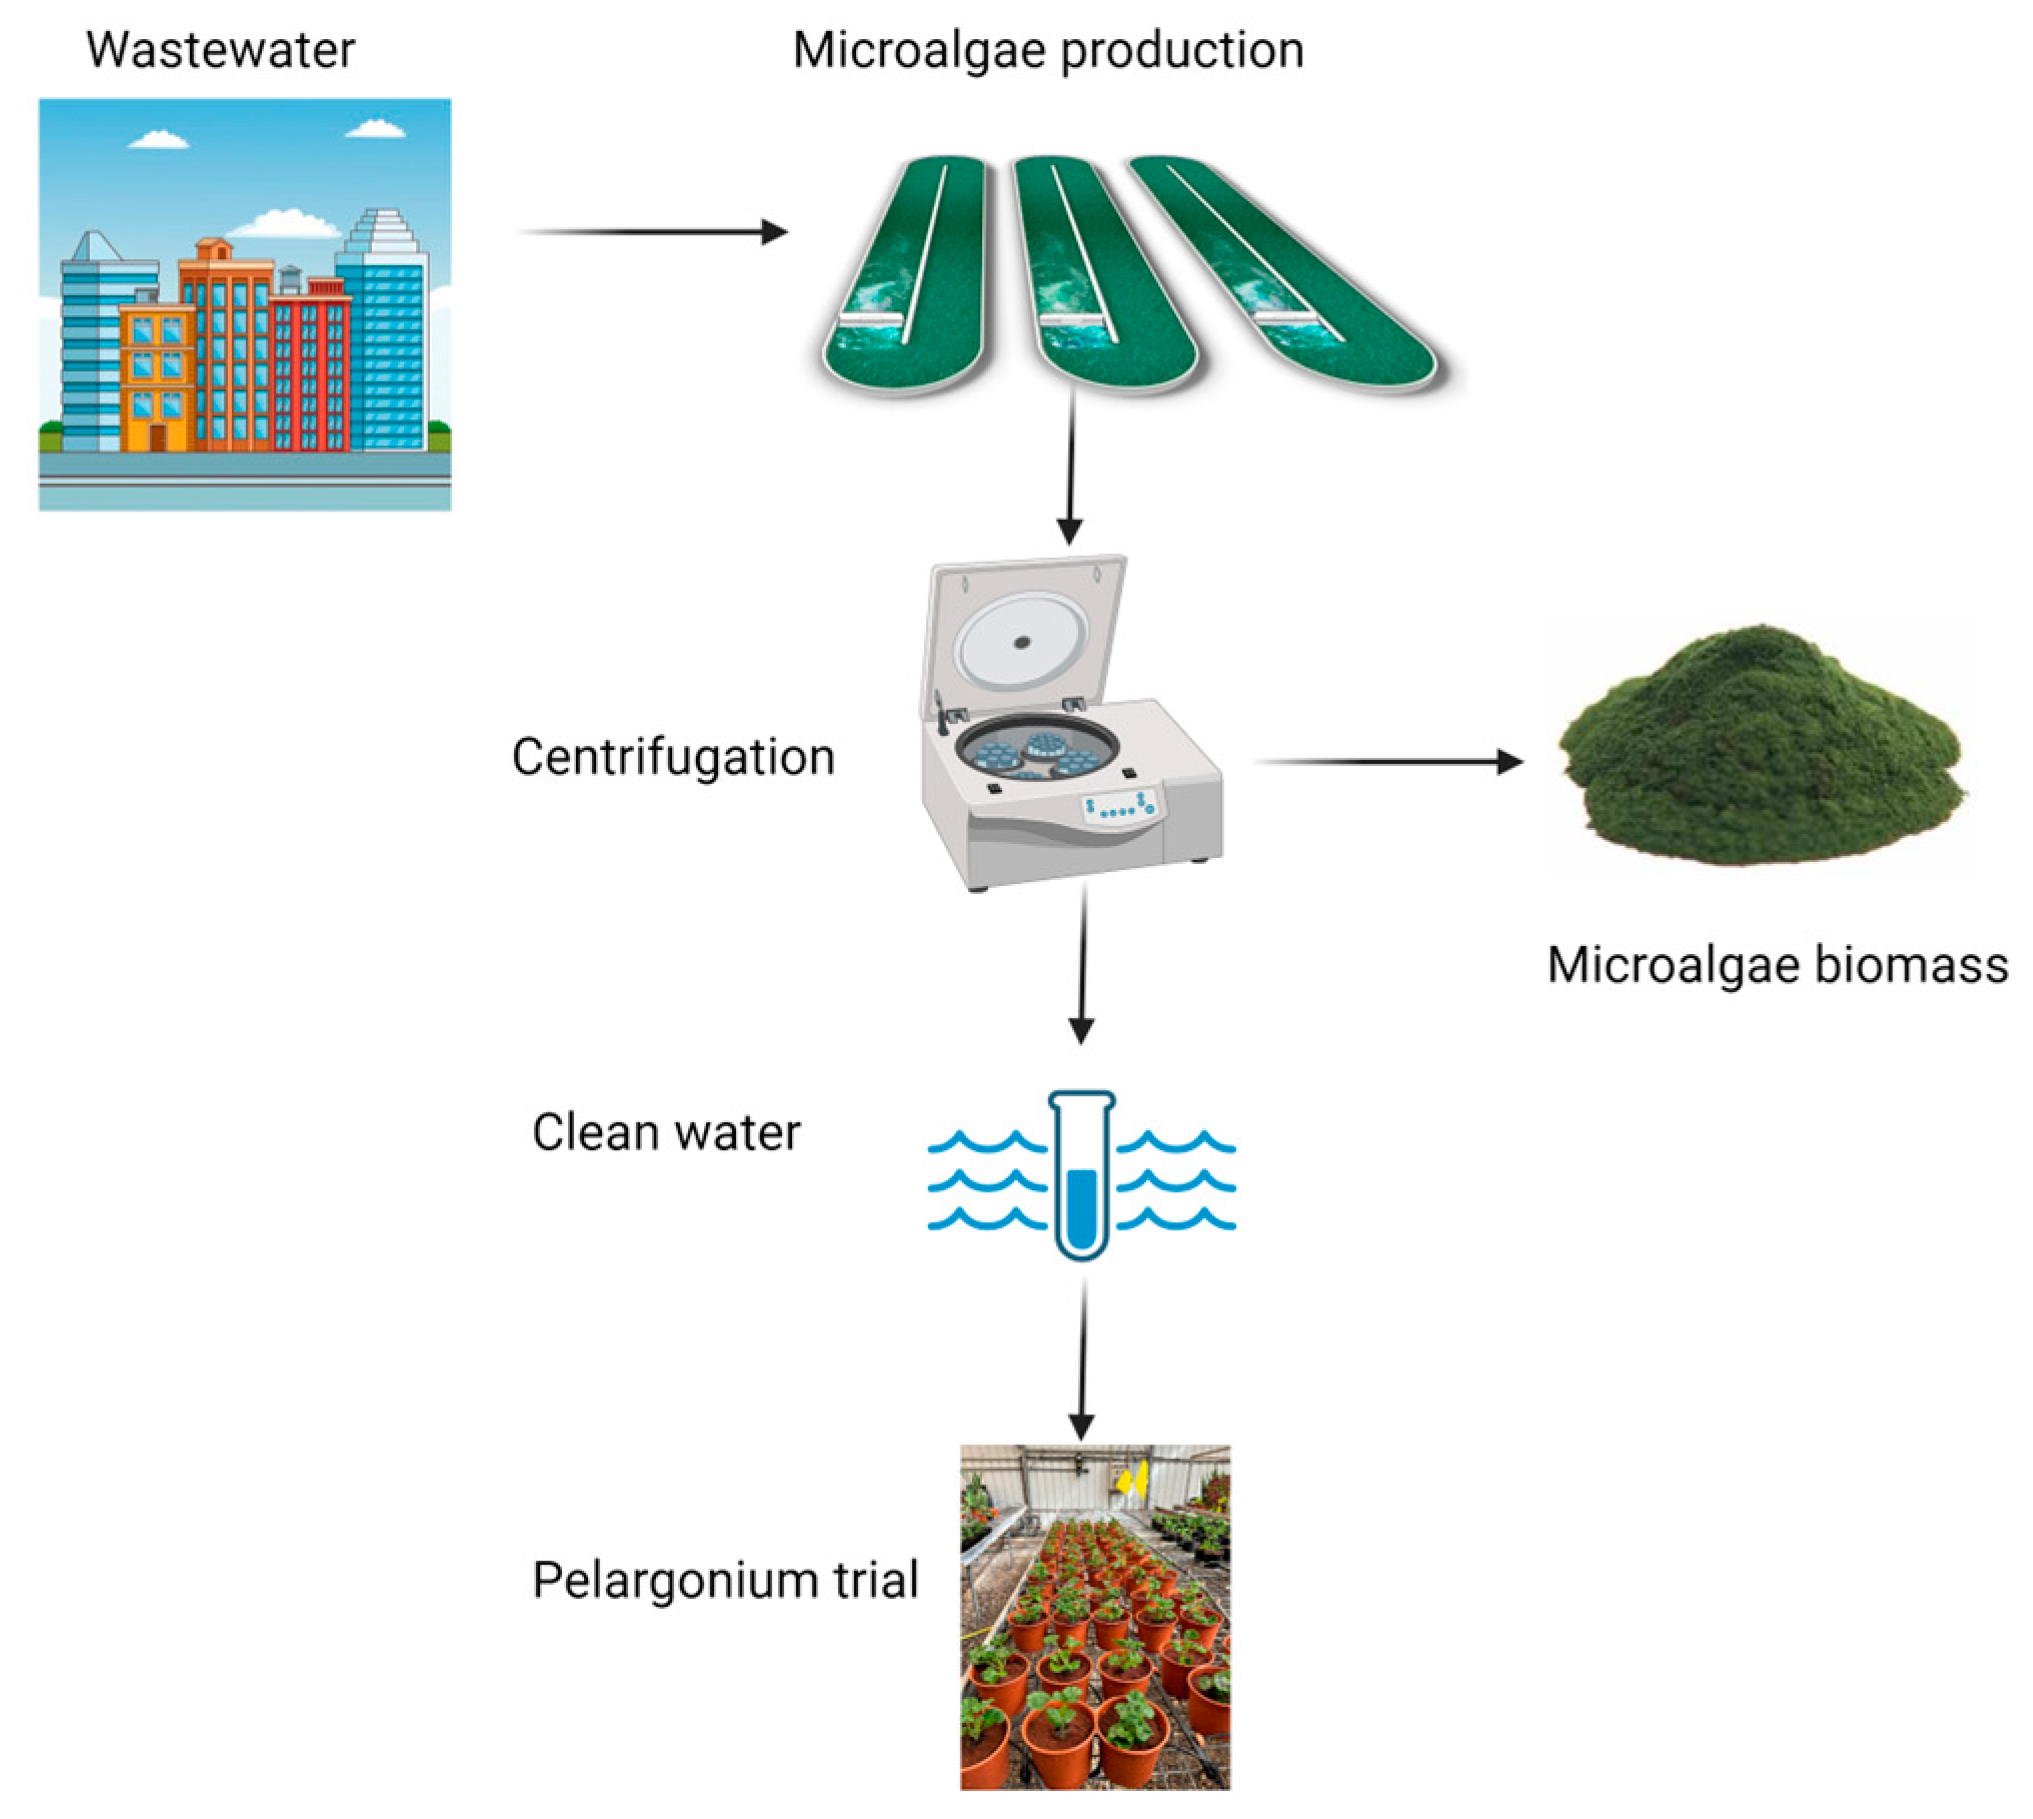
2. Materials and Methods

2.1. Facilities

The research was conducted in a greenhouse situated at the University of Almería 36°49′38″ N 2°24′20″ W, Spain, covering an area of 170 m2 and equipped with a centralized ventilation system activated when the temperature reaches 25 °C. This system is connected to a temperature and humidity monitor. For monitoring the environmental conditions in the greenhouse, a DATA LOGGER PCE-HT 114 was employed. The temperature and relative humidity were recorded at 10 min intervals, with the data logger placed on shelves where the plants were located at a height of 1.30 m. The climate conditions recorded during Experiment 1 (autumn) exhibited thermal variations with a maximum temperature of 27.11 °C and a minimum of 13.34 °C, averaging 20.22 °C. Relative humidity ranged from a maximum of 89.29% to a minimum of 44.39%, with an average humidity of 66.84%. Experiment 2 (spring) exhibited thermal variations with a maximum temperature of 26.69 °C and a minimum of 11.06 °C, averaging 17.92 °C. Relative humidity ranged from a maximum of 90.95% to a minimum of 38.56%, with an average humidity of 70.36%. The medium daily light integral was 10.63 and 16.40 mol m−2 day−1 in autumn and spring, respectively. During autumn, the values of daily integral radiation were slightly below the required levels for high-quality production (14–30 mol m−2 day−1) but remained within the necessary ranges for acceptable quality (10–13 mol m−2 day−1) [20]. However, during spring, the necessary values for high-quality production were achieved.

2.2. Plant Material

Pelargonium × hortorum var. Silvia plants were provided by the Plantas de Andalucia nursery. Transplantation was carried out in 1.5 L pots using a substrate comprising 80% peat and 20% perlite. The irrigation was repeated every two days, depending on the prevailing climatic conditions. At the beginning of each irrigation, a drainage sample was taken to ensure that approximately 20% of the applied water was drained, allowing the calculation of the daily irrigation dose to meet the crop’s needs. On average, plants were irrigated with 60 mL of solution for each irrigation in Experiment 1 and 72 mL for Experiment 2.

2.3. Treatments

The experiment comprised five treatments with 10 repetitions per treatment. Due to the high electrical conductivity (EC) of wastewater, different dilutions with tap water were performed to evaluate the optimal dilution level for cultivation. The established treatments were as follows: Tap water (control 1); 100% IW—inlet wastewater (control 2); 100% OW—outlet from the reactor; 75% OW + 25% W—75% outlet from the reactor and 25% tap water; and 50% OW + 50% W—50% outlet from the reactor and 50% tap water. This experiment was carried out in two growing seasons, autumn (October to December) and spring (March to May).

2.4. Inlet Wastewater

The wastewater used was domestic wastewater collected at the University of Almería in Spain. Domestic wastewater includes blackwater (toilet wastewater) and graywater (water used for washing, bathing, and cooking) [11]. Primary treatment was performed in raw wastewater to remove coarse solids, suspended solids, and floating solids. This process involved filtration to capture solid objects and gravity sedimentation to remove suspended solids [21].

2.5. Outlet Wastewater

Microalgae were used for the secondary treatment of wastewater. Secondary treatment helps eliminate dissolved organic matter that escapes primary treatment. Microbes consume organic matter as a nutrient source and convert it into carbon dioxide, water, and energy for their growth [21]. The photobioreactors used for wastewater treatment and Scenedesmus sp. production were placed in a greenhouse at the facilities of the Institute of Research and Training in Agriculture and Fisheries (IFAPA) in Almería, Spain. The operating volume of the reactors was 11.8 m3, and their surface area was 80 m2. The reactors were inoculated with Scenedesmus sp. culture and filled to the desired cultivation depth (0.135 m) using primary treatment (Figure 1). The experiments were carried out in semicontinuous mode at dilution rates of 0.2 day−1. The reactors were operated in semi-continuous mode until the reactor volume was replaced at least twice. The pH was controlled by injecting carbon dioxide as needed, and the evaporation was compensated for with the daily addition of wastewater. The culture was harvested using an industrial separator SSD 6–06-007 GEA (GEA Westfalia Separator Group, Oelde, Germany).

2.6. Sampling and Analysis

2.6.1. Water Analysis

During the research, the composition of the irrigation water was analyzed, with special emphasis on the cations Na+, K+, Mg2+, Ca2+, and NH4+ and the anions Cl, NO3, PO43−, and SO42. For anion analysis, a Metrosep A Supp 7—250/4.0 column was used at a column temperature of 45 °C, with a total analysis time of 28.0 min and a flow rate of 0.8 mL/min. The eluent used consisted of a solution of 3.6 mM sodium carbonate (Na2CO3). For cations, a Metrosep C6—150/4.0 column with a constant column temperature of 45 °C was employed. The total analysis time was 20.0 min, with a constant flow of 1.1 mL/min. The eluent used for cation separation was a solution containing 3 mM nitric acid (HNO3) and 1 mM oxalic acid.

2.6.2. Biometric Parameters

At 8 weeks after the transplantation of Pelargonium × hortorum plants, the biometric data were collected. First, general plant parameters such as height and diameter were measured. Plant height (cm) was determined from base to tip using a graduated ruler, and diameter (cm) was calculated as the mean value of two perpendicular measurements. The vegetative parts were then assessed by recording the number of shoots, stem diameter, the number of leaves, and leaf area. Finally, the generative parts were counted, specifically the number of flowers. After these measurements, the plants were destroyed in order to separate and analyzed various organs individually, including flowers, leaves, stems, and roots. Each organ was weighed to determine its fresh weight. Then, the plant parts were placed in filter paper envelopes and dried in an oven at 60 °C for 48 h until reaching a constant dry weight. A non-destructive approach was used to determine the leaf area, using the formula S = a + bLW proposed by Giuffrida [22]. In this equation, S represents the leaf area, L is the length of the leaf in cm, W is the width of the leaf, and the coefficients a (0.07) and b (0.68) are species-specific for Pelargonium. Measurements were taken with a ruler.

2.7. Experimental Design and Statistical Analysis

A completely randomized design with 5 treatments and 10 repetitions was used, resulting in a total of 50 experimental units. This process was carried out randomly to ensure that each unit had an equal probability of receiving any of the treatments under homogenous conditions. The analysis of variance (ANOVA) was conducted to determine the significant differences between treatments. Furthermore, a least significant difference test was followed to compare means between the evaluated treatments. These analyses were carried out with the statistical software Statgraphics Centurion 19.

3. Results

3.1. Irrigation Water Quality

Table 1 and Table 2 display the pH, EC, and ion concentration of the various irrigation solutions examined in the assay. In all treatments, the pH of the nutrient solution was basic, with values ranging from 7.73 in 100% OW to 8.49 in tap water in the autumn season, and from 7.70 in 100% IW to 8.50 in tap water in the spring season. The pH levels in tap water were notably high in both seasons. Regarding EC, the high level ranged between 2.42 and 3.40 dS m−1 during the autumn season and between 2.40 and 3.15 dS m−1 during the spring. On the contrary, the EC level of tap water was low, approximately 1.20 dS m−1. The highest concentration of NO3 was observed in 100% OW, 75% OW + 25% W, and 50% OW + 50% W, reaching values of 144.08, 118.01, and 82.10 ppm during the autumn season and 47.06, 39.83, and 24.47 ppm during the spring season, respectively. On the other hand, the highest concentration of NH4 was found in the 100% IW treatment, ranging from 110.49 to 131.76 ppm for the autumn and spring, respectively. However, a high concentration of this cation was also found during the spring season in the treatments of 100% OW, 75% OW + 25% W, and 50% OW + 50% W. The nitrogen content in tap water, 100% IW, 100% OW, 75% OW + 25% W, and 50% OW + 50% W was 0.91, 85.98, 36.07, 28.09, and 18.99 ppm for the autumn and 1.06, 103.20, 43.49, 33.19 and 20.49 ppm for the spring session, respectively. A reduction of 57% in nitrogen content was observed when comparing 100% OW with 100% IW.
Microalgae can assimilate nitrogen compounds from wastewater, leading to a considerable decrease in their concentrations. Although significant amounts of other nutrients remain, they can still serve as a valuable nutrient source. The concentration of PO4 in tap water was negligible, but significant amounts were found in the other treatments. The concentration of this anion was 40% and 57% higher in the 100% IW treatment during the autumn and spring seasons, respectively, compared to the 100% OW treatment. The potassium concentration in tap water was low; however, 100% IW and 100% OW contained a high potassium concentration. The K concentration declined as the percentage of tap water increased. The concentration of Ca, Mg, and SO4 was also high in the wastewater, exceeding the levels found in tap water in all cases. Wastewater can serve not only as irrigation water but also as a nutrient source. During the autumn season, Cl and Na concentrations in the 100% IW and OW treatments were 564.15, 394.02, 667.56, and 442 ppm, respectively. The concentration of these ions was more than double that of tap water. In the spring season, the concentrations of Na and Cl were higher than those in tap water and decreased as the percentage of tap water increased.

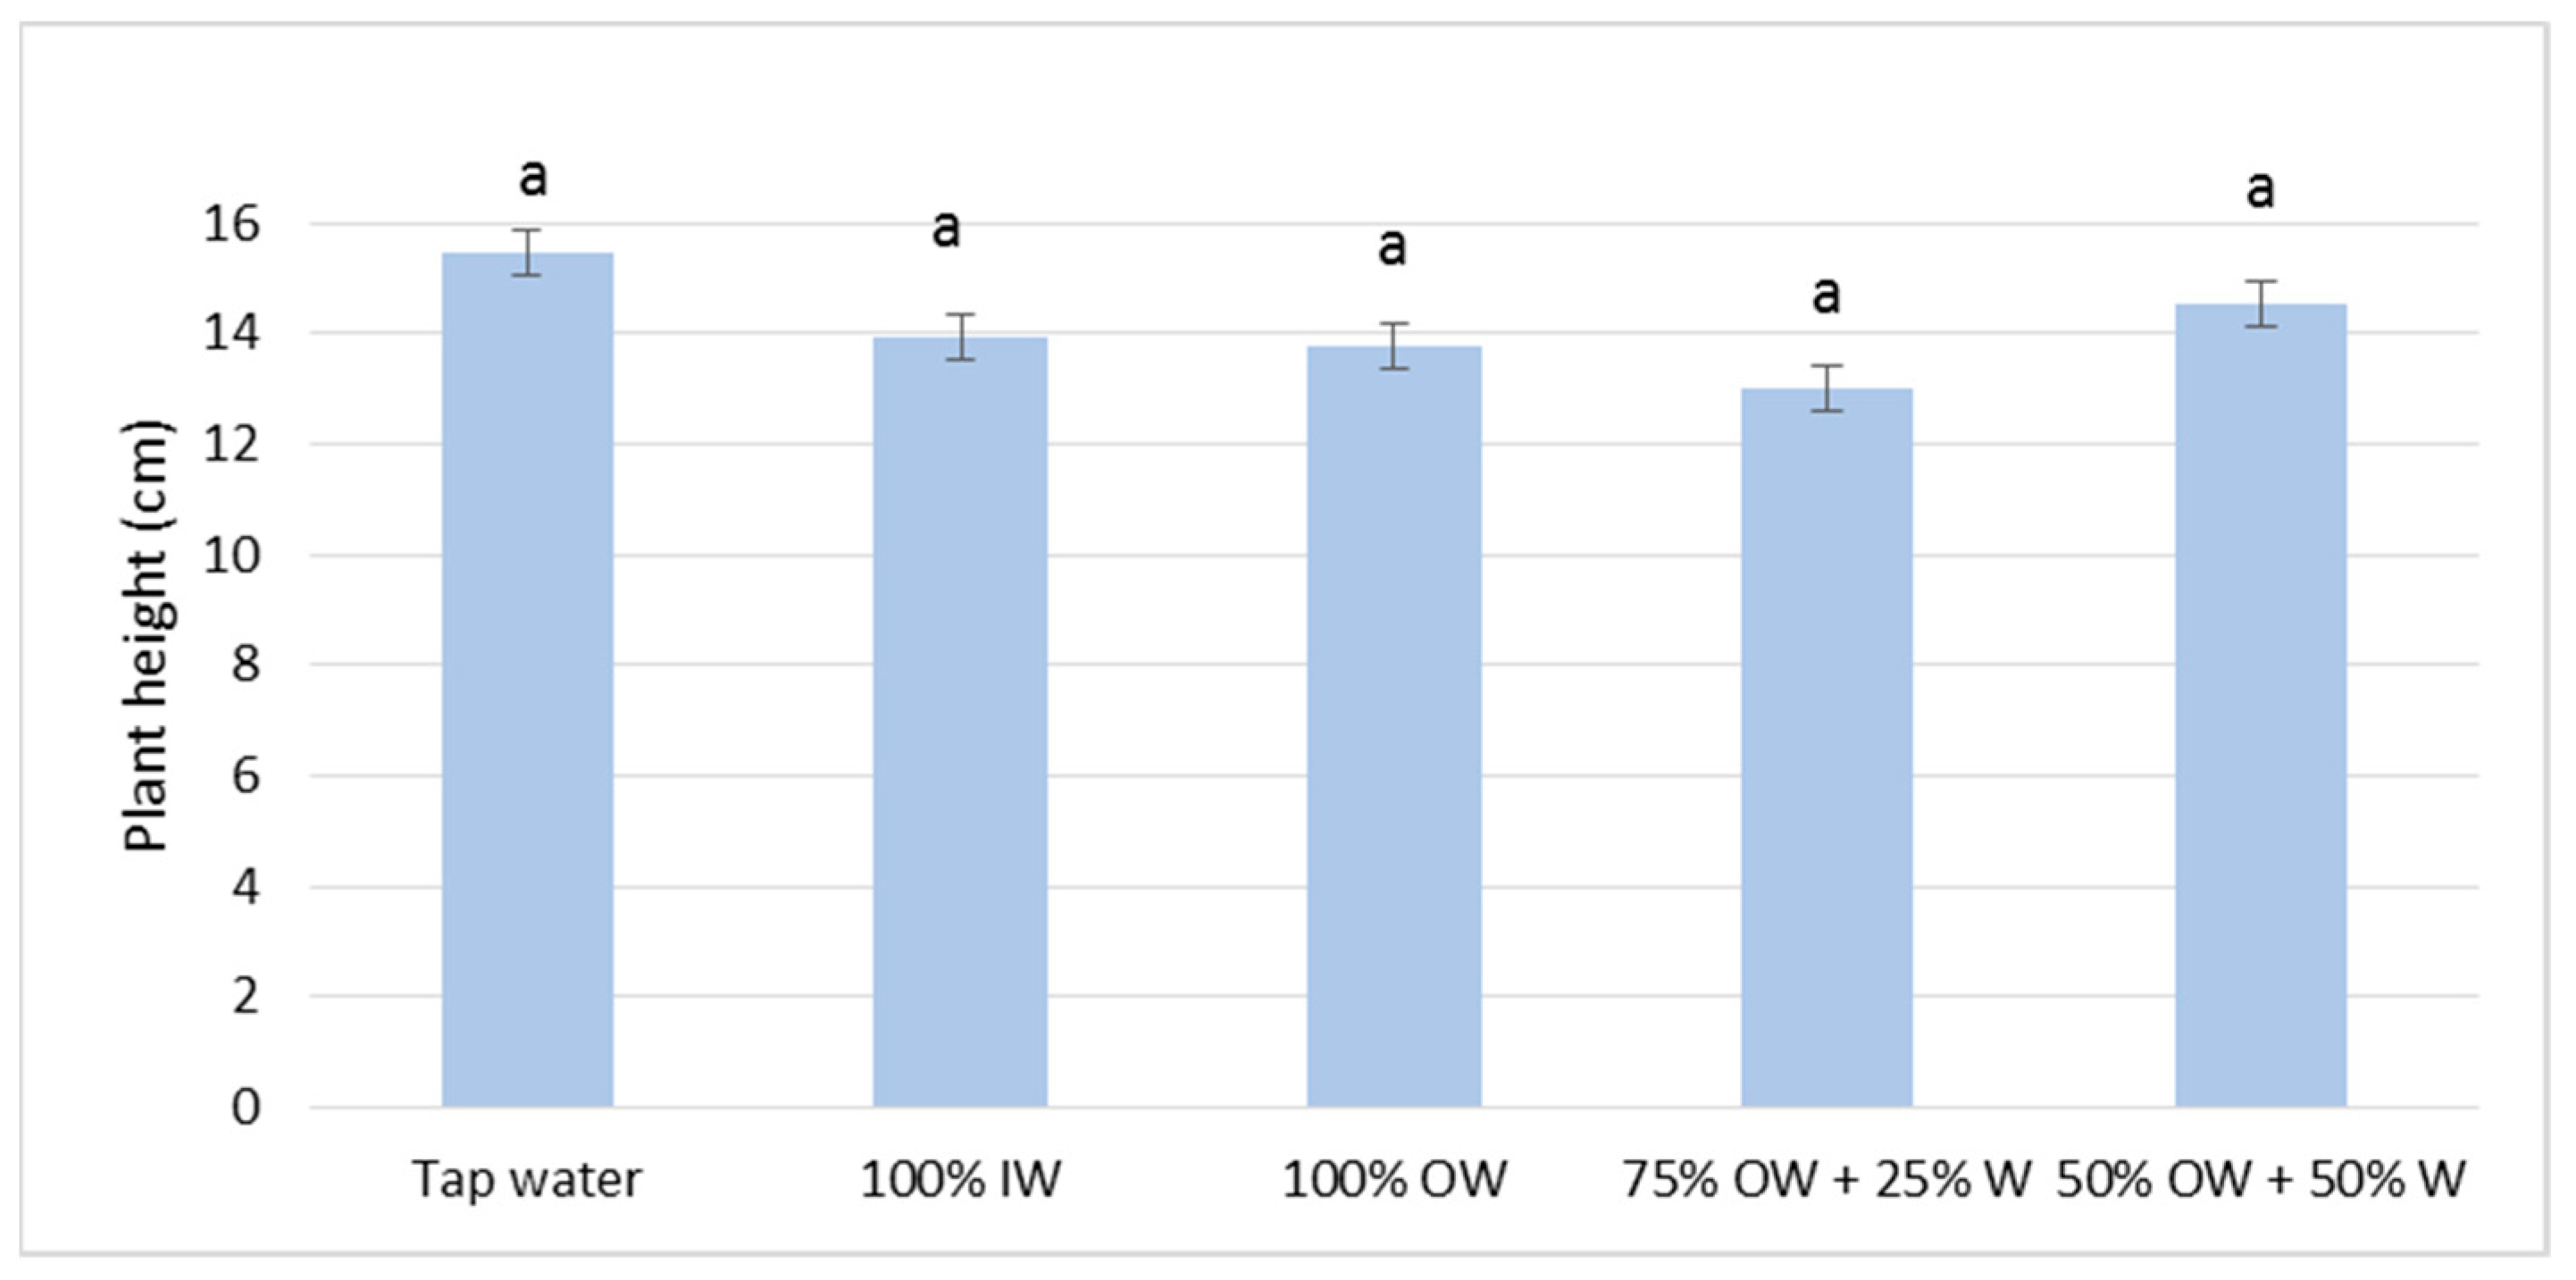
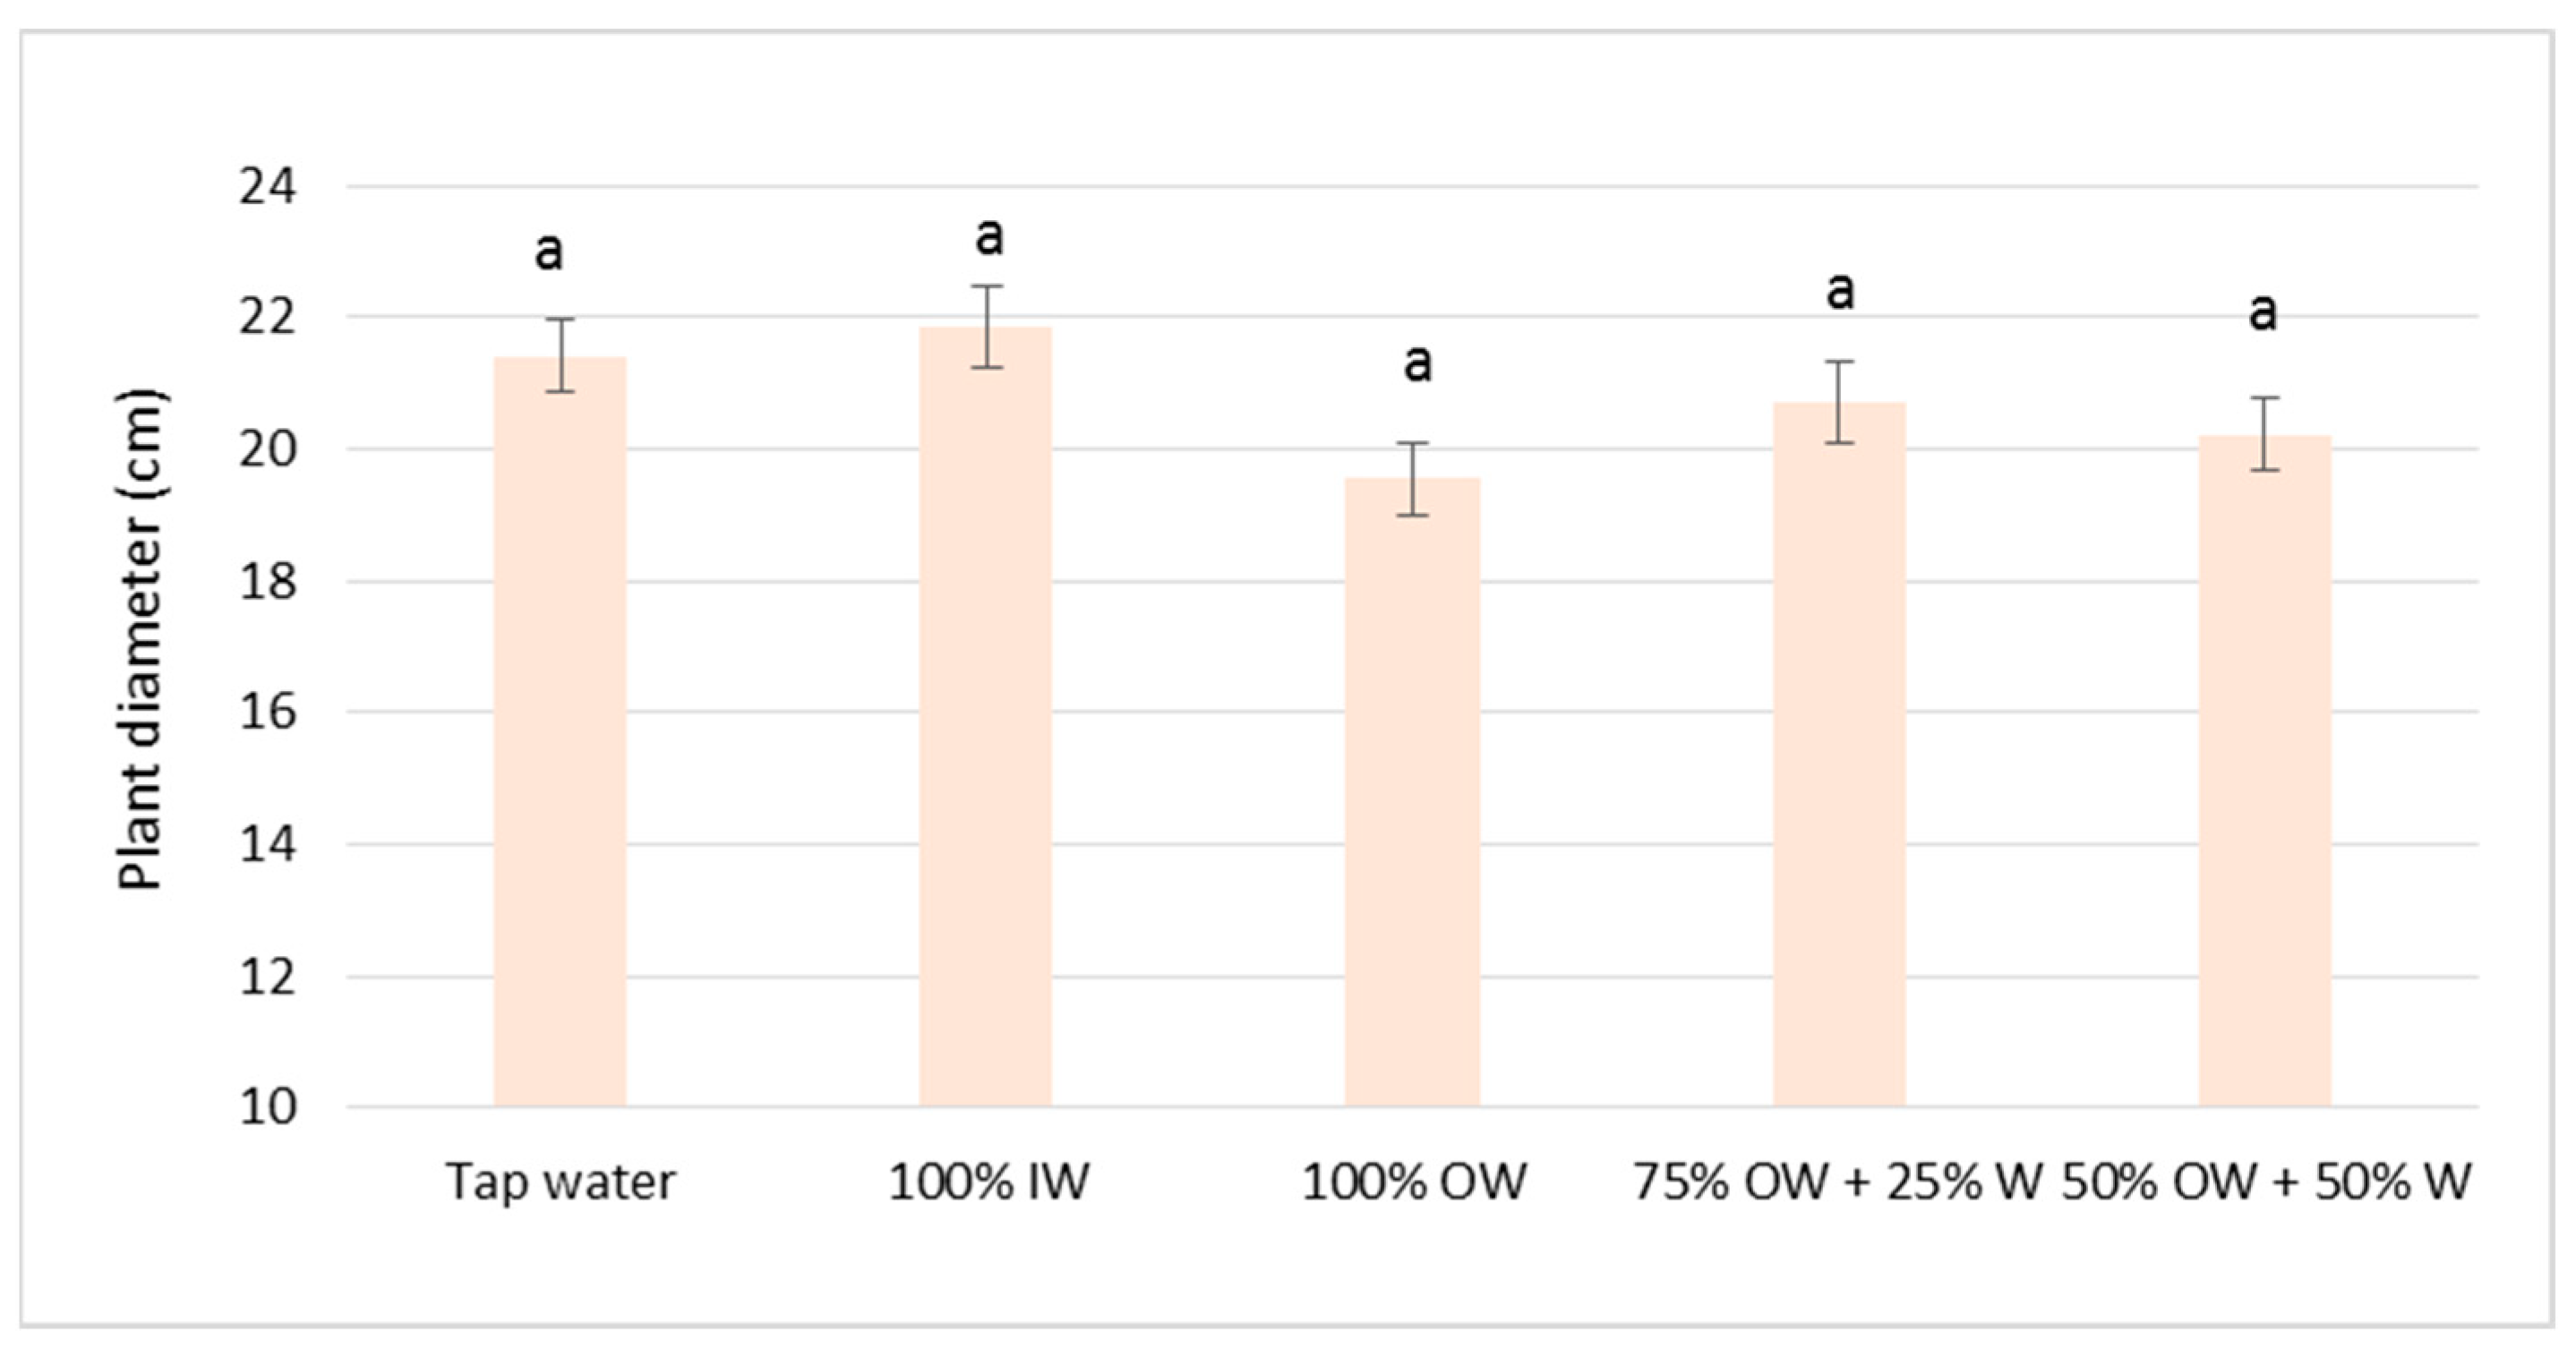
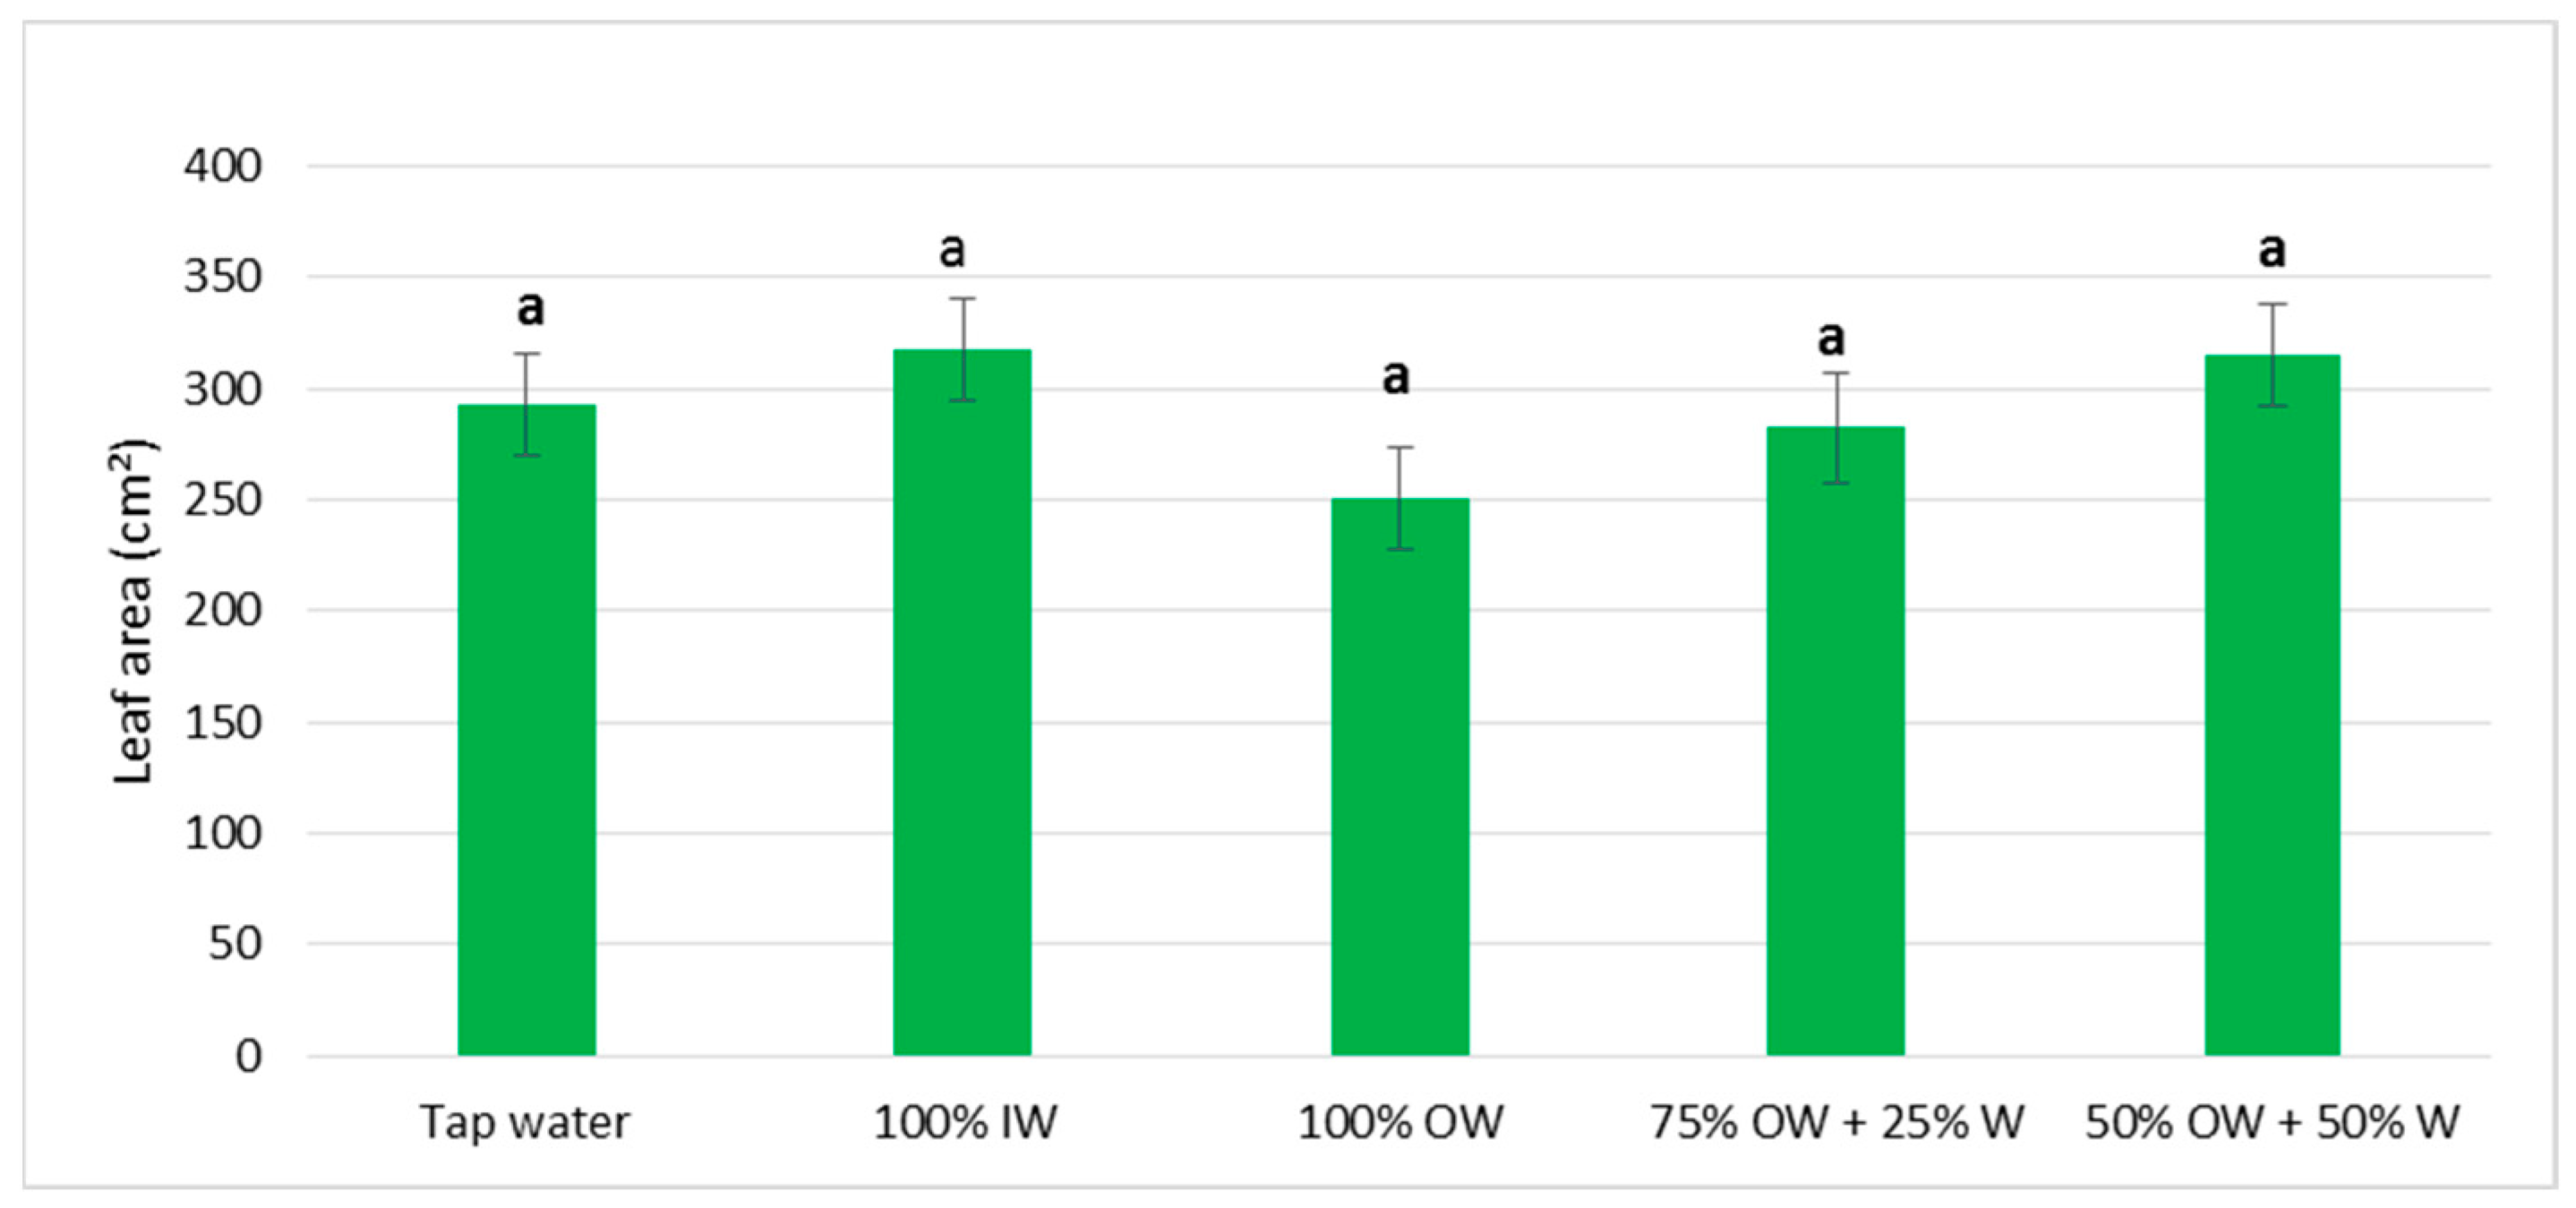
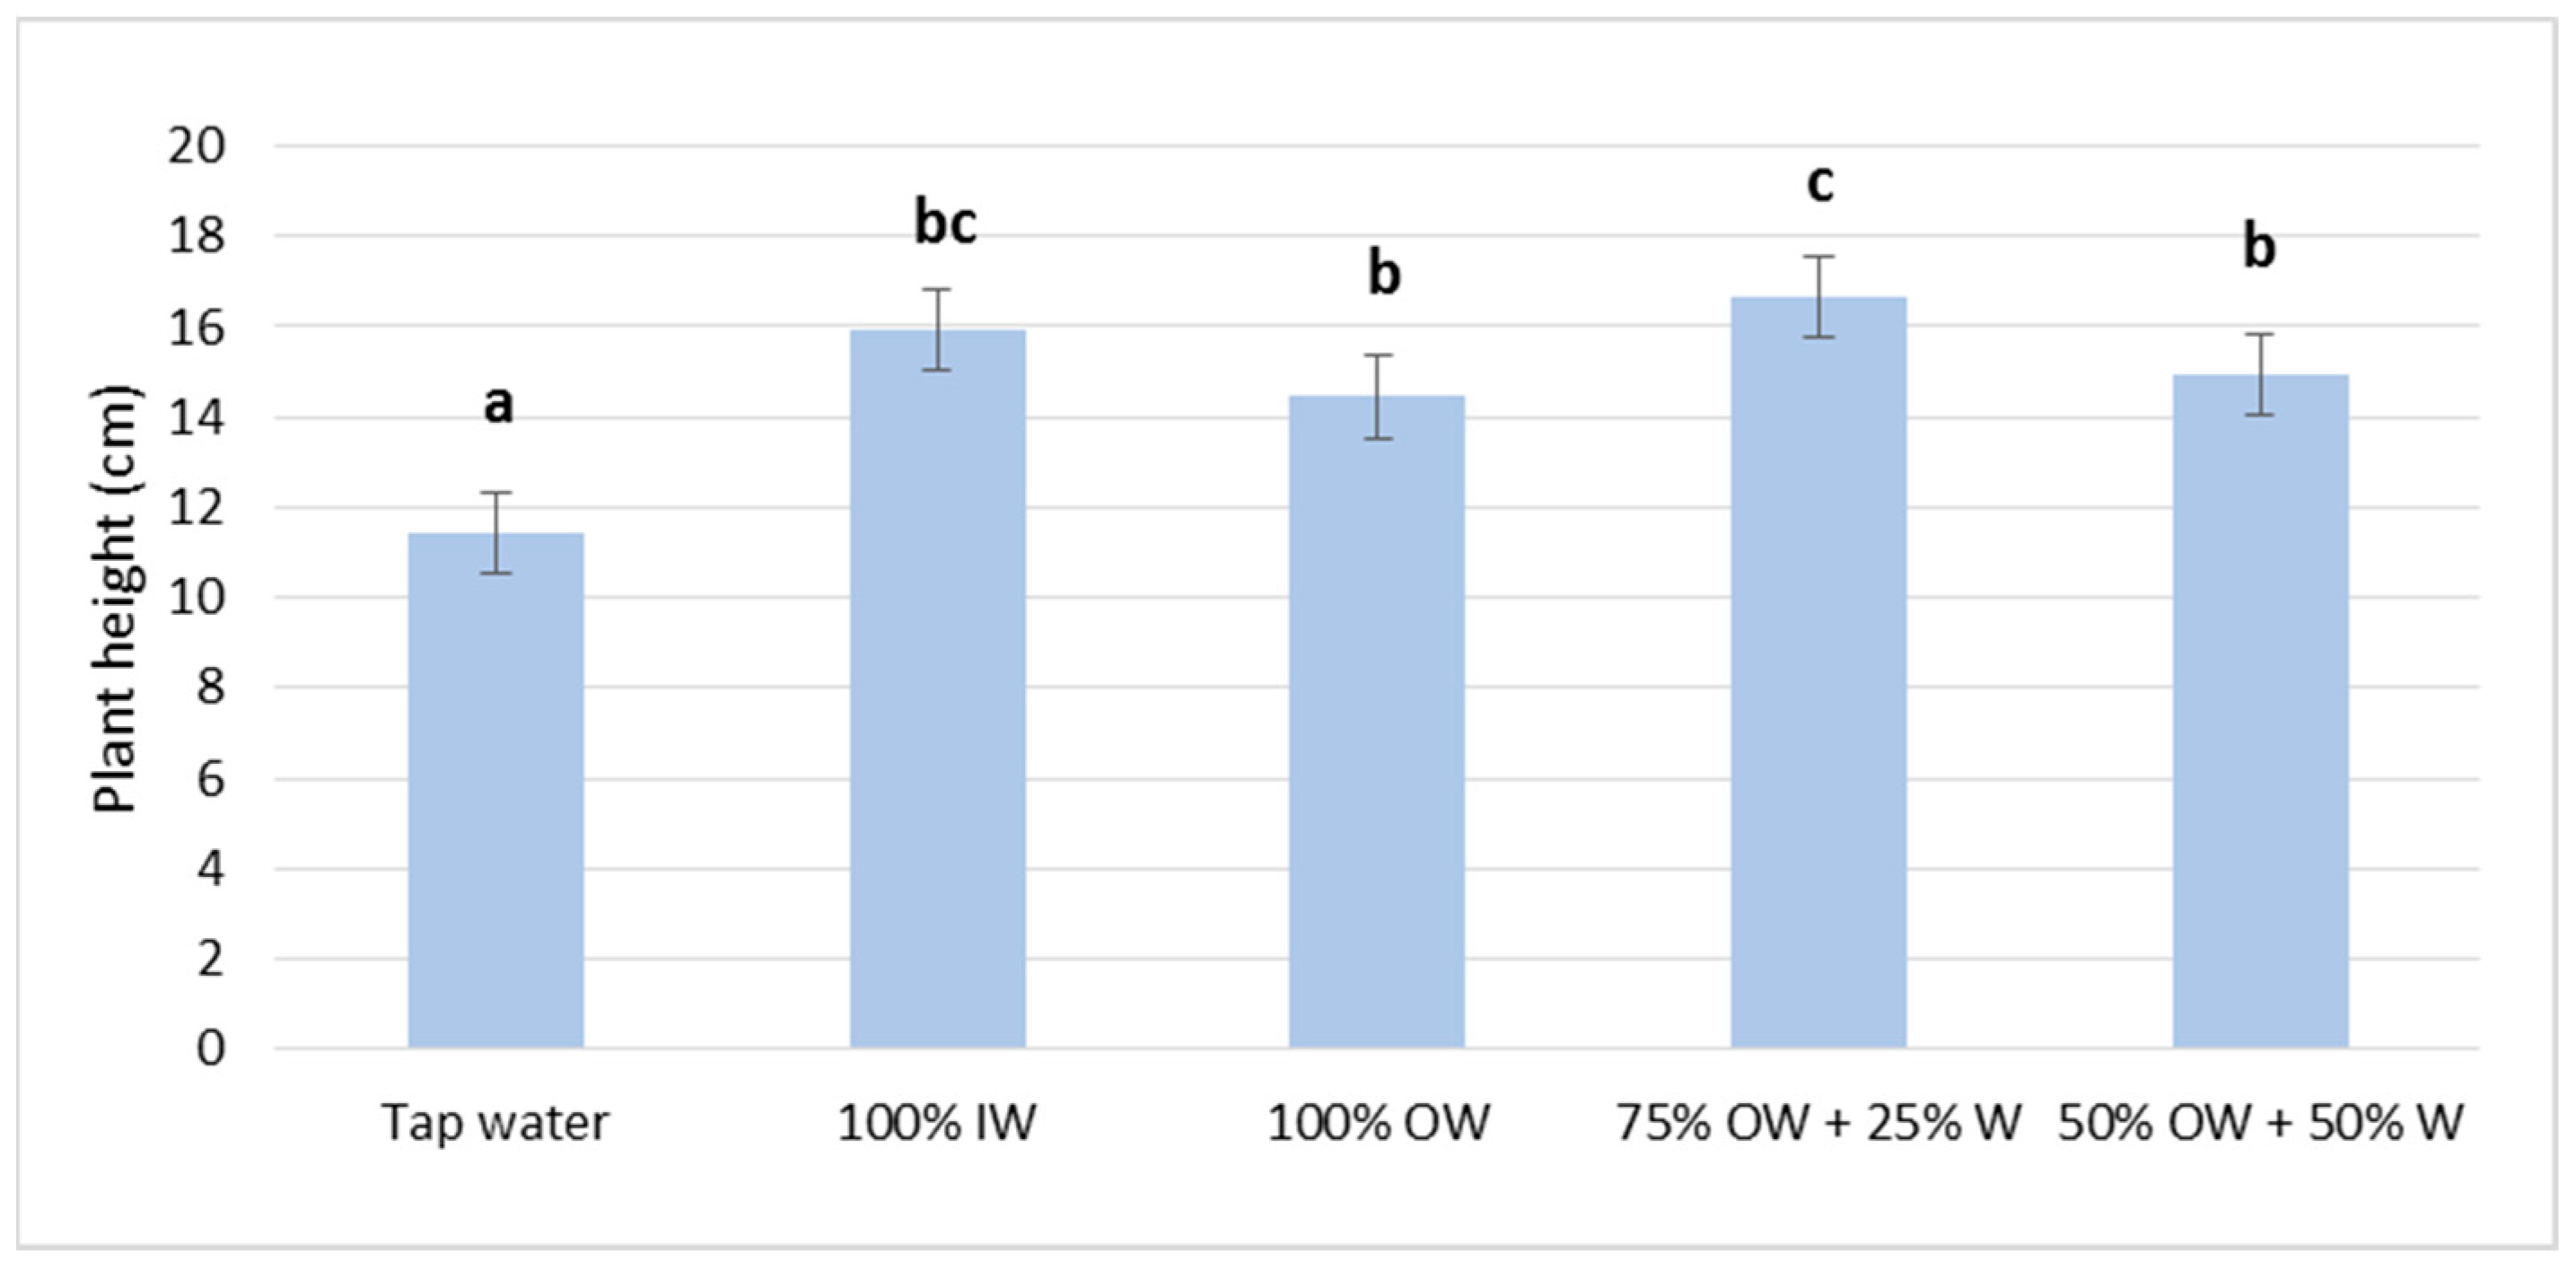
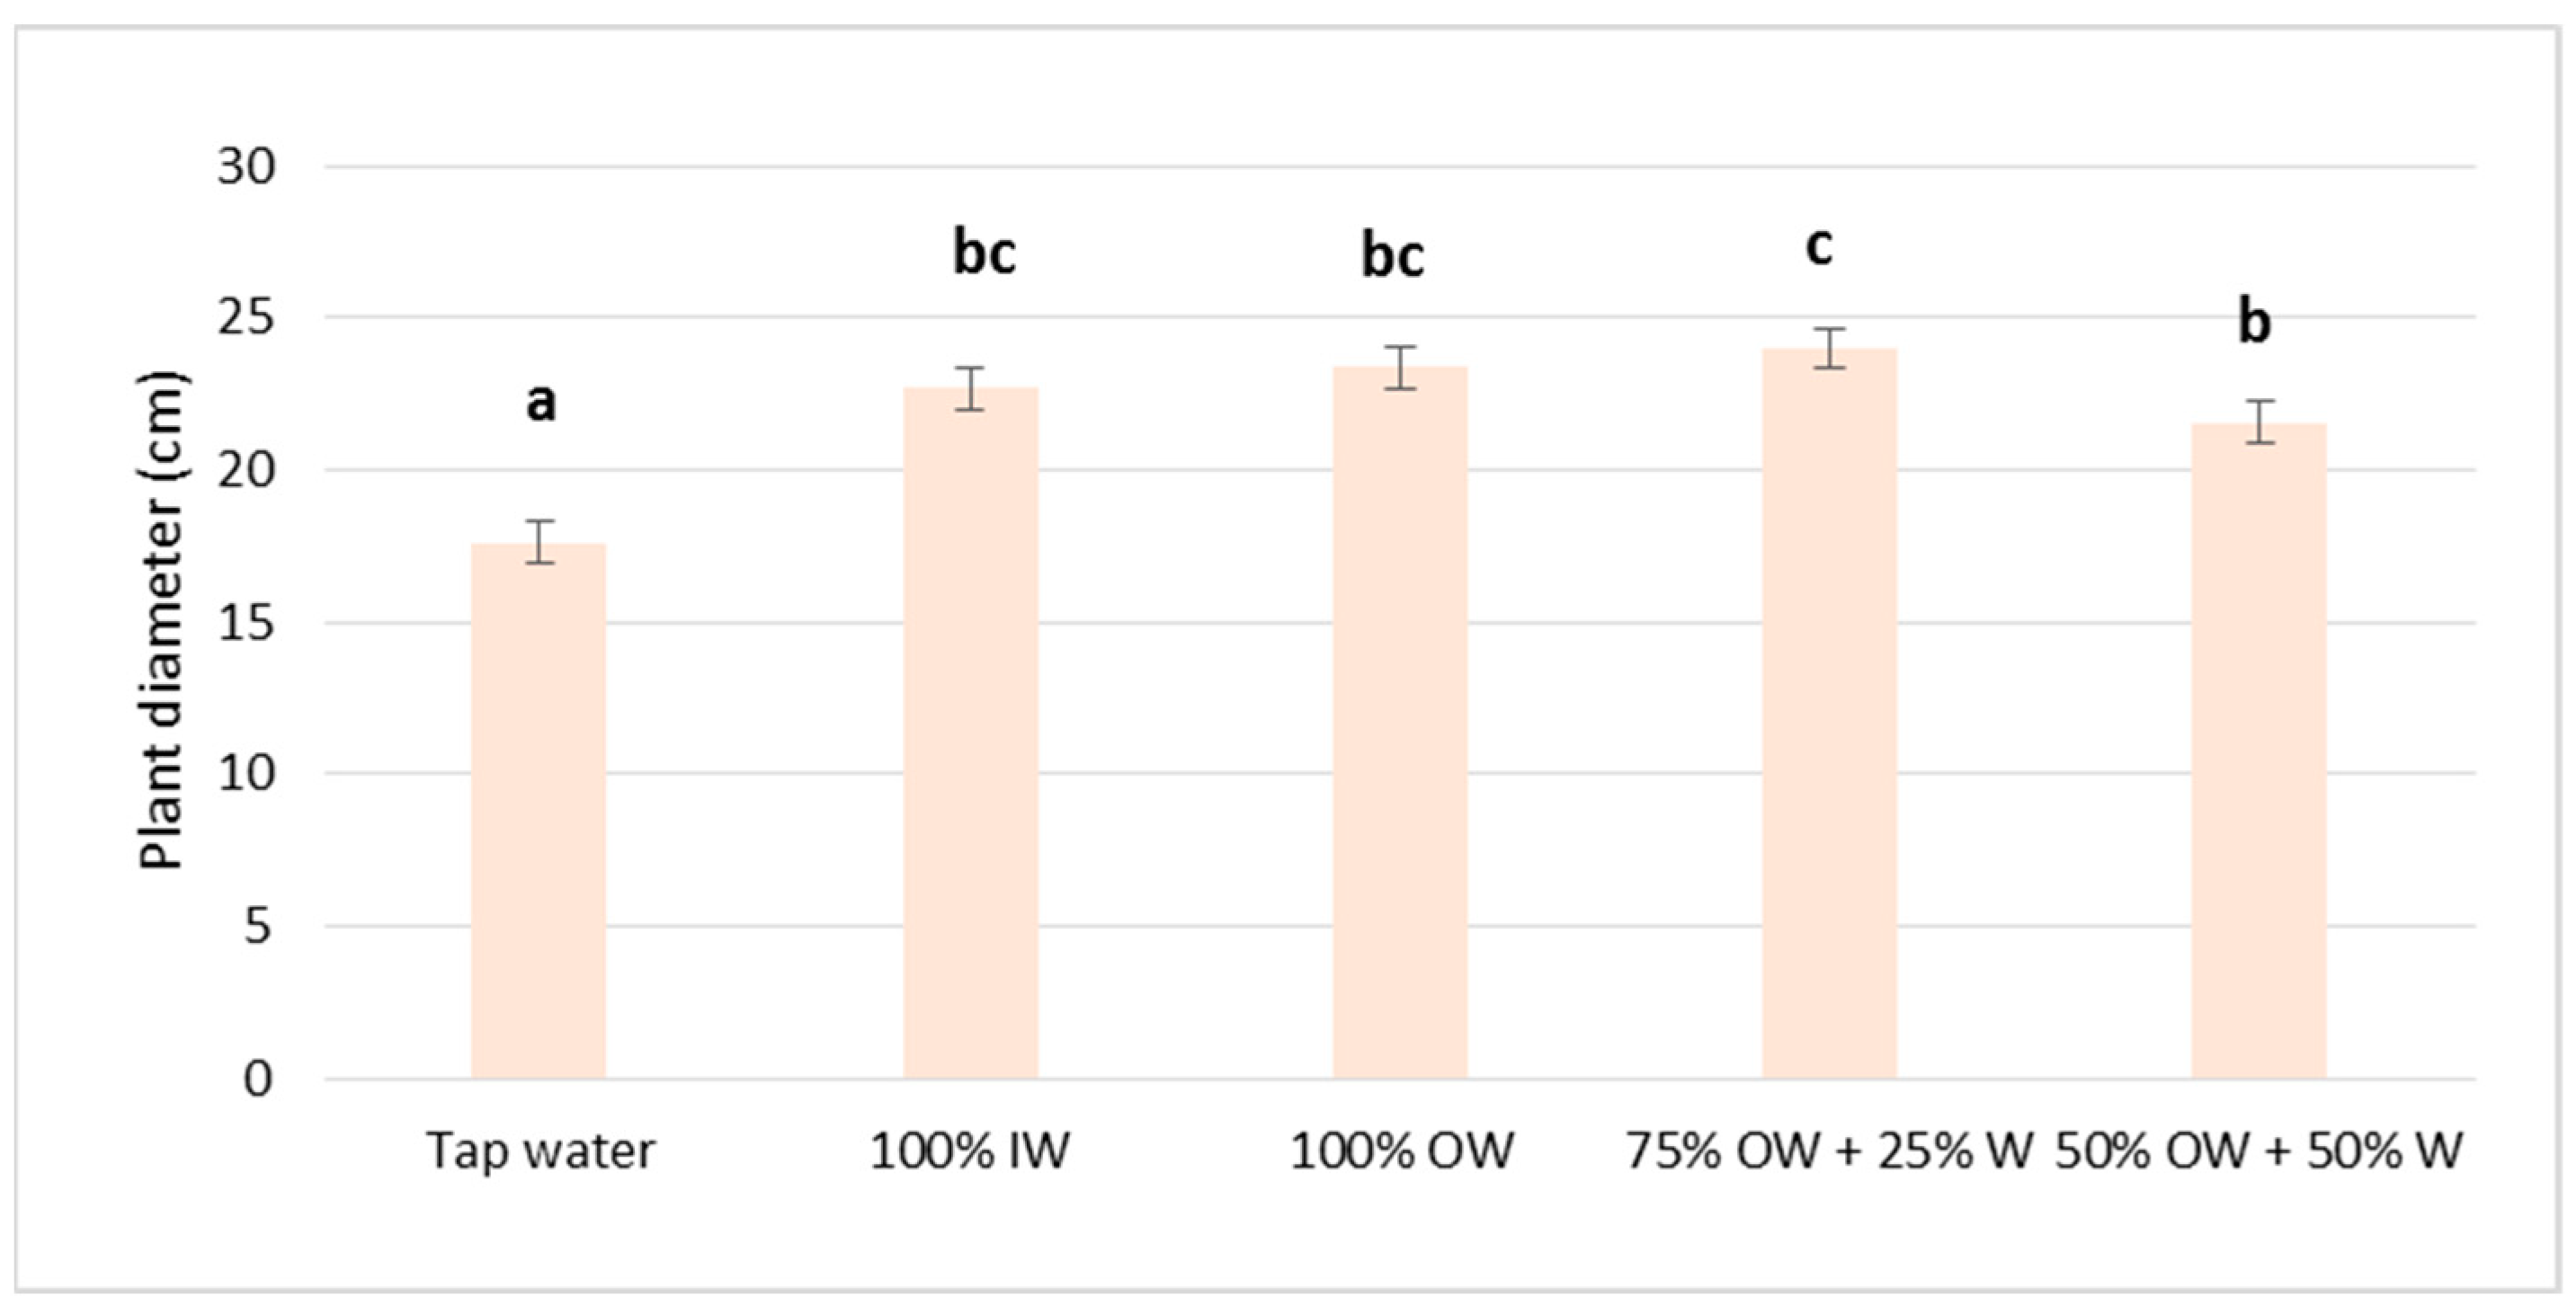
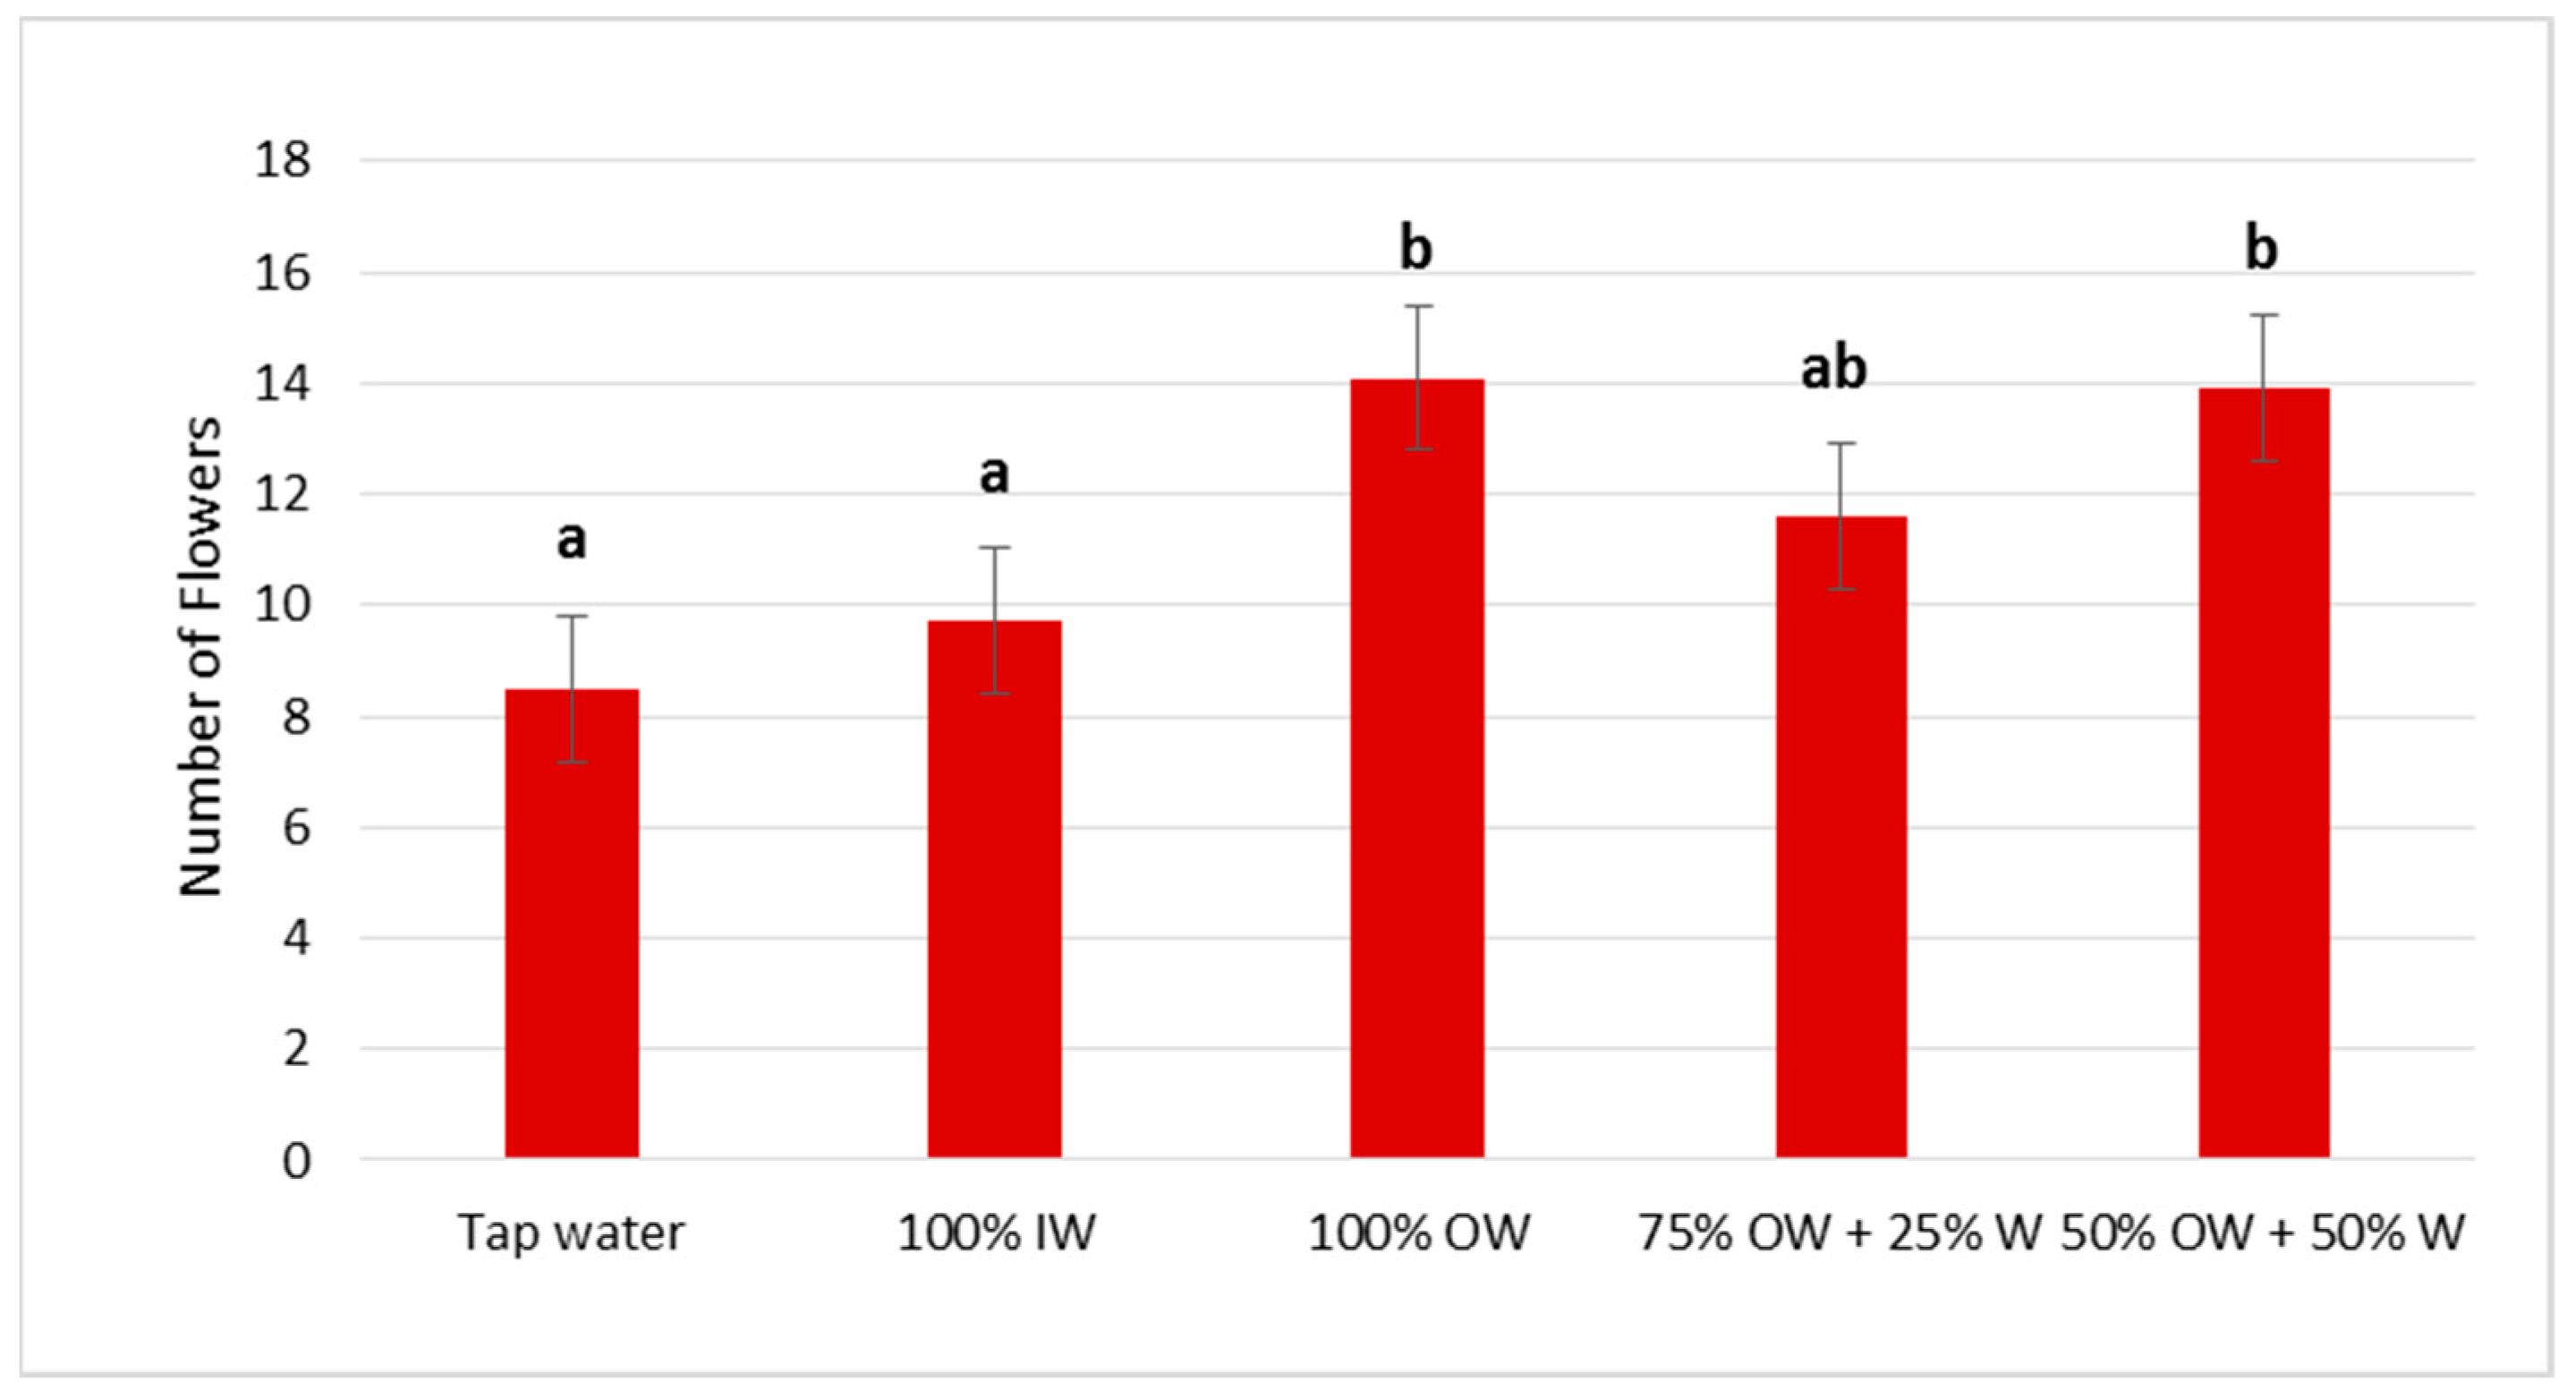
3.2. Plant Biometric Parameters

3.2.1. Autumn Growing Season

The irrigation with wastewater does not had a significant negative effect on the plant’s height, diameter, leaf, root, or total dry weight (Figure 2, Figure 3, Figure 4 and Figure 5). However, the 100% OW treatment resulted in a 29% decline in stem dry weight compared to the 100% IW treatment. No significant differences were found among the other treatments.

3.2.2. Spring Growing Season

Significant differences were found between treatments in plant height and diameter, leaf and root dry weight, the number of flowers, and leaf area (Figure 6, Figure 7, Figure 8, Figure 9 and Figure 10). Irrigation with wastewater positively affected the height and diameter of the plant, the dry weight of the leaves, the number of flowers, and the leaf area. No difference was found in leaf and total dry weight between the wastewater treatments. Treatment with 50% OW + 50% W resulted in an increase in root dry weight and the number of flowers. However, the number of flowers in this treatment was comparable to the 100% OW and 75% OW + 25% W treatments. Considering leaf area, wastewater utilization led to a significant enhancement compared to the control (tap water). Specifically, the leaf area measurements showed significant improvements, with values of 1.87 times higher for 100% IW, 1.79 times higher for 100% OW, 1.82 times higher for 75% OW + 25% W, and 1.42 times higher for 50% OW + 50%W, compared to the control ones.

4. Discussion

The utilization of wastewater has the practical potential to reduce traditional water usage [23]. In addition to reducing water costs, utilizing wastewater, which frequently contains nutrients, can also decrease dependence on fertilizers [3]. However, it may also have a high electrical conductivity (EC). Paranychianakis and Chartzoulakis (2005) [24] classified water salinity according to EC as follows: freshwater with values below 0.6 dS m−1, slightly brackish with an EC ranging from 0.6 to 1.5 dS m−1, brackish with an EC of 1.5 to 3.0 dS m−1, moderately saline from 3 to 8 dS m−1, saline from 8 to 15 dS m−1, and very saline from 15 to 45 dS m−1. In this trial, the EC of the pure wastewater was 3.32 and 3.15 dS m−1 for the autumn and spring seasons, respectively, indicating that it can be considered moderately saline water. Plants may exhibit a decrease in growth parameters, such as biomass or leaf area, due to the osmotic and ionic effects of salinity [25]. To mitigate the impacts of low-quality water use on agricultural crop productivity, it is crucial to adopt effective management practices. These practices can be divided into three distinct categories: (a) irrigation management strategies, (b) plant cultural practices, and (c) selection of salt-tolerant genotypes [24,26]. In this study, a salt-tolerant species was utilized, and wastewater was diluted with tap water to mitigate the potential adverse effects of salinity. Accordingly, some agronomic trials involved blending wastewater with clean water to regulate its concentration [27]. The pH of all wastewater treatments was alkaline but lower than that of tap water. The pH can influence nutrient availability [28], but in this study, peat, which is acidic, was used as a substrate. During the autumn and spring growing periods, the wastewater exhibited high concentrations of N, P, Ca, Mg, K, and S, providing essential nutrients for plants.
Wastewater irrigation has continuously been utilized to manage crop production, due to the high concentration of nutrients [27]. Higher amounts of wastewater utilization correspond to greater nutrient abundance, which is crucial for crop growth [27,29]. Ahsan et al. (2022) [30] indicated a significant increase in P, K, and Ca contents in all studied plant parts of Rosa species with the duration of irrigation using treated wastewater. Treated wastewater (100% OW) contains a significant amount of nitrogen, albeit lower than untreated wastewater (100% IW). Before microalga phytodepuration, ammonium is the primary form of nitrogen in wastewater. However, after phytodepuration, nitrate becomes the predominant form of nitrogen. Although nitrate levels in influent wastewater are low, they rise in the effluent, indicating the conversion of ammonia not only by microalgae but also by nitrifying bacteria into nitrates [11]. This conversion can be beneficial for plants sensitive to ammonium. On the other hand, the salinity level in treated wastewater consistently exceeds that of the source and varies based on the wastewater source and treatment method [31]. In this study, the concentration of salts (Cl and Na) was higher in the treatments with wastewater than in tap water. Typically, wastewater contains a salinity level of 1.5–2 times higher than that of freshwater [31], which can be detrimental to the plant [32]. To minimize the salinity problem, among other strategies, it is necessary to consider the use of wastewater in combination with freshwater and the selection of salt-tolerant crops [31]. Furthermore, the plants respond differently to salinity, depending on the species [33,34].
Most studies emphasize that wastewater irrigation positively affects crop yields [27,35]. However, this depends on the characteristics of the wastewater. Irrigation with domestic and breeding wastewater could significantly enhance crop yields, while industrial wastewater has a negative, but insignificant effect on crop responses [27]. Greywater, representing 50–75% of domestic wastewater, contains lower nutrient loads and insignificant amounts of pathogens and heavy metals compared to blackwater [1]. During the autumn period of this study, all treatments with pure and diluted wastewater showed comparable results to the control. No significant differences were observed in plant height, plant diameter, the number of leaves, stem diameter, root length, total dry weight, and leaf area. However, there was an increase in stem weight in the 50% wastewater treatment compared to the 100% wastewater treatment. In contrast, during spring, there was an improvement in most plant growth parameters (such as plant height and diameter, leaf dry weight, the number of flowers, and leaf area) when wastewater was used instead of tap water. The three wastewater treatments after microalgae production exhibited similar behavior, with no significant differences in plant diameter, leaf dry weight, stem, total weight, or the number of flowers. However, there was an increase in root dry weight when wastewater dilution was increased, and a reduction in leaf area was observed in the 50% wastewater treatment compared to 75% and 100% OW. The difference in results between the autumn and spring periods may be attributed to the increased light levels in the greenhouse during the spring season [36].
Environmental conditions significantly influence crop growth and, therefore, affect nutrient requirements. In this assay, the total dry weight ranged from 0.78 to 0.93 g in autumn and between 1.78 and 2.21 g in spring. In both autumn and spring, wastewater can be used for irrigation purposes. In spring, due to increased dry matter production, the substrate was insufficient to meet crop needs. The additional supply of nutrients from wastewater led to improved yields. Wastewater is a valuable source of nutrients [37]. Studies have shown that the reuse of wastewater as supplemental irrigation has resulted in increased crop yields, water use efficiency, and nitrogen use efficiency, making it a viable source of plant nutrients [38]. By containing nutrients, wastewater leads to enhanced plant growth and reduces the need for chemical fertilizers, consequently lowering production costs [38]. Therefore, water resources should be used with greater efficiency, and the utilization of non-traditional water resources, such as treated wastewater, might be increased [31].

5. Conclusions

Wastewater can serve as a nutrient source for efficient crop growth due to its elevated levels of N, P, K, Ca, Mg, and S compared to tap water. However, the concentrations of Cl and Na in wastewater treatment were more than double those in tap water, indicating a significant salt content. This restricts its usage to species that are sensitive to salinity unless wastewater is diluted with fresh water at a reliable ratio. In the autumn season, irrigation with wastewater from microalgae production did not have a significant effect on the evaluated biometric variables compared to tap water. During the spring season, significant improvements were observed in plants irrigated with wastewater compared to those irrigated with tap water. Wastewater from microalgae production can not only be used as irrigation water but also serves as a valuable source of nutrients, although caution is advised due to the high concentration of Na and Cl. These results support the feasibility and efficacy of using wastewater after microalgae production in agriculture, highlighting its potential positive impact on crop yields.
For future studies, it is recommended to investigate the implementation of an additional tertiary purification process, focusing on the removal of Cl and Na concentrations. This process could improve the quality of the wastewater, making it even more suitable for use in agricultural irrigation without the need for significant dilution. Long-term studies should also be carried out to assess the possible cumulative effects of wastewater use on soil and crop quality, as well as its impact on agricultural sustainability. Finally, the economic and environmental balance of wastewater use, both with traditional irrigation and with the incorporation of additional purification processes, should be examined to provide a comprehensive view of its viability and sustainability in agriculture.

Author Contributions

Conceptualization, C.G.-S. and S.J.-B.; methodology, C.G.-S. and S.J.-B.; software, S.J.-B.; validation, C.G.-S.; formal analysis, A.R.-C.; investigation, A.R.-C.; resources, C.V.G.-L.; data curation, A.R.-C.; writing—original draft preparation, A.R.-C.; writing—review and editing, S.J.-B. and M.B.H.; visualization, C.G.-S. and M.B.H.; supervision, S.J.-B.; project administration, C.V.G.-L. All authors have read and agreed to the published version of the manuscript.

Funding

Project Demonstration on a pilot scale of the production of bioproducts from cyanobacteria by treating residual effluents (Cyan2Bio). Aid PID2021-126564OB-C31 funded by MCIN/AEI/10.13039/501100011033 and by “ERDF A way of making Europe”. Thanks to the National University of Agriculture for the Doctoral scholarship awarded to Alejandro José Rápalo Cruz.

Data Availability Statement

Data is contained within the article.

Conflicts of Interest

The authors declare that they have no known competing financial interests or personal relationships that could have appeared to influence the work reported in this paper.

References

  1. Melo, M.R.d.S.; Dias, N.d.S.; de Medeiros, I.J.N.; Travassos, K.D.; Miranda, N.d.O.; Gurgel, M.T.; Neto, H.d.S.L.; Fernandes, C.d.S. Strategies for applying gray water effluent on ornamental sunflower crops. Environ. Sci. Pollut. Res. 2020, 27, 38537–38544. [Google Scholar] [CrossRef] [PubMed]
  2. Zhang, B.; Guo, H.; Zhang, Y.; Li, Z.; Liu, Y.; Wang, S.; Fu, Z. A coupling simulation and optimization method developed for environmental-economic management of Lake watershed. J. Environ. Manag. 2022, 318, 115546. [Google Scholar] [CrossRef]
  3. Kolekar, S.; Sankapal, P.; Khare, K.; Chinnasamy, P. Assessment of recycled treated wastewater for sustainable tomato crop production: A comprehensive review. Environ. Chall. 2023, 13, 100791. [Google Scholar] [CrossRef]
  4. Alexandratos, N.; Bruinsma, J.; Alexandratos, N.; Bruinsma, J. World Agriculture towards 2030/2050: The 2012 Revision; ESA: Paris, France, 2012. [Google Scholar] [CrossRef]
  5. Bhandari, M.; Kumar, P.; Bhatt, P.; Simsek, H.; Kumar, R.; Chaudhary, A.; Malik, A.; Prajapati, S.K. An integration of algae-mediated wastewater treatment and resource recovery through anaerobic digestion. J. Environ. Manag. 2023, 342, 118159. [Google Scholar] [CrossRef]
  6. Abdelfattah, A.; Ali, S.S.; Ramadan, H.; El-Aswar, E.I.; Eltawab, R.; Ho, S.-H.; Elsamahy, T.; Li, S.; El-Sheekh, M.M.; Schagerl, M.; et al. Microalgae-based wastewater treatment: Mechanisms, challenges, recent advances, and future prospects. Environ. Sci. Ecotechnol. 2023, 13, 100205. [Google Scholar] [CrossRef] [PubMed]
  7. Procházková, M.; Touš, M.; Horňák, D.; Miklas, V.; Vondra, M.; Máša, V. Industrial wastewater in the context of European Union water reuse legislation and goals. J. Clean. Prod. 2023, 426, 139037. [Google Scholar] [CrossRef]
  8. Bonaguro, J.E.; Coletto, L.; Sambo, P.; Nicoletto, C.; Zanin, G. Environmental Analysis of Sustainable Production Practices Applied to Cyclamen and Zonal Geranium. Horticulturae 2021, 7, 8. [Google Scholar] [CrossRef]
  9. Navarro, T. Water reuse and desalination in Spain–challenges and opportunities. J. Water Reuse Desalination 2018, 8, 153–168. [Google Scholar] [CrossRef]
  10. Cao, X.; Bosch, D.; Pease, J. Recycling Irrigation Water on Ornamental Nursery Operations: Will Consumer Premiums Compensate for Growers’ Costs? In Proceedings of the Agricultural and Applied Economics Association Annual Meeting, Chicago, IL, USA, 30 July–1 August 2017; p. 259126. [Google Scholar] [CrossRef]
  11. Morillas-España, A.; Lafarga, T.; Sánchez-Zurano, A.; Acién-Fernández, F.G.; Rodríguez-Miranda, E.; Gómez-Serrano, C.; González-López, C.V. Year-long evaluation of microalgae production in wastewater using pilot-scale raceway photobioreactors: Assessment of biomass productivity and nutrient recovery capacity. Algal Res. 2021, 60, 102500. [Google Scholar] [CrossRef]
  12. Zhuang, L.-L.; Yang, P.; Liang, S.; Yu, T.; Liu, C.; Zhao, T.; Tan, G.; Niu, Y.; Zhang, J. Comparison of microalgae cultivation modes for advanced wastewater purification and pollutant-resource conversion: A pilot study. J. Water Process Eng. 2023, 56, 104374. [Google Scholar] [CrossRef]
  13. Renuka, N.; Prasanna, R.; Sood, A.; Bansal, R.; Bidyarani, N.; Singh, R.; Shivay, Y.S.; Nain, L.; Ahluwalia, A.S. Wastewater grown microalgal biomass as inoculants for improving micronutrient availability in wheat. Rhizosphere 2017, 3, 150–159. [Google Scholar] [CrossRef]
  14. Lu, W.; Asraful Alam, M.; Liu, S.; Xu, J.; Parra Saldivar, R. Critical processes and variables in microalgae biomass production coupled with bioremediation of nutrients and CO2 from livestock farms: A review. Sci. Total Environ. 2020, 716, 135247. [Google Scholar] [CrossRef] [PubMed]
  15. Renuka, N.; Sood, A.; Prasanna, R.; Ahluwalia, A.S. Phycoremediation of wastewaters: A synergistic approach using microalgae for bioremediation and biomass generation. Int. J. Environ. Sci. Technol. 2015, 12, 1443–1460. [Google Scholar] [CrossRef]
  16. Pittman, J.K.; Dean, A.P.; Osundeko, O. The potential of sustainable algal biofuel production using wastewater resources. Bioresour. Technol. 2011, 102, 17–25. [Google Scholar] [CrossRef]
  17. Salachna, P. Trends in Ornamental Plant Production. Horticulturae 2022, 8, 413. [Google Scholar] [CrossRef]
  18. Gabellini, S.; Scaramuzzi, S. Evolving consumption trends, marketing strategies, and governance settings in ornamental horticulture: A review of the grey literature. Horticulturae 2022, 8, 234. [Google Scholar] [CrossRef]
  19. Darras, A.I.; Grigoropoulou, K.; Dimiza, K.; Zulfiqar, F. Effects of brief UV-C irradiation treatments on the rooting performance of Pelargonium × hortorum stem cuttings (L.h. bailey). Horticulturae 2022, 8, 897. [Google Scholar] [CrossRef]
  20. Torres, A.P.; Lopez, R.G. Commercial greenhouse production: Measuring daily light integral in a greenhouse. Purdue Agr. 2010, 7, HO-238-W. [Google Scholar]
  21. Kesari, K.K.; Soni, R.; Jamal, Q.M.S.; Tripathi, P.; Lal, J.A.; Jha, N.K.; Siddiqui, M.H.; Kumar, P.; Tripathi, V.; Ruokolainen, J. Wastewater treatment and reuse: A review of its applications and health implications. Water Air Soil Pollut. 2021, 232, 208. [Google Scholar] [CrossRef]
  22. Giuffrida, F.; Rouphael, Y.; Toscano, S.; Scuderi, D.; Romano, D.; Rivera, C.M.; Colla, G.; Leonardi, C. A simple model for nondestructive leaf area estimation in bedding plants. Photosynthetica 2011, 49, 380. [Google Scholar] [CrossRef]
  23. Sharma, M.; Agarwal, S.; Agarwal Malik, R.; Kumar, G.; Pal, D.B.; Mandal, M.; Sarkar, A.; Bantun, F.; Haque, S.; Singh, P.; et al. Recent advances in microbial engineering approaches for wastewater treatment: A review. Bioengineered 2023, 14, 2184518. [Google Scholar] [CrossRef] [PubMed]
  24. Paranychianakis, N.V.; Chartzoulakis, K.S. Irrigation of Mediterranean crops with saline water: From physiology to management practices. Agric. Ecosyst. Environ. 2005, 106, 171–187. [Google Scholar] [CrossRef]
  25. García-Caparrós, P.; Lao, M.T. The effects of salt stress on ornamental plants and integrative cultivation practices. Sci. Hortic. 2018, 240, 430–439. [Google Scholar] [CrossRef]
  26. Egamberdieva, D.; Wirth, S.; Bellingrath-Kimura, S.D.; Mishra, J.; Arora, N.K. Salt-tolerant plant growth promoting rhizobacteria for enhancing crop productivity of saline soils. Front. Microbiol. 2019, 10, 2791. [Google Scholar] [CrossRef]
  27. Wang, H.-J.; Wang, J.; Yu, X. Wastewater irrigation and crop yield: A meta-analysis. J. Integr. Agric. 2022, 21, 1215–1224. [Google Scholar] [CrossRef]
  28. Coskun, D.; White, P.J. Ion-uptake mechanisms of individual cells and roots: Short-distance transport. In Marschner’s Mineral Nutrition of Plants; Rengel, E.Z., Cakmak, I., White, P.J., Eds.; Elsevier: Amsterdam, The Netherlands, 2023; pp. 11–71. [Google Scholar]
  29. Ortiz Tena, F.; Bickel, V.; Steinweg, C.; Posten, C. Continuous microalgae cultivation for wastewater treatment–Development of a process strategy during day and night. Sci. Total Environ. 2024, 912, 169082. [Google Scholar] [CrossRef]
  30. Ahsan, M.; Nafees, M.; Amin, M.; Nawaz, F.; Tufail, A.; Sardar, H.; Shokralla, S.; Mahmoud, E.A.; El-Sabrout, A.M.; Elansary, H.O. Nutrients uptake and accumulation in plant parts of fragrant Rosa species irrigated with treated and untreated wastewater. Plants 2022, 11, 1260. [Google Scholar] [CrossRef]
  31. Hashem, M.S.; Qi, X. Treated Wastewater irrigation—A review. Water 2021, 13, 1527. [Google Scholar] [CrossRef]
  32. Marroquin, A.; Holmes, K.; Salazar, D. Soil salinization and chemically mediated plant–insect interactions in a changing climate. Curr. Opin. Insect Sci. 2020, 60, 101130. [Google Scholar] [CrossRef]
  33. Mahajan, S.; Tuteja, N. Cold, salinity and drought stresses: An overview. Arch. Biochem. Biophys. 2005, 444, 139–158. [Google Scholar] [CrossRef] [PubMed]
  34. Pereira, B.F.F.; He, Z.L.; Stoffella, P.J.; Melfi, A.J. Reclaimed wastewater: Effects on citrus nutrition. Agric. Water Manag. 2011, 98, 1828–1833. [Google Scholar] [CrossRef]
  35. Wu, Y.; Yan, S.; Fan, J.; Zhang, F.; Xiang, Y.; Zheng, J.; Guo, J. Responses of growth, fruit yield, quality and water productivity of greenhouse tomato to deficit drip irrigation. Sci. Hortic. 2021, 275, 109710. [Google Scholar] [CrossRef]
  36. Kwon, O.-H.; Choi, H.-G.; Kim, S.-J.; Kim, W.-H. Assessment of Four-Seasonal Quality and Yield of Cut Flower Roses Grafted onto Rosa Rootstocks. Agriculture 2022, 12, 1848. [Google Scholar] [CrossRef]
  37. Ting, W.H.T.; Tan, I.A.W.; Salleh, S.F.; Wahab, N.A. Application of water hyacinth (Eichhornia crassipes) for phytoremediation of ammoniacal nitrogen: A review. J. Water Process Eng. 2018, 22, 239–249. [Google Scholar] [CrossRef]
  38. Tabatabaei, S.H.; Nourmahnad, N.; Kermani, S.G.; Tabatabaei, S.A.; Najafi, P.; Heidarpour, M. Urban wastewater reuse in agriculture for irrigation in aridand semi-arid regions–A review. Int. J. Recycl. Org. Waste Agric. 2020, 9, 193–220. [Google Scholar] [CrossRef]
Figure 1. Scheme about the experiments.
Horticulturae 10 00921 g001
Figure 2. The height (cm) of Pelargonium × hortorum plants irrigated with microalgae wastewater during the autumn season. The results are presented as means with standard error. Columns with different letters indicate significant differences (p ˂ 0.05) based on LSD. Tap water (control 1); 100% IW—inlet wastewater (control 2); 100% OW—outlet from the reactor; 75% OW + 25% W—75% outlet from the reactor and 25% tap water; and 50% OW + 50% W—50% outlet from the reactor and 50% tap water.
Horticulturae 10 00921 g002
Figure 3. The diameter (cm) of Pelargonium × hortorum plants irrigated with microalgae wastewater during the autumn season. The results are presented as means with standard error. Columns with different letters indicate significant differences (p ˂ 0.05) based on LSD. Tap water (control 1); 100% IW—inlet wastewater (control 2); 100% OW—outlet from the reactor; 75% OW + 25% W—75% outlet from the reactor and 25% tap water; and 50% OW + 50% W—50% outlet from the reactor and 50% tap water.
Horticulturae 10 00921 g003
Figure 4. The leaf area (cm2) of Pelargonium × hortorum plants irrigated with microalgae wastewater during the autumn season. The results are presented as means with standard error. Columns with different letters indicate significant differences (p ˂ 0.05) based on LSD. Tap water (control 1); 100% IW—inlet wastewater (control 2); 100% OW—outlet from the reactor; 75% OW + 25%—W 75% outlet from the reactor and 25% tap water; and 50% OW + 50% W—50% outlet from the reactor and 50% tap water.
Horticulturae 10 00921 g004
Figure 5. The dry weight (g) of Pelargonium × hortorum plants irrigated with microalgae wastewater during the autumn season. The results are presented as means with standard error. Columns with different letters indicate significant differences (p ˂ 0.05) based on LSD. Tap water (control 1); 100% IW—inlet wastewater (control 2); 100% OW—outlet from the reactor, 75% OW + 25% W—75% outlet from the reactor and 25% tap water; and 50% OW + 50% W—50% outlet from the reactor and 50% tap water.
Horticulturae 10 00921 g005
Figure 6. The height (cm) of Pelargonium × hortorum plants irrigated with microalgae wastewater during the spring season. The results are presented as means with standard error. Columns with different letters indicate significant differences (p ˂ 0.05) based on LSD. Tap water (control 1); 100% IW—inlet wastewater (control 2); 100% OW—outlet from the reactor; 75% OW + 25% W—75% outlet from the reactor and 25% tap water; and 50% OW + 50% W—50% outlet from the reactor and 50% tap water.
Horticulturae 10 00921 g006
Figure 7. The diameter (cm) of Pelargonium × hortorum plants irrigated with microalgae wastewater during the spring season. The results are presented as means with standard error. Columns with different letters indicate significant differences (p ˂ 0.05) based on LSD. Tap water (control 1); 100% IW—inlet wastewater (control 2); 100% OW—outlet from the reactor; 75% OW + 25% W—75% outlet from the reactor and 25% tap water; and 50% OW + 50% W—50% outlet from the reactor and 50% tap water.
Horticulturae 10 00921 g007
Figure 8. The number of flowers in Pelargonium × hortorum plants irrigated with microalgae wastewater during the spring season. The results are presented as means with standard error. Columns with different letters indicate significant differences (p ˂ 0.05) based on LSD. Tap water (control 1); 100% IW—inlet wastewater (control 2); 100% OW—outlet from the reactor; 75% OW + 25% W—75% outlet from the reactor and 25% tap water; and 50% OW + 50% W—50% outlet from the reactor and 50% tap water.
Horticulturae 10 00921 g008
Figure 9. The leaf area (cm2) of Pelargonium × hortorum plants irrigated with microalgae wastewater during the spring season. The results are presented as means with standard error. Columns with different letters indicate significant differences (p ˂ 0.05) based on LSD. Tap water (control 1); 100% IW—inlet wastewater (control 2); 100% OW—outlet from the reactor; 75% OW + 25% W—75% outlet from the reactor and 25% tap water; and 50% OW + 50% W—50% outlet from the reactor and 50% tap water.
Horticulturae 10 00921 g009
Figure 10. The dry weight (g) of Pelargonium × hortorum plants irrigated with microalgae wastewater during the spring season. The results are presented as means with standard error. Columns with different letters indicate significant differences (p ˂ 0.05) based on LSD. Tap water (control 1); 100% IW—inlet wastewater (control 2); 100% OW—outlet from the reactor; 75% OW + 25% W—75% outlet from the reactor and 25% tap water; and 50% OW + 50% W—50% outlet from the reactor and 50% tap water.
Horticulturae 10 00921 g010
Table 1. Irrigation water analysis in the autumn experiment [pH, electrical conductivity (EC, measured in dS m−1)], and the quantification of anions and cations (measured in ppm), along with the consideration of standard error. It is important to note that values with different letters indicate statistically significant differences (p < 0.05).
Tap Water100% IW100% OW75% OW + 25% W50% OW + 50% W
pH8.49 ± 0.45 a7.99 ± 0.44 a7.73 ± 0.62 a7.93 ± 0.56 a7.89 ± 0.57 a
EC1.18 ± 0.41 a3.40 ± 0.43 b3.32 ± 0.17 b2.86 ± 0.20 ab2.42 ± 0.28 ab
NO34.03 ± 0.37 a0.21 ± 0.10 a144.08 ± 51.03 b118.01 ± 16.38 b82.10 ± 22.72 ab
NH4+0 a110.49 ± 7.09 b4.54 ± 2.78 a1.86 ± 0.04 a0.58 ± 0.73 a
N (NO3 + NH4+)0.91 a85.98 b36.06 ab28.09 ab18.99 a
PO43−0.00 a24.01 ± 0.18 d14.14 ± 4.03 c10.55 ± 2.73 bc7.11 ± 1.52 b
K+2.41 ± 0.10 a37.57 ± 3.72 b36.83 ± 8.38 b28.27 ± 6.21 b29.71 ± 10.67 b
Ca2+39.22 ± 2.39 a106.90 ± 28.08 b119.16 ± 15.38 b105.03 ± 19.79 b90.82 ± 22.72 b
Mg2+18.28 ± 2.01 a62.38 ± 21.86 b71.93 ± 13.59 b62.18 ± 16.07 b53.09 ± 17.57 b
SO42−20.71 ± 2.51 a125.13 ± 22.43 b178.43 ± 58.86 b141.64 ± 51.03 b108.39 ± 44.22 ab
Cl220.83 ± 20.03 a564.15 ± 138.56 b667.56 ± 52.95 b585.94 ± 81.27 b518.17 ± 125.78 b
Na+109.99 ± 9.50 a394.02 ± 117.88 b442.35 ± 65.73 b369.85 ± 66.71 b302.94 ± 70.80 b
Table 2. Irrigation water analysis in the spring experiment [pH, electrical conductivity (EC, measured in dS m−1)], and the quantification of anions and cations (measured in ppm), along with the consideration of standard error. It is important to note that values with different letters indicate statistically significant differences (p < 0.05).
Tap Water100% IW100% OW75% OW + 25% W50% OW + 50% W
pH8.50 ± 0.00 a7.70 ± 0.28 a8.12 ± 0.42 a7.95 ± 0.35 a8.15 ± 0.07 a
EC1.26 ± 0.16 a2.80 ± 0.06 b3.15 ± 0.84 c2.65 ± 0.54 b2.4 ± 0.00 b
NO34.68 ± 0.38 a3.20 ± 2.26 a47.06 ± 3.62 b39.83 ± 3.66 b24.47 ± 1.77 ab
NH4+0.00 a131.76 ± 8.29 c42.25 ± 9.74 b31.11 ± 7.06 b19.25 ± 4.07 ab
N (NO3 + NH4+)1.05 a103.20 b43.48 ab33.18 ab20.50 a
PO43−0.00 a34.40 ± 0.79 b14.66 ± 5.50 b11.49 ± 3.16 b6.77 ± 2.67 a
K+2.73 ± 0.11 a39.19 ± 1.30 b43.57 ± 10.91 b34.75 ± 7.65 b21.79 ± 5.32 b
Ca2+48.74 ± 3.40 a70.95 ± 0.47 a83.94 ± 4.80 a75.66 ± 2.54 a65.40 ± 1.07 a
Mg2+24.60 ± 2.47 a33.61 ± 0.02 a47.08 ± 8.66 a41.32 ± 5.83 a35.20 ± 2.73 a
SO42−27.55 ± 3.00 a59.74 ± 3.15 ab108.50 ± 10.55 b88.67 ± 6.31 b65.63 ± 3.80 ab
Cl274.52 ± 24.15 a402.38 ± 1.96 ab632.93 ± 206.62 b541.30 ± 148.50 b443.12 ± 85.54 ab
Na+131.33 ± 10.50 a242.63 ± 0.91 a396.65 ± 141.01 b328.71 ± 102.63 b256.24 ± 62.32 a
Disclaimer/Publisher’s Note: The statements, opinions and data contained in all publications are solely those of the individual author(s) and contributor(s) and not of MDPI and/or the editor(s). MDPI and/or the editor(s) disclaim responsibility for any injury to people or property resulting from any ideas, methods, instructions or products referred to in the content.

