Article

Comparative Transcriptome Analysis of Mature Leaves of Dimocarpus longan cv. ‘Sijimi’ Provides Insight into Its Continuous-Flowering Trait

Institute of Fruit Tree Research, Guangdong Academy of Agricultural Sciences, Key Laboratory of South Subtropical Fruit Biology and Genetic Resource Utilization, Ministry of Agriculture and Rural Affairs, Guangdong Provincial Key Laboratory of Science and Technology Research on Fruit Trees, Guangzhou 510640, China
*
Author to whom correspondence should be addressed.
Horticulturae 2024, 10(9), 974; https://doi.org/10.3390/horticulturae10090974
Submission received: 3 August 2024 / Revised: 7 September 2024 / Accepted: 12 September 2024 / Published: 14 September 2024
(This article belongs to the Special Issue Fruit Tree Physiology and Molecular Biology)

Abstract

:
Longan (Dimocarpus longan Lour.) is an important tropical and subtropical fruit, and most of its cultivars bloom once a year (once-flowering, OF). Dimocarpus longan cv. ‘Sijimi’ (SJ) is a tropical ecotype variety that blooms several times a year (continuous-flowering, CF) without the need for low-temperature induction. Several studies have focused on the mechanism of continuous flowering in SJ longan; however, none used leaves as research material. As leaves are a key organ in sensing floral-induction signals, we compared gene-expression differences between mature leaves of CF (SJ) and OF (D. longan cv. ‘Shixia’ (SX) and D. longan cv. ‘Chuliang’ (CL)) longan by transcriptome sequencing. An average of 47,982,637, 43,833,340 and 54,441,291 clean reads were obtained for SJ, SX and CL respectively, and a total of 6745 differentially expressed genes (DEGs) were detected. Following Metabolic pathways, Plant-pathogen interaction and Biosynthesis of secondary metabolites, most of the other genes were assigned to the KEGG classifications of MAPK signaling pathway- plant, Plant hormone signal transduction, Amino sugar and nucleotide sugar metabolism and Starch and sucrose metabolism. WGCNA analysis clustered genes into 27 modules, among which bisque4 and darkorange2 module genes specifically were expressed at low and high levels in SJ, respectively. Different gene-expression patterns were detected between CF and OF longan in bisque4 and darkorange2 modules, especially the high levels of transcription factor (TF) expression and the large number of gibberellic acid (GA)-signaling-pathway-specific genes expressed at high levels in CF longan (SJ). Floral-induction-gene expression levels in CF longan, such as levels of GA-signaling-related and FT genes, were always high. In CF longan, after vegetative-growth accumulation, flowers could be directly induced, thereby eliminating the need for low-temperature induction.

1. Introduction

Dimocarpus longan Lour. (Sapindaceae) is an important tropical and subtropical fruit native to China and Southeast Asia [1], and it is cultivated in more than 20 countries [2]. In addition to being used for fresh food, longan can be processed into dry longan, which is used as traditional Chinese medicine to treat leucorrhea, kidney disorders, allergies, and cardiovascular diseases [3,4]. The main longan cultivated varieties such as ‘Shixia’ (SX) and ‘Chuliang’ (CL), bloom once a year (once-flowering, OF), induced by low temperature and drought under natural conditions [5]. However, Dimocarpus longan cv. ‘Sijimi’ (SJ) is a tropical ecotype variety that can complete flower-bud differentiation without low-temperature induction and bloom several times a year (continuous-flowering, CF) [6] and is ideal for studying the longan flower formation mechanism.
Research on the mechanism of continuous flowering has focused on horticultural flowers, mainly roses and orchids. Molecular labeling in a large number of varieties has targeted the RoKSN gene, a AtTFL1 homologue, which in the CF variety has a reverse-transcription rotor insertion in the second intron, resulting in RoKSN transcription blocking and the loss of its flowering-inhibition function [7,8]. RoKSN performs the flowering-inhibition function by competing with RoFT for RoFD [9]. Transcriptome analysis comparing CF and OF varieties revealed that gibberellin and the gibberellin-responsive gene CO-like 2 may be involved in regulation of continuous flowering [10]. GA suppressed flowering by inducing RoKSN expression in spring [11]. In orchids, transcriptome analysis revealed genetic integrators, MADS-box genes, miRNAs and transcription factors involved in regulating continuous flowering [12,13]. The unique FT splicing variant with intron retention in Liriodendron chinense slb1 mutants may be responsible for its continuous flowering [14].
Several studies have also reported the mechanism of continuous flowering in Dimocarpus longan cv. ‘Sijimi’. Differentially expressed genes (DEGs) between ‘SJ’ (CF) and ‘SX’ or ‘Lidongben’ (OF) were detected by transcriptome analysis, and most identified flowering-related DEGs involved in photoperiod and circadian-clock pathways, such as CONSTANS-like (COL), two-component response regulator-like (APRRs), GIGANTEA (GI), EARLY FLOWERING (ELF), and F-BOX 1 (FKF1). Of these, ELF4 may be the key gene [5,6]. There were no differences in TFL homologous gene sequences between CF and OF, indicating that the mechanism of continuous flowering in longan may be different from that in other woody plants [5]. High-throughput microRNA sequencing indicated that novel-miR137, novel-miR76, novel-miR101, novel-miR37, and csi-miR3954 may play vital regulatory roles in the regulation of continuous flowering in longan [15].
Photoperiod is an important parameter controlling plant flowering and links with the circadian clock [16]. Leaves are key organs that sense floral-inductive signals, such as a change in light regime or mobile florigen production [17]. After receiving the light signal, leaves can accumulate flower-related substances, such as FLOWER LOCUS T (FT) protein [17]. Previous studies on continuous flowering in longan mainly used terminal buds as study material. In this study, leaves were used, and transcriptome analysis was conducted to compare CF and OF gene-expression differences. Our study aims to provide more evidence to reveal the regulatory mechanism of continuous flowering in Dimocarpus longan cv. ‘Sijimi’.

2. Materials and Methods

2.1. Plant Materials

Twelve-year-old Dimocarpus longan cv. ‘Sijimi’ (SJ, continuous-flowering), D. longan cv. ‘Shixia’ and D. longan cv. ‘Chuliang’ (SX and CL, single-flowering) were selected. They were cultivated at the Guangdong Longan Germplasm Resource Nursery (in Institute of Fruit Tree Research, Guangdong Academy of Agricultural Sciences), Guangzhou City, Guangdong Province, China and grown under similar planting conditions. The varieties were identified by the builder of the nursery, Jianguang Li, who is also the leader of our lab. Mature leaves (from last autumn shoot of the previous year) of SX, CL and non-flowering SJ branches (with diameter around 1 cm) were collected on 20 September 2023. Three replicates of each variety were collected, and each replicate contained mature leaves in the same condition from three trees. After they had been picked, the leaves were placed immediately in liquid nitrogen and stored at −80 °C until RNA-Seq and quantitative reverse-transcription polymerase chain reactions (qRT-PCR).

2.2. RNA Extraction and RNA-Seq

Total RNA was isolated using Trizol Reagent (Invitrogen, Carlsbad, CA, USA). RNA concentration and purity were determined using NanoDrop 2000C (Thermo Scientific, Waltham, MA, USA), and RNA integrity was assessed by using an Agilent 2100 Bioanalyzer (Agilent Technologies, Santa Clara, CA, USA) (Figure S1). After enrichment and purification, RNA was fragmented into short fragments by fragmentation buffer. The first cDNA strand was synthesized with random hexamers and MMuLV Reverse Transcriptase (RNase H), and the second was synthesized using DNA polymerase I and RNase H. Double-stranded cDNA was purified; segment sizes were selected by AMPure XP beads; and the sample was finally enriched by PCR to obtain the final cDNA library. Each library was loaded onto the Illumina Hiseq2000 platform for high-throughput sequencing [18]. The raw sequence data reported in this paper have been deposited in the Genome Sequence Archive [19] in National Genomics Data Center [20], China National Center for Bioinformation/Beijing Institute of Genomics, Chinese Academy of Sciences (GSA: CRA015692) and are publicly accessible at https://ngdc.cncb.ac.cn/gsa (accessed on 10 April 2024).

2.3. De Novo Assembly and Functional Annotation

Clean reads were obtained by checking the sequencing error rate and GC content distribution and filtering the raw sequencing data. Then, clean reads were aligned to the longan genome (http://gigadb.org/dataset/view/id/100276 (accessed on 10 November 2023)) [21] using the hisat 2 program [22]. Fragments per kilobase of transcript per million fragments mapped (FPKM) value, an indicator for transcript or gene-expression level, was calculated by featureCounts [23]. Genes with a |log2fold change| ≥ 1 and false-discovery rate (FDR) < 0.05 were identified as DEGs using DESeq2 [24]. To elucidate the functions of the genes, DEGs were annotated through Kyoto Encyclopedia of Genes and Genomes (KEGG; https://www.genome.jp/kegg (accessed on 12 November 2023)) [25], Gene Ontology (GO) [26], Clusters of Orthologous Groups of Proteins (KOG; https://www.ncbi.nlm.nih.gov/COG/ (accessed on 12 November 2023)) [27] and Non-redundant protein sequences (Nr; https://ftp.ncbi.nlm.nih.gov/blast/db/FASTA/ (accessed on 12 November 2023)) database.

2.4. WGCNA

Coexpression of genes and metabolites was estimated using the weighted coexpression network analysis (WGCNA) (v1.47) package in R [28]. After genes were filtered, FPKM or relative abundance values were imported into WGCNA to construct coexpression modules. The threshold of merge cut height was set to 0.25, and the minimum module size was set to 50. Gene modules with significant correlations with traits were enriched to KEGG pathway terms based on the hypergeometric test (adjusted p-value < 0.05). For genes involved in important pathways, Cytoscape software (v3.3.0) [29] was used to visualize their coexpression patterns.

2.5. Quantitative Real-Time PCR (qRT-PCR) Validation

Total RNA was extracted using TRIzol reagent (Invitrogen Life Technologies). One μg of RNA was used for cDNA synthesis using a PrimeScriptTM RT reagent Kit with gDNA Eraser (Perfect Real Time) (Takara, Shiga, Japan). qRT-PCR was conducted in a total volume of 10 µL containing 30 ng cDNA, 200 nM each of gene-specific primers and 5 µL SYBR Premix Ex Taq reagent (Takara, Shiga, Japan) using a Mini Option Real-Time PCR System (Bio-Rad, Hercules, CA, USA) according to the manufacturer’s instructions. The DlActin gene was used as internal control [30]. All qRT-PCR experiments were repeated at least three times, and relative expression was calculated based on 2−△△Ct. The primers used for qRT-PCR and their sequences are listed in Table S1.

2.6. Statistical Analysis

All data were collected from at least three replicates and analyzed using a completely randomized design in the SPSS 25.0 program (IBM, Armonk, NY, USA). Differences among means from different time-point were evaluated by Duncan’s test at the 0.05 probability level. Histograms were constructed using Microsoft Office Excel 2016 (Microsoft, Los Angeles, CA, USA).

3. Results

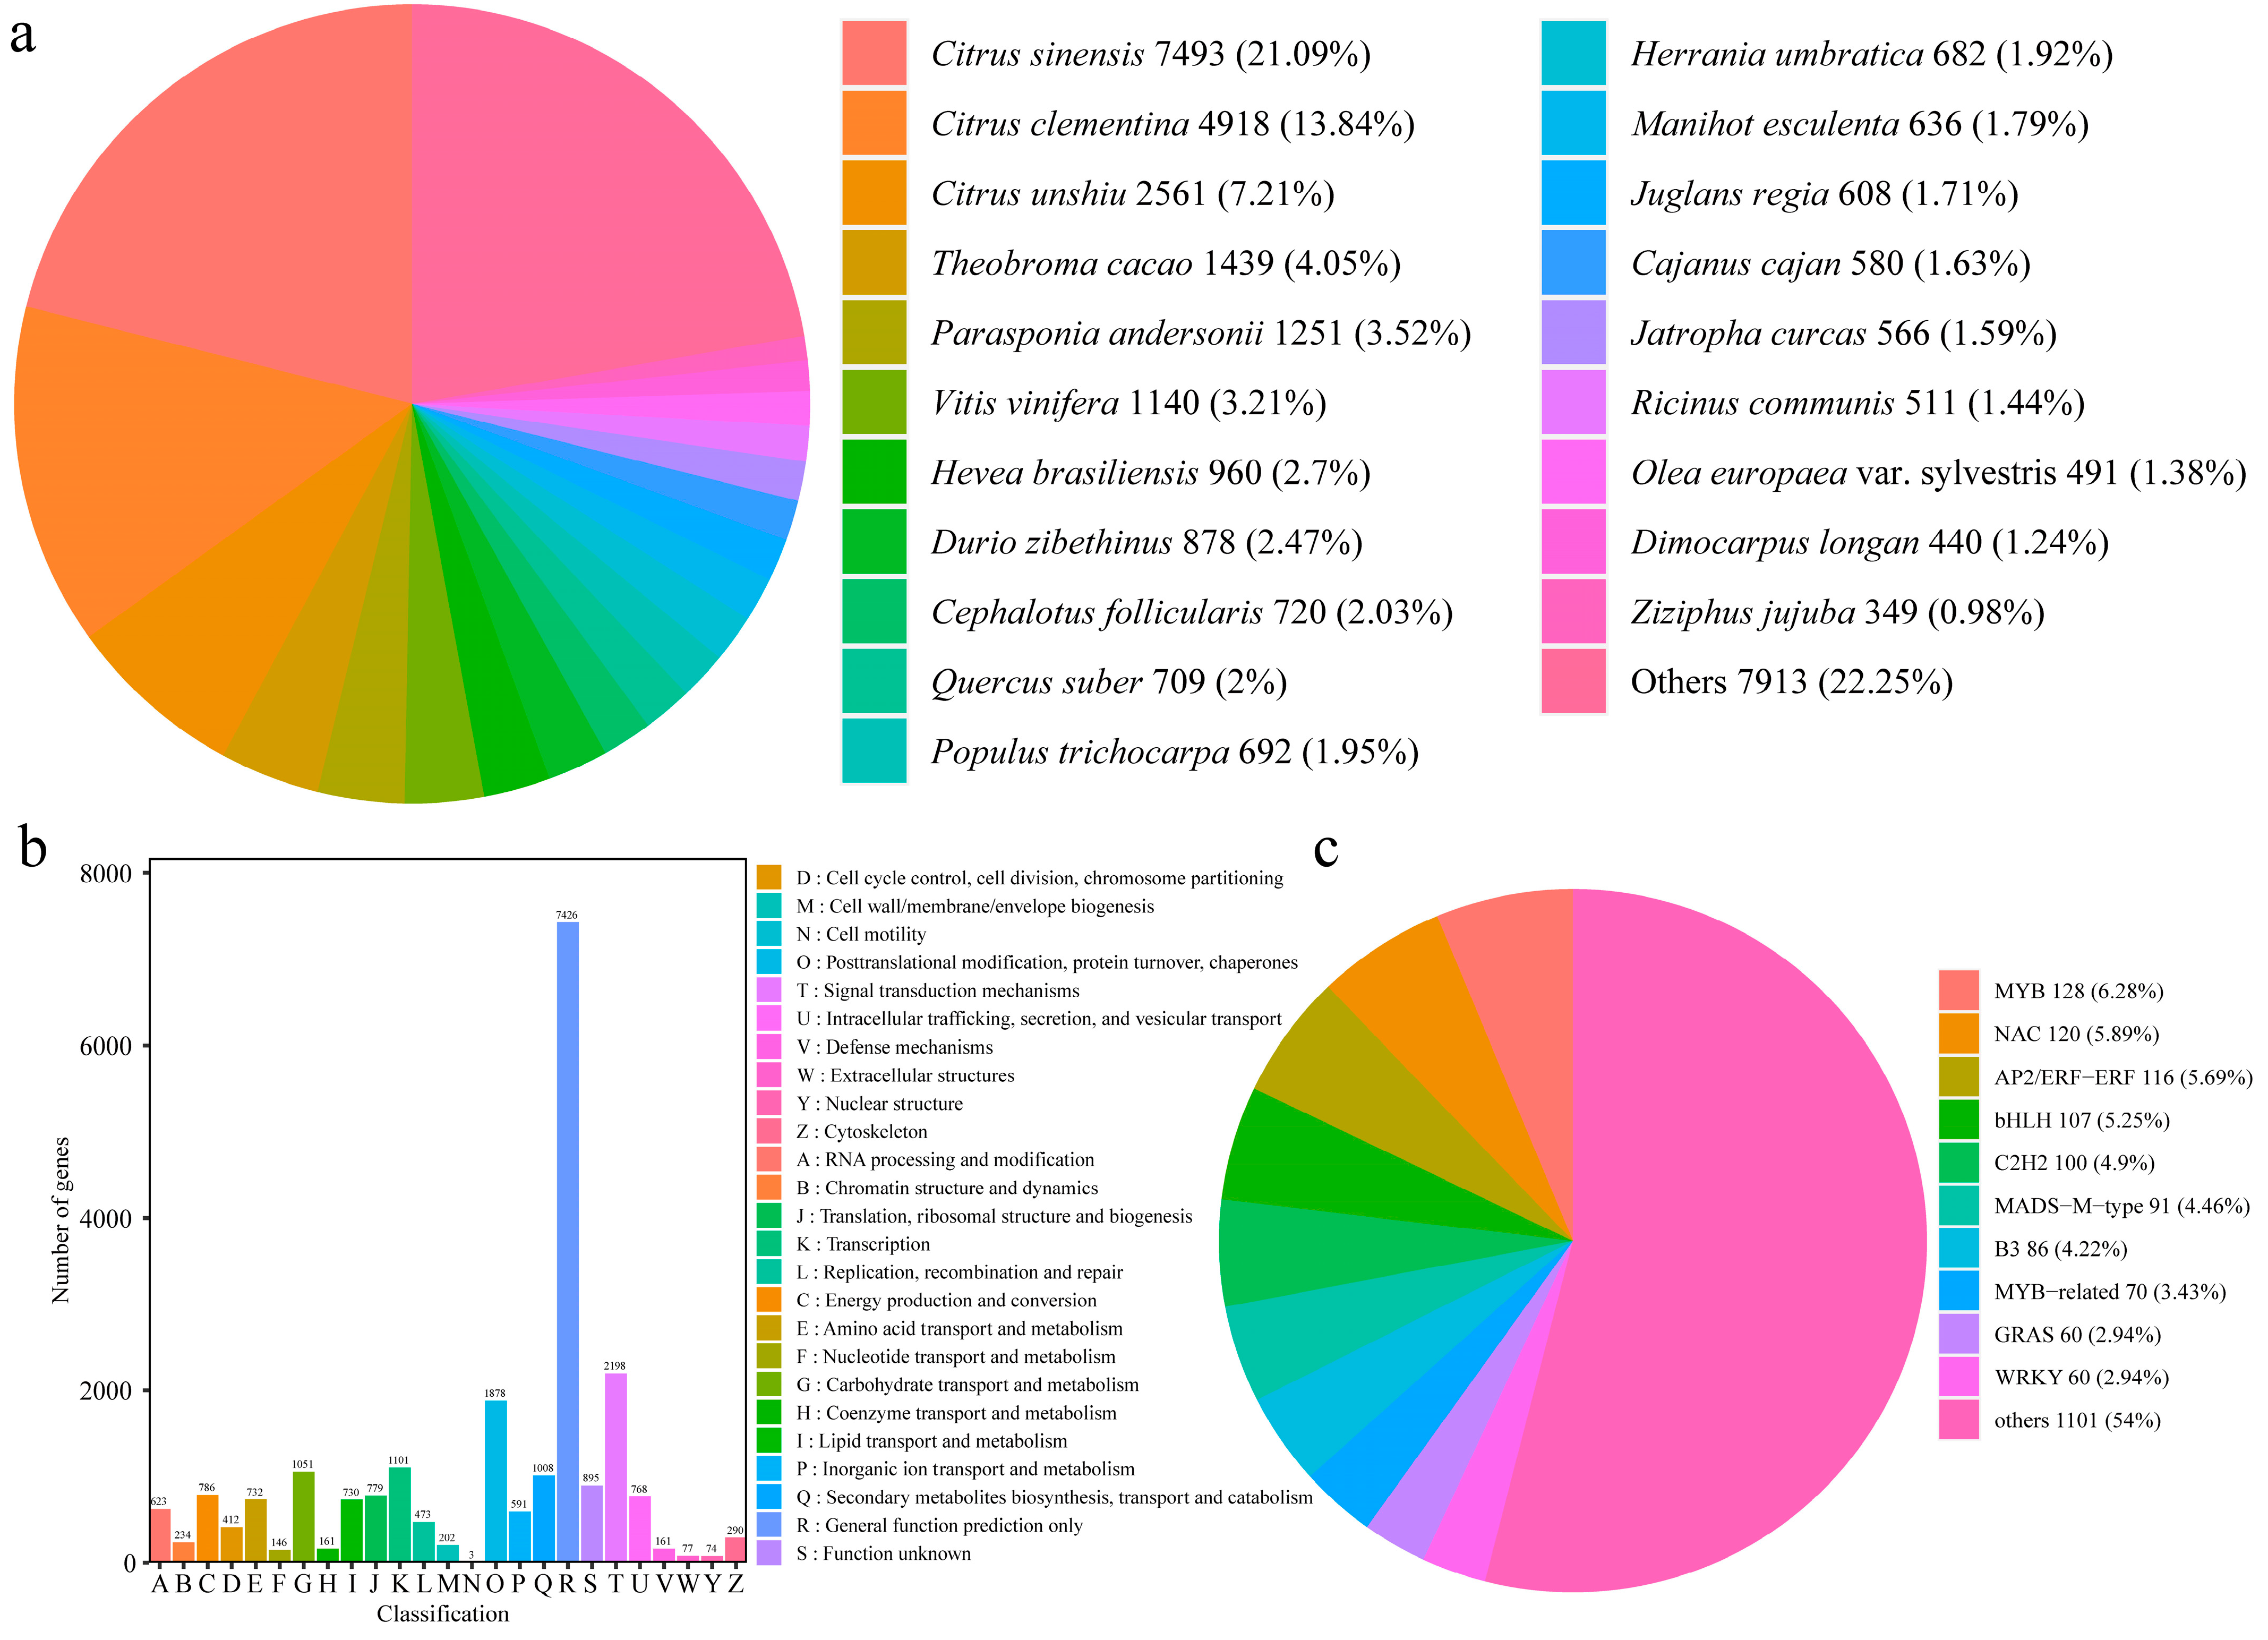
3.1. Illumina Sequencing, Reads Assembly and Annotation

To identify differentially expressed genes in SJ, SX and CL mature leaves, transcriptome sequencing was conducted using the Illumina sequencing platform. After the raw data had been trimmed, an average of 47,982,637, 43,833,340 and 54,441,291 clean reads were obtained for SJ, SX and CL, respectively. Furthermore, the average numbers of reads mapped onto the reference genome were 44,354,326 (92.45%), 40,157,857 (91.62%) and 48,710,060 (91.32%) for SJ, SX and CL, respectively. The Q30 percentages, on average, for SJ, SX and CL were 93.32, 93.40 and 93.13%, respectively. Additionally, the average GC contents were 44.40, 44.55 and 44.12% for the SJ, SX and CL transcriptome, respectively (Table 1).
The unigenes were annotated against five public databases. The number of annotated unigenes in the databases Non-redundant protein sequences (Nr), Gene Ontology (GO), EuKaryotic Orthologous Groups (KOG), Kyoto Encyclopedia of Genes and Genomes (KEGG) and Swiss-Prot were 35,537, 29,620, 34,690, 28,096 and 26,665, respectively. The Nr annotation result indicated that Citrus sinensis (21.09%), C. clementina (13.84%) and C. unshiu (7.21%) showed the highest homology with Dimocarpus longan (Figure 1c). Furthermore, 34,690 unigenes were clustered into 25 KOG classifications. The top 3 classifications were General function prediction only (7426), Signal transduction mechanisms (2198) and Posttranslational modification, protein turnover, chaperones (1878) (Figure 1a). A total of 2039 transcription factors were identified, including MYB (128, 6.28%), NAC (120, 5.89%), AP2/ERF-ERF (116, 5.69%), bHLH (107, 5.25%), C2H2 (100, 4.9%), MADS-M-type (91, 4.46%), B3 (86, 4.22%), MYB-related (70, 3.43%), GRAS (60, 2.94%) and WRKY (60, 2.94%) (Figure 1b).

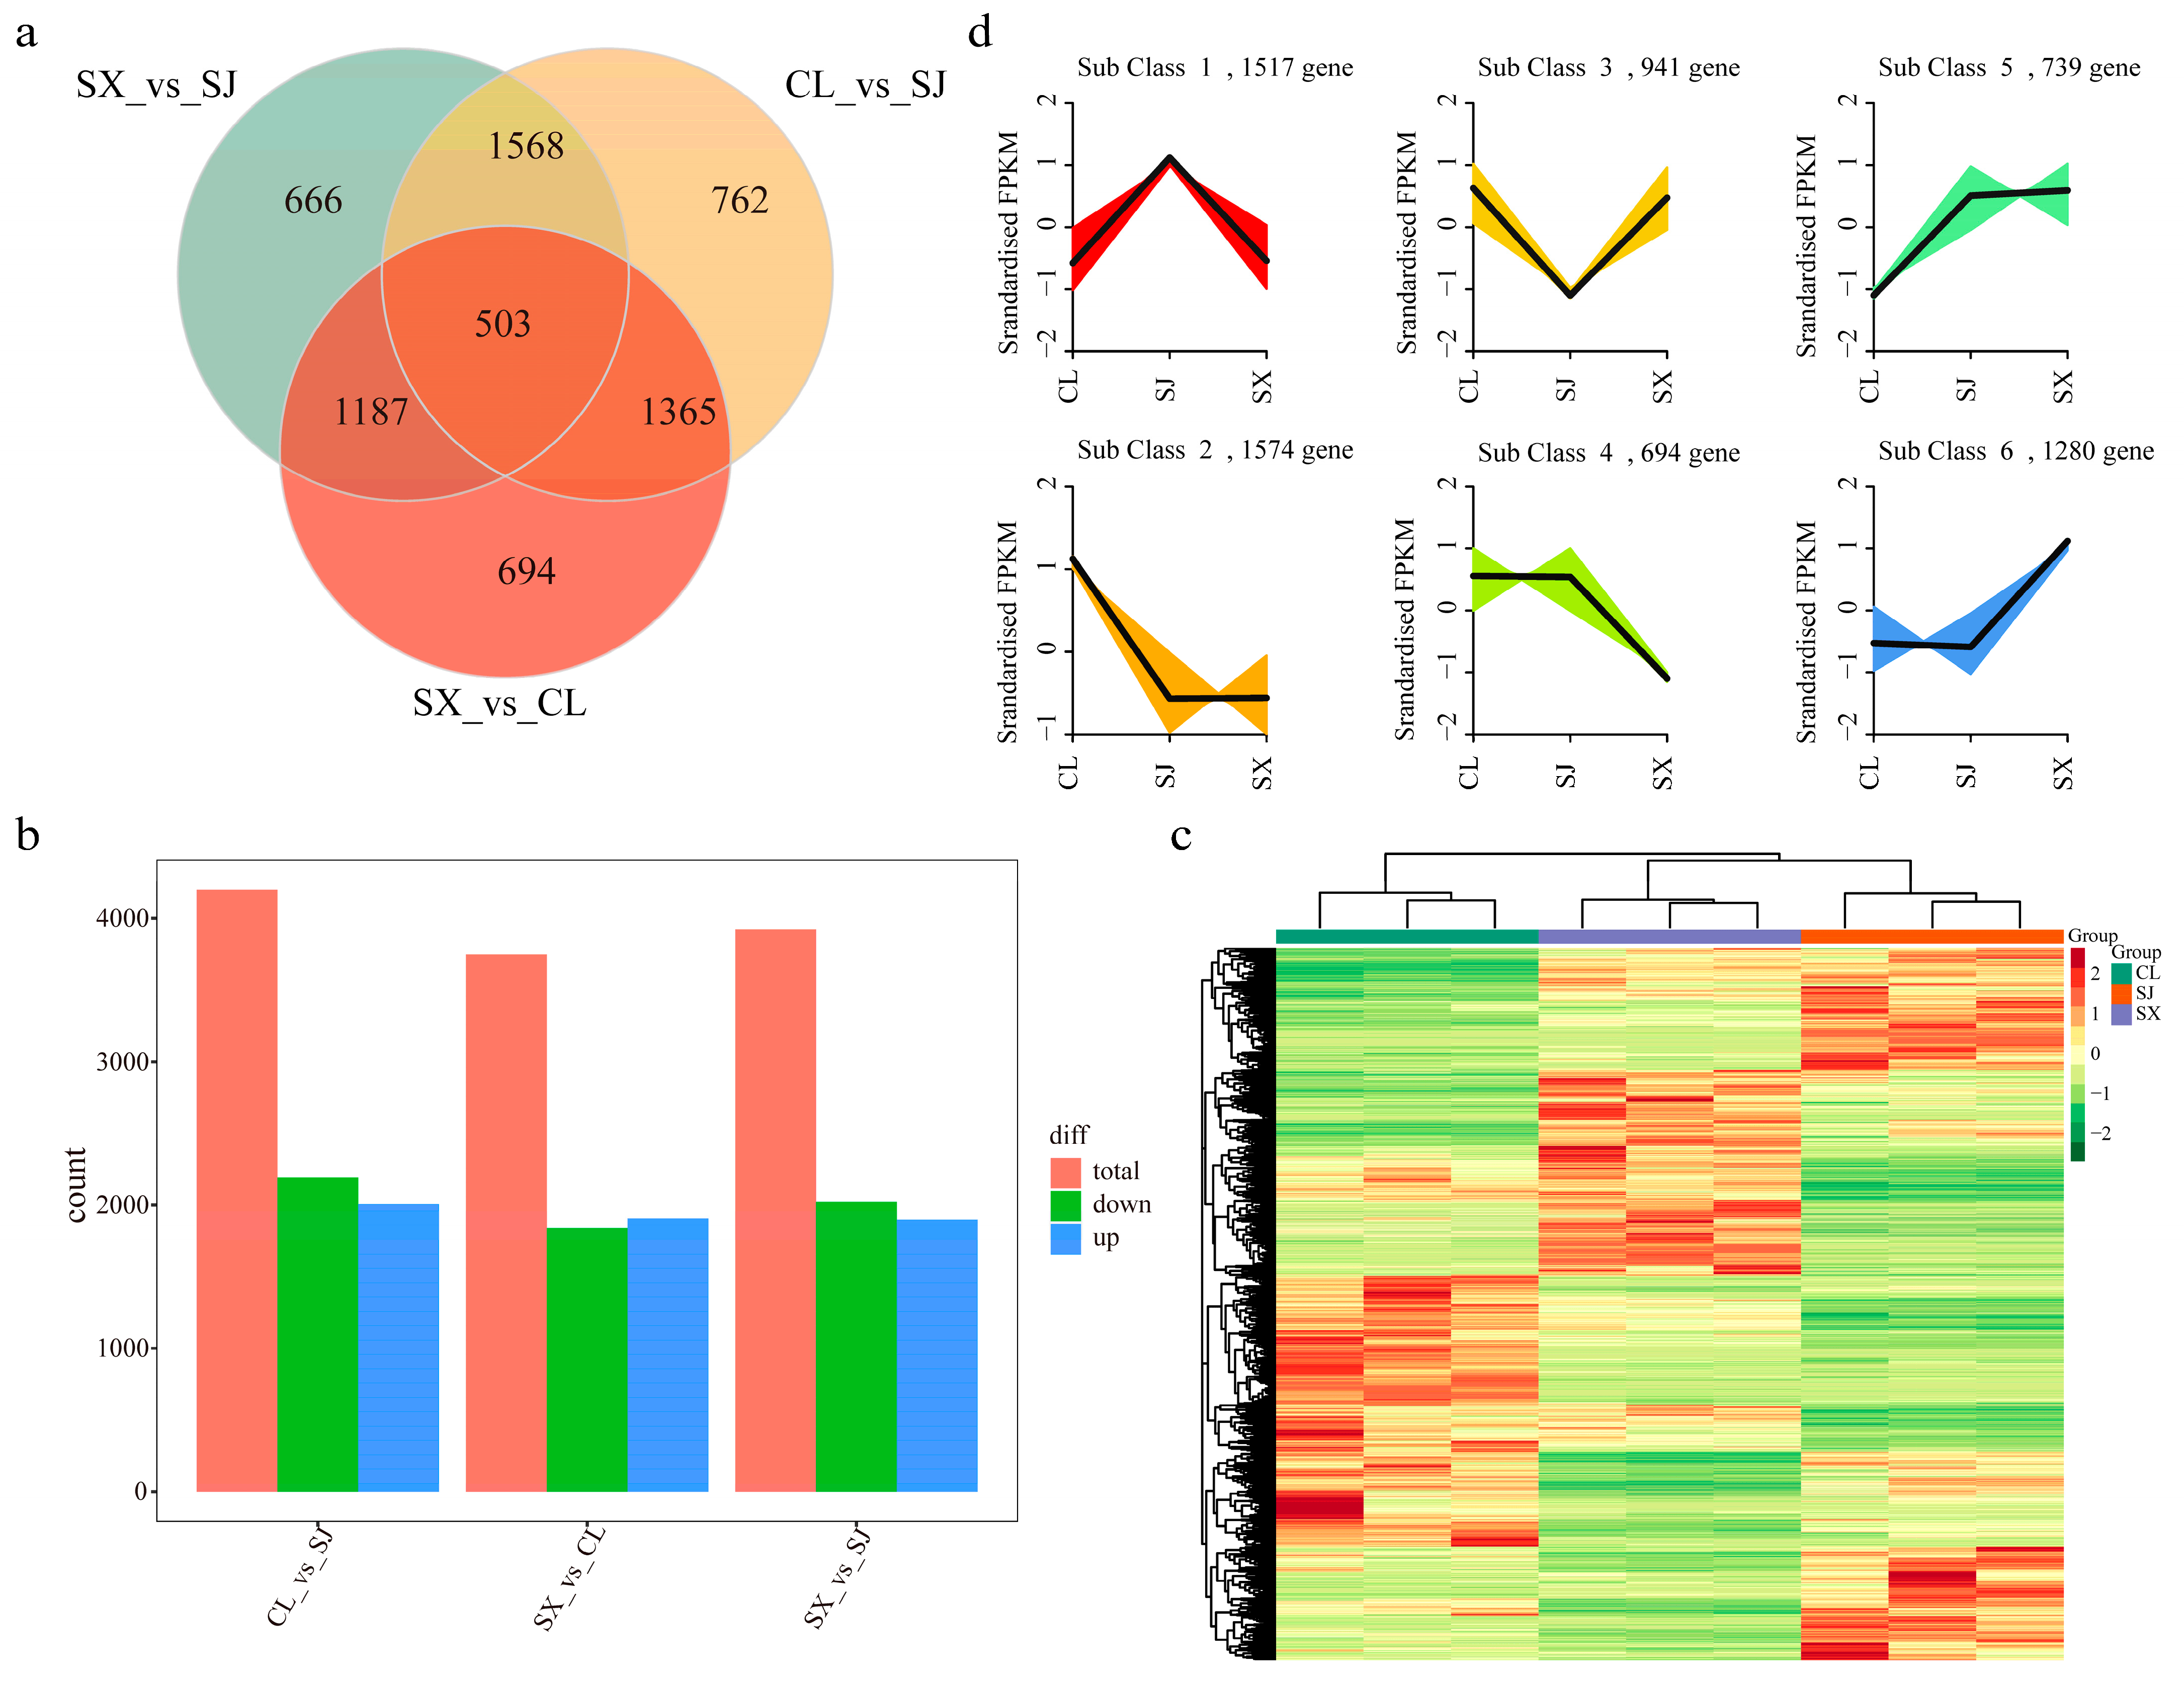
3.2. Functional Annotation of Differentially Expressed Genes (DEGs)

A total of 6745 DEGs were detected. The groups CL_vs_SJ, SX_vs_CL and SX_vs_SJ had 4198 (2192 down-regulated and 2006 up-regulated), 3749 (1842 down-regulated and 1907 up-regulated) and 3924 (2026 down-regulated and 1898 up-regulated) DEGs, respectively (Figure 2a,b). To determine the gene-expression patterns of different genes, the FPKMs of the genes were first centralized and standardized, and then hierarchical cluster analysis and Kmeans cluster analysis were performed. The cluster heat map for each differential group was drawn (Figure 2d) and showed that six subclasses emerged from the clustering and that the SJ gene-expression patterns in subclasses 1 and 3 differed between SX and CL (Figure 2c). Genes were selected from these for further validation.
GO analysis indicated that the DEGs of the groups CL_vs_SJ, SX_vs_CL and SX_vs_SJ were categorized into 50, 50 and 51 GO terms, respectively, consisting of three domains: biological process, cellular component and molecular function (Figure S2). KOG analysis clustered the DEGs into KOG classifications, and the most common classifications were ‘General function prediction only’, ‘Signal transduction mechanisms’ and ‘Posttranslational modification, protein turnover, chaperones’ (Figure S3).
In the KEGG pathway analysis, DEGs of the groups CL_vs_SJ, SX_vs_CL and SX_vs_SJ were classified into 61, 57 and 50 classifications, respectively. After Metabolic pathways, Plant-pathogen interaction and Biosynthesis of secondary metabolites, the next-most-common classifications were MAPK signaling pathway-plant, Plant hormone signal transduction, Amino sugar and nucleotide sugar metabolism and Starch and sucrose metabolism (Figure S4). KEGG enrichment was measured by Rich factor, Q-value and the number of genes enriched in each pathway. DEGs classified in the pathways Plant-pathogen interaction, MAPK signaling pathway-plant and Amino sugar and nucleotide sugar metabolism showed significant enrichment in all three groups (Figure S4). The enrichment of DEGs classified as Photosynthesis-antenna proteins and Anthocyanin biosynthesis in the groups CL_vs_SJ and SX_vs_SJ was more significant than in the group SX_vs_CL (Figure S4), which may reflect the difference between CF (SJ) and OF (SX, CL).

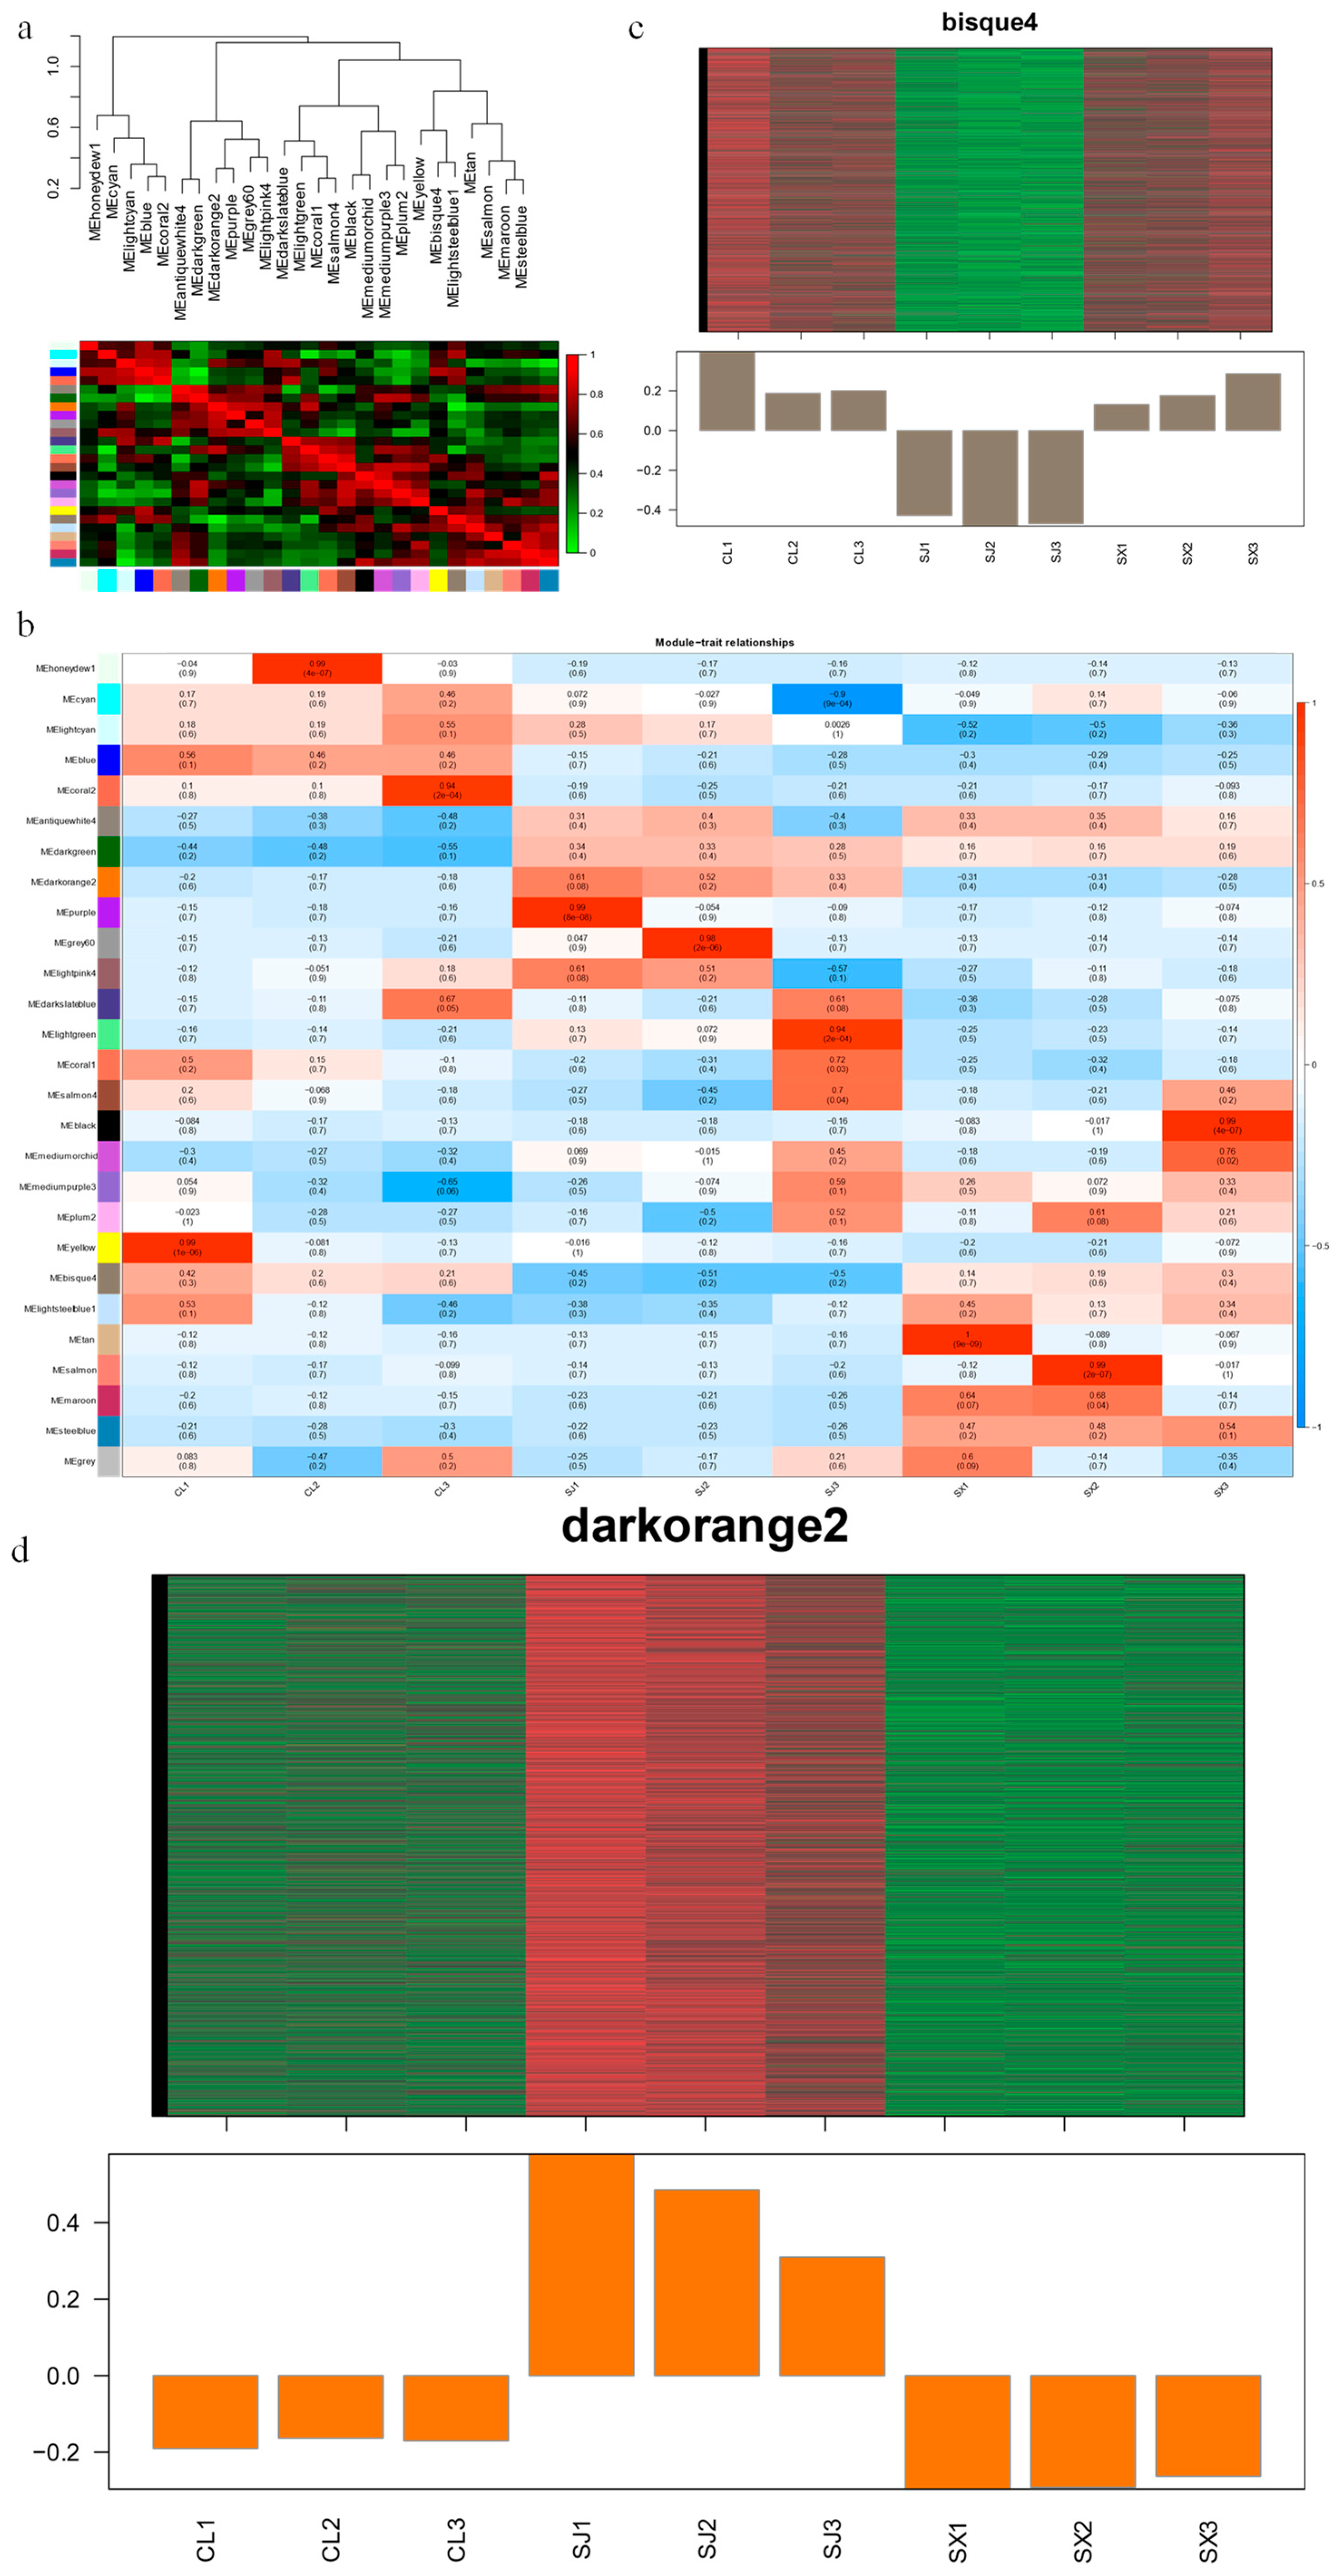
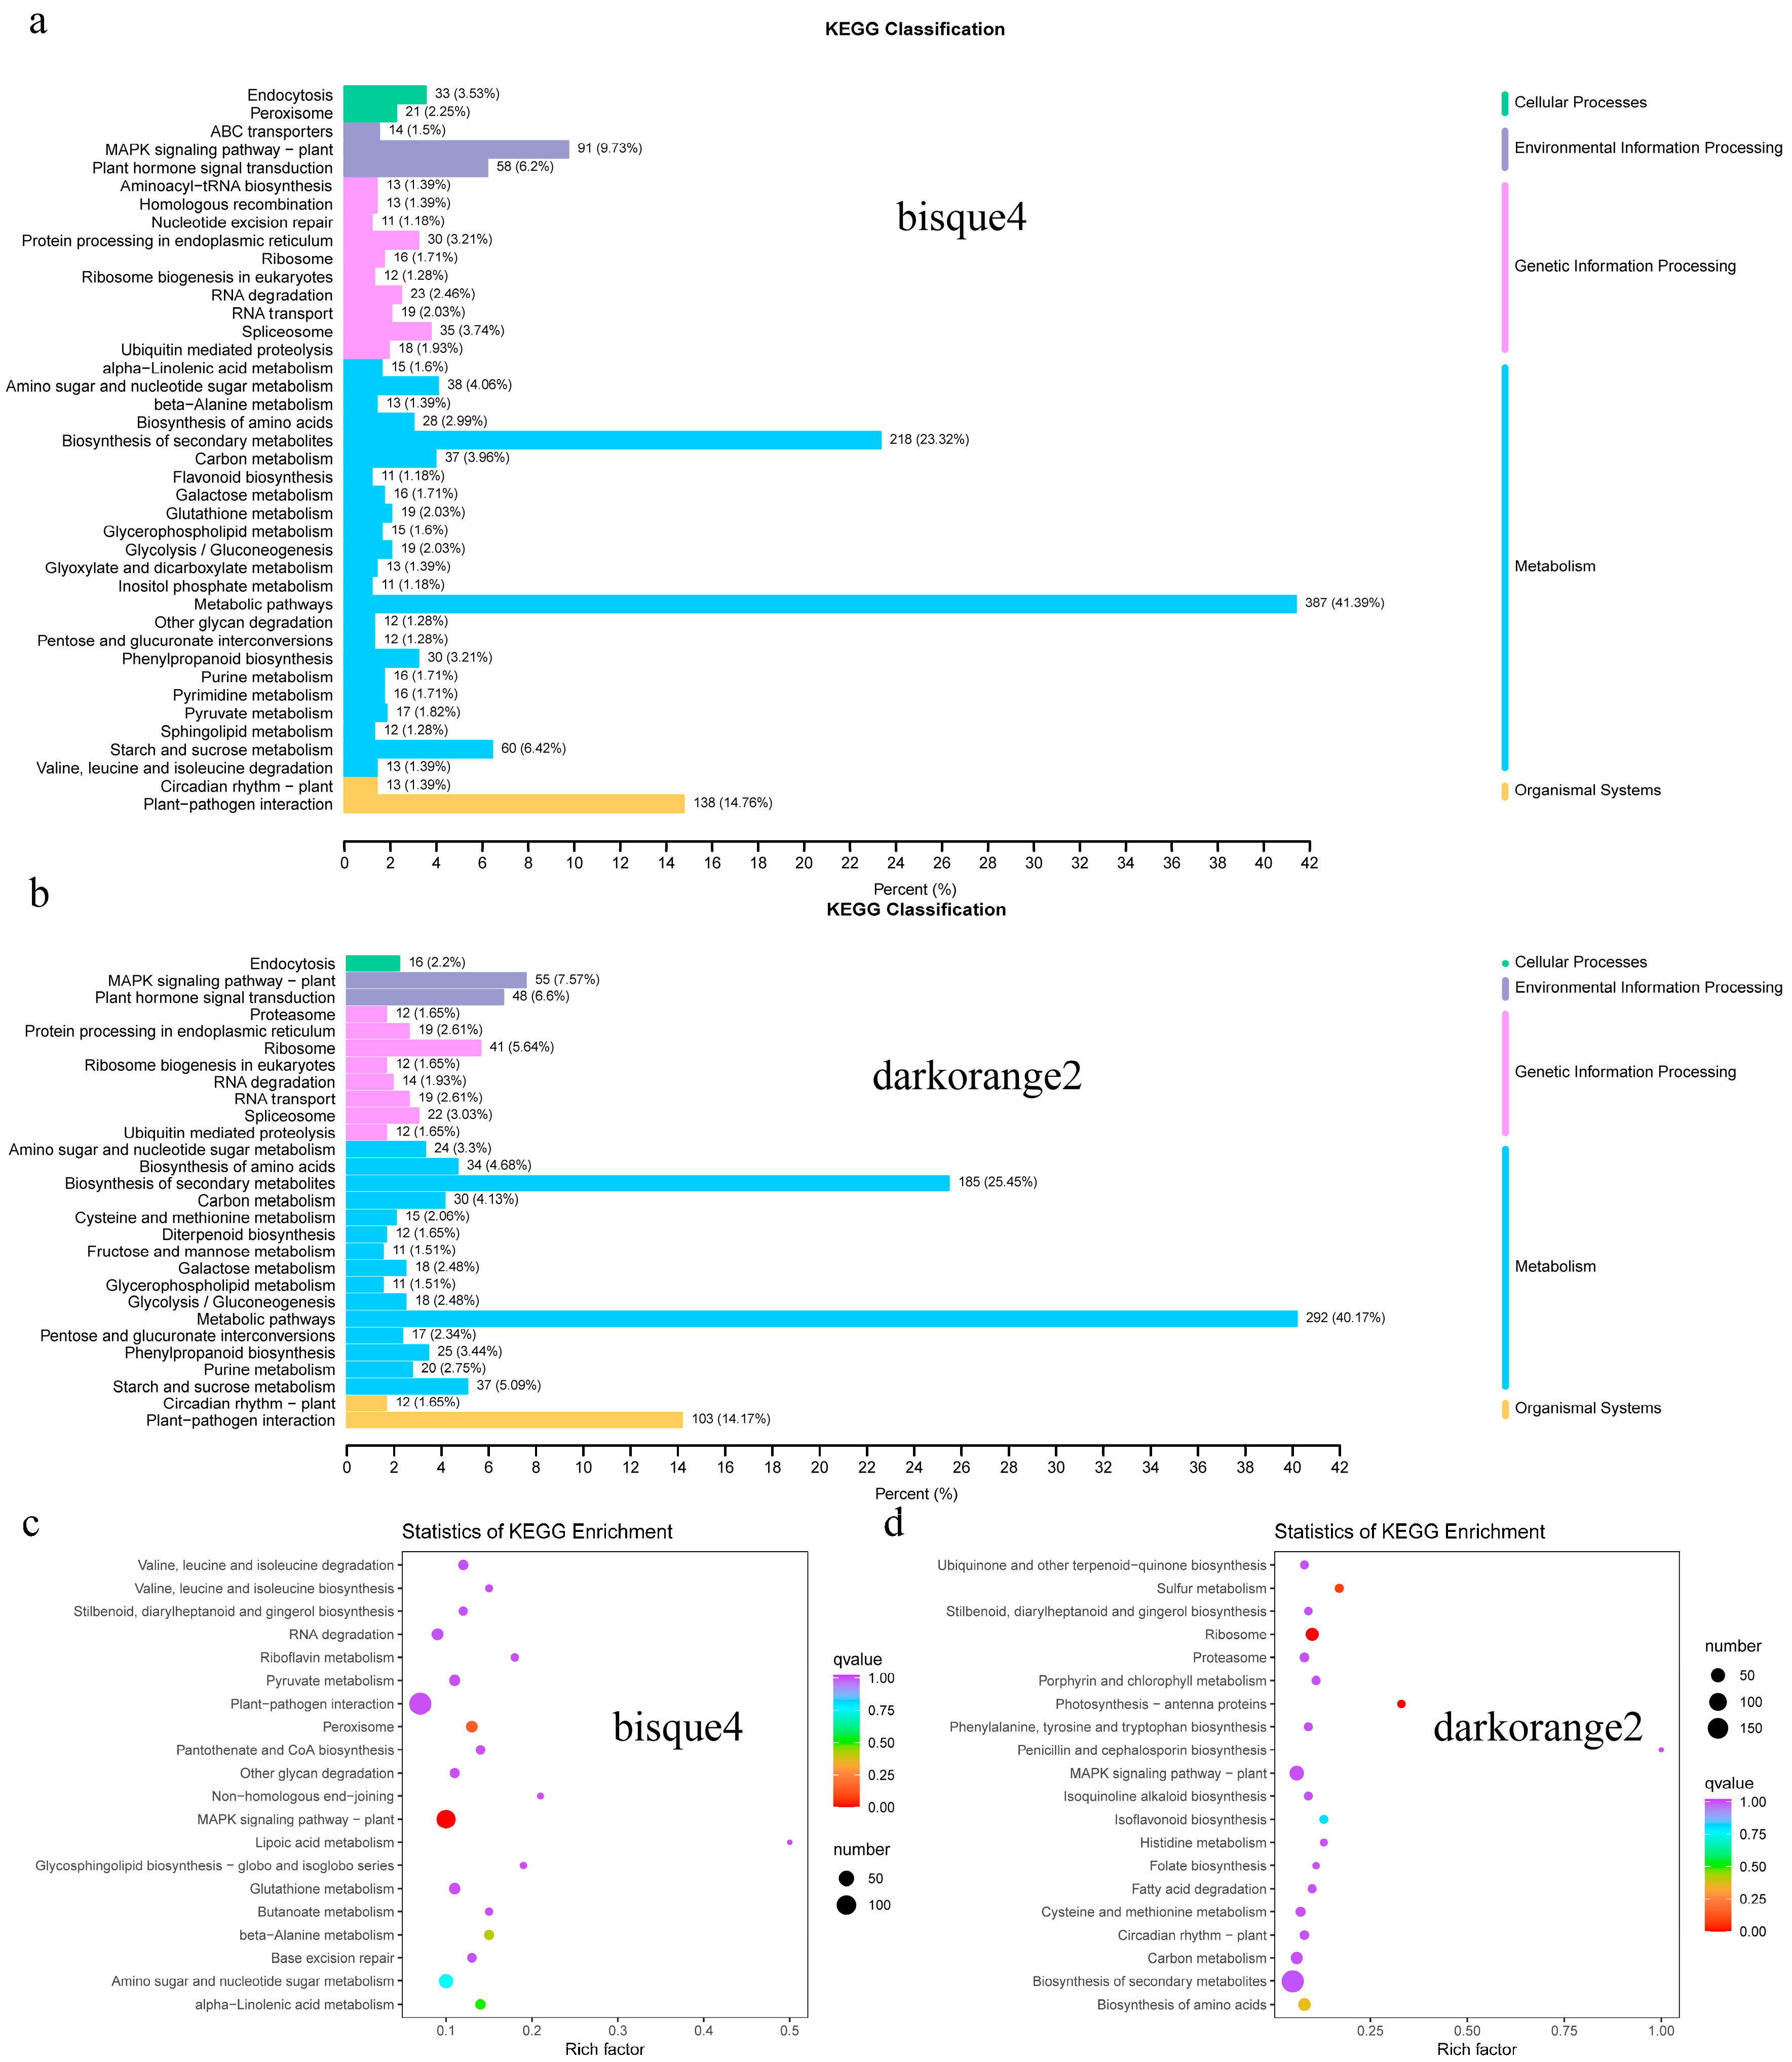
3.3. Key Modules Obtained by WGCNA Analysis Related to Flowering Habits

After genes with FPKM< 0.1 were filtered out in all samples, WGCNA analysis clustered genes into 27 modules. Among them, the grey module included genes that had not been assigned to other modules, which had little significance and did not require special attention. The 26 modules (all except for grey) were divided into 4 groups based on module eigenvalues (Figure 3a). The heat map of sample and module correlations indicated that the bisque4 module was positively correlated with all CJ and SX samples and negatively correlated with all SJ samples (Figure 3b,c), while thedarkorange2 module was negatively correlated with all CJ and SX samples and positively correlated with all SJ samples (Figure 3b,d). A total of 2634 and 2225 genes were included in the
bisque4 and darkorange2 modules, respectively. Of these, 935 and 727 genes were annotated to the KEGG database, respectively. After Metabolic pathways, Biosynthesis of secondary metabolites and Plant-pathogen interaction, the classifications of MAPK signaling pathway-plant, Plant hormone signal transduction, and Starch and sucrose metabolism had more genes (Figure 4a,b). This result was similar to KEGG annotation of DEGs. The MAPK signaling pathway-plant and Peroxisome pathways were significantly enriched in the bisque4 module, while Photosynthesis-antenna proteins, sulfur metabolism and Ribosome pathways were significantly enriched in the darkorange2 module (Figure 4c,d).
Genes annotated to Photosynthesis, Circadian rhythm—plant, Starch and sucrose metabolism, MAPK signaling pathway—plant and Plant hormone signal transduction pathways in the bisque4 and darkorange2 modules were compared. There were 5, 44 and 89 genes expressed at low levels in SJ (bisque4 module) and annotated to Photosynthesis, Starch and sucrose metabolism and MAPK signaling pathway—plant pathways, respectively (Table S2). Totals of 17, 27 and 53 genes highly expressed in SJ (darkorange2 module) were annotated to Photosynthesis, Starch and sucrose metabolism and MAPK signaling pathway—plant pathways, respectively (Table S3). There were 10 and 11 genes expressed at low and high levels, respectively, in SJ that were annotated to a Circadian rhythm—plant pathway (Tables S2 and S3). Moreover, 3 FT genes were detected in the darkorange2 module (Table S3). There were 34 genes annotated to a Plant hormone signal transduction pathway expressed at low levels in SJ, including 2 abscisic acid (ABA), 9 auxin, 13 brassinosteroid (BR) and 5 gibberellin (GA)-related genes (Table S2). There were 31 genes belonging to Plant hormone signal transduction pathways that were highly expressed in SJ, including 1 abscisic acid (ABA), 7 auxin, 8 brassinosteroid (BR) and 13 gibberellin (GA)-related genes (Table S3).

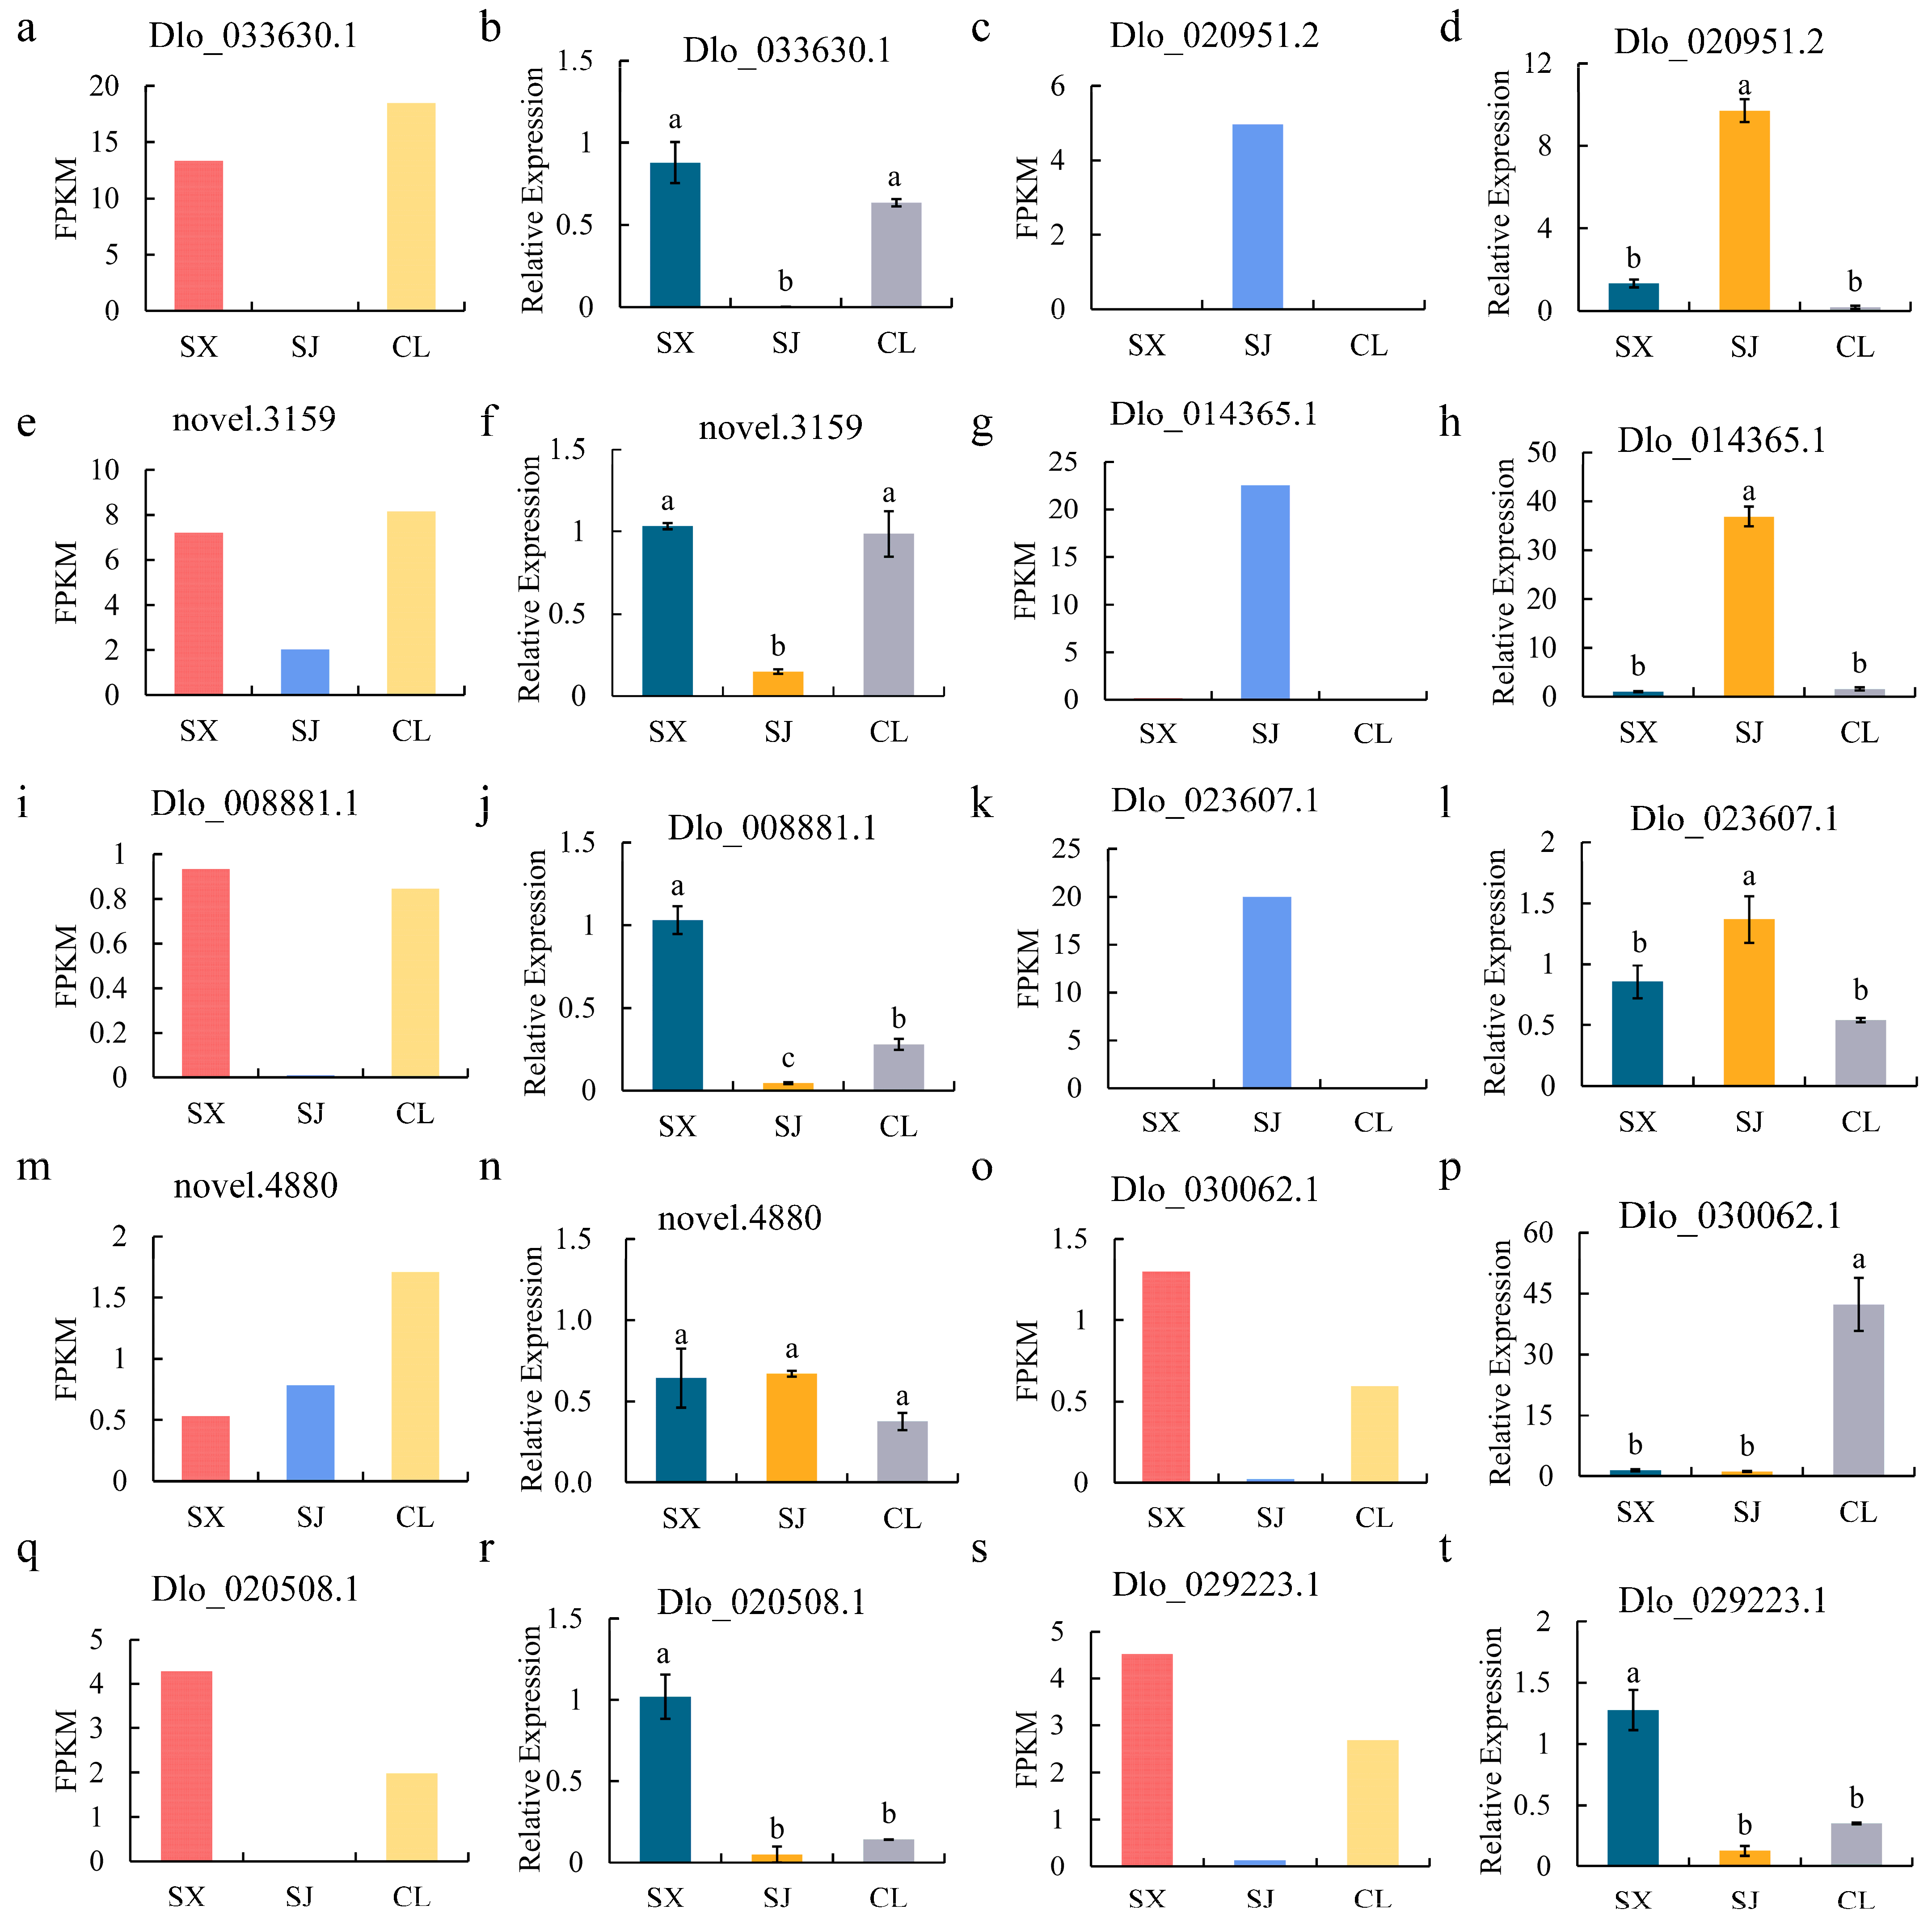
3.4. The qRT-PCR Validation of Selected DEGs

Combining the results of DEGs annotation and WGCNA analysis, 10 genes related to glycometabolism, plant-hormone signal transduction, the MAPK signaling pathway and Flowering locus T (FT) were further validated by qRT-PCR (Table S1). The qRT-PCR expression levels of most of the DEGs were consistent with transcriptomic expression levels. Genes that were specifically expressed at high or low levels in SJ were verified (Figure 5a–l). Most of the MAPK signaling pathway genes were found in the bisque4 module, which had low SJ FPKM values in the transcriptome. The qRT-PCR results indicated that the expression level was low not only in SJ, but also in SX and CL (Figure 5o–t).

4. Discussion

We analyzed DEGs of mature longan leaves from CF (SJ) and OF (SX, CL) by transcriptome sequencing. CF and OF DEGs were mainly clustered into Photosynthesis-antenna proteins, MAPK signaling pathway-plant, plant hormone signal transduction and Starch and sucrose metabolism pathways, suggesting different patterns of nutrient accumulation in leaves, leading in turn to different flowering patterns.
In leaves, the photoperiodic pathway mainly transmits signals through GI and CO [31]. Under the regulation light signals, CO protein accumulates stably, inducing the expression of their direct downstream genes FT and TWINSISTER OF FT (TSF) in leaves, as well as FT transport to the terminal buds [32]. PHYA and PHYB are involved in the regulation of CO protein stability and FT expression [16]. FT integrates signals that regulate flowering from almost all regulatory pathways and then delivers them downstream to SUPPRESSOR OF OVEREXPRESSION OF CO 1 (SOC1) and APETALA1 (AP1) [33]. There are 3 CO (Dlo_010015.1, Dlo_029217.1, Dlo_029296.1) genes, 3 FT (Dlo_000296.1, Dlo_012579.1, Dlo_014365.1) genes and 1 PHYA (novel.246) gene specifically highly expressed in CF longan (SJ) (Figure 3d, Table S3). These results indicate that flowering-related genes were continuously expressed in SJ leaves.
Sugars are important for plant growth and development, both as energy metabolites and as signaling molecules [34]. Sugars regulate flowering, senescence, embryo formation, seed germination, pollen germination, root development, tillering and stress tolerance through a complex network of pathways [34]. It was experimentally confirmed in the early 20th century that a higher C/N ratio benefits flower-bud differentiation, suggesting that sugar accumulation in plants, including fruit trees, is the material basis for bud differentiation [35]. Many DEGs of the CL_vs_SJ, SX_vs_CL and SX_vs_SJ groups and genes in the bisque4 and darkorange2 modules were annotated to Starch and sucrose metabolism (Figure 3c,d, Tables S2 and S3). The number of genes annotated to Starch and sucrose metabolism pathways that were specifically highly expressed in OF longan (SX, CL) was greater than the number that were highly expressed in CF longan (SJ) (Tables S2 and S3). This suggests that in OF longan, which only has nutritional growth in September, sugar metabolism was more active and more genes were involved, while in CF longan, substances required for flower formation accumulated during vegetative growth.
Mitogen-activated protein kinase (MAPK) is a highly conserved biological signal-transduction module that plays a crucial role in plant growth, development, and stress resistance [36]. This signaling pathway can amplify and transmit environmental signals sensed by plants, thereby activating downstream enzymes and transcription factors, ultimately activating target gene expression and responding to external signals [37]. Numerous DEGs of the CL_vs_SJ, SX_vs_CL and SX_vs_SJ groups and genes in the bisque4 and darkorange2 modules were annotated to MAPK signaling pathway—plant pathways (Figure 3c,d, Tables S2 and S3), demonstrating that MAPK may participate in light signal transduction, sugar metabolism and signal transduction during flower formation. Besides, MAPK can also transmit hormonal signals [38].
Plant endogenous hormones participate in the whole plant life cycle [39], while hormonal signaling plays a crucial role in flower formation [40]. Regulation of hormonal signaling is often achieved by pooling different hormone signals and then altering expression levels of key genes involved in flowering [41]. GA is the most well-studied hormone that regulates flowering and is considered the most important. GA promotes flowering by inducing SOC1, FT, TSF, SPL and LFY expression [42]. The number of GA-related genes that were specifically highly expressed (13) in SJ was significantly higher than the number expressed at low levels (5) (Tables S2 and S3), suggesting an important role for a GA signaling pathway in CF longan flowering induction. Some IAA- and BR-related genes were also specifically expressed at low or high levels in SJ (Tables S2 and S3). IAA can promote flowering by regulating GA content and promoting DELLA degradation [43,44]. BR signaling integrates with environmental cues to fine-tune flowering time through FT and the other flowering pathways [45].
Floral induction is regulated by different regulatory pathways, which contain various genes. While the expression of genes is determined by transcription factors (TFs), the importance of TFs in floral induction is evident [46]. Several TFs, such as MYB, NAC, AP2/ERF and WRKY, have been detected in the transcriptome and have been confirmed to be involved in regulation of flowering. Overexpression of TaMYB72 from Triticum aestivum in rice could up-regulate the florigen genes Hd3a and RFT1 and ultimately promote rice flowering under long-day conditions [47]. The AP2/ERF transcription factor TOE4b from Glycine max could directly bound to the promoters and gene bodies of the key flowering integration factor genes FT2a and FT5a to inhibit their transcription and delay flowering in lines displaying overexpression [48]. WRKY TFs are implicated in phytohormone pathways, such as ethylene, auxin, and abscisic acid pathways, through which they modulate flowering time [49].

5. Conclusions

Through transcriptome analysis, we found that the DEGs between mature leaves of CF and OF longan were mainly clustered into Photosynthesis - antenna proteins, MAPK signaling pathway - plant, plant hormone signal transduction and Starch and sucrose metabolism pathways. Especially significant were the high TF expression and the large number of GA signaling pathway genes that were highly expressed in CF longan (SJ). We speculate that OF longan initiates expression of genes related to vegetative growth, such as photosynthesis, auxin, brassinosteroid, and MAPK pathway genes, promoting plant vegetative growth. After low-temperature induction, expression of flowering-related genes is initiated. But for CF longan, the expression of genes related to vegetative and reproductive growth are simultaneously induced. Expression levels of floral-induction genes, such as GA-signaling-related and FT genes, are always high, and after accumulation of vegetative growth, flowering can be directly induced.

Supplementary Materials

The following supporting information can be downloaded at: https://www.mdpi.com/article/10.3390/horticulturae10090974/s1, Figure S1: RNA electropherogram of nine samples; Figure S2: GO annotation of DEGs; Figure S3: KOG annotation of DEGs; Figure S4: KEGG annotation of DEGs; Table S1: Primers used in qRT-PCR; Table S2: KEGG annotation of genes in bisque4 module; Table S3: KEGG annotation of genes in darkorange2 module.

Author Contributions

S.H.: data curation, funding acquisition, methodology, investigation, writing-original draft, writing-review & editing. X.L.: data curation, methodology, writing-original draft. J.W.: methodology, formal analysis, writing-original draft. D.H.: data curation, validation, writing-original draft. J.L.: supervision, project administration, writing-review & editing. D.G.: conceptualization, funding acquisition, project administration, writing-review & editing. All authors have read and agreed to the published version of the manuscript.

Funding

This research was funded by the Innovation Fund project of Guangdong Academy of Agricultural Sciences (202212).

Data Availability Statement

The raw sequence data for this study can be found in the Genome Sequence Archive in National Genomics Data Center (https://ngdc.cncb.ac.cn/gsa (accessed on 10 April 2024); GSA: CRA015692). The original contributions presented in the study are included in the article/Supplementary Material.

Conflicts of Interest

The authors declare no conflicts of interest.

References

  1. Lai, Z.; Chen, C.; Zeng, L.; Chen, Z. Somatic embryogenesis in longan [Dimocarpus longan Lour.]. In Somatic Embryogenesis in Woody Plants; Jain, S.M., Gupta, P., Newton, R., Eds.; Springer: Dordrecht, The Netherlands, 2000; Volume 67, pp. 415–431. [Google Scholar]
  2. Lithanatudom, S.K.; Chaowasku, T.; Nantarat, N.; Jaroenkit, T.; Smith, D.R.; Lithanatudom, P. A first phylogeny of the genus Dimocarpus and suggestions for revision of some taxa based on molecular and morphological evidence. Sci. Rep. 2017, 7, 6716. [Google Scholar] [CrossRef] [PubMed]
  3. Huang, S.; Han, D.; Wang, J.; Guo, D.; Li, J. Floral induction of longan (Dimocarpus longan) by potassium chlorate: Application, mechanism, and future perspectives. Front. Plant Sci. 2021, 12, 670587. [Google Scholar] [CrossRef] [PubMed]
  4. Yue, X.; Chen, Z.; Zhang, J.; Huang, C.; Zhao, S.; Li, X.; Qu, Y.; Zhang, C. Extraction, purification, structural features and biological activities of longan fruit pulp (Longyan) polysaccharides: A review. Front. Nutr. 2022, 9, 914679. [Google Scholar] [CrossRef] [PubMed]
  5. Jue, D.; Sang, X.; Liu, L.; Shu, B.; Wang, Y.; Liu, C.; Wang, Y.; Xie, J.; Shi, S. Comprehensive analysis of the longan transcriptome reveals distinct regulatory programs during the floral transition. BMC Genom. 2019, 20, 126. [Google Scholar] [CrossRef] [PubMed]
  6. Jia, T.; Wei, D.; Meng, S.; Allan, A.C.; Zeng, L. Identification of regulatory genes implicated in continuous flowering of longan (Dimocarpus longan L.). PLoS ONE 2014, 9, e114568. [Google Scholar] [CrossRef]
  7. Iwata, H.; Gaston, A.; Remay, A.; Thouroude, T.; Jeauffre, J.; Kawamura, K.; Oyant, L.H.S.; Araki, T.; Denoyes, B.; Foucher, F. The TFL1 homologue KSN is a regulator of continuous flowering in rose and strawberry. Plant J. 2012, 69, 116–125. [Google Scholar] [CrossRef]
  8. Bai, M.; Liu, J.; Fan, C.; Chen, Y.; Chen, H.; Lu, J.; Sun, J.; Ning, G.; Wang, C. KSN heterozygosity is associated with continuous flowering of Rosa rugosa Purple branch. Hortic. Res. 2021, 8, 26. [Google Scholar] [CrossRef]
  9. Randoux, M.; Davière, J.M.; Jeauffre, J.; Thouroude, T.; Pierre, S.; Toualbia, Y.; Perrotte, J.; Reynoird, J.P.; Jammes, M.J.; Oyant, L.H.S.; et al. RoKSN, a floral repressor, forms protein complexes with RoFD and RoFT to regulate vegetative and reproductive development in rose. New Phytol. 2014, 202, 161–173. [Google Scholar] [CrossRef]
  10. Yi, X.; Gao, H.; Yang, Y.; Yang, S.; Luo, L.; Yu, C.; Wang, J.; Cheng, T.; Zhang, Q.; Pan, H. Differentially expressed genes related to flowering transition between once- and continuous-flowering Roses. Biomolecules 2021, 12, 58. [Google Scholar] [CrossRef]
  11. Randoux, M.; Jeauffre, J.; Thouroude, T.; Vasseur, F.; Hamama, L.; Juchaux, M.; Sakr, S.; Foucher, F. Gibberellins regulate the transcription of the continuous flowering regulator, RoKSN, a rose TFL1 homologue. J. Exp. Bot. 2012, 63, 6543–6554. [Google Scholar] [CrossRef]
  12. Ahmad, S.; Lu, C.; Gao, J.; Ren, R.; Wei, Y.; Wu, J.; Jin, J.; Zheng, C.; Zhu, G.; Yang, F. Genetic insights into the regulatory pathways for continuous flowering in a unique orchid Arundina graminifolia. BMC Plant Biol. 2021, 21, 587. [Google Scholar] [CrossRef] [PubMed]
  13. Ahmad, S.; Peng, D.; Zhou, Y.; Zhao, K. The genetic and hormonal inducers of continuous flowering in Orchids: An emerging view. Cells 2022, 11, 657. [Google Scholar] [CrossRef] [PubMed]
  14. Sheng, Y.; Hao, Z.; Peng, Y.; Liu, S.; Hu, L.; Shen, Y.; Shi, J.; Chen, J. Morphological, phenological, and transcriptional analyses provide insight into the diverse flowering traits of a mutant of the relic woody plant Liriodendron chinense. Hortic. Res. 2021, 8, 174. [Google Scholar] [CrossRef] [PubMed]
  15. Waheed, S.; Liang, F.; Zhang, M.; He, D.; Zeng, L. High-throughput sequencing reveals novel microRNAs involved in the continuous flowering trait of longan (Dimocarpus longan Lour.). Int. J. Mol. Sci. 2022, 23, 15565. [Google Scholar] [CrossRef] [PubMed]
  16. Song, Y.H.; Shim, J.S.; Kinmonth-Schultz, H.A.; Imaizumi, T. Photoperiodic flowering: Time measurement mechanisms in leaves. Annu. Rev. Plant Biol. 2015, 66, 441–464. [Google Scholar] [CrossRef]
  17. Del Prete, S.; Molitor, A.; Charif, D.; Bessoltane, N.; Soubigou-Taconnat, L.; Guichard, C.; Brunaud, V.; Granier, F.; Fransz, P.; Gaudin, V. Extensive nuclear reprogramming and endoreduplication in mature leaf during floral induction. BMC Plant Biol. 2019, 19, 135. [Google Scholar] [CrossRef]
  18. Huang, S.; Lv, X.; Han, Y.; Han, D.; Wei, J.; Li, J.; Guo, D. Disrupted sugar transport and continued sugar consumption lead to sugar decline in ripe ‘Shixia’ longan fruit. LWT 2024, 191, 115620. [Google Scholar] [CrossRef]
  19. Chen, T.; Chen, X.; Zhang, S.; Zhu, J.; Tang, B.; Wang, A.; Dong, L.; Zhang, Z.; Yu, C.; Sun, Y.; et al. The Genome Sequence Archive family: Toward explosive data growth and diverse data types. Genom. Proteom. Bioinform. 2021, 19, 578–583. [Google Scholar] [CrossRef]
  20. CNCB-NGDC Members and Partners. Database resources of the National Genomics Data Center, China National Center for Bioinformation in 2022. Nucleic Acids Res. 2022, 50, D27–D38. [Google Scholar] [CrossRef]
  21. Lin, Y.; Min, J.; Lai, R.; Wu, Z.; Chen, Y.; Yu, L.; Cheng, C.; Jin, Y.; Tian, Q.; Liu, Q.; et al. Genome-wide sequencing of longan (Dimocarpus longan lour.) provides insights into molecular basis of its polyphenol-rich characteristics. GigaScience 2017, 6, 1–14. [Google Scholar] [CrossRef]
  22. Kim, D.; Langmead, B.; Salzberg, S.L. HISAT: A fast spliced aligner with low memory requirements. Nat. Methods 2015, 12, 357–360. [Google Scholar] [CrossRef]
  23. Liao, Y.; Smyth, G.K.; Shi, W. FeatureCounts: An efficient general purpose program for assigning sequence reads to genomic features. Bioinformatics 2014, 30, 923–930. [Google Scholar] [CrossRef] [PubMed]
  24. Love, M.I.; Huber, W.; Anders, S. Moderated estimation of fold change and dispersion for rna-seq data with DEseq2. Genome Biol. 2014, 15, 550. [Google Scholar] [CrossRef]
  25. Kanehisa, M.; Araki, M.; Goto, S.; Hattori, M.; Hirakawa, M.; Itoh, M.; Katayama, T.; Kawashima, S.; Okuda, S.; Tokimatsu, T.; et al. KEGG for linking genomes to life and the environment. Nucleic Acids Res. 2008, 36, D480–D484. [Google Scholar] [CrossRef]
  26. Ashburner, M.; Ball, C.A.; Blake, J.A.; Botstein, D.; Butler, H.; Cherry, J.M.; Davis, A.P.; Dolinski, K.; Dwight, S.S.; Eppig, J.T.; et al. Gene ontology: Tool for the unification of biology. Nat. Genet. 2000, 25, 25–29. [Google Scholar] [CrossRef] [PubMed]
  27. Koonin, E.V.; Fedorova, N.D.; Jackson, J.D.; Jacobs, A.R.; Krylov, D.M.; Makarova, K.S.; Mazumder, R.; Mekhedov, S.L.; Nikolskaya, A.N.; Rao, B.S.; et al. A comprehensive evolutionary classification of proteins encoded in complete eukaryotic genomes. Genome Biol. 2004, 5, R7. [Google Scholar] [CrossRef]
  28. Langfelder, P.; Horvath, S. WGCNA: An R package for weighted correlation network analysis. BMC Bioinform. 2008, 9, 559. [Google Scholar] [CrossRef]
  29. Shannon, P.; Markiel, A.; Ozier, O.; Baliga, N.S.; Wang, J.T.; Ramage, D.; Amin, N.; Schwikowski, B.; Ideker, T. Cytoscape: A software environment for integrated models of biomolecular interaction networks. Genome Res. 2003, 13, 2498–2504. [Google Scholar] [CrossRef] [PubMed]
  30. Luo, T.; Shuai, L.; Lai, T.; Liao, L.; Li, J.; Duan, Z.; Xue, X.; Han, D.; Wu, Z. Upregulated glycolysis, TCA, fermentation and energy metabolism promoted the sugar receding in ‘Shixia’ longan (Dimocarpus longan Lour.) pulp. Sci. Hortic. 2021, 281, 109998. [Google Scholar] [CrossRef]
  31. Mishra, P.; Panigrahi, K.C. GIGANTEA-an emerging story. Front. Plant Sci. 2015, 6, 8. [Google Scholar] [CrossRef]
  32. Shim, J.S.; Kubota, A.; Imaizumi, T. Circadian clock and photoperiodic flowering in Arabidopsis: CONSTANS is a hub for signal integration. Plant Physiol. 2017, 173, 5–15. [Google Scholar] [CrossRef]
  33. Takagi, H.; Hempton, A.K.; Imaizumi, T. Photoperiodic flowering in Arabidopsis: Multilayered regulatory mechanisms of CONSTANS and the florigen FLOWERING LOCUS T. Plant Commun. 2023, 4, 100552. [Google Scholar] [CrossRef] [PubMed]
  34. Chen, Q.; Zhang, J.; Li, G. Dynamic epigenetic modifications in plant sugar signal transduction. Trends Plant Sci. 2022, 27, 379–390. [Google Scholar] [CrossRef] [PubMed]
  35. Corbesier, L.; Bernier, G.; Périlleux, C. C:N ratio increases in the phloem sap during floral transition of the long-day plants Sinapis alba and Arabidopsis thaliana. Plant Cell Physiol. 2002, 43, 684–688. [Google Scholar] [CrossRef] [PubMed]
  36. Xu, J.; Zhang, S. Mitogen-activated protein kinase cascades in signaling plant growth and development. Trends Plant Sci. 2015, 20, 56–64. [Google Scholar] [CrossRef]
  37. Zhang, M.; Su, J.; Zhang, Y.; Xu, J.; Zhang, S. Conveying endogenous and exogenous signals: MAPK cascades in plant growth and defense. Curr. Opin. Plant Biol. 2018, 45, 1–10. [Google Scholar] [CrossRef]
  38. Sun, T.; Zhang, Y. MAP kinase cascades in plant development and immune signaling. EMBO Rep. 2022, 23, e53817. [Google Scholar] [CrossRef]
  39. Santner, A.; Estelle, M. Recent advances and emerging trends in plant hormone signalling. Nature 2009, 459, 1071–1078. [Google Scholar] [CrossRef]
  40. Wolters, H.; Jürgens, G. Survival of the flexible: Hormonal growth control and adaptation in plant development. Nat. Rev. Genet. 2009, 10, 305–317. [Google Scholar] [CrossRef] [PubMed]
  41. Conti, L. Hormonal control of the floral transition: Can one catch them all? Dev. Biol. 2017, 430, 288–301. [Google Scholar] [CrossRef]
  42. Bao, S.; Hua, C.; Shen, L.; Yu, H. New insights into gibberellin signaling in regulating flowering in Arabidopsis. J. Integr. Plant Biol. 2020, 62, 118–131. [Google Scholar] [CrossRef] [PubMed]
  43. Fu, X.; Harberd, N.P. Auxin promotes Arabidopsis root growth by modulating gibberellin response. Nature 2003, 421, 740–743. [Google Scholar] [CrossRef]
  44. Frigerio, M.; Alabadí, D.; Pérez-Gómez, J.; García-Cárcel, L.; Phillips, A.L.; Hedden, P.; Blázquez, M.A. Transcriptional regulation of gibberellin metabolism genes by auxin signaling in Arabidopsis. Plant Physiol. 2006, 142, 553–563. [Google Scholar] [CrossRef]
  45. Li, Z.; He, Y. Roles of brassinosteroids in plant reproduction. Int. J. Mol. Sci. 2020, 21, 872. [Google Scholar] [CrossRef] [PubMed]
  46. Koyama, T. Regulatory mechanisms of transcription factors in plant morphology and function. Int. J. Mol. Sci. 2023, 24, 7039. [Google Scholar] [CrossRef] [PubMed]
  47. Zhang, L.; Liu, G.; Jia, J.; Zhao, G.; Xia, C.; Zhang, L.; Li, F.; Zhang, Q.; Dong, C.; Gao, S.; et al. The wheat MYB-related transcription factor TaMYB72 promotes flowering in rice. J. Integr. Plant Biol. 2016, 58, 701–704. [Google Scholar] [CrossRef]
  48. Li, H.; Du, H.; Huang, Z.; He, M.; Kong, L.; Fang, C.; Chen, L.; Yang, H.; Zhang, Y.; Liu, B.; et al. The AP2/ERF transcription factor TOE4b regulates photoperiodic flowering and grain yield per plant in soybean. Plant Biotechnol. J. 2023, 21, 1682–1694. [Google Scholar] [CrossRef]
  49. Song, H.; Duan, Z.; Zhang, J. WRKY transcription factors modulate flowering time and response to environmental changes. Plant Physiol. Biochem. 2024, 210, 108630. [Google Scholar] [CrossRef]
Figure 1. Annotation of unigenes. (a) KOG annotation of unigenes; (b) Transcription factor (TF) annotation of unigenes; (c) Nr annotation of unigenes.
Horticulturae 10 00974 g001
Figure 2. Analysis of differentially expressed genes (DEGs). (a) DEGs Venn diagram; (b) Number of DEGs; (c) Kmeans clustering of DEGs; (d) DEGs heat map. SX, CL and SJ represent Dimocarpus longan cv. ‘Shixia’, D. longan cv. ‘Chuliang’ and D. longan cv. ‘Sijimi’ respectively.
Horticulturae 10 00974 g002
Figure 3. WGCNA analysis. (a) Heat map of module correlations (the smaller the value on the upper vertical axis, the higher the similarity between the two modules, and the darker the color (redder) in the lower squares, the stronger the correlation); (b) heat map of sample and module correlations (the horizontal axis represents the sample, and the vertical axis represents the module. The number in each cell represents the correlation between the module and the sample. The closer the value is to 1, the stronger the positive correlation between the module and the sample; the closer it is to −1, the stronger the negative correlation between the module and the sample. The number in parentheses represents P value significance, and the smaller the value, the stronger the significance.); gene-expression patterns of the bisque4 (c) and darkorange2 (d) modules; the upper part shows the clustering heatmap of genes within the module, with red indicating high expression and green indicating low expression, and the lower part shows the expression patterns of module feature values in different samples. SX, CL and SJ represent Dimocarpus longan cv. ‘Shixia’, D. longan cv. ‘Chuliang’ and D. longan cv. ‘Sijimi’, respectively.
Horticulturae 10 00974 g003
Figure 4. KEGG annotation of the bisque4 and darkorange2 modules. KEGG classification of the bisque4 (a) and darkorange2 (b) modules; KEGG enrichment of the bisque4 (c) and darkorange2 (d) modules.
Horticulturae 10 00974 g004
Figure 5. Comparison of gene expression in CF(SJ) and OF (SX, CL). FPKM values of ten genes: (Dlo_033630.1 (a), Dlo_020951.2 (c), novel.3159 (e), Dlo_014365.1 (g), Dlo_008881.1 (i), Dlo_023607.1 (k), novel.4880 (m), Dlo_030062.1 (o), Dlo_020508.1 (q), Dlo_029223.1 (s)) in SX, SJ and CL and relative expression level of ten genes (Dlo_033630.1 (b), Dlo_020951.2 (d), novel.3159 (f), Dlo_014365.1 (h), Dlo_008881.1 (j), Dlo_023607.1 (l), novel.4880 (n), Dlo_030062.1 (p), Dlo_020508.1 (r), Dlo_029223.1 (t)) in SX, SJ and CL were compared. SX, CL and SJ represent Dimocarpus longan cv. ‘Shixia’, D. longan cv. ‘Chuliang’ and D. longan cv. ‘Sijimi’, respectively. Data are presented as the mean ± standard error, and different lowercase letters above the bars indicate significant differences (Duncan’s test, p < 0.05).
Horticulturae 10 00974 g005
Table 1. Summary of Illumina transcriptome sequencing.
SampleRaw ReadsClean ReadsReads MappedError Rate (%)Q20 (%)Q30 (%)GC Content (%)
CL156,508,12654,531,10650,215,847 (92.09%)0.0397.6993.2443.94
CL258,805,11256,520,95451,230,072 (90.64%)0.0397.6893.1844.24
CL353,907,76652,271,81447,684,261 (91.22%)0.0397.5892.9644.19
SJ151,469,29050,029,87446,120,702 (92.19%)0.0397.6593.1644.29
SJ248,643,34247,113,16643,536,518 (92.41%)0.0397.7993.544.34
SJ348,346,33046,804,87243,405,759 (92.74%)0.0397.793.344.57
SX146,602,46844,987,71241,640,487 (92.56%)0.0397.7693.4345.18
SX244,219,40842,643,89639,537,158 (92.71%)0.0397.7993.4944.25
SX345,368,97643,868,41239,295,927 (89.58%)0.0397.793.2744.21
Disclaimer/Publisher’s Note: The statements, opinions and data contained in all publications are solely those of the individual author(s) and contributor(s) and not of MDPI and/or the editor(s). MDPI and/or the editor(s) disclaim responsibility for any injury to people or property resulting from any ideas, methods, instructions or products referred to in the content.

