Article

Physio-Morphological Traits Contributing to Genotypic Differences in Nitrogen Use Efficiency of Leafy Vegetable Species under Low N Stress

1
Department of Horticulture, Faculty of Agriculture, Erciyes University, 38030 Kayseri, Türkiye
2
Department of Soil Science and Plant Nutrition, Faculty of Agriculture, Erciyes University, 38030 Kayseri, Türkiye
*
Author to whom correspondence should be addressed.
Horticulturae 2024, 10(9), 984; https://doi.org/10.3390/horticulturae10090984
Submission received: 19 August 2024 / Revised: 8 September 2024 / Accepted: 12 September 2024 / Published: 17 September 2024
(This article belongs to the Special Issue Responses to Abiotic Stresses in Horticultural Crops—2nd Edition)

Abstract

:
Soil fertility is declining in low-input agriculture due to insufficient fertilizer application by small-scale farmers. On the other hand, concerns are rising regarding the environmental pollution of both air and water in high-input agriculture due to the excessive use of N fertilizers in short growing seasons for vegetable crops, which is directly linked to the health of human beings and environmental safety. This study aimed to determine genotypic differences in the Nitrogen Use Efficiency (NUE) levels of different leafy vegetable species (Arugula, Spinach, Cress, Parsley, and Dill) grown hydroponically under two different N rates, low N (0.3 mM) and high N (3.0 mM), and to identify the plant traits that are contributing to NUE. A nutrient solution experiment was conducted between March and April 2024 by using an aerated Deep-Water Culture (DWC) technique in a fully automated climate room with a completely randomized block design (CRBD) with three replications for five weeks. The results indicated that shoot growth, as well as root morphological and leaf physiological responses, was significantly (p < 0.001) affected by genotype, the N rate, and genotype–N rate interactions. Shoot growth in some vegetable species (Arugula, Spinach, and Cress) was significantly higher under a low N than a high N rate, illustrating that they have a great capability for NUE under low N stress conditions. Similar results were also recorded for the root growth of the N-efficient species under low N rates. The NUE levels of these species were closely associated with leaf physiological (leaf area, leaf chlorophyll index (SPAD), photosynthesis, and total leaf chlorophyll (a + b) and carotenoids) and root morphological (root length, root volume, and average root diameter) characteristics. These plant traits could be useful indicators for the selection and breeding of ‘N-efficient’ leafy vegetable species for sustainable low-input agriculture systems in the future. However, further investigation should be carried out at the field level to confirm their commercial production viability.

1. Introduction

The world population is increasing at a rate of 80 million per year and is expected to be around 9.0 billion in the year 2037 and 10.0 billion in 2058 [1]. A rapidly increasing world population demands ever-increasing food production. However, keeping food production at the same level as population growth without using up or devastating non-renewable resources is not an easy task for sustainable agriculture [2]. Today, mineral fertilizers are still an important resource and an essential input for achieving strong crop growth and yields in both high-input and low-input agricultural systems. In particular, nitrogen (N) is the most common and widely used essential fertilizer nutrient for increasing crop yields and plant biomass levels [3]. For the past five decades, the utilization of nitrogen fertilizer by farmers has increased by 20%, and by 2030, it is expected to rise to 180 million tons [2]. However, the available N is more often a limiting factor, influencing plant growth more than any other nutrient in both high-input and low-input agriculture systems [4]. Usually, in low-input agriculture systems, low amounts of N fertilizers are mostly used by peasant farmers, and thus the fertility of the soil is reducing. On the other hand, due to the overuse of nitrogen fertilizers by high-rate agriculture systems, concerns are rising regarding the environmental pollution of both air and water [5]. As a result of the long-term use of excessive N fertilizers, soils are becoming more acidic, and this acidity may become a yield-limiting factor by increasing exchangeable aluminum (Al) and Al saturation (Alsat) and, reversely, by decreasing exchangeable base cations (Ca2+ and Mg2+) in the soil [6]. For instance, there is a conception that if more N is used, a higher yield can be obtained. Bearing this in mind, farmers or growers apply more nitrogenous fertilizers to achieve the maximum yield of leafy vegetable crops in a short growing season.
Leafy vegetable crops are consumed by human beings in large quantities throughout the world, since nutritionally and dietarily, vegetables are important sources of vitamins (A, C, and B-complex), minerals (especially calcium, iron, magnesium, and phosphorus), and fibers. Moreover, green leafy vegetables act as strong antioxidants that detoxify Reactive Oxygen Species (ROS) formed under stress or disease conditions [7]. Therefore, medical doctors advise patients to consume green vegetables more in their daily diets [8,9]. However, many leafy vegetable crops have shallow root systems (30–40 cm rooting depth), and thus N fertilization should be implemented carefully for the health of human beings and environmental safety. The efficiency of N fertilizers is frequently low since plants often take up less than 50% of the applied N [10]. This is due to the high proportion of N fertilizer losses from the soil and/or from the plant–soil system through volatilization (i.e., ammoniac), leaching (i.e., nitrate), and denitrification (i.e., nitrous oxide/greenhouse gas) processes [11,12].
Many crop plants, especially leafy vegetables, accumulate excessive nitrate (NO3) in expanded leaves under low-light conditions when the uptake of NO3 exceeds the reduction at a high transpiration rate. Usually, when plants use solar energy sufficiently, the nitrate absorbed from the soil is reduced to nitrite (NO2) by nitrate reductase (NR) in the leaf cytosol [13]. Nitrite translocated into the chloroplasts is converted into ammonium ion (NH4+) by nitrite reductase (NIR) located in the chloroplasts, and then the NH4+ ion is assimilated into amino acids [13]. However, particularly in the winter season when the duration and intensity of solar energy reduce, excessive NO3 in expanded leaves may be harmful and toxic for the health of the consumer, as it can be converted into NO2, causing methemoglobinemia or carcinogenic nitrosamines [14]. Because of these two historical backgrounds, NO2 and NO3 contents in foods and drinks have been strictly limited by regulations in many countries [7]. At the moment, there is great interest in identifying the processes involved in the regulation of N uptake and N metabolism within leafy vegetable crops, as well as in developing N management strategies to reduce N fertilizer use and improve NUE. In plants, NUE is a result of uptake efficiency (where N is taken from the soil or N fertilizer) and utilization efficiency (extracted N is converted into yield) [15]. Many external environmental conditions like ammonia volatilization, nitrification, denitrification, immobilization, leaching, runoff, temperature, soil pH, soil texture, rainfall and irrigation, soil salinity, tillage, weeds, pests, diseases, N loss from plants, fires, crop rotation, crop nutrition, crop varieties, and nitrogen management are responsible for the efficient use of N within plants, along with N rates [16].
NUE is related to the genetic variation in crop plants and has been well known for at least 98 years [17]. Recently, many plant physiologists and plant breeders have drawn increasing attention to genotypic differences in NUE on ecological, economic, and socio-economical grounds. However, the discussion on genotypic differences in NUE is complicated in the first place by the absence of a generally accepted definition of N efficiency, and the term is used in various ways in the literature [18]. A genotype can be characterized as N efficient either when realizing a yield above average under conditions of low or suboptimal N supply [19] or when converting N fertilizer efficiently into yield under conditions of high N supply [20]. In the present study, NUE efficiency is defined as shoot dry biomass production at low or suboptimal N supply. Shoot biomass production at a high N supply is considered as yield potential. Therefore, this study aimed to determine genotypic differences in NUE among different leafy vegetable species, Arugula, Spinach, Cress, Parsley, and Dill, grown hydroponically under two different N rates, low N (0.3 mM) and high N (3.0 mM), and to identify the leaf and root traits that are contributing to NUE.

2. Materials and Methods

2.1. Plant Material, Treatments, and Experimental Design

This study was carried out in the Plant Nutritional Physiology Laboratory of Erciyes University, Faculty of Agriculture, Central Anatolia, in Türkiye between March and April 2024. A hydroponic experiment was conducted by using an aerated DWC technique in a fully automated climate chamber. For the vegetative growth, the average day and night temperatures were 18/20 °C, while the relative humidity was 65–70%. Plants received approximately 400 µmol m−2 S−1 photon flux in a photoperiod of 10/14 h of light–dark regimes in the controlled growth chamber. Five leafy vegetable species, Parsley (Petroselinum crispum), Arugula (Eruca vesicaria), Dill (Anethum graveolens), Spinach (Spinacia oleracea), and Cress (Lepidium sativum), were used as the plant materials. The seeds were obtained from the seed company of Arzuman Co., Ltd., Türkiye. They were sown in 72-cell polystyrene trays (W 280 × L 540 × H 45 mm, IBK Iklim Bahce Co., Ltd., Mersin, Türkiye) filled with a mixture of peat (pH: 6.0–6.5) and perlite (2v:1v) and irrigated with tap water. To promote germination, the plug trays were wrapped with vinyl chloride resin film and then placed in a germination chamber at 28 °C. Seedlings were watered daily.
When the seedlings developed three or four true leaves, they were transplanted to plastic pots after the root system of the plants was carefully washed in distilled water to clean the substrate. Three uniform seedlings of each vegetable were then transferred into an 8 L container containing a modified Hoagland nutrient solution and grown for five weeks. Two different nitrogen concentrations, low N (0.3 mM) and high N (3.0 mM), were supplied, and Ca(NO3)2 was used as the N source. Each pot was filled with an 8 L cultivation solution that was aerated by an air pump. The pH of Hoagland’s solution was kept between 5.5 and 6.6 for both N rates, while the electrical conductivity (EC) of the solution was maintained at 1.5 dS/m at a low N rate and 1.8 dS/m at a high N rate. The nutrient solution had the following composition (μM): K2SO4 (500); KH2PO4 (250); CaSO4 (1000); MgSO4 (325); NaCl (50); H3BO3 (8); MnSO4 (0.4); ZnSO4 (0.4); CuSO4 (0.4); MoNa2O4 (0.4); and Fe-EDDHA (80). Due to the transplanting of small seedlings, solutions were replaced completely every week in the first two weeks. Complete renewals of the nutrient solution were conducted (at 7-day intervals) when the N concentration of the nutrient solution in the 3.0 mM N rate pots fell below 0.5 mM, as measured daily with nitrate test strips (Merck, Darmstadt, Germany) by using a NitracheckTM 404 (Serial N 52924) reflectometer. In the hydroponics experiment, the total vegetative growth period from transplanting up to the final harvest was almost five weeks. The experiment was in a CRBD with three replicates, with three plants per replicate.

2.2. Plant Growth and Biomass Partitioning

At the final harvest, five weeks after transplanting, in April 2024, the shoot biomass (the upper part of the plants) was determined. Plants were harvested by separating them into stems, leaves, and roots. Their tissues were dried in a forced-air oven at 80 °C for 72 h for biomass determination until the stable weight was reached. Then, they were weighed on an electronic digital scale. Shoot biomass was equal to the sum of aerial vegetative plant parts (leaves + stems) and was expressed in g plant−1. The root–shoot ratio was calculated by dividing the root dry weight by the sum of leaf and stem dry weights. Plant height (cm) was measured as the distance between the pot surface and the tip of the plant by using a ruler. Each fully developed leaf was counted as a leaf number and recorded as LN plant−1.

2.3. Leaf Physiological Measurements

The total leaf area of the plants was measured destructively at harvesting by using a leaf-area meter (LI-COR Model 3100, LI-COR. Inc., Lincoln, NE, USA). The total leaf area was recorded in centimeters square (cm2). The leaf chlorophyll index (SPAD) was measured with a chlorophyll meter (Minolta SPAD 502 Plus, Konica Minolta Business Solutions Europe GmbH, Rimpar, Germany) in the third week after plant establishment in hydroponic culture and was continued weekly until the end of the experiment. During the growth period, the leaf chlorophyll content measurement was performed on the youngest fully expanded leaves (3rd–4th leaf from the apex) of whole plants, using 4 replicate leaves per treatment in the third and fifth week of the vegetative period. The measurements were carried out at temperatures of 20/18 °C (average day–night temperatures) and a relative humidity of 65–70%. The supplied photon flux in the growth chamber was 400 μmol m−2 S−1 with a photoperiod of 10/14 h (light/dark).
Prior to harvest, non-destructive measurements of the leaf-level CO2 gas exchange (µmol CO2 m−2 s−1) were conducted in a controlled growth chamber by using a portable photosynthesis system (LI-6400XT; LI-COR Inc., Lincoln, NE, USA). The leaf net photosynthesis measurement was performed on the youngest fully expanded leaves (3rd–4th leaf from the apex), using 4 replicate leaves per treatment in the third and fifth week of the vegetation period. The LI-6400 was equipped with a well-stirred 2.5 × 10⁻⁵ m3 leaf chamber with constant area inserts (1.2 × 10⁻³ m2) and fitted with a variable-intensity red source (Model QB1205LI-670; Quantum Devices, Barneveld, WI, USA) [21]. Leaf temperature within the chamber was 30 ± 2 °C, while the vapor pressure difference between the leaf and air was 2.6 ± 0.3 °C. The CO2 concentration was 400 µmol L−1, and the photosynthetically active radiation (PAR) was 1000 µmol m−2s−1. All gas exchange measurements were carried out between 09:00 and 12:00 on all species.
A day before harvesting, extraction of the photosynthetic pigments from 100 mg of fresh leaf samples from each replicate of the treatment combinations was conducted by measuring the total chlorophyll content of the leaf and carotenoid contents using UV–VIS spectroscopy. The leaf samples used for chlorophyll and carotenoid determinations were of the same physiological age as those used for the leaf net photosynthesis measurements. The samples were put into 15 mL capped containers where 10 mL of ethylene alcohol of 95% concentration was added. They were then kept in darkness at room temperature overnight to allow the extraction of the leaf pigments. Measurements were performed using a spectrometer (UV/VS T80+ of PG Instruments Limited, Lutterworth, UK) at wavelengths of 470 nm, 648.6 nm, and 664.2 nm. (A) Leaf total chlorophyll (a + b), (B) leaf chlorophyll a, (C) leaf chlorophyll b, and (D) leaf total carotenoids were then estimated from the spectrometric readings using the formulae of Lichtenthaler [22]:
(A)
Total chlorophyll (a + b) (µmol g−1) = [(5.24 WL664.2 + 22.24 WL648.6) × 8.1]/sample (g).
(B)
Chlorophyll a (µmol g−1) = [(13.36 WL664.2 − 5.19 WL648.6) × 8.1]/sample (g).
(C)
Chlorophyll b (µmol g−1) = [(27.43 WL648.6 − 8.12 WL664.2) × 8.1]/sample (g).
(D)
Total carotenoids (µmol g−1) = [(4.785 WL470 + 3.657 WL664.2 − 12.76 WL648.6) × 8.1]/sample (g).
WL470, WL648.6, and WL664.2 refer to spectrometric readings at wavelengths of 470 nm, 648.6 nm, and 664.2 nm respectively.

2.4. Root Morphological Measurements

The plant root morphological parameters of total root length (m plant−1), total root volume (cm3 plant−1), and average root diameter (mm) were measured by using a special image analysis software program WinRHIZO (Win/Mac RHIZO Pro V. 2002c Regent Instruments Inc., QC G1V 1V4, Québec, Canada) in combination with a recording device, the Epson Expression 11000XL scanner (Katella Avenue, Los Alamitos, CA, USA). Measurements were recorded as cm plant−1 and then converted to m plant−1.

2.5. Leaf Nitrate Reductase Enzyme Activity (NRA) Measurement

Leaf nitrate reductase enzyme activity (NRA) in the leaves was determined following the method proposed by Harley [23,24]. During harvesting time, each leaf sample was taken and chopped into pieces; then, 2 g each was placed in two falcon tubes and labeled time-0 (T0) and time-60 (T60). The tubes were covered with aluminum foil to prevent light exposure. Next, 10 mL of an assay buffer solution [100 mM phosphate buffer, pH 7.5; 30 mM KNO3; 5% (v/v) propanol] was added (T0 and T60). The T0 container was immediately placed into boiling water for 5 min, removed, and allowed to cool to room temperature. The T60 container was kept for 60 min at room temperature before it was also placed in boiling water for 5 min and allowed to cool to room temperature. To detect nitrite in the assay tubes, the optical density (OD) of each standard tube was determined at a wavelength of 540 nm using the spectrometer.

2.6. Data Analysis

All measured physiological and morphological parameters were analyzed using SAS Statistical Software (SASVR 9.4) [25]. A two-factor factorial analysis of variance was performed to study the effects of genotype and N and their interactions. Levels of significance are represented by * p < 0.05, ** p < 0.01, and *** p < 0.001, and ns means not significant. The mean separation of treatments was carried out using Duncan’s Multiple Test (p < 0.05).

3. Results

3.1. Biomass Production and Partitioning

The results obtained from the hydroponic experiment demonstrated that the shoot fresh weight and root fresh weight of different vegetable species were significantly (p < 0.001) affected by genotype, the N rate, and genotype–N rate interactions (Table 1). Some of the vegetable species (Arugula, Spinach, Cress, etc.) grown under a low N rate usually exhibit a higher shoot growth performance as compared to being grown under a high N rate. Among the vegetable species, shoot fresh weight varied between 19.1 and 4.10 g plant−1 at a low N rate and 15.1 and 4.93 g plant−1 at a high N rate. The significantly highest shoot fresh weight was observed in Arugula followed by Spinach and Cress under a low N rate, whereas Parsley and Dill showed the lowest shoot fresh weight at the same N rate. At a high N rate, Arugula again showed the significantly highest shoot fresh weight followed by Dill and Spinach, while Parsley and Cress showed the lowest shoot fresh weight at the same N rate. On the other hand, root growth responses of the vegetable species were not similar to the shoot growth responses under a low N rate. The vegetable species usually exhibited higher root fresh weight under a high N rate compared to a low N rate.
The root fresh weight among the vegetable species varied between 5.57 and 2.34 g plant−1 at a low N rate and between 4.71 and 2.84 g plant−1 at a high N rate. Among the species, the significantly highest root fresh weight was shown by Arugula followed by Cress and Spinach under a low N rate, whereas Parsley and Dill showed the lowest root fresh weight at the same N rate. All these results indicated that the shoot and root growth responses of the vegetable species at a low N rate were matching. However, similar genotypic responses could not be recorded in root fresh weight under a high N rate, indicating a significant genotype–N rate interaction. The significantly highest root fresh weight was shown by Arugula followed by Dill and Spinach under a high N rate, whereas Parsley and Cress showed the lowest root fresh weight. Although highly significant genotypic variations (p < 0.001) existed among the vegetable species regarding plant height, the effects of the N rate and genotype—N rate interactions were not significant. Averaged over all of the N rates, the highest plant height was shown by Dill, whereas the lowest plant height was shown by Spinach. However, regarding the shoot fresh weight, both genotypes (Dill and Spinach) showed contrasting results, which indicated that a positive relationship between shoot fresh weight and plant height did not always exist. Among the species, the plant height varied between 19.0 and 13.0 cm plant−1 at a low N rate and 20.0 and 12.0 cm plant−1 at a high N rate.
The shoot dry matter production of the different vegetable species was significantly affected by genotype, the N rate, and genotype–N rate interactions (Table 2). Similar to the case in shoot fresh weight, the vegetable species grown under a low N rate usually exhibited a higher shoot dry matter production compared to a high N rate. The shoot dry matter among the species varied between 1.60 and 0.42 g plant−1 at a low N rate and 1.26 and 0.50 g plant−1 at a high N rate. The best performance in shoot dry matter production was shown by Arugula followed by Spinach and Cress under a low N rate, whereas Parsley and Dill showed the lowest shoot dry matter production at the same N rate. All these results indicate that some of the vegetable species have a great capability for NUE under stress conditions. Particularly, three vegetable species, Arugula, Spinach, and Cress, can be characterized as ‘N-efficient’ genotypes due to exhibiting high shoot fresh (Table 1) and dry biomass (Table 2) production as compared to the ‘N-inefficient’ Parsley and Dill genotypes under a low N rate. Interestingly, the Arugula and Spinach maintained high shoot dry matter production at a high N rate, while Parsley and Dill maintained the lowest shoot dry matter. Thus, Arugula and Spinach can be characterized as ‘N-responsive’ due to exhibiting high shoot dry matter while Parsley and Dill as ‘N-nonresponsive’ genotypes under high N rate condition.
Although the root fresh weight of the different vegetable species was significantly (p < 0.001) affected by genotype, the N rate, and genotype–N rate interactions (Table 1), the only significant differences that existed among the genotypes were in root dry matter (Table 2). The root dry weight among the species varied between 0.25 and 0.09 g plant−1 at a low N rate and 0.24 and 0.10 g plant−1 at a high N rate. Averaged over all N rates, the highest root dry weight among the species was shown by Arugula followed by Spinach and Cress, whereas Parsley and Dill showed the lowest root dry weight. All these results indicate that the ‘N-efficient’ characterized Arugula, Spinach, and Cress genotypes, which produced the highest shoot fresh (Table 1) and shoot dry biomass (Table 2), also exhibited a higher root dry matter production compared to the ‘N-inefficient’ Parsley and Dill genotypes under a low N rate.
Biomass partitioning between shoots and roots was significantly affected by N rates and genotypes. Irrespective of vegetable species, a higher assimilate allocation might occur from shoot to root, and thus a high root–shoot ratio was found under a high N rate compared to a low N rate. Among the species, the root–shoot ratio varied between 0.21 and 0.13 g g−1 at a low N rate and 0.24 and 0.18 g g−1 at a high N rate. The ‘N-inefficient’ genotype Parsley had the highest root–shoot ratio, while the lowest ratio was shown by the ‘N-efficient’ genotype Spinach at a low N rate. On the other hand, the highest root–shoot ratio was shown by the ‘N-efficient’ genotype Cress, while the lowest ratio was shown by the ‘N-efficient’ genotype Spinach at a high N rate. All these results indicated that the ‘N-efficient’ characterized genotypes (Arugula, Spinach, and Cress) exhibited a balanced dry matter partitioning between shoots and roots (Table 2). On the other hand, the ‘N-inefficient’ characterized genotypes (Parsley and Dill) exhibited a non-balanced dry matter partitioning between shoots and roots and therefore showed a higher root–shoot ratio than the ‘N-efficient’ characterized genotypes under a low N rate.

3.2. Total Leaf Number, Total Leaf Area, Photosynthetic Activity, and Leaf Chlorophyll Index (SPAD)

The total leaf number per plant (Figure 1A) and total leaf area (Figure 1B) of different vegetable species were significantly (p < 0.001) affected by genotype, the N rate, and genotype–N rate interactions. In contrast to shoot fresh and dry matter (Table 1 and Table 2), the total leaf number per plant was significantly higher under a high N rate than a low N rate, irrespective of vegetable species. The leaf number per plant varied among the genotypes between 25 and 12 LN plant−1 at a low N rate and 27 and 13 LN plant−1 at a high N rate. The highest leaf number per plant was shown by the ‘N-efficient’ genotype Cress, while the lowest leaf number per plant was shown by the ‘N-inefficient’ genotype Parsley at both N rates (Figure 1A). In contrast to the total leaf number per plant but similar to shoot fresh and dry matter (Table 1 and Table 2), the total leaf area was significantly higher under a low N rate than a high N rate, irrespective of vegetable species (Figure 1B).
Among the five vegetable species, the total leaf area varied between 550 and 164 cm2 plant−1 at a low N rate and 399 and 169 cm2 plant−1 at a high N rate. The significantly highest total leaf areas were shown by the ‘N-efficient’ genotypes Arugula, Cress, and Spinach under a low N rate, whereas Parsley and Dill, which are characterized as ‘N-efficient’ genotypes, showed the lowest total leaf area at the same N rate (Figure 1B). This result indicated that ‘N-efficient’ genotypes have larger-sized but a lower number of leaves than ‘N-inefficient’ genotypes, which are characterized by small-sized but high numbers of leaves at a low N rate. As a result of significant genotype–nitrogen interactions, Arugula and interestingly Dill showed a higher leaf area than Spinach and Cress, while the lowest total leaf area was shown by Parsley under a high N rate.
The photosynthetic activity of leaves of the different vegetable species was significantly (p < 0.001) affected by genotype, the N rate, and genotype–N rate interactions (Figure 1C). Similar to shoot fresh and dry weight (Table 1 and Table 2), the vegetable species exhibited a higher photosynthetic activity at a low N rate as compared to a high N rate. The photosynthesis among the species varied between 11.5 and 6.9 µmol m2 s−1 g plant−1 at a low N rate and 11.4 and 7.5 µmol m2 s−1 g plant−1 at a high N rate. The best performance in photosynthesis was shown by Spinach followed by Cress and Parsley under a low N rate, whereas Arugula and Dill showed the lowest photosynthesis at the same N rate. At a high N rate, Spinach showed again the significantly highest photosynthesis followed by Dill and Parsley, while Arugula and Cress showed the lowest photosynthetic activity at the same N rate. Although no significant difference was found between the two N rates in the leaf chlorophyll index (SPAD), some of the species (Arugula, Spinach, and Cress) tended to be higher at a low N rate than at a high N rate (Figure 1C). Therefore, genotypic variation and genotype–N rate interactions were highly significant in the SPAD. Among the species, the SPAD varied between 56.6 and 10.0 at a low N rate and 55.8 and 10.3 at a high N rate. The best performance in the SPAD was shown by Spinach followed by Arugula and Cress under a low N rate, whereas Parsley and Dill showed the lowest SPAD value at the same N rate.

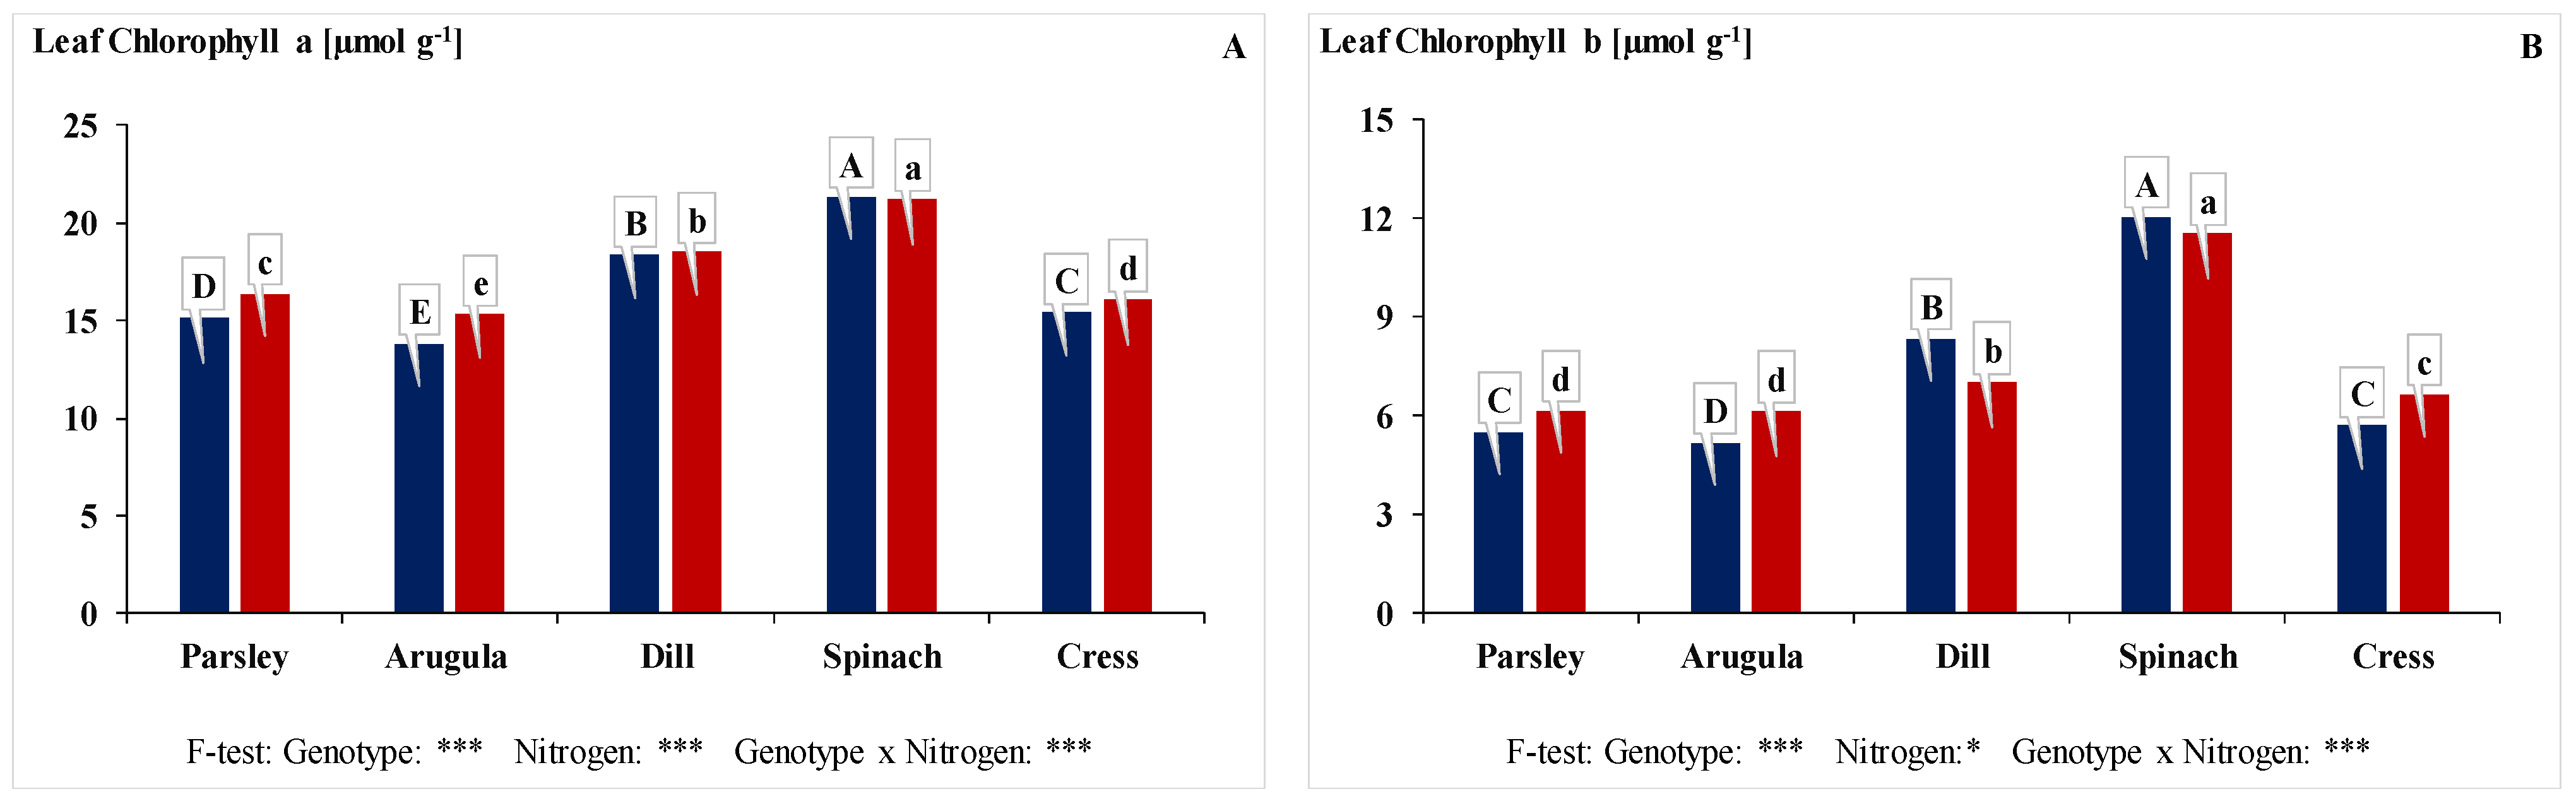
3.3. Leaf Chlorophyll (a + b) Content, Leaf Carotenoid Content, and Leaf Nitrate Reductase Enzyme Activity

The results demonstrated that the leaf total chlorophyll (a + b) content, leaf carotenoid content, and leaf nitrate reductase enzyme activity (NRA) of the different vegetable species were significantly (p < 0.001) affected by genotype, the N rate, and genotype–N rate interactions (Table 3). The examined vegetable species grown under a low N rate exhibited a consistently higher total chlorophyll (a + b) content and leaf carotenoid content compared to those grown under a high N rate. These results clearly explain why the photosynthetic activity of leaves (Figure 1C) was also significantly higher at a low N rate than a high N rate. Among the species, the total leaf chlorophyll (a + b) content varied between 32.77 and 21.46 µmol g−1 plant−1 at a low N rate and 33.38 and 19.00 µmol g−1 plant−1 at a high N rate.
The variation in total leaf carotenoid content was between 0.34 and 0.22 µmol g−1 plant−1 at a low N rate and 0.34 and 0.21 µmol g−1 plant−1 at a high N rate. The responses of the genotypes to both measured parameters were similar, and thus the highest total leaf chlorophyll (a + b) and carotenoid contents were shown by Spinach, Dill, and Parsley under a low N rate, whereas Cress and Arugula showed the lowest total leaf chlorophyll (a + b) and carotenoid contents at the same N rate. Almost similar genotypic rankings (Spinach > Dill > Cress > Parsley > Arugula) in total leaf chlorophyll (a + b) and leaf carotenoid contents (Spinach > Dill > Parsley > Cress > Arugula) were recorded under a high N rate among the vegetable species.
Interesting results were found regarding the NRA since the vegetable species grown under a low N rate exhibited highly significant enzyme activity compared to those grown at a high N rate. Among the species, the NRA varied between 3.27 and 0.25 µmol s−1 g−1 at a low N rate and 2.39 and 0.29 µmol s−1 g−1 at a high N rate. The highest performance in the NRA was shown by Parsley and Dill under a low N rate, whereas Arugula, Spinach, and Cress showed the lowest NRA at the same N rate. At a high N rate, again Parsley showed the significantly highest NRA followed by Spinach and Dill, while Arugula and Cress showed the lowest NRA activity at the same N rate.
Similar results were found when the leaf chlorophyll pigments of a and b were individually evaluated, and hence the chlorophyll a (Figure 2A) and chlorophyll b (Figure 2B) of different vegetable species were significantly (p < 0.001) affected by genotype, the N rate, and genotype–N rate interactions. The vegetable species grown under a low N rate exhibited consistently higher chlorophyll a and chlorophyll b as compared to those grown under a high N rate. However, irrespective of N rates and species, the content of chlorophyll a (17.16 µmol g−1 plant−1) was significantly higher than chlorophyll b (7.43 µmol g−1 plant−1) in the leaves. Among the vegetable species, Spinach exhibited the significantly highest chlorophyll a and chlorophyll b contents, whereas the lowest chlorophyll a and chlorophyll b contents were shown by Arugula at both low and high N rates.

3.4. Root Morphology

The root morphological results demonstrated that the root length, root volume, and average root diameter of different vegetable species were significantly (p < 0.001) affected by genotype, the N rate, and genotype–N rate interactions (Table 4). In contrast to shoot growth (Table 1 and Table 2), the vegetable species grown under a low N rate usually exhibited a lower root growth performance as compared to those grown under a high N rate (Table 4). However, three vegetable species, Arugula, Spinach, and Cress, which are characterized as ‘N-efficient’ genotypes due to exhibiting high shoot fresh (Table 1) and dry biomass (Table 2) production under a low N rate, also exhibited significantly higher root length compared to the ‘N-inefficient’ characterized genotypes Parsley and Dill under a low N rate (Table 4).
This is also true for the root volume of these three vegetable species (Arugula, Spinach, and Cress) treated under a low N rate. On the other hand, the vegetable species Arugula and Spinach maintained high root length and root volume at a high N rate, while Parsley and Dill also maintained the lowest root length and root volume among other species at the same N rate. Among the vegetable species, root length varied between 5840 and 1563 m plant−1 at a low N rate and 5990 and 1732 mg plant−1 at a high N rate. The variation in root volume among genotypes ranked between 1.65 and 0.68 cm3 plant−1 at a low N rate and 2.35 and 0.80 cm3 plant−1 at a high N rate. Similar to root length and root volume, the vegetable species grown under a low N rate usually exhibited significantly lower root diameters compared to a high N rate (Table 4).
However, some of the ‘N-efficient’ vegetable species (Arugula and Cress) exhibited significantly lower root diameters, whereas some of the ‘N-inefficient’ genotypes (Dill) exhibited significantly higher root diameters under both low and a high N-rate conditions (Table 4). This is a root morphological strategy of plants to adapt to adverse growth conditions. When plants produce longer roots, they are trying to decrease the root diameter and usually exhibit thinner roots in the growth medium. The opposite is also true; when plants produce shorter roots, they are trying to increase the root diameter and usually exhibit thicker roots. Among the two N-contrasting vegetable species, the average root diameter varied between 0.26 (‘N-inefficient’ Dill) and 0.20 ‘(N-efficient’ Arugula) mm at a low N rate and 0.26 (Dill) and 0.22 (Arugula) mm at a high N rate.

4. Discussion

The results indicate that some of the vegetable species have a great capability for NUE under stress conditions. Particularly, three vegetable species, Arugula, Spinach, and Cress, can be characterized as ‘N-efficient’ genotypes due to realizing an above-average yield in shoot dry biomass (Table 2) under suboptimal (low) N supply [19]. Based on this reference, the lowest shoot dry biomass yielding vegetable genotypes Parsley and Dill can be characterized as ‘N inefficient’. Additionally, the response to a high supplied N rate was highly significant (p < 0.001) among genotypes in shoot dry matter production (Table 2). At this N rate, the vegetable species Arugula and Spinach maintained high shoot dry matter production at a high N rate, while Parsley and Dill maintained the lowest shoot dry matter production among the other species at the same N rate. Based on these results, the Arugula and Spinach genotypes can be characterized as ‘N responsive’ due to realizing an above-average yield (shoot dry biomass) under a high N supply [20]. On the other hand, the low shoot biomass yielding vegetable genotypes (Parsley and Dill) can be characterized as ‘N irresponsive’. Our results are in agreement with several field and nutrient solution studies [2,18,26,27,28] that demonstrated wide genotypic differences in NUE among different crop species.
Nitrogen uptake is regulated by the demand of the growing crop if the N supply is not limited [29]. In contrast, if the required N is limited in the soil, the N uptake depends on the extent and effectiveness of the root system [30]. However, without continuous assimilate allocation from the active leaves, root growth and thus N uptake activity cannot be maintained under low N conditions [18,26]. Net root growth is the difference between root formation and root mortality. Several factors, e.g., assimilate allocation from the aboveground fractions [13,29] and nutrient availability in the rhizosphere [24,30], determine the net root production. In response to limiting mineral elements, plants can allocate a greater proportion of their biomass to the root system [6]. Morphological and physiological root characteristics such as inflow rate, maximum rooting depth, root radius, root length, and root length density at deeper soil layers might play a primary role in N uptake efficiency [20].
Regarding our results, the ‘N-efficient’ characterized genotypes (Arugula, Spinach, and Cress), which produced the highest shoot fresh (Table 1) and shoot dry biomass (Table 2), also exhibited a higher root dry matter production as compared to the ‘N-inefficient’ genotypes Parsley and Dill under a low N rate. In biomass partitioning, the ‘N-inefficient’ genotype Parsley had the highest root–shoot ratio, while the lowest ratio was shown by the ‘N-efficient’ genotype Spinach at a low N rate. This might be due to a higher partitioning of dry matter to the root system under a low N condition [31]. Furthermore, an increased carbohydrate sink, the strength of the roots under N deficiency usually leads to a greater allocation of photoassimilates to the roots [32]. On the other hand, the highest root–shoot ratio was shown by the ‘N-efficient’ genotype Cress, while the lowest ratio was shown by the ‘N-efficient’ genotype Spinach at a high N rate.
All these results indicated that the ‘N-efficient’ characterized genotypes (Arugula, Spinach, and Cress) exhibited a balanced dry matter partitioning between shoots and roots (Table 2). On the other hand, the ‘N-inefficient’ characterized genotypes (Parsley and Dill) exhibited a non-balanced dry matter partitioning between shoots and roots and therefore showed a higher root–shoot ratio than the ‘N-efficient’ characterized genotypes under a low N rate.
The biomass production and yield of a crop are strongly dependent on its leaf area as well as the rate of leaf photosynthesis [33]. Further, carbon and nitrogen (N) metabolisms are also interrelated for the sustained growth and development of plants [34]. Moreover, an increased root capacity also depends on the ATP supply generated by the respiration of reduced carbon molecules. The deficiency of N leads to a low output of photosynthetic activity in plants, which has been indicated by several physio-biochemical studies [2,7].
Leaf area is assessed as the one-sided green leaf area per unit of ground area in broadleaf canopies, i.e., the leaf area index (LAI) [35]. As a rule, enhancement in crop yield occurs when an optimal LAI value is reached, which depends on plant species, light intensity, leaf shape, and leaf angle [36]. Regarding our results on the number of leaves (Figure 1A) and the total leaf area (Figure 1B), the ‘N-efficient’ genotypes Arugula, Cress, and Spinach have significantly larger-sized but lower-numbered leaves than the ‘N-inefficient’ genotypes Parsley and Dill, which are characterized by the significantly smallest-sized but highest-numbered leaves at a low N rate.
The chlorophyll concentration in the leaf is essential for crop growth and development [9], so measuring it provides vital information about the effects of environment on plant growth [37]. Although no significant difference was found between the two N rates in the leaf chlorophyll index (SPAD), some of the species (Arugula, Spinach, and Cress) tended to be higher at a low N rate than at a high N rate (Figure 1C). The vegetable species grown under a low N rate might have exhibited a consistently higher chlorophyll (a + b) content and leaf carotenoid content compared to those under a high N rate. These results explain why the photosynthetic activity of leaves (Figure 1C) was also significantly higher at a low N rate than a high N rate. Carotenoids, on the other hand, contribute to light harvesting, while they prevent photo damage to photosynthetic systems [38] through their interconversion with xanthophyll molecules [14].
Our study coincides with the study of Chen et al. [39] in that leaf chlorophyll and carotenoid content are dependent on the presence and ratio of mineral elements (especially nitrogen) in the substrate. The exclusive publications of Singh et al. [9,38,40] indicate that the SPAD and photosynthetic activity of a plant are not only limited to the N rate but that several other factors like temperature and light intensity are involved for a better build-up of plant mechanisms, under which their capability of utilizing more NUE is increased even under stressed N rates.
Our study indicates that these salad leafy vegetables can have more NUE under low-stress conditions. The enzyme nitrate reductase (NR) activity determination is one of the measures of N utilization efficiency in crops. Its activity in plants gives a good estimate of the plant’s N status and is usually correlated with growth and yield [14]. When plants take up nitrogen in the form of nitrates (NO3), it is reduced to nitrite (NO2) by nitrate reductase (NR) in the leaf cytosol [13]. Nitrite translocated into the chloroplasts is converted to an ammonium ion (NH4+) by nitrite reductase (NIR) located in the chloroplasts, and then the NH4+ ion is assimilated into amino acids [13]. High NR activity in a plant implies that the plant has a greater ability to convert absorbed NO3 to usable forms. Interesting results were found in the NRA in our present study, since the vegetable species grown under a low N rate exhibited highly significant enzyme activity compared to those grown at a high N rate (Table 3). The highest performance in the NRA was shown by the ‘N-inefficient’ genotypes Parsley and Dill under a low N rate, whereas the ‘N-efficient’ genotypes Arugula, Spinach, and Cress showed the lowest NRA at the same N rate. This might be due to a high leaf area formation, which usually leads to a reduction in the amount of N per unit of leaf area [35]. Also, corroborative results were demonstrated in the study of [18], who reported that the low-yielding ‘N-inefficient’ genotypes showed substantially higher shoot N concentration than the high-yielding ‘N-efficient’ genotypes (Table 1).

5. Conclusions

This hydroponic study indicated that shoot growth, root morphological responses, and leaf physiological responses were significantly (p < 0.001) affected by genotype, the N rate, and genotype–N rate interactions. The shoot growth of some vegetable species (Arugula, Spinach, and Cress) was significantly higher under a low N than a high N rate, demonstrating that they have a great capability for NUE under low-N stress conditions. Similar responses were also recorded for the root growth of the ‘N-efficient’ species under a low N rate. The NUE of these species was closely associated with photosynthetic activity, leaf pigments (total chlorophyll, chlorophyll a, chlorophyll b, and total carotenoids), leaf area, and root morphology (length, volume, and average diameter). These physio-morphological plant traits could be useful characteristics for the selection and breeding of ‘N-efficient’ leafy vegetable species for sustainable agriculture in the future. However, further investigation should be carried out at the field level to confirm their commercial production.

Author Contributions

Conceptualization, F.U. and A.U.; methodology, A.U.; software, Y.C.Y.; validation, F.U., A.U. and Y.C.Y.; formal analysis, Y.C.Y.; investigation, A.U.; resources, A.U.; data curation, Y.C.Y.; writing—original draft preparation, F.U.; writing—review and editing, F.U.; visualization, A.U.; supervision, F.U.; project administration, A.U. All authors have read and agreed to the published version of the manuscript.

Funding

This research received no external funding.

Data Availability Statement

The data presented in this study are available on request from the corresponding author. The data are not publicly available due to privacy or ethical restrictions.

Acknowledgments

The authors thank all staff members of the Plant Nutritional Physiology Laboratory of Erciyes University (ERU PNPLab), Türkiye, for technical support and for providing all the necessary facilities throughout the experiments. We would like to thank the Proofreading & Editing Office of the Dean for Research at Erciyes University for copyediting and proofreading service for this manuscript.

Conflicts of Interest

The authors declare that they have no conflicts of interest.

References

  1. Zeifman, L.; Hertog, S.; Kantorova, V.; Wilmoth, J. A World of 8 Billion. 5 August 2023. Available online: https://www.un.org/development/desa/pd/sites/www.un.org.development.desa.pd/files/undesa_pd_2022_pb_140.pdf (accessed on 12 July 2024).
  2. Adam, M.B.; Ulas, A. Vigorous rootstocks improve nitrogen efficiency of tomato by inducing morphological, physiological and biochemical responses. Gesunde Pflanz. 2023, 75, 565–575. [Google Scholar] [CrossRef]
  3. Liu, C.W.; Sung, Y.; Chen, B.C.; Lai, H.Y. Effects of nitrogen fertilizers on the growth and nitrate content of lettuce (Lactuca sativa L.). Int. J. Environ. Res. Public Health 2014, 11, 4427–4440. [Google Scholar] [CrossRef] [PubMed]
  4. Grindlay, D.J.C. Towards an explanation of crop nitrogen demand based on the optimization of leaf nitrogen per unit leaf area. J. Agric. Sci. 1997, 128, 377–396. [Google Scholar] [CrossRef]
  5. Brégard, A.; Bélanger, G.; Michaud, R. Nitrogen use efficiency and morphological characteristics of timothy populations selected for low and high forage nitrogen concentrations. Crop Sci. 2000, 40, 422–429. [Google Scholar] [CrossRef]
  6. Schroder, J.L.; Zhang, H.; Girma, K.; Raun, W.R.; Penn, C.J.; Payton, M.E. Soil acidification from long-term use of nitrogen fertilizers on winter wheat. Soil Sci. Soc. Am. J. 2011, 75, 957–964. [Google Scholar] [CrossRef]
  7. Slavin, J.L.; Lloyd, B. Health benefits of fruits and vegetables. Adv. Nutr. 2012, 3, 506–516. [Google Scholar] [CrossRef] [PubMed]
  8. Gupta, N.; Gupta, A.K.; Gaur, V.S.; Kumar, A. Relationship of nitrogen use efficiency with the activities of enzymes involved in nitrogen uptake and assimilation of finger millet genotypes grown under different nitrogen inputs. Sci. World J. 2012, 2012, 625731. [Google Scholar] [CrossRef] [PubMed]
  9. Singh, M.; Khan, M.M.A.; Naeem, M. Effect of nitrogen on growth, nutrient assimilation, essential oil content, yield and quality attributes in Zingiber officinale Rosc. J. Saudi Soc. Agric. Sci. 2016, 15, 171–178. [Google Scholar] [CrossRef]
  10. Raun, W.R.; Johnson, G.V. Improving nitrogen use efficiency for cereal production. Agron. J. 1999, 91, 357–363. [Google Scholar] [CrossRef]
  11. Byrnes, B.H.; Bumb, B.L. Population growth, food production and nutrient requirements. J. Crop Prod. 1998, 1, 1–27. [Google Scholar] [CrossRef]
  12. Laegreid, M.; Bockman, O.C.; Kaarstad, O. Agriculture, Fertilisers and the Environment; CABI Publishing: Wallingford, UK, 1999; p. 294. [Google Scholar]
  13. Watanabe, N.S.; Yamasaki, H. Dynamics of Nitrite Content in Fresh Spinach Leaves: Evidence for Nitrite Formation Caused by Microbial Nitrate Reductase Activity. J. Nutr. Food Sci. 2016, 7, 572. [Google Scholar] [CrossRef]
  14. Yamasaki, H.; Watanabe, N.S.; Fukuto, J.; Cohen, M.F. Nitrite-Dependent Nitric Oxide Production Pathway: Diversity of NO Production Systems. In Studies on Pediatric Disorders; Oxidative Stress in Applied Basic Research and Clinical Practice; Tsukahara, H., Kaneko, K., Eds.; Springer: New York, NY, USA, 2014. [Google Scholar]
  15. Schroeder, J.I.; Delhaize, E.; Frommer, W.B.; Guerinot, M.L.; Harrison, M.J.; Herrera-Estrella, L.; Horie, T.; Kochian, L.V.; Munns, R.; Nishizawa, N.K.; et al. Using membrane transporters to improve crops for sustainable food production. Nature 2013, 497, 60–66. [Google Scholar] [CrossRef] [PubMed]
  16. Hanif, M.N. Factors affecting nitrogen use efficiency (NUE): Meta-analysis. Turk. J. Agric. Res. 2023, 10, 231–242. [Google Scholar] [CrossRef]
  17. Hoffer, G.N. Some differences in the functioning of selfed lines of corn under varying nutritional conditions. Agron. J. 1926, 18, 322–334. [Google Scholar] [CrossRef]
  18. Ulas, A.; Doganci, E.; Ulas, F.; Yetisir, H. Root-growth characteristics contributing to genotypic variation in nitrogen efficiency of bottle gourd and rootstock potential for watermelon. Plants 2019, 8, 77. [Google Scholar] [CrossRef]
  19. Graham, R.D. Breeding characteristics in cereals. Adv. Plant Nutr. 1984, 1, 57–102. [Google Scholar]
  20. Sattelmacher, B.; Horst, W.J.; Becker, H.C. Factors that contribute to genetic variation for nutrient efficiency of crop plants. Z. Pflanzenernährung Bodenkd. 1994, 157, 215–224. [Google Scholar] [CrossRef]
  21. Tennessen, D.J.; Singsaas, E.L.; Sharkey, T.D. Light-emitting diodes as a light source of photosynthesis research. Photosynth. Res. 1994, 39, 85–92. [Google Scholar] [CrossRef]
  22. Lichtenthaler, H.K. Chlorophylls and carotenoids: Pigments of photosynthetic biomembranes. Methods Enzymol. 1987, 148, 350–382. [Google Scholar]
  23. Harley, S. Use of a simple colorimetric assay to determine conditions for induction of nitrate reductase in plants. Am. Biol. Teach. 1993, 55, 161–164. [Google Scholar] [CrossRef]
  24. Goltsev, V.N.; Kalaji, H.M.; Paunov, M.; Bąba, W.; Horaczek, T.; Mojski, J.; Kociel, H.; Allakhverdiev, S.I. Variable chlorophyll fluorescence and its use for assessing physiological condition of plant photosynthetic apparatus. Russ. J. Plant Physiol. 2016, 63, 869–893. [Google Scholar] [CrossRef]
  25. SAS Institute Inc. Base SASVR 9.4 Procedures Guide: Stat. Procedures, 2nd ed.; SAS Institute, Inc.: Cary, NC, USA, 2013. [Google Scholar]
  26. Ulas, A.; Erley, G.S.A.; Kamh, M.; Wiesler, F.; Horst, W.J. Root-growth characteristics 448 contributing to genotypic variation in nitrogen efficiency of oilseed rape. J. Plant Nutr. Soil Sci. 2012, 175, 489–498. [Google Scholar] [CrossRef]
  27. Ulas, F.; Erdogdu, S.; Yetisir, H.; Ulas, A. Investigation on morphology and physiology of Nitrogen efficiency in different pepper (Capsicum annuum L.) inbred lines. Genetika 2021, 53, 3. [Google Scholar] [CrossRef]
  28. Ulas, F.; Yetisir, H.; Ulas, A. Root-growth characteristics contributing to nitrogen efficiency of reciprocally grafted potatoes (Solanum tuberosum L.) under Hydroponic conditions. Gesunde Pflanz. 2021, 73, 417–425. [Google Scholar] [CrossRef]
  29. Clarkson, D.T. Factors affecting mineral nutrient acquisition by plants. Annu. Rev. Plant Physiol. 1985, 36, 77–115. [Google Scholar] [CrossRef]
  30. Jackson, W.A.; Pan, W.L.; Moll, R.H.; Kamprath, E.J. Uptake, translocation, and reduction of nitrate. Biochem. Basis Plant Breed. 1986, 2, 73–108. [Google Scholar]
  31. Lewin, S.A.; Mooney, H.A.; Field, C. The dependence of plant root: Shoot ratios on internal nitrogen concentration. Ann. Bot. 1989, 64, 71–75. [Google Scholar]
  32. Merrill, S.D.; Tanaka, D.L.; Hanson, J.D. Root length growth of eight crop species in haplustoll soils. Soil Sci. Soc. Am. J. 2002, 66, 913–923. [Google Scholar] [CrossRef]
  33. Hirasawa, T.; Hsiao, T.C. Some characteristics of reduced leaf photosynthesis at midday in maize growing in the field. Field Crops Res. 1999, 62, 53–62. [Google Scholar] [CrossRef]
  34. Zheng, Z.L. Carbon and nitrogen nutrient balance signaling in plants. J. Plant Signal Behav. 2009, 4, 584–591. [Google Scholar] [CrossRef]
  35. Mae, T. Physiological nitrogen efficiency in rice: Nitrogen utilization, photosynthesis and yield potential. Plant Soil 1997, 196, 201–210. [Google Scholar] [CrossRef]
  36. Marschner, H. Mineral Nutrition of Higher Plants, 2nd ed.; Academic Press: London, UK, 1995. [Google Scholar]
  37. de González, M.T.N.; Osburn, W.N.; Hardin, M.D.; Longnecker, M.; Garg, H.K. A Survey of nitrate and nitrite concentrations in conventional and organic-labeled raw vegetables at retail. J. Food Sci. 2015, 80, 942–949. [Google Scholar] [CrossRef]
  38. Ndukwe, O.K.; Edeoga, H.O.; Okwulehie, I.C.; Omosun, G. Variability in the chlorophyll and carotene composition of ten maize (Zea mays) varieties. Eur. J. Phys. Agric. Sci. 2016, 4, 1–6. [Google Scholar]
  39. Chen, T.W.; Kahlen, K.; Stützel, H. Disentangling the contributions of osmotic and ionic effects of salinity on stomatal, mesophyll, biochemical and light limitations to photosynthesis. Plant Cell Environ. 2015, 38, 1528–1542. [Google Scholar] [CrossRef]
  40. Hristov, A.; Bannink, A.; Crompton, L.; Huhtanen, P.; Kreuzer, M.; McGee, M.; Nozière, P.; Reynolds, C.; Bayat, A.; Yáñez-Ruiz, D.; et al. Invited review: Nitrogen in ruminant nutrition: A review of measurement techniques. J. Dairy Sci. 2019, 102, 5811–5852. [Google Scholar] [CrossRef]
Figure 1. Total leaf number (A), total leaf area (B), the intensity of net photosynthesis measurement (C), and SPAD (leaf chlorophyll index) (D) of edible leafy vegetable genotypes Parsley, Arugula, Dill, Spinach, and Cress grown under low (0.3 mM, light red bars) and high (3.0 mM, dark blue bars) N supply. Values denoted by different letters (lower- and upper-case letters for low and high N supply, respectively) are significantly different between genotypes within columns at p < 0.05. n.s., non-significant. *** p < 0.001.
Horticulturae 10 00984 g001
Figure 2. Leaf chlorophyll a (A) and chlorophyll b (B) of edible leafy vegetable genotypes Parsley, Arugula, Dill, Spinach, and Cress grown under low (0.3 mM, light red bars) and high (3.0 mM, dark blue bars) N rates. Values denoted by different letters (lower- and upper-case letters for low and high N supply, respectively) are significantly different between genotypes within columns at p < 0.05. * p < 0.05 and *** p < 0.001.
Horticulturae 10 00984 g002
Table 1. Shoot and root fresh weight and main stem length of edible leafy vegetable genotypes Parsley, Arugula, Dill, Spinach, and Cress grown under low (0.3 mM) and high (3.0 mM) N rates.
Shoot Fresh Weight
[g Plant−1]
Root Fresh Weight
[g Plant−1]
Plant Height
[cm Plant−1]
GenotypesLow NHigh NLow NHigh NLow NHigh N
Parsley4.10 d4.93 D2.34 e2.84 D13 c14 BC
Arugula19.10 a15.10 A5.57 a4.71 A15 b14 B
Dill7.50 c9.00 B3.14 d4.28 B19 a20 A
Spinach11.09 b8.70 B3.31 c3.65 C13 c12 CD
Cress11.11 b7.30 C3.38 b2.87 D13 c12 D
F-test
Genotype*********
Nitrogen******n.s.
Genotype × Nitrogen******n.s.
Values denoted by different letters (lower- and upper-case letters for a low and a high N rate, respectively) are significantly different between genotypes within columns at p < 0.05. n.s., non-significant. *** p < 0.001.
Table 2. Shoot and root dry weight and root–shoot ratio of edible leafy vegetable genotypes Parsley, Arugula, Dill, Spinach, and Cress grown under low (0.3 mM) and high (3.0 mM) N rates.
Shoot Dry Weight
[g Plant−1]
Root Dry Weight
[g Plant−1]
Root–Shoot Ratio
[g g−1]
GenotypesLow NHigh NLow NHigh NLow NHigh N
Parsley0.42 c0.50 C0.09 d0.10 C0.21 a0.20 AB
Arugula1.60 a1.26 A0.25 a0.24 A0.16 c0.19 BC
Dill0.60 c0.67 BC0.11 d0.13 BC0.18 bc0.19 BC
Spinach1.10 b0.90 B0.15 c0.17 B0.13 d0.18 C
Cress1.00 b0.70 BC0.19 b0.17 B0.20 ab0.24 A
F-test
Genotype********
Nitrogen***n.s.**
Genotype × Nitrogen***n.s.n.s.
Values denoted by different letters (lower- and upper-case letters for a low and a high N rate, respectively) are significantly different between genotypes within columns at p < 0.05. n.s., non-significant. ** p < 0.01 and *** p < 0.001.
Table 3. Total leaf number, total leaf area, and photosynthesis of edible leafy vegetable genotypes Parsley, Arugula, Dill, Spinach and Cress grown under low (0.3 mM) and high (3.0 mM) N rates.
Total Leaf Chlorophyll
(a + b) [µmol g−1]
Total Leaf Carotenoids [µmol g−1]Leaf Nitrate Reductase
Enzyme Activity
[µmol s−1 g−1]
GenotypesLow NHigh NLow NHigh NLow NHigh N
Parsley22.53 c20.66 D3.47 c3.38 C3.274 a 2.385 A
Arugula21.46 d19.00 E2.78 d2.62 E0.459 c0.370 D
Dill25.54 b26.69 B3.85 b3.51 B2.257 b0.627 C
Spinach32.77 a33.38 A4.15 a4.27 A0.433 d0.771 B
Cress22.73 c21.11 C2.76 d2.66 D0.250 e0.285 E
F test
Genotype*********
Nitrogen*******
Genotype × Nitrogen*********
Values denoted by different letters (lower- and upper-case letters for a low and a high N rate, respectively) are significantly different between genotypes within columns at p < 0.05. * p < 0.05 and *** p < 0.001.
Table 4. Total root length, root volume, and average root diameter of edible leafy vegetable genotypes Parsley, Arugula, Dill, Spinach, and Cress grown under a low (0.3 mM) and a high (3.0 mM) N rate.
Total Root Length
[cm Plant−1]
Total Root Volume
[cm3 Plant−1]
Av. Root Diameter
[mm Plant−1]
GenotypesLow NHigh NLow NHigh NLow NHigh N
Parsley1563 e1732 E0.683 e0.797 E0.237 c0.244 C
Arugula5840 a5990 A1.867 a2.353 A0.203 d0.216 E
Dill1952 d2959 C0.982 d1.514 C0.264 a0.264 A
Spinach2052 c2585 D1.462 c1.558 B0.251 b0.256 B
Cress3717 b3544 B1.665 b1.432 D0.236 c0.227 D
F test
Genotype*********
Nitrogen********
Genotype × Nitrogen*********
Values denoted by different letters (lower- and upper-case letters for a low and a high N rate, respectively) are significantly different between genotypes within columns at p < 0.05. ** p < 0.01, and *** p < 0.001.
Disclaimer/Publisher’s Note: The statements, opinions and data contained in all publications are solely those of the individual author(s) and contributor(s) and not of MDPI and/or the editor(s). MDPI and/or the editor(s) disclaim responsibility for any injury to people or property resulting from any ideas, methods, instructions or products referred to in the content.

