1. Introduction
Berry crops are increasingly being harvested mechanically in response to labor shortages, to reduce harvest costs per volume of fruit, and to increase overall production efficiency [
1]. For example, it is estimated that about half of the fresh-market [
1] and 80% of the processing crop in the state of Georgia is harvested by machine. Research on mechanical blueberry harvesting has focused primarily on harvester design [
2,
3], reduction of ground losses (berries that drop on the soil during the harvest process) [
4,
5], maintenance of fruit quality [
2,
6,
7,
8], and economic aspects of machine-harvest [
9]. A few studies investigated food safety considerations associated with mechanical harvesting of blueberry [
8,
10], concluding that machine-harvest does not increase the risk of fruit contamination with microbes of food safety concern. However, a recent survey of mechanical blueberry harvesters reported high populations of general environmental microbes (such as total aerobic bacteria and total yeasts and molds) on harvester surfaces in the field [
10], especially on horizontal surfaces or those located at the bottom of the harvester. Whereas these organisms are not necessarily a food safety concern, these findings are indicative of the need for research on best practices for cleaning and sanitization of mechanical harvesters.
In addition to knowing which harvester surfaces tend to accumulate more microbes in the field, growers also need guidance on which surfaces have physical characteristics that may make them more difficult to clean, adequate rinsing times, which cleaning agents are most effective, and the contact times needed for sanitizers to inactivate microbes on cleaned surfaces. Plant or soil material that adheres to the surface of machinery and equipment must be removed to ensure hygienic conditions for production [
11] and to improve the efficacy of surface sanitization practices. In the mechanical harvesting of blueberry, of particular concern is soiling due to leaky or pressed fruit, which becomes sticky due to their high sugar content allowing soil particles or plant residue (such as leaves or bark pieces) to adhere to harvester surfaces. Currently, there is no common standard for cleaning and sanitization of blueberry harvesters in terms of frequency and methodology, and the challenges associated with the cleaning and sanitation of different harvester surfaces have not been determined experimentally.
Various methods have been applied to assess the cleanability of a surface. Mock soils (also referred to as a model or standard soils) are commonly used to determine surface cleanability in a reproducible manner. Such artificial soils are tailored to a specific application, and they may contain a single component or several components to mimic natural soils that appear on surfaces in a specific environment [
12]. One food industry cleanability study showed that the relative cleanliness of a stainless-steel surface soiled with a protein film and rinsed with water could be quantified over time by taking photographic images and using image analysis to determine residue removal [
11]. This study also focused on the effects of various application parameters, such as rinsing or soaking time, and the use of a detergent versus none. The authors also assessed the surface roughness of their stainless-steel surfaces that had been either mechanically polished or electropolished by applying a surface texture profiling method [
11]. Physical surface characteristics such as surface roughness may provide a mechanistic basis for explaining observed differences in surface cleanability.
Cleaning and sanitization is a two-step process with the cleaning step of removing organic matter and residue being critical, given that soil can dramatically reduce the effectiveness of sanitizers or inactivate them completely [
13]. In sanitization studies, it is good practice to select microorganisms for testing that have been isolated from the environment or surface of interest. In a recent blueberry packing line sanitization study, bacterial isolates from packing lines were selected for use in a sanitizer treatment study, and the rate of accumulation of these isolates was assessed on coupons made from various packing line surface materials [
14]. Surface coupons were immersed in trays containing suspensions of a mixture of isolates, rinsed, and then submersed in sanitizing solution [
14]. After a contact time of 1 min, coupons were placed in neutralizing broth, after which they were dried to determine the population densities of surviving bacteria by dilution-plating [
15].
Although hundreds of sanitizer products are available on the market, there are few key active ingredients that are commonly used for sanitization of food contact surfaces, including sodium hypochlorite, peroxyacetic acid, chlorine dioxide, hydrogen peroxide, and ozonated water [
16]. These products have different strengths and weaknesses. Sodium hypochlorite and peroxyacetic acid are corrosive to surfaces [
17]. Hydrogen peroxide can be relatively ineffective [
18], whereas ozonated water has raised concerns regarding worker health [
19,
20,
21]. Appropriate ranges for two commonly used sanitizers, sodium hypochlorite, and peroxyacetic acid, are in the range of 50 to 200 ppm and 40 to 80 ppm, respectively (EPA registration 5813-111; EPA registration 70299-19).
The overall aim of this study was to determine the cleanability of common fruit contact surfaces on blueberry mechanical harvesters and to evaluate a range of sanitization protocols. To accomplish this goal, we first characterized the basic physical properties of these surfaces, including their roughness and hydrophobicity. We next assessed the relative cleanability of harvester surfaces in model experiments involving mock soil applied to surface coupons in the laboratory and by rinsing for various periods of time with or without cleaning agents. Finally, a range of surface sanitization protocols was evaluated for efficacy in eliminating microbes previously isolated from commercial blueberry harvester surfaces.
2. Materials and Methods
2.1. Harvester Surface Selection and Preparation
Six materials commonly used on blueberry mechanical harvesters that come into direct contact with the fruit during the harvesting process were selected [
10] (
Table 1). These surfaces include a range of plastics and metals varying in finish and physicochemical properties that may affect their cleanability. All materials were obtained new from the vendor, except for the berry lugs which were in use in a commercial packinghouse in southern Georgia.
Harvester surface samples were cut into 2 cm × 5 cm coupons. The polyethylene shaking rod coating was cut using a DeWalt DW872 heavy-duty benchtop saw (Stanley Black & Decker, Jackson, TN, USA) with a 20 cm blade. The aluminum side wall, the extruded polycarbonate catcher plate, the acetal plastic conveyor bucket, and the high-density polyethylene lug were cut with a DeWalt 20 V variable-speed die grinder fitted with an 11 cm carborundum cutoff disc. The stainless-steel conveyor buckets were cut using a Dremel Saw-Max tool with a 3.8 cm EZ Lock metal cut-off rotary wheel (Dremel Manufacturing Co., Racine, WI, USA). Surface coupons were reused among experiments; prior to each use, they were cleaned with Sparkleen powdered detergent (0.5% solution; Thermo Fisher Scientific, Pittsburgh, PA, USA), rinsed three times with distilled water, blotted dry with a Kimwipe (Kimberly Clark, Roswell, GA, USA), and dried in an incubator at 42 °C for 30 min before testing. For the sanitization assay, the coupons were subjected to an additional decontamination step by soaking for 10 min in a 20% sodium hypochlorite solution before three rinses with sterile distilled water [
14,
22].
2.2. Physical Surface Characterization
Optical surface profilometry and drop shape analysis were applied to determine surface roughness and hydrophobicity, respectively, of the six surface materials. Both tests were conducted by the University of Florida Nanoscale Research Facility, Gainesville, FL. Using a Bruker Contour GT-I optical profilometer (Bruker, Billerica, MA, USA), two 156 µm × 117 µm areas on each of three coupons per surface were scanned utilizing a white light source with a 20× objective with a 2× field of view multiplier. Based on these measurements, surface roughness (Sa) and root mean square roughness (Sq) were determined by image analysis using Bruker Vision64 Operation and Analysis Software.
Static drop shape analysis was conducted using a Ramé-Hart NRLCA goniometer (Model 100-00 with U1 camera upgrade; Ramé-Hart Instrument Co., Succasunna, NJ, USA). Three separate 4-µL drops were placed on the flattest of each of the surface coupons, and each drop was measured ten times using a frame average of 10 and a time interval of 0.001 s. Contact angles of each drop with each surface were determined using the contact angle tool in Drop Image Advanced v3.19.02.1 employing the circle method. Contact angles >90° indicated hydrophobic properties, whereas angles <90° were characteristic of hydrophilic surfaces.
2.3. Cleanability of Surfaces with Water in Relation to Rinse Time
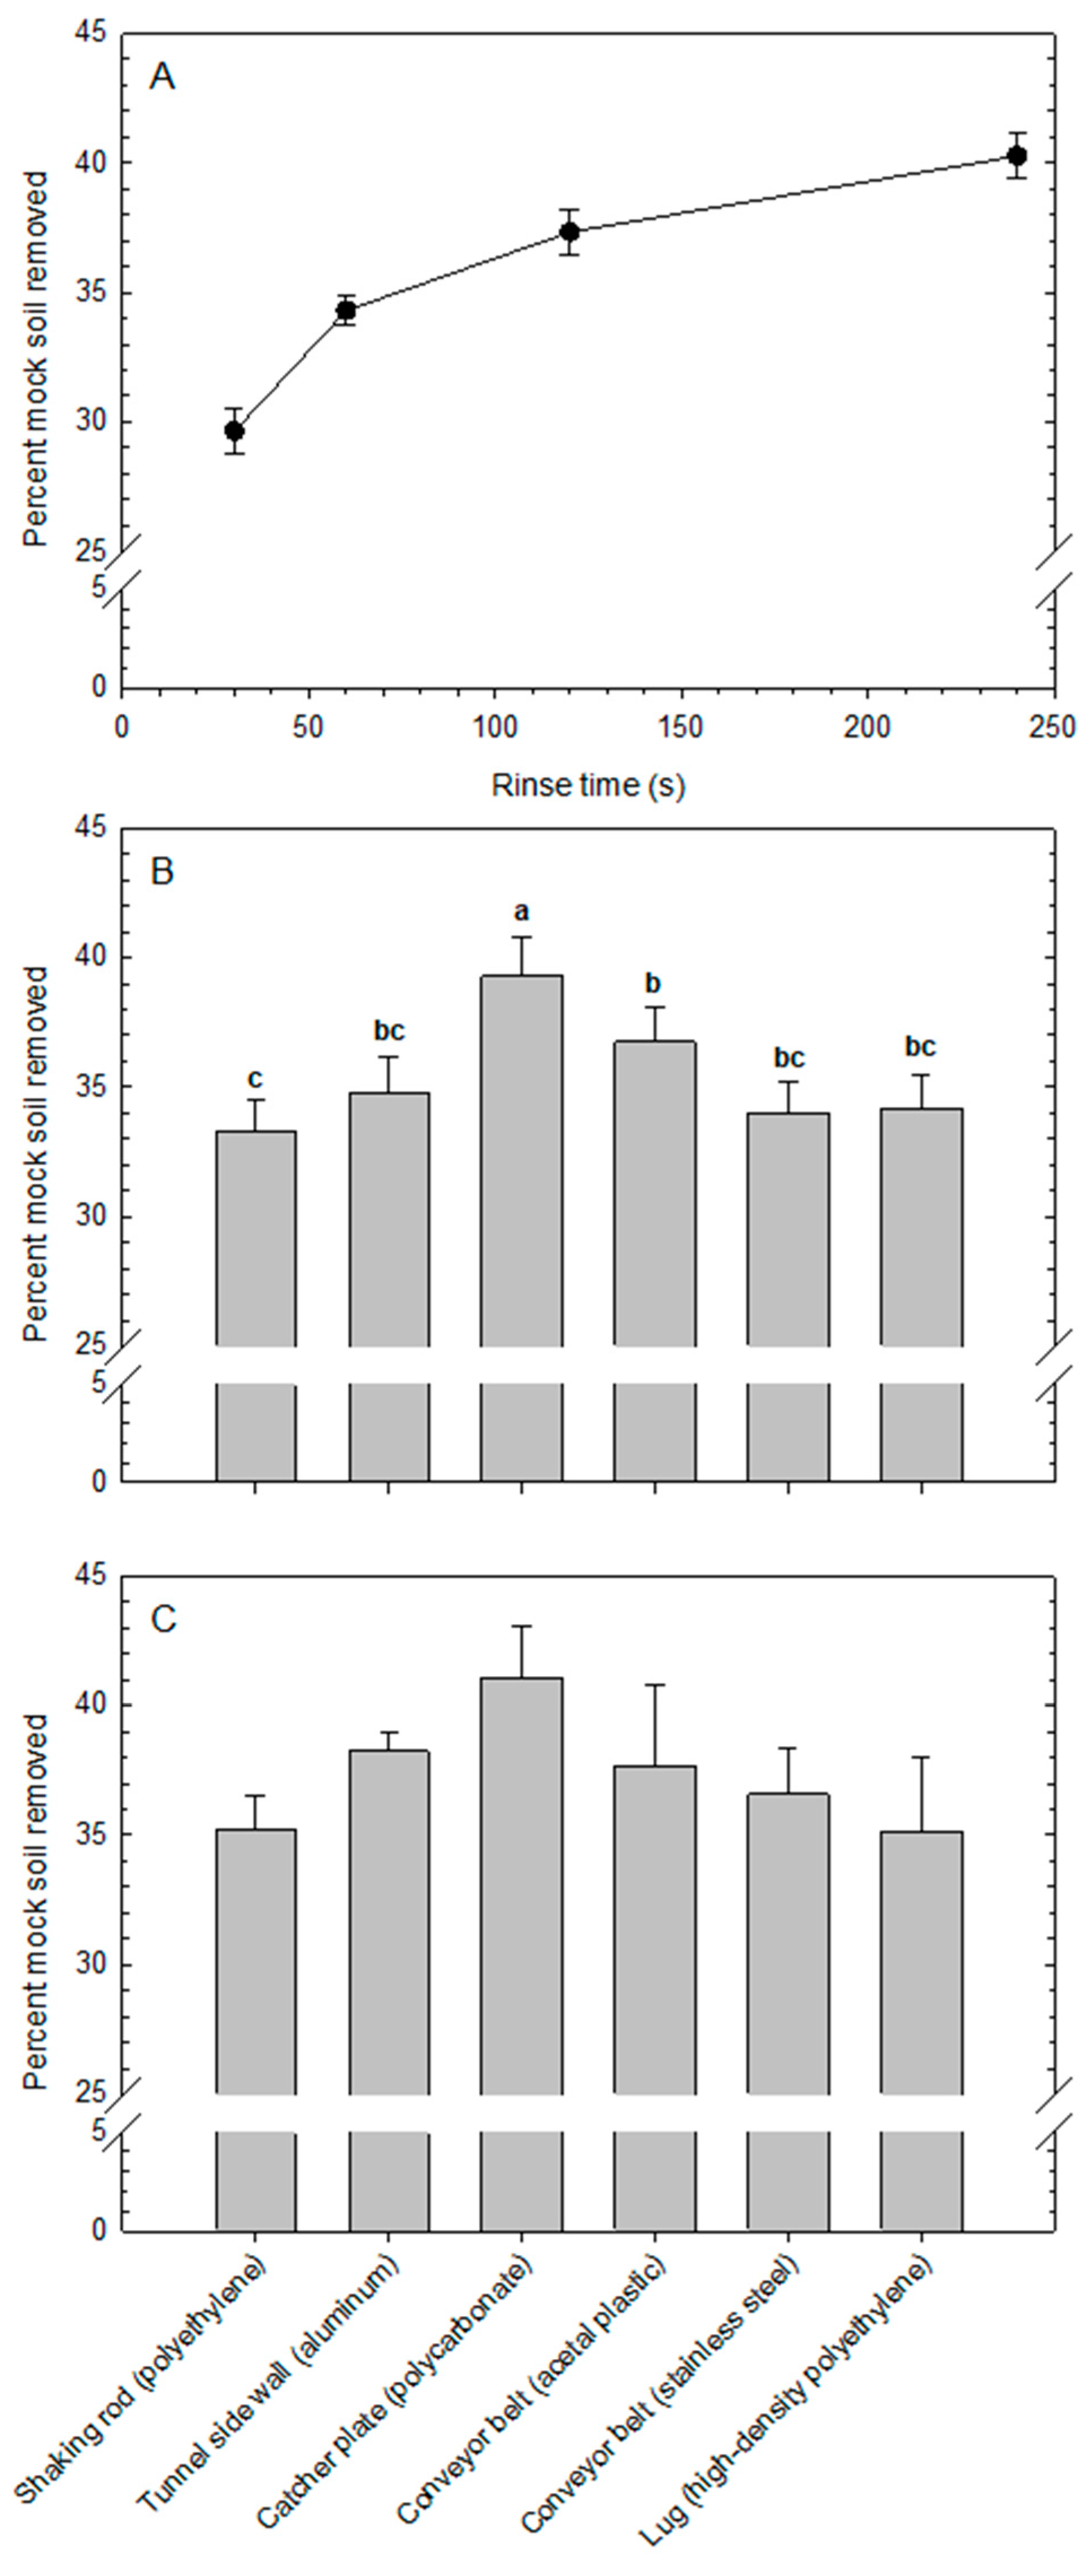
An estimate of relative cleanability of each surface was obtained in laboratory experiments by soiling surface coupons with mock soil (blueberry puree), allowing the mock soil to dry, rinsing the coupons in distilled water at room temperature (23 °C) for different periods of time, drying the coupons again, and gravimetrically quantifying the removed residue. Although this cleanability measure may not apply directly to equipment cleaning as practiced by blueberry growers in the field, it does provide a relative indicator to compare the different surfaces with each other in controlled conditions. Mock soil was prepared by blending 100 g of frozen blueberries for 10 s in a 600-W blender using an extractor blade and a short 0.5-L cup (NutriBullet, Homeland Housewares, Los Angeles, CA, USA).
At the beginning of each experimental run, the mass of each of four coupons per surface material was determined by weighing to a precision of 0.001 g. Next, half a teaspoon of mock soil [approx. 2.58 ± 0.116 g (mean ± standard deviation,
n = 10)] was applied to each coupon and distributed evenly using the spoon. Coupons were dried at 42 °C for 16 h, then weighed to determine the dry mass of the applied soil. Surface coupons were placed individually into 50-mL polypropylene centrifuge tubes containing 45 mL of distilled water (22.7 °C) and were held in place by a cork cap. Tubes were placed on an orbital shaker and agitated at 100 rpm for 30, 60, 120, and 240 s. After each rinse period, coupons were removed, dried at 42 °C for 10 h, and weighed to determine the soil residue remaining on each coupon. Cleanability was defined operationally as the percentage of mock soil removed during the rinsing process. The experimental setup is illustrated in
Supplemental Figure S1.
Four experimental runs were conducted over time. The experimental design was a split-plot with rinse time as the main-plot, surface type as the sub-plot, and the four experimental runs as blocks (replicates). Analysis of variance was conducted using the GLIMMIX procedure in SAS v. 9.4 (SAS Institute, Cary, NC, USA). Means were compared using Tukey’s test (α = 0.05).
2.4. Cleanability of Surfaces with Different Cleaning Agents
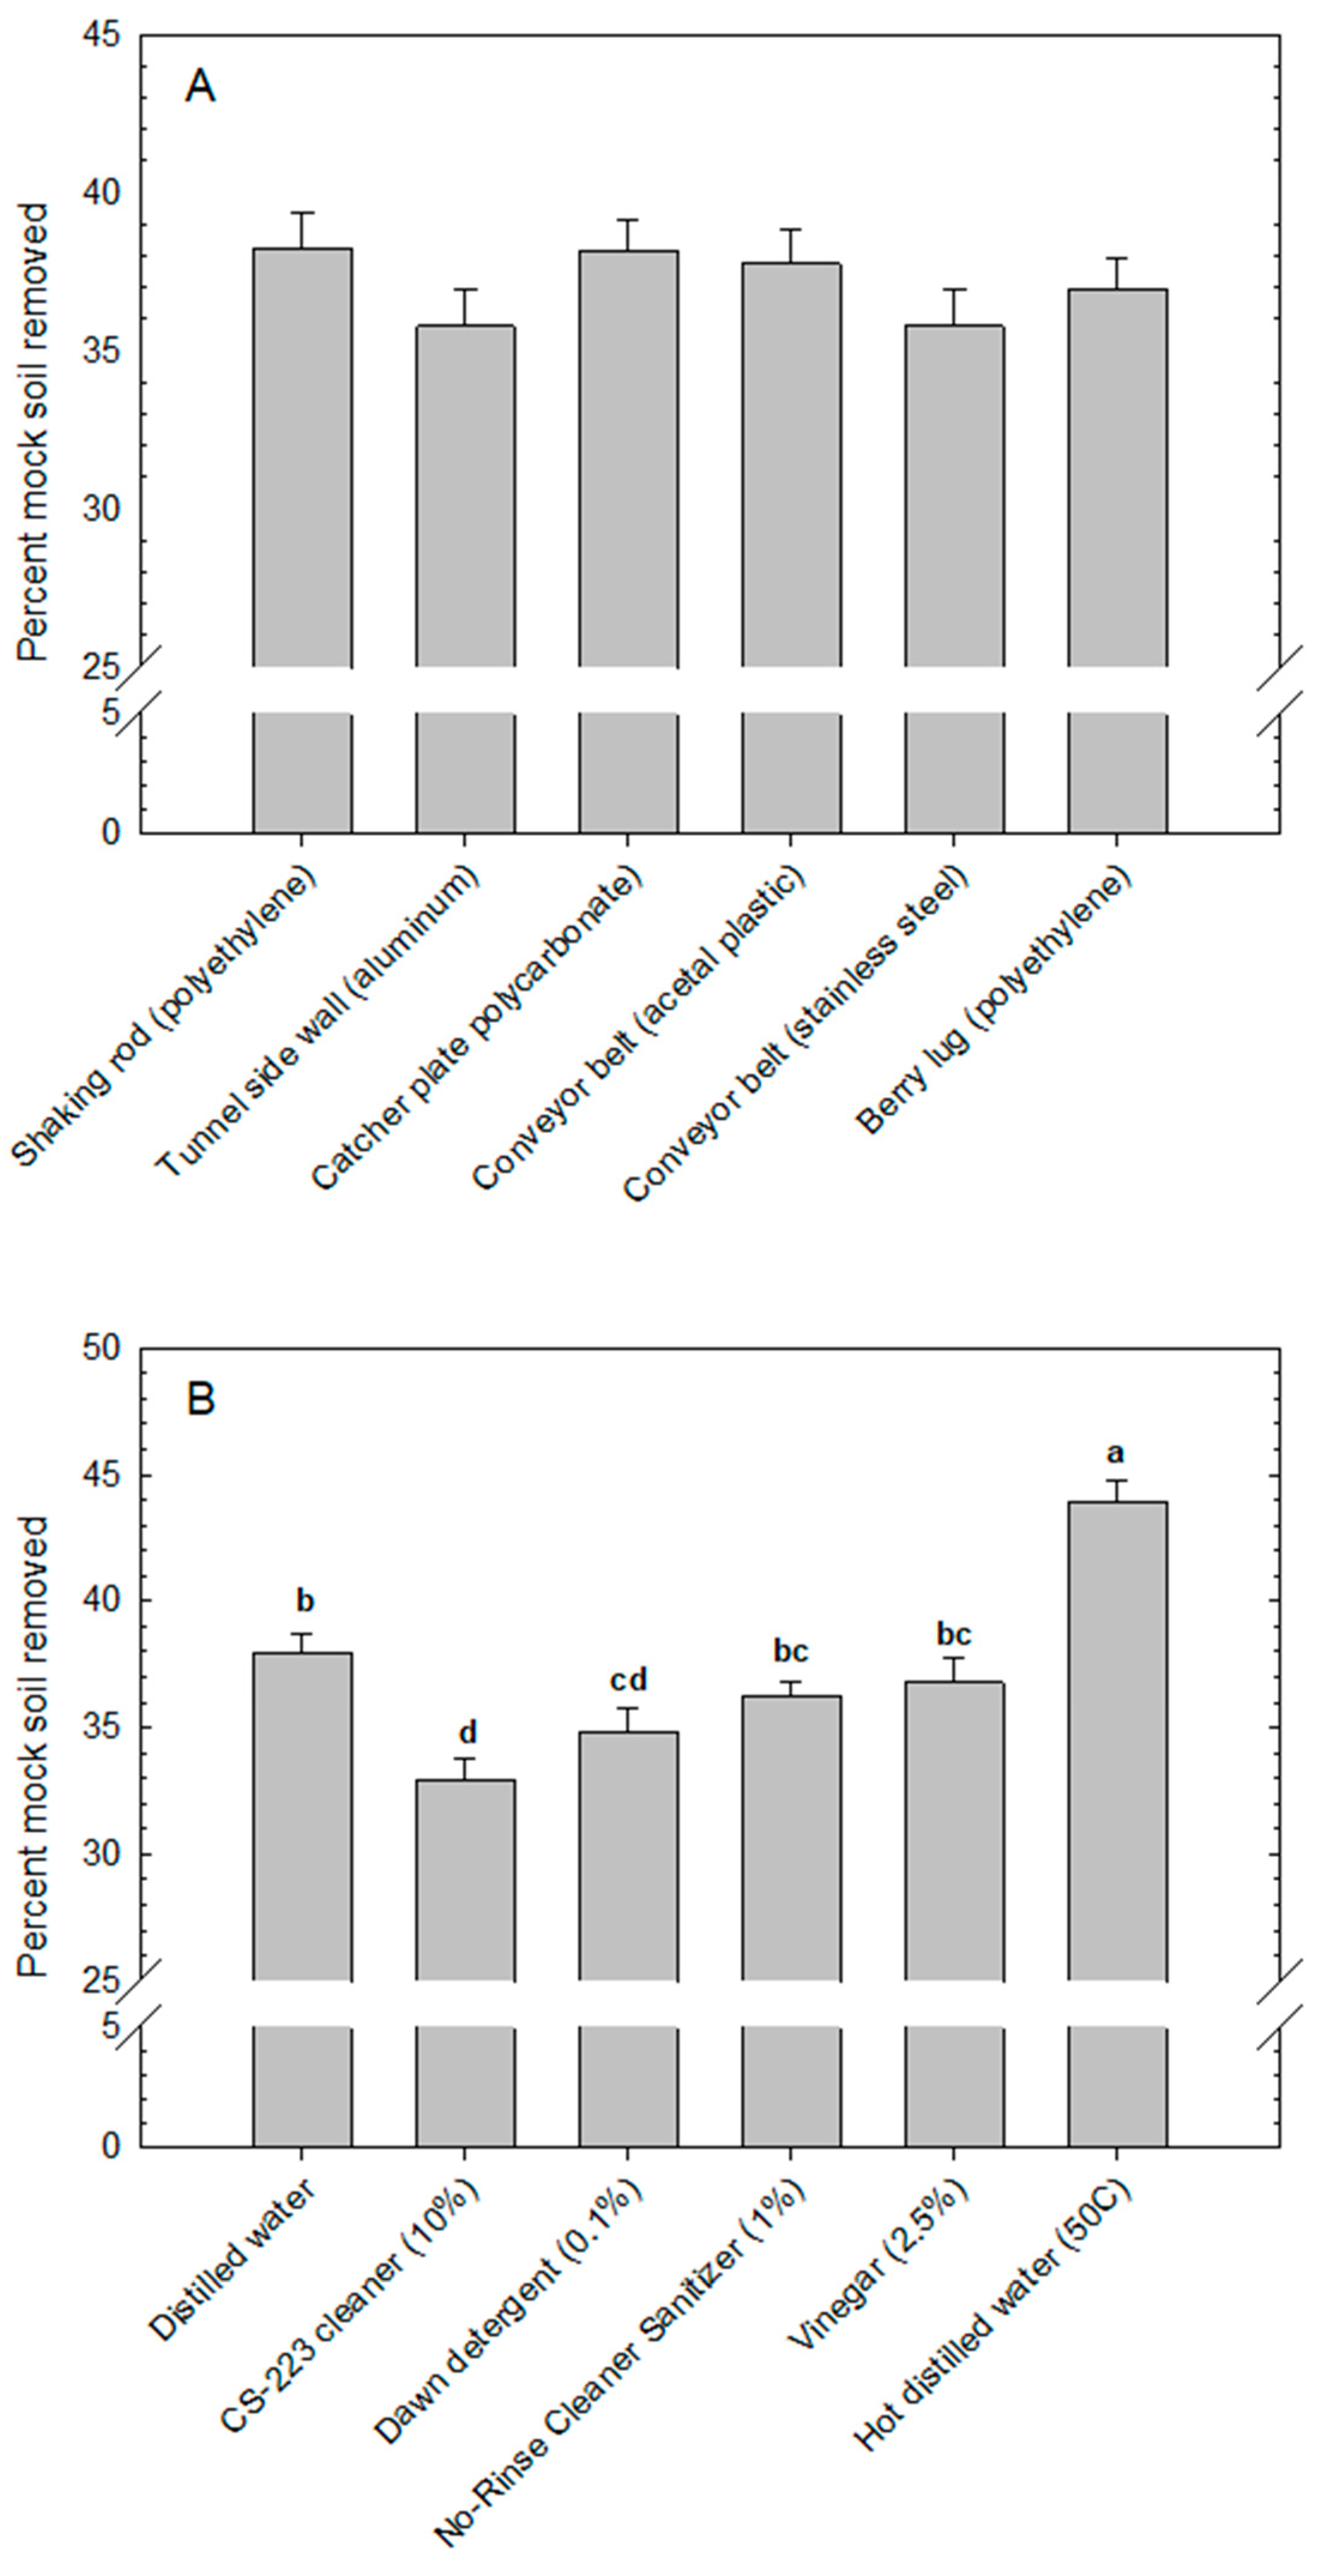
The cleanability assay described above was repeated with the following modifications: (1) use of only one rinse period of 120 s; and (2) evaluation of four different cleaning agents in addition to two distilled water controls (23 °C room temperature or heated to 50 °C). Cleaning agents included: (1) 0.1% Dawn Ultra Free & Clear detergent (ingredients: alcohol denatured, lauramine oxide, fragrance, methylisothiazolinone, PEI-14 PEG-10/PPG-7 copolymer, phenoxyethanol, PPG-26, sodium chloride, sodium hydroxide, sodium laureth sulfate, sodium lauryl sulfate, water; Procter & Gamble, Cincinnati, OH, USA); (2) 10.0% CS-223 foaming cleaner surfactant blend (proprietary blend of surfactants and water; Chemical Systems, Zellwood, FL, USA); (3) 1.0% No-Rinse Food Contact Cleaner Sanitizer (ingredients: octyl decyl dimethyl ammonium chloride, dioctyl dimethyl ammonium chloride, didecyl dimethyl ammonium chloride, and alkyl (C14 50%; C12 40%; C16 10%) dimethyl benzyl ammonium chloride; Ecolab Inc., St. Paul, MN, USA); and (4) 2.5% white distilled vinegar (IGA, Chicago, IL, USA).
Assays were conducted and data collected as described previously. Four experimental runs (replicates) were completed over time. Two-way analysis of variance was applied to determine the main effects of surfaces and cleaning agents and their interactions (PROC GLIMMIX in SAS v. 9.4). Means were compared using Tukey’s test.
2.5. Surface Sanitization
The sanitation assay was conducted against microorganisms previously isolated from mechanical harvester surfaces in the field [
10], including
Bacillus amyloliquefaciens (bacterium),
Rhodoturula mucilaginosa (yeast), and
Epicoccum nigrum (filamentous fungus). The bacterial and yeast cells were grown overnight (16 h) with agitation in potato dextrose broth, pH 5.6 (Molecular Toxicology, Boone, NC, USA); centrifuged (2200×
g for 10 min); and resuspended in sterile 1× phosphate-buffered saline, pH 7.5 (PBS; Thermo Fisher Scientific). The filamentous fungal isolate was grown for 4 days at room temperature on potato dextrose agar and conidia were harvested by flooding the culture dishes with sterile distilled water containing 0.05% (
v/
v) Tween 80, dislodging fungal growth with a sterile spatula, and filtering the resulting conidial suspension through two layers of cheesecloth. Suspensions (20 mL each) of bacterial cells [10
7 colony-forming units (CFU) per ml], yeast cells (10
6 CFU/mL), and fungal conidia (10
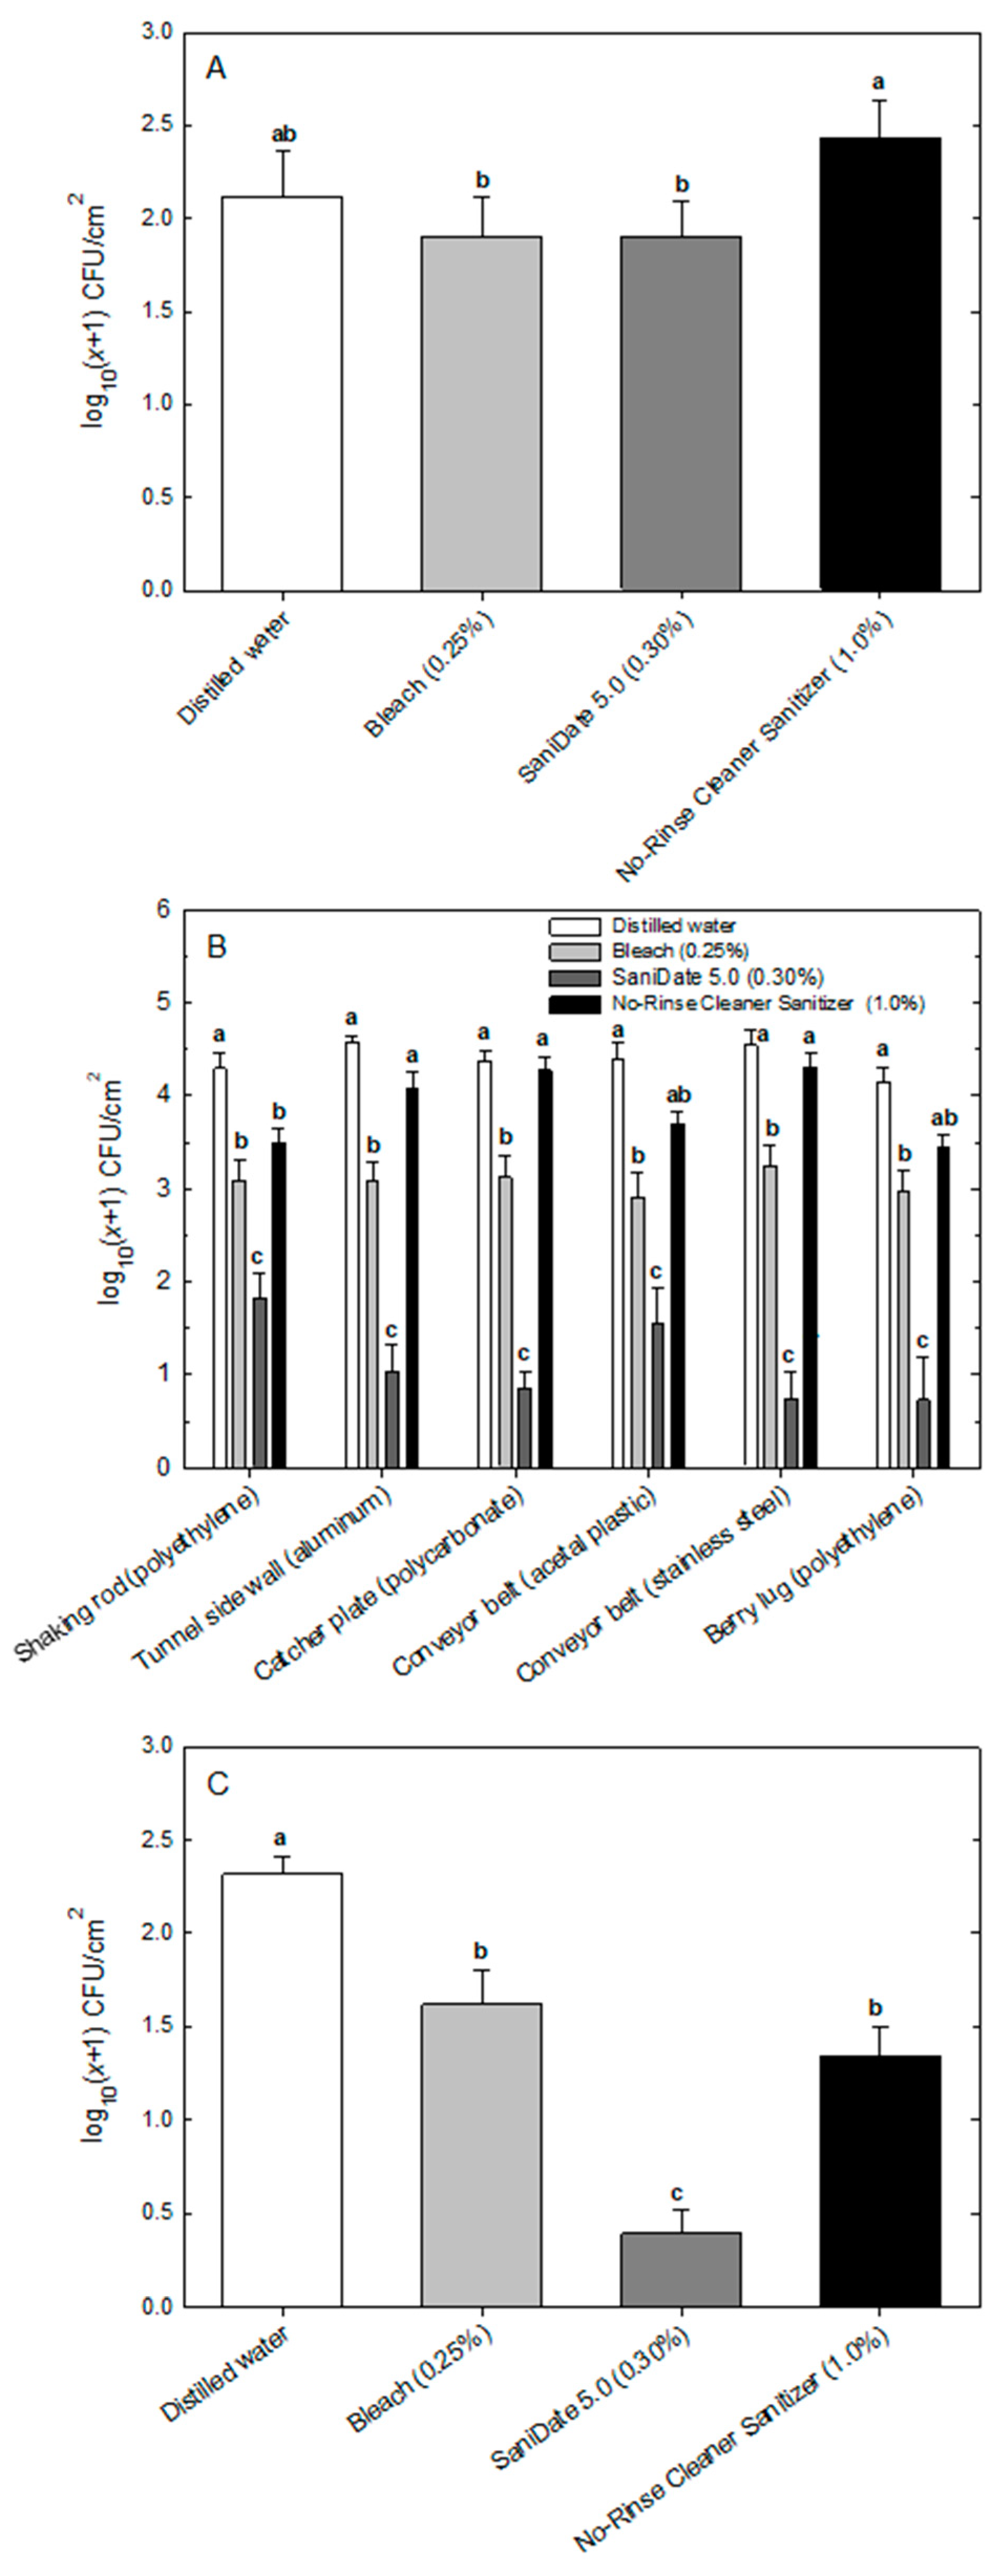
5 conidia/mL) were combined into one 60-mL microbial suspension cocktail. A 0.5-mL aliquot of this inoculum was pipetted onto and spread in a circular formation to cover the 2 cm × 5 cm area of each of the six harvester coupon surfaces. Inoculated coupons were incubated overnight at 25 °C to allow for microbial attachment to the surfaces. Then, coupons were immersed in a sterile glass tray (18 cm × 13 cm × 4 cm) in 200-mL solutions of either sterile distilled water (control) or one of three different sanitizers: (1) 0.25% bleach (6.0% sodium hypochlorite; Clorox Regular Bleach, EPA registration 5813-111; Clorox Company, Oakland, CA, USA); (2) 0.30% SaniDate 5.0 (23.0% hydrogen peroxide + 5.3% peroxyacetic acid, EPA registration 70299-19; BioSafe Systems LLC, East Hartford, CT, USA); or (3) 1.0% No-Rinse Food Contact Cleaner Sanitizer for exposure times of 60 and 120 s. The concentration of free chlorine in the bleach solution was confirmed at 200 ppm using a free and total chlorine portable photometer (HANNA Instruments, Smithfield, RI, USA). The concentration of peroxyacetic acid in the SaniDate solution was verified to be 150 ppm using a peroxyacetic acid test kit (BioSafe Systems).
Following the appropriate exposure time, coupons were removed and placed into another sterile glass tray containing double-strength Dey-Engley (DE) neutralizing broth (Becton Dickinson, Franklin Lakes, NJ, USA). After a 5-min incubation period, coupons were removed and swabbed individually with a hydrated sponge pre-moistened with 10 mL of DE broth (part number HS10DE2G; 3M, St. Paul, MN, USA). Excess moisture was squeezed from the sponge, then swabbing occurred in the lengthwise direction of the surface coupon. After five passes, the opposite side of the sponge was used for five additional passes for a total of ten passes while applying a force of ~25 N (as determined in preliminary experiments by applying pressure to a standard laboratory balance). The sponge was returned to the sterile sample bag containing 10 mL of DE broth, squeezed until all excess eluent was removed, and 1 mL of the resulting suspension was placed into a sterile microcentrifuge tube and dilution-plated onto potato dextrose agar in duplicate. After a 5-day incubation period at room temperature, microbial populations were counted and expressed as CFU per cm2 of the surface. The experiment was replicated three times on different days, and the experimental design was a split-split-plot with incubation time as the main plot, sanitizer as the sub-plot, and coupon surface as the sub-sub-plot. Three-way mixed-model analysis of variance was conducted to determine the effects of surface (fixed effect), sanitizer (fixed effect), incubation time (fixed effect), replication (random effect), and their interactions on the percent reduction of microbial populations (PROC GLIMMIX in SAS v. 9.4). Means were compared using Tukey’s test.
4. Discussion
Harvester fruit contact surfaces differed in their microscopic surface roughness (by up to 40-fold in
Sa values) and hydrophobicity (by being either hydrophilic or hydrophobic), but this generally did not influence mock soil removal significantly under the experimental conditions evaluated here. There was, however, preliminary evidence in the rinse time experiment that mock soil removal was greatest from the smoothest surface (catcher plate made of extruded polycarbonate) which is in alignment with other surface cleanability studies showing that smoother surfaces tend to be easier to clean [
23,
24]. In general, surface roughness values of the same material may vary considerably based on sourcing, manufacturing, and finishing processes. Compared with the literature, surface roughness values in our study were similar to those reported previously for polyethylene material [
25], aluminum [
26], extruded polycarbonate [
27], and stainless steel [
28], but higher (rougher) for high-density polyethylene [
28] and acetal plastic [
29].
There are several potential reasons why the surface effect on cleanability in the present study was limited and/or statistically not significant. The relatively high sugar content of the blueberry puree used in the present study resulted in a very tacky mock soil; soils with such properties are known to present a major challenge to surface cleaning [
30]. In addition, the mock soil was dried onto the surfaces overnight, so soil aging may have made it more difficult to clean all surfaces, regardless of their physical properties [
31]. Our mock soil layer also was relatively thick (~0.26 g/cm
2) so soil component interactions may have dominated over surface-soil interactions relative to their effect on mock soil removal from the surfaces [
32]. Indeed, a previous study assessing the effects of surface treatment on cleaning a model food soil showed that surface roughness had no effect on adhesive failure where cohesion within the deposit was greater than adhesion to the surface [
33]. The soil on blueberry harvesters in the field is more complex than the blueberry puree used in the present study and includes other plant materials (such as leaves, bark pieces, and small twigs) as well as sand and soil organic matter; these additional materials may reduce cohesion within the deposit and facilitate cleaning compared with the more uniform mock soil used here.
In a previous study [
10], mechanical harvester surfaces were found to be significantly different in terms of the microbial loads they harbored in the field during blueberry harvesting. In contrast, the present study shows a more limited effect of surface characteristics on the basic cleanability of these surfaces in controlled conditions. Fine-scale differences in physicochemical surface characteristics (such as surface roughness and hydrophobicity) may have greater impacts on microbial accumulation and attachment than on the adhesion of soil to these surfaces. Furthermore, the significant surface effects observed in the field study by Holland et al. [
10] may have been due to the location of the surface on the harvester rather than to their basic physical surface characteristics. Specifically, higher microbial loads were typically associated with surfaces on the harvester that were oriented horizontally and located at the bottom of the machine. This function of location, as opposed to material, may explain such surface differences.
Mock soil removal increased significantly with rinse time but in the shape of a diminishing return. Based on the decreasing slope of the response line from 120 to 240 s of rinsing, a rinse time of 120 s was used in subsequent experiments. Literature has shown that rinsing is a critical step in the cleaning procedure and can also significantly reduce loads of microbial contaminants on food contact surfaces, such as
Salmonella and
Campylobacter [
34]. A study focused on thermal sanitizing in a commercial dishwashing machine found this to be true as well, showing a logarithmic reduction in
Escherichia coli as a function of rinsing time with further reduction observed with higher volumes of rinse water [
35]. Interestingly, the latter study also found that washing cycles may achieve satisfactory sanitizing performance at temperatures as low as 45 °C, provided there is a high volume of water applied to food contact surfaces during the rinsing phase.
Cleaning agents had a significant effect on mock soil removal from harvester surfaces, but only heated distilled water (50 °C) was significantly better than the room-temperature distilled water control. Detergents and specialized cleaning products were not better than water in the present study, which may be a function of the mock soil used in the experiments. Blueberry puree is composed mostly of sugary material with low lipid content, where surface tension-reducing detergents would not be expected to improve removal efficacy substantially. Sugar is water-soluble, whereas more lipid-based soils are water-insoluble and alkali-soluble [
36]. Heating the water can have an additive effect and encourage a phase change in the soil. For example, in our case, a transition may have occurred from a solid-state crystalline sugar in the dried-on blueberry puree to a liquid state with dissolution in water and melting in heated water [
37].
In the sanitization experiment, the distilled water control treatment harbored an average of 2.12, 4.38, and 2.32 log CFU/cm
2 for
B. amyloliquefaciens,
R. mucilaginosa, and
E. nigrum, respectively; whereas the calculated applied number of organisms was 5.22, 4.22, and 3.22 log CFU/cm
2, respectively. Thus, water submersion had less of an impact on yeast in the initial reduction of microbial load compared with the other two organisms. This may be due to better attachment of
R. mucilaginosa to the experimental surfaces since yeast species are known to grow directly onto plastic and metal surfaces [
38,
39]. Because of its film-forming properties,
R. mucilaginosa is being used as a test microorganism in biofoul testing of surfaces [
40]. Furthermore,
Rhodoturula yeasts are known for their superior survival in systems containing water, for example in washing machines [
41].
The reductions achieved by sanitizer application were not significant for
B. amyloliquefaciens but were for
R. mucilaginosa and
E. nigrum. This could be due to the formation of resilient endospores in
B. amyloliquefaciens. Endospores can take several hours to develop, and their development in
Bacillus species is triggered by low nutrient availability and high cell density [
42]. Given our high cell-density target of 10
7 CFU/mL in a logarithmic growth phase (overnight culture), these conditions could have been met during the later hours of incubation prior to the application of
B. amyloliquefaciens to the experimental surfaces.
Bacillus endospores are considered the most difficult and challenging microbial forms to inactivate and treat in the food industry [
43]. Although sanitizers can reduce vegetative cells and endospores of
Bacillus species, some studies showed that 30- and 60-min exposure times to chlorine sanitizers, such as chlorine dioxide and sodium hypochlorite, did not reduce endospore survival [
44].
Bacillus endospores treated with hydrogen peroxide and hypochlorite sanitizers can still germinate in the presence of nutrients [
45].
For the yeast
R. mucilaginosa, ranking of sanitizer efficacy from weakest to most effective was No-Rinse Cleaner Sanitizer, bleach, and SaniDate (which includes hydrogen peroxide and peroxyacetic acid as active ingredients). This is in alignment with the literature with bleach having weak efficacy on yeast strains compared with the more effective peroxyacetic acid treatments [
46]. In another study with attached
R. mucilaginosa yeast cells, the highest concentration of bleach (500 ppm sodium hypochlorite) was needed to attain the same log reduction compared with planktonic cells, so again, bleach was shown to have weak efficacy [
47]. There was a significant statistical interaction between sanitizer and surface for
R. mucilaginosa in our study, which seemed to be mostly due to the better efficacy of the No-Rinse Cleaner Sanitizer for the shaking rod (polyethylene) surface. According to Salo and Wirtanen [
46], alcohol-based sanitizers were most effective against yeast strains, hence future studies should include an alcohol-based sanitizer for assessment.
For the third organism included in our sanitization study, the filamentous fungus
E. nigrum, bleach, and No-Rinse Cleaner Sanitizer showed significant efficacy; however, the SaniDate sanitizer proved to be the most efficacious. Previous work also showed that this organism can be readily controlled with sanitizers. A study on the enumeration of storage fungi in malting barley grain showed that a soak in ethanol or sodium hypochlorite significantly reduced
E. nigrum recovery from this substrate [
48].
E. nigrum also is a spoilage organism of processed blueberries, and chlorine dioxide gas sachets have reduced these types of mold organisms significantly [
49].
Model experiments such as those described here have inherent limitations. Cleanability experiments were conducted in a closed test tube system, and results (especially in terms of absolute numbers) could be different in the outdoor harvester environment where surface soil is more complex and rinsing may be conducted with a pressure washer. Hydrophobicity of surfaces can change with the slightest addition of environmental dust. The amount of soil present on a surface, the thickness of the soil layer, and how much surface is exposed or not exposed can impact cleanability and needs to be further investigated. Sanitizer efficacy and survival of microorganisms can be further impacted by variables such as humidity or surface wetness at the time of sanitizer application, starting level of cleanliness of surfaces, and the ability of microorganisms to form biofilms. These added variables should be considered in future experiments. Nevertheless, our study provides a first step and baseline for comparison of the relative cleanability of these surfaces. When combined with our results on microbial loads on different harvester surfaces [
10], this will help design future experiments to optimize cleanability and sanitization protocols in the field.


 ,
, 


