
Digestion and Absorption of Dietary Phosphorus in Fish


Department of Bioresources Management, School of Environmental Sciences, The University of Shiga Prefecture, Hikone 522-8533, Japan
Fishes 2024, 9(8), 324; https://doi.org/10.3390/fishes9080324
Submission received: 24 July 2024
/
Revised: 10 August 2024
/
Accepted: 12 August 2024
/
Published: 16 August 2024
(This article belongs to the Section Nutrition and Feeding)
Abstract
:The absorption of dietary phosphorus typically begins with the digestive phase, where various chemical processes take place. These include the solubilization of calcium phosphates by gastric acid in the stomach, as well as the enzymatic breakdown of various organic phosphorus compounds within the intestinal lumen. Enhancing the digestive phase can be achieved by pre-digesting diets or designing them to be readily digestible, which can be especially advantageous for fish with limited digestive capabilities. This improvement may involve supplementing the diets with phytase and organic acids, fermenting feed ingredients, and selecting highly digestible ingredients. Following the digestive phase, solubilized inorganic phosphates and small organic phosphates are absorbed across the intestinal epithelium. This absorptive process is governed by numerous bodily mechanisms that are not easily altered or enhanced. Nonetheless, comprehending these absorptive mechanisms of dietary phosphorus may pave the way for the development of novel methods to increase dietary phosphorus absorption.
Keywords:
low-pollution feed; phosphorus digestibility; phosphorus transport; environmental technology; sustainable aquacultureKey Contribution: This review paper provides detailed information and data on how different fish species digest and absorb dietary phosphorus.
1. Digestion of Dietary Phosphorus
1.1. Digestibility and Related Factors
Efficient absorption of dietary phosphorus (P) is important for fish to support numerous physiological processes. Understanding the digestibility, or intestinal absorption rate, of dietary P is thus crucial for accurately assessing the adequacy of P intake. Moreover, awareness of the digestibility of dietary P plays a vital role in mitigating P excretion, which can contribute to pollution in the aquatic environment. Assessing the digestibility of dietary P offers valuable insights for evaluating fish feeds that satisfy both biological and environmental criteria [1,2].
Feed ingredients inherently contain P, but their digestibility varies greatly (Table 1). The digestibility of P primarily hinges on the chemical form of P in the diet, particularly within the gastrointestinal (GI) lumen (Figure 1). Consequently, maximizing P digestibility necessitates several key considerations: first, selecting feed ingredients with high P digestibility; second, converting indigestible forms of dietary P into available forms through various chemical, physical, enzymatic, or microbial treatments of feed ingredients or diets; and third, minimizing undesirable chemical interactions within the diet and the GI lumen. In the case of bone P (hydroxyapatite) present in animal ingredients, the digestibility diminishes with an increase in bone content within the diet [3]. This phenomenon can be attributed to the constrained secretion of gastric acid in the stomach of fish, as detailed below.
1.2. Gastric Acid and Bone P
Inorganic sources of P, such as bone P, are solubilized in the stomach by the action of gastric acid. The solubilized inorganic phosphorus (Pi) is then absorbed in the intestine, primarily in the duodenum, including the pyloric caeca, as detailed in Section 2. Consequently, agastric (stomachless) fish are essentially unable to utilize insoluble bone P or hydroxyapatite in their feed (Table 1). Among monogastric fish, the lowest pH in stomach chyme varies significantly: it is low in tilapias (pH 1.2–1.6) and catfishes (pH 2.0–2.4), moderate in rainbow trout (pH 2.6–4.9), seabream (pH 3.7–4.5), seabass (pH 3.0–3.5), and flounder (pH 3.3–4.8), and relatively high in Atlantic salmon (pH 4.0–5.2) (reviewed in Sugiura [4]). The stomach pH of most fish species is generally higher than that of monogastric mammals, which typically ranges from pH 1 to 2. This difference can be attributed to the less efficient acid secretion of oxyntopeptic cells in fish compared to the parietal cells in mammals [5]. To address this challenge, acidifying fish feeds with feed acidulants, such as citric acid, has been extensively researched and proven effective in various fish species (reviewed by Sugiura and Hardy [2], Luckstadt [6]).
1.3. Intestinal Digestion
Organic sources of P in feed undergo enzymatic breakdown in the intestine. Alkaline phosphatase, a membrane-bound glycoprotein, hydrolyzes various phosphate monoesters at basic pH. In the brush border of enterocytes, an intestinal isoform of alkaline phosphatase plays a central role in removing Pi moieties from substrates such as phosphoproteins, phospholipids, and other phosphate esters. Another isoform, tissue-nonspecific alkaline phosphatase, also contributes, though to a lesser extent, to the dephosphorylation of various compounds. Nucleotidases located on the brush border of enterocytes hydrolyze nucleotides into nucleosides and Pi. Phytases break down phytates into lower inositol phosphates and Pi, as detailed below.
1.4. Phytates
Phytic acid (inositol hexakisphosphate, IP6) predominates as the form of P in many plant-protein ingredients. Both phytic acid and sodium phytate are soluble and can undergo significant degradation within the GI lumen by endogenous, microbial, or feed-derived phytases, resulting in the formation of lower inositol phosphates (IP5-IP1) and liberated Pi moieties. The end product, IP1, is further broken down by endogenous phosphatases into inositol and Pi.
Luminal phytates may also undergo absorption without digestion if they are in a soluble state. In higher animals, orally administered phytate is detected in the blood, urine, brain, and other organs, suggesting direct absorption of phytate in the GI tract [7,8]. The mechanism of phytate absorption remains insufficiently researched; however, no transporter specific to phytates or lower inositol phosphates (IPs) has been identified. Pinocytosis has been proposed as a potential mode of phytate absorption [8].
Another conceivable route of phytate absorption is paracellular diffusion and/or solvent drag. Molecular sizes of IP6 and IP3 are 660 and 420 g·mol−1, respectively, which may hinder paracellular permeation. Nonetheless, various factors are known to induce dilation of intercellular tight junctions, facilitating the transport of relatively large molecules such as drugs, 4 kDa dextran, and polyethylene glycol [9,10,11]. Moreover, since IPs are negatively charged, they may create an electrical driving force for paracellular flux.
Phytic acid and phytates are well-known for their anti-nutritional properties. However, in mammals, an increasing number of studies have reported their health beneficial effects, including anti-carcinogenic, immuno-stimulating, and antioxidant effects [7]. In fish, these effects remain to be investigated.
Low-phytate mutant grains, such as corn, barley, and soybean, exhibit reduced phytate content, resulting in higher P digestibility compared to ordinary grains [12]. Substituting ordinary grains with low-phytate grains in animal feeds has been shown to effectively decrease fecal P excretion in various farm animals, birds, and fishes.
Bacterial fermentation of plant ingredients can lead to a reduction in phytates, depending on the enzymes produced by the bacterial species. For instance, lactic fermentation of wheat and barley flours has resulted in a 50–65% decrease in phytate content [13]. Similarly, fermentation of rapeseed meal with white-rot fungi has significantly enhanced the digestibility of P, Mg, Zn, and Cu in rainbow trout, Oncorhynchus mykiss (Walbaum, 1792) [14].
Divalent cations, such as Ca2+ and Mg2+, can precipitate phytic acid, forming phytin, which is resistant to digestion. Consequently, the presence of these cations in the gut lumen can impede phytate utilization by fish. These divalent cations can originate from dietary ingredients, bones and shells solubilized by gastric acid or feed acidulants, and imbibed seawater.
1.5. P-Binders
Trivalent cations (Al3+, Fe3+) and, to a lesser extent, divalent cations (Ca2+, Mg2+) can precipitate soluble Pi in the intestinal lumen. Conversely, various chelators bind these cations to decrease their reactivity with Pi, thereby maintaining luminal Pi in a soluble state. Bicarbonate (HCO3−), secreted into the intestinal lumen, elevates the luminal pH and promotes the precipitation of divalent cations, thus sustaining Pi in a soluble state. Fatty acids form complexes with Ca2+ in the intestinal chyme, preventing the formation of Ca-phosphate precipitates and consequently increasing dietary P absorption [4,15].
2. Absorption of Dietary Phosphorus
2.1. Physiology of Pi Transport in the Intestine
In fish, the precise physiological mechanism of dietary P absorption remains largely unresolved. Nevertheless, the fundamental mechanism of dietary P absorption in the GI tract is believed to be conserved across vertebrates, including fish.
Dietary P is known to be absorbed via two distinct mechanisms, as illustrated in Figure 2 and Figure 3: (1) active carrier-mediated transport, primarily mediated by NaPi-IIb (type-II family, Slc34a2), with a minor contribution (~5%) from Pit1/2 (type-III family, Slc20a1/a2); and (2) passive paracellular diffusion, which is nonsaturable regardless of luminal Pi concentration [16,17,18].
2.2. Active Pi Transport
Active Pi transport is a sodium-dependent transcellular process mediated by specific transporter proteins. Pi traverses from the intestinal lumen through the apical brush border membrane of enterocytes. Subsequently, Pi exits the cell through the basolateral membrane into the bloodstream via a sodium-independent, carrier-mediated process, as studied in rat and chick intestinal basolateral membranes [21].
NaPi-IIb serves as a high-affinity, low-capacity transporter, co-transporting 3Na+ ions and HPO42− ions from the mucosal side to the cytosol across the apical membrane against the electrochemical gradient (secondary active transport). The low Km (low Vmax) relative to luminal Pi concentration largely limits the contribution of NaPi-IIb to total Pi transport [17,22,23].
In contrast to NaPi-IIb, Pit1 and Pit2 play a minor role in transcellular Pi transport [18,24,25]. These transporters appear to function as sensors for altered extracellular Pi concentrations.
In common carp, Cyprinus carpio Linnaeus, 1758, dietary Pi is absorbed in the intestine via the active carrier-mediated transcellular route [26,27]. Rainbow trout exhibit a transport system comprising both a saturable, carrier-mediated active component and a diffusive, non-saturable component [23,28]. In zebrafish, Danio rerio (F. Hamilton, 1822), and winter flounder, Pseudopleuronectes americanus (Walbaum, 1792), Pi transport rates for both intestinal and renal NaPi are higher under alkaline pH conditions compared to neutral or acidic pH [29,30,31,32]. Additionally, in rainbow trout, active Na-dependent Pi uptake in the pyloric caeca is significantly enhanced under pH 8–9 compared to pH 4–7 [23].
2.3. NaPi Transporters
In many fish species, the presence of NaPi-IIb mRNA sequences has been documented [33,34,35]. However, unlike higher animals, teleosts exhibit various NaPi paralogs resulting from one or two whole genome duplication events, leading to diversified and intricate functional roles [34]. Studies on zebrafish most clearly illustrate that these NaPi paralogs display distinct tissue distribution patterns, expression profiles, and functions, thereby responding differently to dietary P [30,32].
In yellow catfish, Tachysurus fulvidraco (J. Richardson, 1846), the amino acid sequence of intestinal NaPi-IIb shows only 70–79% identity with sequences from blind cave characin, Astyanax mexicanus (De Filippi, 1853), and a Lake Victoria cichlid, Haplochromis nyererei Witte-Maas and F. Witte, 1985 [36]. Subsequently, two additional NaPi-IIb paralogs or isoforms have been identified in yellow catfish: one from the intestine and the other from the kidney [37]. These three sequences exhibit only 54–63% identity at the amino acid level.
In zebrafish and mice, Slc34a genes seem to be regulated, at least in part, by their natural antisense transcripts. Slc34a genes are transcribed in both orientations, potentially leading to the formation of mRNA hybrids. These RNA hybrids function in transcriptional silencing via RNA interference mechanisms [38,39,40,41,42]. The antisense RNAs undergo processing into short RNAs, similar to siRNAs, to regulate the expression of sense RNAs.
2.4. Tissue Distribution of NaPi
The distribution of NaPi-IIb mRNA in the GI tract varies among species. In mice and dogs, NaPi-IIb mRNA, protein, and Pi-uptake are predominantly found in the ileum, with lower levels in the jejunum, and are minimal to absent in the duodenum [43,44,45]. Conversely, in rats, NaPi-IIb mRNA is most abundant in the jejunum, less so in the duodenum, and absent in the ileum [22,43,44]. In goats, NaPi-IIb mRNA is abundant in the jejunum but absent in the duodenum [46]. In chickens, the highest expression of NaPi-IIb mRNA occurs in the duodenum, followed by the jejunum and ileum [47].
In humans, NaPi-IIb mRNA is most abundant in the lung, followed by the trachea (approximately one-sixth of lung expression) and the salivary gland (about one-fifteenth of lung expression). Expression in the small intestine is approximately one-thirty-second of that observed in the lung. Despite variable expression levels, NaPi-IIb is detected in numerous organs or tissues [48]. In monkeys, both PiT-1 and PiT-2 mRNAs exhibit much higher expression levels than NaPi-IIb mRNA across all segments of the small intestine [43].
In rainbow trout, three NaPi isoforms have been identified: intestinal, caecal, and renal isoforms. The intestinal isoform is expressed throughout the intestine, with highest expression in the middle to distal areas, while the caecal isoform is primarily expressed in the pyloric caeca and to a lesser extent in the duodenum [23,33,49,50]. The renal isoform is exclusively found in the kidney. Unlike intestinal isoforms, renal NaPi in many species is expressed solely in the kidney and brain, except perhaps in zebrafish, flounder, and yellow catfish [35].
In crucian carp, Carassius auratus grandoculis (Temminck et Schlegel, 1846), NaPi-IIb mRNA is detected in a diverse array of organs or tissues, with high expression levels observed in the intestine and gonads, lower levels in the liver, gills, and air bladder, and very low but detectable levels in the heart, spleen, muscle, and skin [33]. Similarly, in Nile tilapia, Oreochromis niloticus (Linnaeus, 1758), NaPi-IIb is most strongly expressed in the intestine, with weaker expression observed in blood cells and skin [33]. It is noteworthy that these species may possess additional NaPi-IIb isoforms or paralogs, warranting further investigation.
In zebrafish, two isoforms of NaPi-IIb are co-expressed in the intestine: NaPi-IIb1, or the intestinal isoform, and NaPi-IIb2, or the renal isoform, each with distinct functional properties [30,32]. NaPi-IIb1 is expressed in the intestine, kidney, and eyes, while NaPi-IIb2 is expressed in numerous tissues [32]. In toads, Na-dependent Pi transport has been demonstrated in the urinary bladder [51]. However, NaPi-IIb mRNA was detected in the small intestine, kidney, and skin, but not in the urinary bladder [52].
In yellow catfish, NaPi-IIb mRNA exhibits its highest abundance in the anterior intestine, followed by the posterior and mid intestine [36]. However, little expression is detected in other examined tissues, including the kidney, liver, muscle, stomach, brain, gill, and skin. Another NaPi-IIb isoform is identified in the intestine of yellow catfish, primarily expressed in the intestine but also present at lower levels in various tissues such as the skin, muscle, gills, liver, brain, stomach, and kidney [37]. Additionally, a renal NaPi-IIb isoform is detected, predominantly expressed in the kidney and muscle, with lower expression levels in the skin.
2.5. Dietary Regulation of NaPi
In mammals, dietary P restriction has been shown to up-regulate Pi transport rate and increase NaPi-IIb mRNA and protein abundance [46,53,54,55]. Generally, dietary P absorption predominantly occurs in the proximal small intestine [21,56]. However, unlike in the kidney (where NaPi-IIa and IIc are expressed), the apical expression of NaPi-IIb protein in the intestine primarily responds to longer-term (i.e., days) situations, although acute responses (i.e., hours) have also been reported [18,24,57].
In trout, dietary P did not affect Pi uptake rate in the intestine at day 7 but significantly down-regulated Pi uptake at day 28, indicating that the response of NaPi-II expression to dietary P is slow or chronic. Subsequent studies with rainbow trout confirmed that intestinal NaPi-IIb expression is both acutely and chronically up-regulated by dietary P restriction [23,49,58,59]. In addition, the response of renal NaPi mRNA to dietary P restriction in trout is slower compared to intestinal and caecal NaPi [50,60].
However, it is noteworthy that some studies have reported no increase or even a decrease in intestinal NaPi-IIb expression in response to dietary P restriction. In the pyloric caeca of rainbow trout, dietary P restriction up-regulates both intestinal and caecal isoforms of NaPi-IIb mRNA expression in the acute phase (e.g., week 1). However, in the chronic phase (e.g., week 7), the intestinal isoform mRNA nearly disappears regardless of dietary P levels, whereas the caecal mRNA remains expressed and upregulated by low-P diets [50].
In the intestine of crucian carp, NaPi-IIb mRNA expression was higher in fish fed a low-P semi-purified diet during the acute phase (day 7), while in the chronic phase (day 60), expression became higher in fish fed the high-P diet (low-P diet + NaH2PO4). In tilapia intestine, NaPi-IIb mRNA expression was higher in fish fed the high-P diet during both the acute and chronic phases [33].
In the intestine of yellow catfish, NaPi-IIb mRNA was up-regulated (~3-fold) by a low-P diet [36], although expression levels were similar between normal-P and high-P diet groups. In grass carp, NaPi-IIb mRNA was upregulated in the kidney, spleen, and skin in response to dietary P restriction [61]. In carp, three slc20 and three slc34 transporters are ubiquitously expressed in various organs at varied levels and are down-regulated in cultured cells when Pi is added to the culture medium [62,63]. Softshell turtles fed low-P diets for 60 days showed higher NaPi-IIb and VDR mRNA abundance in the small intestine compared to those fed high-P diets [64].
In rodents, the type III NaPi transporters (Slc20 family) are also P-responsive, despite their low contribution to total P transport. Dietary P restriction increased the abundance and the area of expression of Pit2 protein at the renal brush-border membrane [22]. In the intestine, dietary P did not affect the expression of Pit1.
2.6. Paracellular Diffusion and Related Factors
Paracellular diffusion is a Na-independent, non-carrier-mediated process whereby Pi diffuses from the luminal to the interstitial compartment via leaky junctions. This pathway remains unaffected by dietary P, thus enabling continuous Pi absorption at relatively high rates even under conditions of high dietary P intake [49,65]. Moreover, luminal Pi creates a favorable electric potential for paracellular diffusion, facilitating movement from the lumen to the interstitium [20].
In various animal species, including rats, rabbits and humans, the contribution of active Na-dependent Pi transport ranges from 33% to 75% of total intestinal Pi absorption (as discussed in Sabbagh et al. [66]). However, these estimates can vary significantly depending on factors such as species, developmental stages, P intake, P status, Na-dependent nutrient transport, inflammation of intestinal epithelium, and assay conditions [9].
In rainbow trout, intestinal Pi absorption remains continuous across a wide range of dietary P intake levels, with net Pi absorption remaining high [49]. At low luminal Pi concentrations, Pi is primarily absorbed via the active NaPi-IIb-mediated pathway. However, at physiological luminal Pi concentrations, particularly around 20 mM in the pyloric caeca, luminal Pi is predominantly absorbed via the paracellular route [23].
Paracellular diffusion is regulated by various mechanisms. In mammals and Caco-2 cells, dietary or luminal factors such as glucose, amino acids, short-chain fatty acids, Na, and Ca concentrations can affect tight-junction permeability. In fish intestine, ex vivo Pi uptake is significantly higher in fed compared to unfed eels, indicating that intestinal Pi absorption increases with feeding [67]. In mammals, dietary vitamin D or vitamin D status regulates tight junction proteins (claudin-2 and -12) via 1,25(OH)2D-VDR [68,69,70,71]. In carp, dietary P deficiency can adversely affect intestinal tight junction integrity [72,73].
Certain dietary components in fish diets, such as soybean meal, are known to influence gut epithelial morphology, potentially altering tight junction integrity and increasing paracellular diffusion of macromolecular solutes and pathogens [74]. Similarly, in mammals, various dietary components and intestinal bacteria can affect tight-junction permeability through modulation of tight junction proteins such as claudins, occludins, and JAM proteins [75,76].
2.7. Sites of Pi Absorption
The primary sites of dietary P absorption in the gut vary across different animal species. In rats, the duodenum and jejunum are the main sites of Pi absorption [77]. Conversely, mice primarily absorb Pi in the ileum [78], while in pigs, the small intestine serves as the primary site for dietary P absorption [79].
In carp, Pi absorption occurs throughout the intestine, with the middle section exhibiting the highest absorption rate [26,27]. However, conflicting results have been observed in other studies, where little to no absorption of dietary P was identified in the intestine of carp [80].
In trout fed a practical-type diet, chyme concentrations of P, Ca, and Mg were approximately ten times higher (dry basis) in the stomach compared to the pyloric caeca. However, the protein concentration in the same chyme was only about 20% lower in the pyloric caeca than in the stomach [81]. This suggests that dietary minerals are rapidly absorbed in the pyloric caeca, while protein absorption occurs at a slower rate.
In trout, active Pi uptake is approximately two times higher in the proximal parts of the intestine compared to the distal parts. The transport system comprises both a saturable, carrier-mediated active component and a diffusive, non-saturable component [28]. However, despite this, dietary P is primarily absorbed in the pyloric caeca, where Pi absorption predominantly occurs via passive paracellular processes facilitated by a high luminal Pi concentration [23,82]. Similar findings have been reported in Atlantic salmon, Salmo salar Linnaeus, 1758, highlighting the significant role of the pyloric caeca in the absorption of glucose, amino acids, and dipeptides [83].
2.8. Hormones Regulating P Homeostasis
Various hormones and their receptors play crucial roles in regulating P homeostasis. The fundamental mechanisms governing these regulatory systems seem to be conserved across vertebrates. However, teleosts, owing to repeated whole-genome duplication events and subsequent gene loss, exhibit divergent paralogs in comparison to mammals. This divergence complicates hormonal functions, potentially leading to differences compared with mammalian species [34].
The hormones responsible for regulating intestinal and renal Pi absorption and maintaining P homeostasis include calcitriol or 1,25(OH)2D, parathyroid hormone (Pth) and its subfamily, calcitonin, stanniocalcin, fgf23-klotho, prolactin-somatolactin, thyroid hormones, and estrogen (reviewed in Sugiura [4]).
2.9. Renal Handling of Pi
In the mammalian kidney, Pi undergoes filtration through the glomerulus. The NaPi-IIa cotransporter, located on the apical membrane of the proximal tubule, plays a pivotal role in reabsorbing Pi from the filtrate into renal tubular cells. Any luminal Pi not reabsorbed is subsequently excreted in the urine. Notably, at high dietary P intake, there is a more pronounced decrease in NaPi-IIa protein compared to NaPi-IIa mRNA [84].
In flounder, the same NaPi-IIb mRNA is expressed in both the intestine and renal tubules [31,85]. Within the flounder kidney, NaPi-II-related protein is localized basolaterally in the second segment (PII) of the renal proximal tubule, suggesting PII as the site of tubular Pi secretion. Meanwhile, in the collecting tubule-collecting duct, the apical localization of NaPi-II-related protein indicates a Pi reabsorptive function. In this species, the regulatory mechanism for renal Pi absorption and secretion may involve the apical-basolateral sorting of the same NaPi protein [86,87,88,89].
In the trout kidney, NaPi-IIb mRNA undergoes upregulation with chronic dietary P restriction [58,59]. Additionally, renal NaPi-IIb protein localizes exclusively in the first segment (PI) of the proximal tubule brush-border membrane [49].
In rats, NaPi-IIb is expressed at the basolateral membrane of the renal epithelia lining the collecting duct and is upregulated by high-P feeding, indicating its role in Pi excretion [90]. Conversely, in the same rats, NaPi-IIa and IIc (both apical) were downregulated by a high-P diet.
2.10. Pi Absorption from Ambient Water
In fish and other aquatic organisms, Pi is absorbed passively from the surrounding water, as demonstrated by numerous 32P tracer studies (reviewed in Sugiura [4]). However, the presence of NaPi cotransporters in the skin of various species such as frogs, trout, carp, tilapia, hagfish, and yellow catfish [33,37,52,62,91] raises the possibility of active phosphate uptake from water through the skin. Additionally, NaPi expression has been detected in fish gills [33,37,49,62,91]. The upregulation of NaPi expression in these tissues may occur significantly during periods of dietary phosphate deficiency. Alternatively, NaPi in these epithelial tissues might primarily function in phosphate excretion.
3. Conclusions
Elucidating the physiological mechanisms of dietary P absorption in fish may primarily serve academic interest. This is because P absorption in the GI tract predominantly occurs via the paracellular route, which is physiologically minimally, if at all, regulated under normal dietary P intake. Consequently, no physiological approaches appear feasible to enhance the absorption of dietary P by fish. For practical aquaculture diets, the absorption of dietary P largely depends on the chemical form of P in the diets or more precisely in the intestinal lumen. Therefore, digestibility parameters, rather than physiological mechanisms, can provide crucial information for maximizing dietary P absorption by fish. Another important consideration is the amount of available P in the diet. Dietary available P is absorbed in the GI tract, and any excess amount beyond the dietary requirement is excreted renally as soluble P. This excess P poses a significant threat to the aquatic environment, as it can directly stimulate algal growth and contribute to the eutrophication of the surrounding water body. Minimizing the available P content in the diet is therefore crucial to reduce the environmental burden of intensive aquaculture.
Funding
This research received no external funding.
Institutional Review Board Statement
Not applicable.
Informed Consent Statement
Not applicable.
Data Availability Statement
Data is contained within the article.
Conflicts of Interest
The author declares no conflicts of interest.
References
- Cho, C.Y.; Bureau, D.P. A review of diet formulation strategies and feeding systems to reduce excretory and feed wastes in aquaculture. Aquacult. Res. 2001, 32, 349–360. [Google Scholar] [CrossRef]
- Sugiura, S.H.; Hardy, R.W. Environmentally friendly feeds. In Encyclopedia of Aquaculture; Stickney, R.R., Ed.; Wiley & Sons, Inc.: Hoboken, NJ, USA, 2000; pp. 299–310. [Google Scholar]
- Hua, K.; Bureau, D.P. Modelling digestible phosphorus content of salmonid fish feeds. Aquaculture 2006, 254, 455–465. [Google Scholar] [CrossRef]
- Sugiura, S.H. Phosphorus in Fish Nutrition; Bookway Academic Publishing: Hyogo, Japan, 2018; 420p. [Google Scholar]
- Sugiura, S.H.; Roy, P.K.; Ferraris, R.P. Dietary acidification enhances phosphorus digestibility but decreases H+/K+-ATPase expression in rainbow trout. J. Exp. Biol. 2006, 209, 3719–3728. [Google Scholar] [CrossRef] [PubMed]
- Luckstadt, C. The use of acidifiers in fish nutrition. Perspect. Agric. Vet. Sci. Nutr. Nat. Resour. 2008, 3, 1–8. [Google Scholar] [CrossRef]
- Kang, J.; Badger, T.M.; Ronis, M.J.; Wu, X. Non-isoflavone phytochemicals in soy their health effects. J. Agric. Food Chem. 2010, 58, 8119–8133. [Google Scholar] [CrossRef] [PubMed]
- Schlemmer, U.; Frølich, W.; Prieto, R.M.; Grases, F. Phytate in foods and significance for humans: Food sources, intake, processing, bioavailability, protective role and analysis. Mol. Nutr. Food Res. 2009, 53, S330–S375. [Google Scholar] [CrossRef] [PubMed]
- Horowitz, A.; Chanez-Paredes, S.D.; Haest, X.; Turner, J.R. Paracellular permeability and tight junction regulation in gut health and disease. Nat. Rev. Gastroenterol. Hepatol. 2023, 20, 417–432. [Google Scholar] [CrossRef] [PubMed]
- Karasov, W.H. Integrative physiology of transcellular paracellular intestinal absorption. J. Exp. Biol. 2017, 220, 2495–2501. [Google Scholar] [CrossRef] [PubMed]
- Wood, C.M.; Grosell, M. Independence of net water flux from paracellular permeability in the intestine of Fundulus heteroclitus, a euryhaline teleost. J. Exp. Biol. 2012, 215, 508–517. [Google Scholar] [CrossRef]
- Raboy, V. Approaches and challenges to engineering seed phytate and total phosphorus. Plant Sci. 2009, 177, 281–296. [Google Scholar] [CrossRef]
- Skrede, G.; Storebakken, T.; Skrede, A.; Sahlstrøm, S.; Sørensen, M.; Shearer, K.D.; Slinde, E. Lactic acid fermentation of wheat and barley whole meal flours improves digestibility of nutrients and energy in Atlantic salmon (Salmo salar L.) diets. Aquaculture 2002, 210, 305–321. [Google Scholar] [CrossRef]
- Tanemura, N.; Akiyoshi, Y.; Okano, K.; Sugiura, S. Effects of culturing rapeseed meal, soybean meal, macrophyte meal, and algal meal with three species of white-rot fungi on their in vitro and in vivo digestibilities evaluated using rainbow trout. Aquaculture 2016, 453, 130–134. [Google Scholar] [CrossRef]
- Kawamoto, K.; Sakuma, M.; Tanaka, S.; Masuda, M.; Nakao-Muraoka, M.; Niida, Y.; Nakamatsu, Y.; Ito, M.; Taketani, Y.; Arai, H. High-fat diets provoke phosphorus absorption from the small intestine in rats. Nutrition 2020, 72, 110694. [Google Scholar] [CrossRef] [PubMed]
- Levi, M.; Gratton, E.; Forster, I.C.; Hernando, N.; Wagner, C.A.; Biber, J.; Sorribas, V.; Murer, H. Mechanisms of phosphate transport. Nat. Rev. Nephrol. 2019, 15, 482–500. [Google Scholar] [CrossRef]
- Manghat, P.; Sodi, R.; Swaminathan, R. Phosphate homeostasis and disorders. Ann. Clin. Biochem. 2014, 51, 631–656. [Google Scholar] [CrossRef]
- Sabbagh, Y.; Giral, H.; Caldas, Y.; Levi, M.; Schiavi, S.C. Intestinal phosphate transport. Adv. Chronic Kidney Dis. 2011, 18, 85–90. [Google Scholar] [CrossRef] [PubMed]
- Knöpfel, T.; Himmerkus, N.; Günzel, D.; Bleich, M.; Hernando, N.; Wagner, C.A. Paracellular transport of phosphate along the intestine. Am. J. Physiol. 2019, 317, G233–G241. [Google Scholar] [CrossRef]
- Saurette, M.; Alexander, R.T. Intestinal phosphate absorption: The paracellular pathway predominates? Exp. Biol. Med. 2019, 244, 646–654. [Google Scholar] [CrossRef] [PubMed]
- Danisi, G.; Murer, H. Inorganic phosphate absorption in small intestine. In Handbook of Physiology, The Gastrointestinal System; American Physiological Society: Bethesda, MD, USA, 1991; Volume 4, pp. 323–336. [Google Scholar] [CrossRef]
- Marks, J.; Debnam, E.S.; Unwin, R.J. Phosphate homeostasis and the renal-gastrointestinal axis. Am. J. Physiol. 2010, 299, F285–F296. [Google Scholar] [CrossRef]
- Sugiura, S.H.; Ferraris, R.P. Contributions of different NaPi cotransporter isoforms to dietary regulation of P transport in the pyloric caeca and intestine of rainbow trout. J. Exp. Biol. 2004, 207, 2055–2064. [Google Scholar] [CrossRef]
- Murer, H.; Hernando, N.; Forster, L.; Biber, J. Molecular mechanisms in proximal tubular and small intestinal phosphate reabsorption (plenary lecture). Mol. Membr. Biol. 2001, 18, 3–11. [Google Scholar] [CrossRef] [PubMed]
- Takeda, E.; Taketani, Y.; Morita, K.; Miyamoto, K. Sodium-dependent phosphate co-transporters. Int. J. Biochem. Cell Biol. 1999, 31, 377–381. [Google Scholar] [CrossRef] [PubMed]
- Nakamura, Y. In vitro absorption of inorganic phosphate and other electrolytes in the carp intestine. Comp. Biochem. Phys. A 1985, 80, 17–20. [Google Scholar] [CrossRef] [PubMed]
- Nakamura, Y. Sodium-dependent absorption of inorganic phosphate by the carp intestine. Comp. Biochem. Phys. A 1985, 80, 437–439. [Google Scholar] [CrossRef] [PubMed]
- Avila, E.M.; Tu, H.; Basantes, S.; Ferraris, R.P. Dietary phosphorus regulates intestinal transport and plasma concentrations of phosphate in rainbow trout. J. Comp. Physiol. B 2000, 170, 201–209. [Google Scholar] [CrossRef] [PubMed]
- Forster, I.C.; Wagner, C.A.; Busch, A.E.; Lang, F.; Biber, J.; Hernando, N.; Murer, H.; Werner, A. Electrophysiological characterization of the flounder type II Na+/Pi cotransporter (NaPi-5) expressed in Xenopus laevis oocytes. J. Membr. Biol. 1997, 160, 9–25. [Google Scholar] [CrossRef]
- Graham, C.; Nalbant, P.; Scholermann, B.; Hentschel, H.; Kinne, R.K.; Werner, A. Characterization of a type IIb sodium-phosphate cotransporter from zebrafish (Danio rerio) kidney. Am. J. Physiol. 2003, 284, F727–F736. [Google Scholar] [CrossRef] [PubMed]
- Kohl, B.; Herter, P.; Hulseweh, B.; Elger, M.; Hentschel, H.; Kinne, R.K.; Werner, A. Na-Pi cotransport in flounder: Same transport system in kidney and intestine. Am. J. Physiol. 1996, 270, F937–F944. [Google Scholar] [CrossRef]
- Nalbant, P.; Boehmer, C.; Dehmelt, L.; Wehner, F.; Werner, A. Functional characterization of a Na+-phosphate cotransporter (NaPi-II) from zebrafish and identification of related transcripts. J. Physiol. 1999, 520, 79–89. [Google Scholar] [CrossRef]
- Sugiura, S. Identification of intestinal phosphate transporters in fishes and shellfishes. Fish. Sci. 2009, 75, 99–108. [Google Scholar] [CrossRef]
- Verri, T.; Werner, A. Type II Na+-phosphate cotransporters and phosphate balance in teleost fish. Pflügers Arch. Eur. J. Physiol. 2019, 471, 193–212. [Google Scholar] [CrossRef] [PubMed]
- Werner, A.; Kinne, R.K. Evolution of the Na-Pi cotransport systems. Am. J. Physiol. 2001, 280, R301–R312. [Google Scholar] [CrossRef]
- Chen, P.; Tang, Q.; Wang, C. Characterizing and evaluating the expression of the type IIb sodium-dependent phosphate cotransporter (slc34a2) gene and its potential influence on phosphorus utilization efficiency in yellow catfish (Pelteobagrus fulvidraco). Fish Physiol. Biochem. 2016, 42, 51–64. [Google Scholar] [CrossRef] [PubMed]
- Chen, P.; Huang, Y.; Bayir, A.; Wang, C. Characterization of the isoforms of type IIb sodium-dependent phosphate cotransporter (Slc34a2) in yellow catfish, Pelteobagrus fulvidraco, and their vitamin D3-regulated expression under low-phosphate conditions. Fish Physiol. Biochem. 2017, 43, 229–244. [Google Scholar] [CrossRef]
- Carlile, M.; Nalbant, P.; Preston-Fayers, K.; McHaffie, G.S.; Werner, A. Processing of naturally occurring sense/antisense transcripts of the vertebrate Slc34a gene into short RNAs. Physiol. Genom. 2008, 34, 95–100. [Google Scholar] [CrossRef]
- Forster, I.; Hernando, N.; Sorribas, V.; Werner, A. Phosphate transporters in renal, gastrointestinal, and other tissues. Adv. Chronic Kidney Dis. 2011, 18, 63–76. [Google Scholar] [CrossRef]
- Piatek, M.J.; Henderson, V.; Zynad, H.S.; Werner, A. Natural antisense transcription from a comparative perspective. Genomics 2016, 108, 56–63. [Google Scholar] [CrossRef]
- Werner, A. Natural antisense transcripts. RNA Biol. 2005, 2, 53–62. [Google Scholar] [CrossRef]
- Werner, A.; Carlile, M.; Swan, D. What do natural antisense transcripts regulate? RNA Biol. 2009, 6, 43–48. [Google Scholar] [CrossRef]
- Ichida, Y.; Hosokawa, N.; Takemoto, R.; Koike, T.; Nakatogawa, T.; Hiranuma, M.; Arakawa, H.; Miura, Y.; Azabu, H.; Ohtomo, S.; et al. Significant species differences in intestinal phosphate absorption between dogs, rats, and monkeys. J. Nutr. Sci. Vitaminol. 2020, 66, 60–67. [Google Scholar] [CrossRef]
- Marks, J.; Srai, S.K.; Biber, J.; Murer, H.; Unwin, R.J.; Debnam, E.S. Intestinal phosphate absorption and the effect of vitamin D: A comparison of rats with mice. Exp. Physiol. 2006, 91, 531–537. [Google Scholar] [CrossRef] [PubMed]
- Radanovic, T.; Wagner, C.A.; Murer, H.; Biber, J. Regulation of intestinal phosphate transport I. Segmental expression and adaptation to low-Pi diet of the type IIb Na+-Pi cotransporter in mouse small intestine. Am. J. Physiol. 2005, 288, G496–G500. [Google Scholar] [CrossRef]
- Huber, K.; Walter, C.; Schroder, B.; Breves, G. Phosphate transport in the duodenum and jejunum of goats and its adaptation by dietary phosphate and calcium. Am. J. Physiol. 2002, 283, R296–R302. [Google Scholar] [CrossRef] [PubMed]
- Yan, F.; Angel, R.; Ashwell, C.M. Characterization of the chicken small intestine type IIb sodium phosphate cotransporter. Poult. Sci. 2007, 86, 67–76. [Google Scholar] [CrossRef] [PubMed]
- Nishimura, M.; Naito, S. Tissue-specific mRNA expression profiles of human solute carrier transporter superfamilies. Drug Metab. Pharmacok. 2008, 23, 22–44. [Google Scholar] [CrossRef] [PubMed]
- Sugiura, S.H.; McDaniel, N.K.; Ferraris, R.P. In vivo fractional Pi absorption and NaPi-II mRNA expression in rainbow trout are upregulated by dietary P restriction. Am. J. Physiol. 2003, 285, R770–R781. [Google Scholar] [CrossRef] [PubMed]
- Sugiura, S.H.; Kelsey, K.; Ferraris, R.P. Molecular conventional responses of large rainbow trout to dietary phosphorus restriction. J. Comp. Physiol. B 2007, 177, 461–472. [Google Scholar] [CrossRef] [PubMed]
- Laverty, G.; Clark, N.B. The kidney. In Vertebrate Endocrinology: Fundamentals and Biomedical Implications; Academic Press: New York, NY, USA, 1989; Volume 3, pp. 277–317. [Google Scholar]
- Møbjerg, N.; Werner, A.; Hansen, S.M.; Novak, I. Physiological and molecular mechanisms of inorganic phosphate handling in the toad Bufo bufo. Pflügers Arch. Eur. J. Physiol. 2007, 454, 101–113. [Google Scholar] [CrossRef] [PubMed]
- Hattenhauer, O.; Traebert, M.; Murer, H.; Biber, J. Regulation of small intestinal Na-Pi type IIb cotransporter by dietary phosphate intake. Am. J. Physiol. 1999, 277, G756–G762. [Google Scholar] [CrossRef]
- Huber, K.; Walter, C.; Schroder, B.; Biber, J.; Murer, H.; Breves, G. Epithelial phosphate transporters in small ruminants. Ann. N. Y. Acad. Sci. 2000, 915, 95–97. [Google Scholar] [CrossRef]
- Katai, K.; Miyamoto, K.; Kishida, S.; Segawa, H.; Nii, T.; Tanaka, H.; Tani, Y.; Arai, H.; Tatsumi, S.; Morita, K.; et al. Regulation of intestinal Na+-dependent phosphate co-transporters by a low-phosphate diet and 1,25-dihydroxyvitamin D3. Biochem. J. 1999, 343, 705–712. [Google Scholar] [CrossRef]
- Fleet, J.C.; Peacock, M. Physiology of vitamin D, calcium, and phosphate absorption. In The Physiological Basis of Metabolic Bone Disease; CRC Press: Boca Raton, FL, USA, 2014; pp. 13–40. [Google Scholar] [CrossRef]
- Candeal, E.; Caldas, Y.A.; Guillén, N.; Levi, M.; Sorribas, V. Intestinal phosphate absorption is mediated by multiple transport systems in rats. Am. J. Physiol. 2017, 312, G355–G366. [Google Scholar] [CrossRef]
- Coloso, R.M.; Basantes, S.P.; King, K.; Hendrix, M.A.; Fletcher, J.W.; Weis, P.; Ferraris, R.P. Effect of dietary phosphorus and vitamin D3 on phosphorus levels in effluent from the experimental culture of rainbow trout (Oncorhynchus mykiss). Aquaculture 2001, 202, 145–161. [Google Scholar] [CrossRef]
- Coloso, R.M.; King, K.; Fletcher, J.W.; Weis, P.; Werner, A.; Ferraris, R.P. Dietary P regulates phosphate transporter expression, phosphatase activity, and effluent P partitioning in trout culture. J. Comp. Physiol. B 2003, 173, 519–530. [Google Scholar] [CrossRef] [PubMed]
- Lake, J.; Gravel, C.; Koko, G.K.D.; Robert, C.; Vandenberg, G.W. Combining suppressive subtractive hybridization and cDNA microarrays to identify dietary phosphorus-responsive genes of the rainbow trout (Oncorhynchus mykiss) kidney. Comp. Biochem. Phys. D 2010, 5, 24–35. [Google Scholar] [CrossRef] [PubMed]
- Chen, K.; Jiang, W.D.; Wu, P.; Liu, Y.; Kuang, S.Y.; Tang, L.; Tang, W.N.; Zhang, Y.A.; Zhou, X.Q.; Feng, L. Effect of dietary phosphorus deficiency on the growth, immune function and structural integrity of head kidney, spleen and skin in young grass carp (Ctenopharyngodon idella). Fish Shellfish Immunol. 2017, 63, 103–126. [Google Scholar] [CrossRef] [PubMed]
- Dai, Y.S.; Pei, W.L.; Wang, Y.Y.; Wang, Z.; Zhuo, M.Q. Topology, tissue distribution, and transcriptional level of SLC34s in response to Pi and pH in grass carp Ctenopharyngodon idella. Fish Physiol. Biochem. 2021, 47, 1383–1393. [Google Scholar] [CrossRef]
- Zhuo, M.Q.; Lv, W.H.; Xu, Y.H.; Luo, Z. Isolation and characterization of three sodium-phosphate cotransporter genes and their transcriptional regulation in the grass carp Ctenopharyngodon idella. Int. J. Mol. Sci. 2020, 21, 8228. [Google Scholar] [CrossRef]
- Wang, Y.; Geng, Y.; Shi, X.; Wang, S.; Yang, Z.; Zhang, P.; Liu, H. Effects of dietary phosphorus levels on growth performance, phosphorus utilization and intestinal calcium and phosphorus transport-related genes expression of juvenile Chinese soft-shelled turtle (Pelodiscus sinensis). Animals 2022, 12, 3101. [Google Scholar] [CrossRef]
- IOM: Institute of Medicine. Dietary Reference Intakes for Calcium, Phosphorus, Magnesium, Vitamin D, and Fluoride; National Academies Press: Washington, DC, USA, 1997. [Google Scholar]
- Sabbagh, Y.; O’Brien, S.P.; Song, W.; Boulanger, J.H.; Stockmann, A.; Arbeeny, C.; Schiavi, S.C. Intestinal npt2b plays a major role in phosphate absorption and homeostasis. J. Am. Soc. Nephrol. 2009, 20, 2348–2358. [Google Scholar] [CrossRef]
- Nakamura, Y.; Hirano, T. Effect of hypophysectomy on absorption of inorganic phosphate by the eel intestine. Comp. Biochem. Phys. A 1986, 84, 595–599. [Google Scholar] [CrossRef]
- Christakos, S.; Dhawan, P.; Porta, A.; Mady, L.J.; Seth, T. Vitamin D and intestinal calcium absorption. Mol. Cell. Endocrinol. 2011, 347, 25–29. [Google Scholar] [CrossRef] [PubMed]
- Christakos, S.; Dhawan, P.; Verstuyf, A.; Verlinden, L.; Carmeliet, G. Vitamin D: Metabolism, molecular mechanism of action, and pleiotropic effects. Physiol. Rev. 2016, 96, 365–408. [Google Scholar] [CrossRef] [PubMed]
- Fujita, H.; Sugimoto, K.; Inatomi, S.; Maeda, T.; Osanai, M.; Uchiyama, Y.; Yamamoto, Y.; Wada, T.; Kojima, T.; Yokozaki, H.; et al. Tight junction proteins claudin-2 and-12 are critical for vitamin D-dependent Ca2+ absorption between enterocytes. Mol. Biol. Cell 2008, 19, 1912–1921. [Google Scholar] [CrossRef]
- Zhang, Y.G.; Wu, S.; Lu, R.; Zhou, D.; Zhou, J.; Carmeliet, G.; Petrof, E.; Claud, E.C.; Sun, J. Tight junction CLDN2 gene is a direct target of the vitamin D receptor. Sci. Rep. 2015, 5, 10642. [Google Scholar] [CrossRef]
- Chen, K.; Zhou, X.Q.; Jiang, W.D.; Wu, P.; Liu, Y.; Jiang, J.; Kuang, S.Y.; Tang, L.; Tang, W.N.; Zhang, Y.A.; et al. Impaired intestinal immune barrier and physical barrier function by phosphorus deficiency: Regulation of TOR, NF-κB, MLCK, JNK and Nrf2 signalling in grass carp (Ctenopharyngodon idella) after infection with Aeromonas hydrophila. Fish Shellfish Immunol. 2018, 74, 175–189. [Google Scholar] [CrossRef]
- Chen, K.; Zhou, X.Q.; Jiang, W.D.; Wu, P.; Liu, Y.; Jiang, J.; Kuang, S.Y.; Tang, L.; Tang, W.N.; Feng, L. Dietary phosphorus deficiency caused alteration of gill immune and physical barrier function in the grass carp (Ctenopharyngodon idella) after infection with Flavobacterium columnare. Aquaculture 2019, 506, 1–13. [Google Scholar] [CrossRef]
- Merrifield, D.L.; Ringø, E.; Myklebust, R.; Olsen, R.E. Dietary effect of soybean (Glycine max) products on gut histology and microbiota of fish. In Soybean and Nutrition; El-Shemy, H., Ed.; INTECH Open Access Publisher: London, UK, 2011; pp. 231–250. [Google Scholar]
- Kotler, B.M.; Kerstetter, J.E.; Insogna, K.L. Claudins, dietary milk proteins, and intestinal barrier regulation. Nutr. Rev. 2013, 71, 60–65. [Google Scholar] [CrossRef] [PubMed]
- Ulluwishewa, D.; Anderson, R.C.; McNabb, W.C.; Moughan, P.J.; Wells, J.M.; Roy, N. Regulation of tight junction permeability by intestinal bacteria and dietary components. J. Nutr. 2011, 141, 769–776. [Google Scholar] [CrossRef]
- Robertson, D.R. Regulation of calcium and phosphate by intestine. In Vertebrate Endocrinology: Fundamentals and Biomedical Implications; Academic Press: San Diego, CA, USA, 1989; pp. 243–275. [Google Scholar]
- Razzaque, M.S. Phosphate toxicity: New insights into an old problem. Clin. Sci. 2011, 120, 91–97. [Google Scholar] [CrossRef]
- Partridge, I.G. Studies on digestion and absorption in the intestines of growing pigs. 3. Net movements of mineral nutrients in the digestive tract. Br. J. Nutr. 1978, 39, 527–537. [Google Scholar] [CrossRef] [PubMed]
- Dabrowski, K.R.; Schwarz, F.J. Minerals content in the digestive tract of stomachless fish. Zool. Jb. Physiol. 1986, 90, 193–200. [Google Scholar]
- Snellgrove, D.L. Dietary Availability and Retention of Selected Minerals Associated with the Intensive Production of Rainbow Trout (Oncorhynchus mykiss). Ph.D. Thesis, University of Plymouth, Plymouth, UK, 2003; 294p. [Google Scholar]
- Nakajima, M.; Sugiura, S. Effects of dietary NaCl on the in vivo apparent absorption of dietary nutrients determined in rainbow trout (Oncorhynchus mykiss). Aquaculture 2016, 460, 1–7. [Google Scholar] [CrossRef]
- Bakke-McKellep, A.M.; Nordrum, S.; Krogdahl, Å.; Buddington, R.K. Absorption of glucose, amino acids, and dipeptides by the intestines of Atlantic salmon (Salmo salar L.). Fish Physiol. Biochem. 2000, 22, 33–44. [Google Scholar] [CrossRef]
- Tani, Y.; Sato, T.; Yamanaka-Okumura, H.; Yamamoto, H.; Arai, H.; Sawada, N.; Genjida, K.; Taketani, Y.; Takeda, E. Effects of prolonged high phosphorus diet on phosphorus and calcium balance in rats. J. Clin. Biochem. Nutr. 2007, 40, 221–228. [Google Scholar] [CrossRef]
- Werner, A.; Murer, H.; Kinne, R.K. Cloning and expression of a renal Na-Pi cotransport system from flounder. Am. J. Physiol. 1994, 267, F311–F317. [Google Scholar] [CrossRef] [PubMed]
- Elger, M.; Werner, A.; Herter, P.; Kohl, B.; Kinne, R.K.H.; Hentschel, H. Na-Pi cotransport sites in proximal tubule and collecting tubule of winter flounder (Pleuronectes americanus). Am. J. Physiol. 1998, 274, F374–F383. [Google Scholar] [CrossRef]
- Kohl, B.; Wagner, C.A.; Huelseweh, B.; Busch, A.E.; Werner, A. The Na+-phosphate cotransport system (NaPi-II) with a cleaved protein backbone: Implications on function and membrane insertion. J. Physiol. 1998, 508, 341–350. [Google Scholar] [CrossRef]
- Renfro, J.L. Solute transport by flounder renal cells in primary culture. Fish Physiol. 1995, 14, 147–171. [Google Scholar] [CrossRef]
- Renfro, J.L. Recent developments in teleost renal transport. J. Exp. Zool. A 1999, 283, 653–661. [Google Scholar] [CrossRef]
- Suyama, T.; Okada, S.; Ishijima, T.; Iida, K.; Abe, K.; Nakai, Y. High phosphorus diet-induced changes in NaPi-IIb phosphate transporter expression in the rat kidney: DNA microarray analysis. PLoS ONE 2012, 7, e29483. [Google Scholar] [CrossRef] [PubMed]
- Schultz, A.G.; Guffey, S.C.; Clifford, A.M.; Goss, G.G. Phosphate absorption across multiple epithelia in the Pacific hagfish (Eptatretus stoutii). Am. J. Physiol. 2014, 307, R643–R652. [Google Scholar] [CrossRef] [PubMed]
Figure 1.
Classification of dietary phosphorus (P) sources and their solubility and digestibility. Symbols: ● good; ○ low; — negligible. * Solubility of P: Soluble P may be susceptible to significant loss through leaching from the diet before ingestion by fish, with the greatest loss observed in micro-particulate diets. * Nucleic acids: RNA is far more digestible than DNA.

Figure 2.
Simple columnar epithelium of crucian carp intestine (H&E stain).
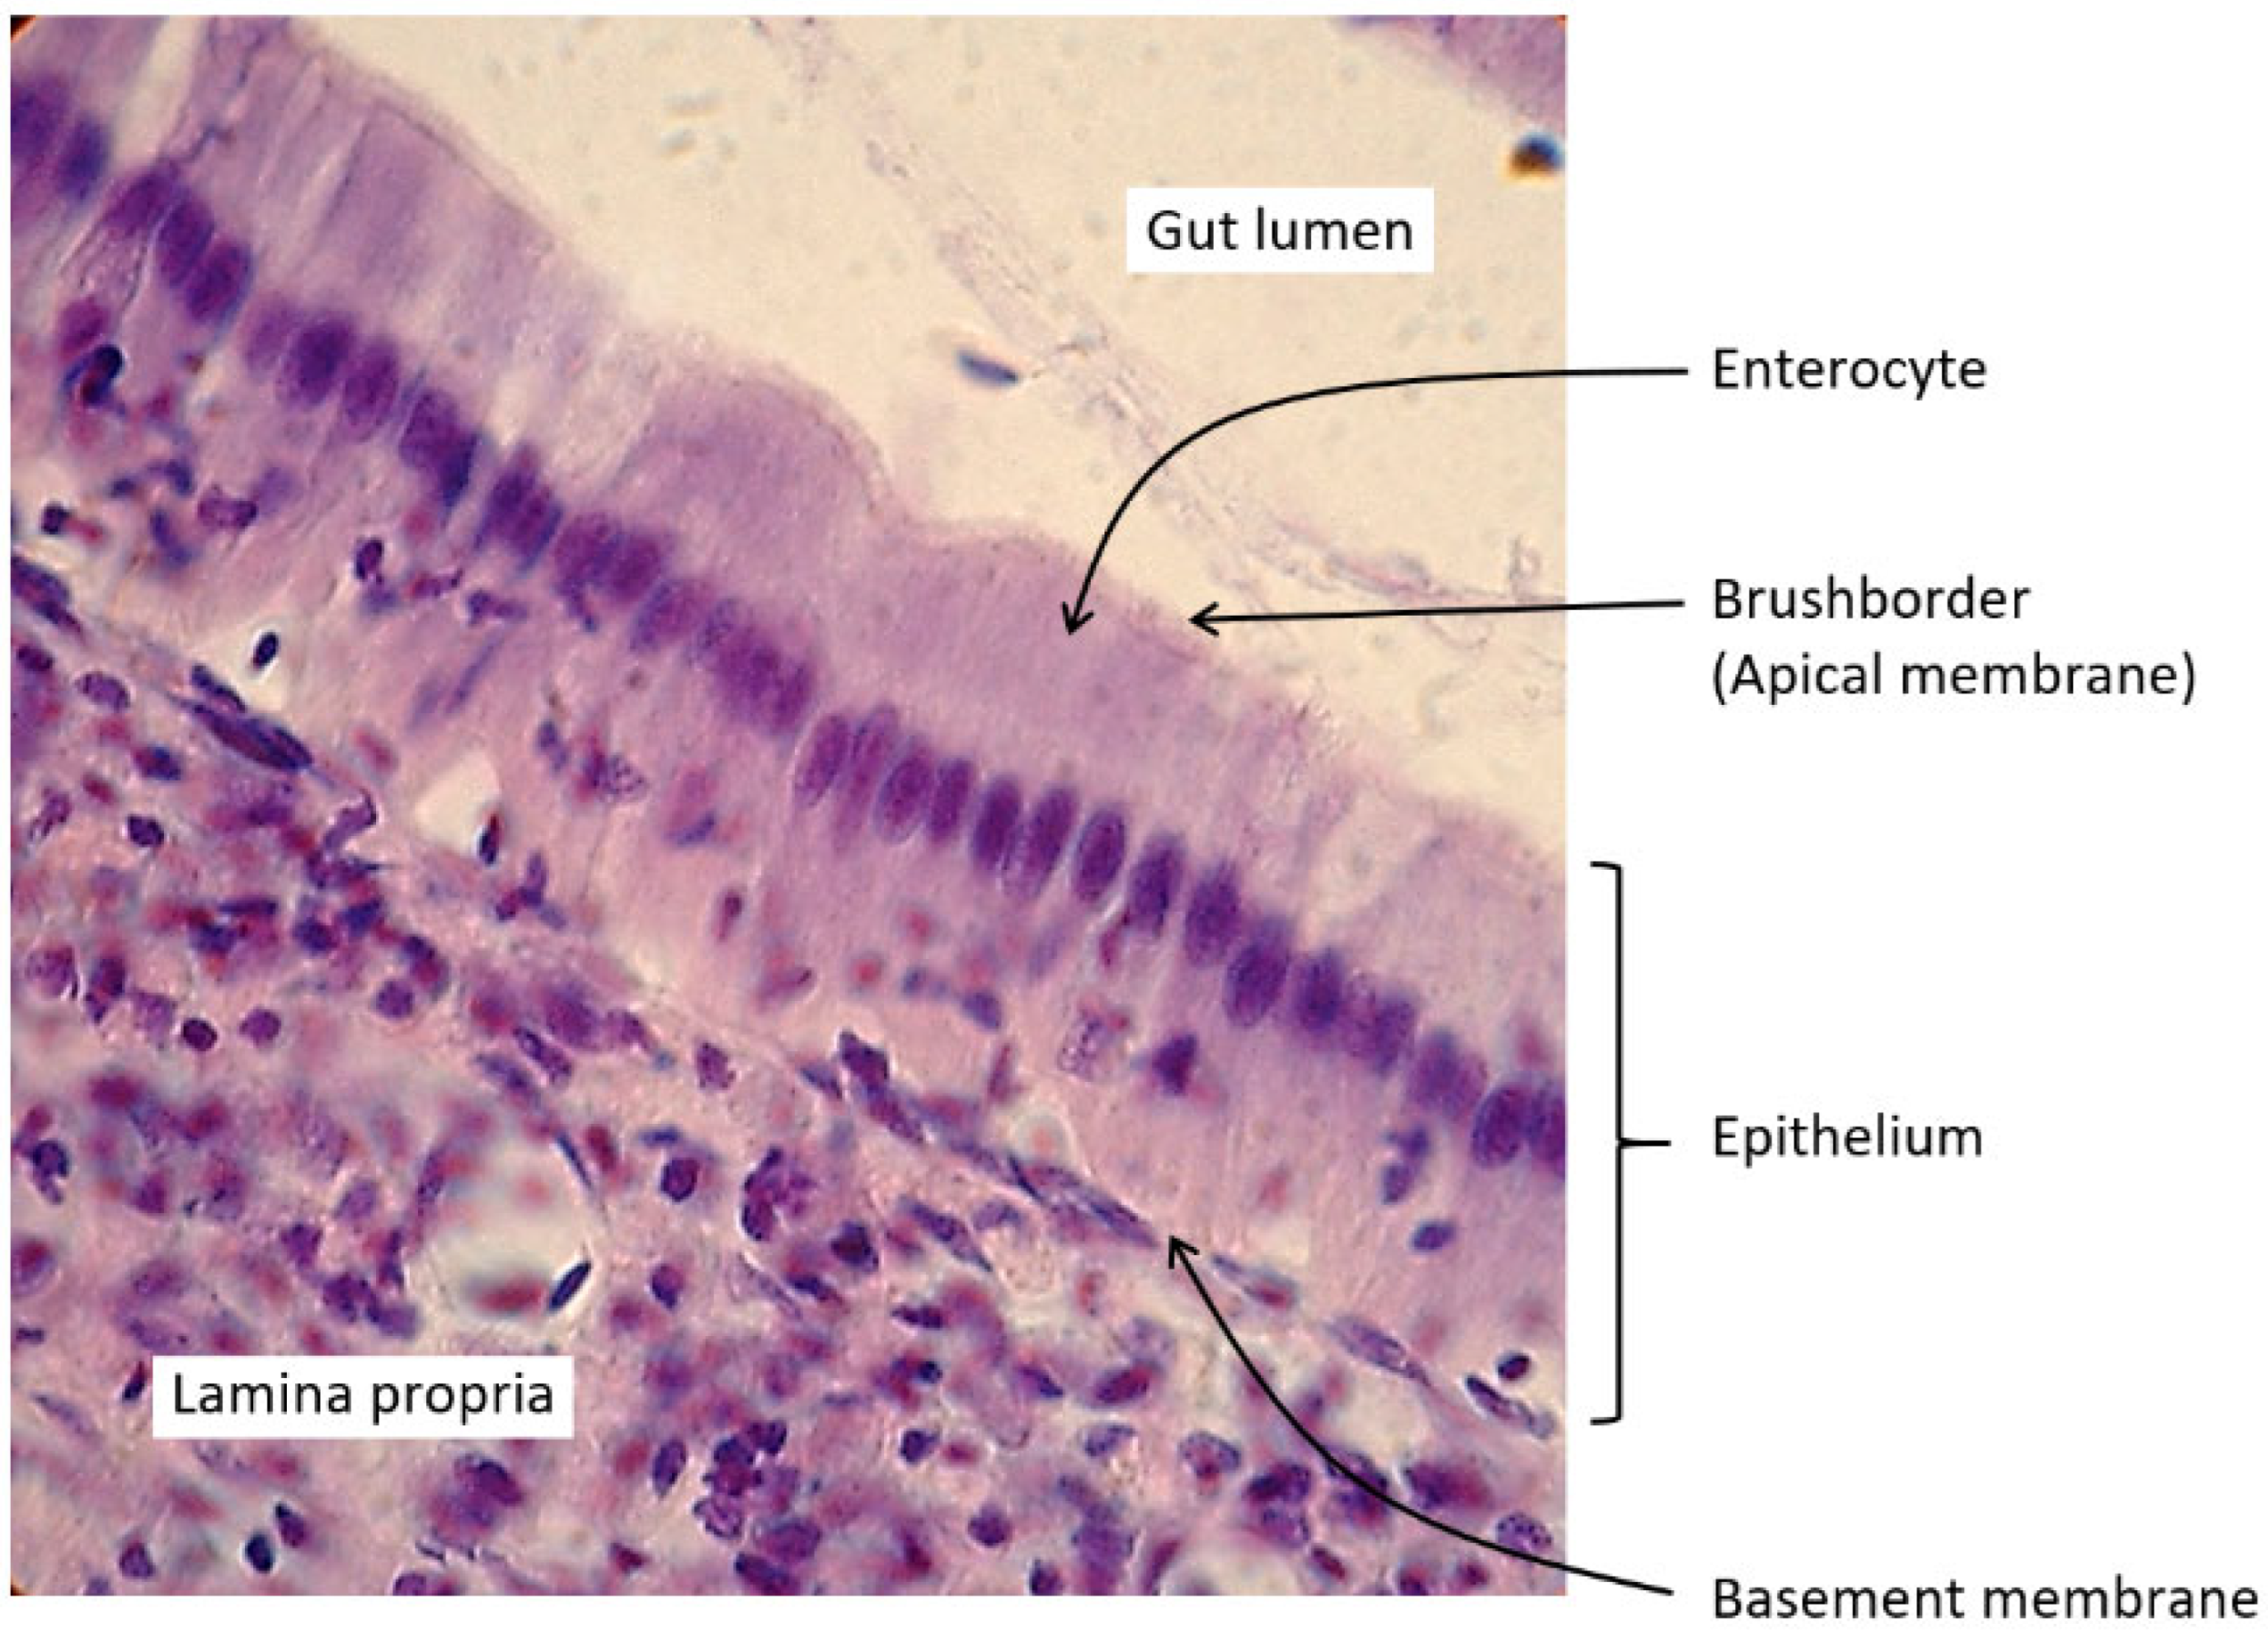
Figure 3.
Active and passive transport of inorganic phosphates (Pi) in the intestine.


Table 1.
Apparent digestibility of phosphorus (P) in various feed ingredients and supplements (based on data in Sugiura [4]).
Table 1.
Apparent digestibility of phosphorus (P) in various feed ingredients and supplements (based on data in Sugiura [4]).
| Ingredients and Total P Concentrations (%) * | Agastric Fish ** | Monogastric Fish ** | Other Species ** |
|---|---|---|---|
| Barley (whole grain): 0.33–0.42 | t37–79, a81, | p28–51, k35–72, p28–43 | |
| Blood meal: 0.08–0.30 | t100, m60, w58–72, | k100, p92 | |
| Canola meal: 1.01–1.11 | t12, v55, | p21 | |
| Casein: 0.75–0.82 | h97, | a92, t90, f90, v70, c53, | k100 |
| Corn (whole grain): 0.26–0.34 | g71, | n63, t36–37, f25–34, | p12–48, k0–80, p9–29 |
| Corn gluten meal: 0.34–0.54 | h0, | m57, a26, t2–17, v28–79, n97, e48, c16–19, r22, z83, j33, w70, q56, | p20, k50–70, p15–59 |
| Cottonseed meal: 0.98–1.17 | m41, n65, t53–56, f73, v53, d40, i28, q22, | k10–80, p0–42 | |
| Egg albumin: 0.11 | f71, b81, | ||
| Feather meal: 0.29–1.83 | m56, a77, e23, t28–84, c75, w61, | k100, p31 | |
| Fish meal (anchovy, sardine): 2.43–2.90 | g33, | t49–59, f40, v28, c47, z72, j58, | k100 |
| Fish meal (herring, capelin): 1.67–2.41 | a52–53, t44–58, e80–82, c57, | k100 | |
| Fish meal (menhaden): 2.88–3.61 | a87, t35–47, f39–46, c40, d23–48 | k100, p94 | |
| Fish meal (Peruvian): 2.92 | m65, e54, t44, v74–97, w71–79, q66, | ||
| Fish meal (brown fish meal) | h13,25,33, h1, | e75–78, t54–81, w82, i59, q53, | k100 |
| Fish meal (whitefish, cod): 3.03–3.50 | h10,18,26, h0, h4, | a79, t8–72, v65, c55–71, b29, w80, r60, i61, o64 | k78–100 |
| Fish meal (whitefish, high-ash): 7.41 | t12–17 | ||
| Fish meal (general, various) | n55, e49–63, t0, v73, w68 | p85, k83–102, p100 | |
| Lupin meal, extruded: 0.51 | a26, t62–100, u100, b91–100 | ||
| Meat and bone meal: 2.68–5.59 | m40, n53, e43, t22–46, f53, v58, d66, w62–64, q60, | k67–102, p64–102 | |
| Meat and bone meal (low-ash): 2.49 | t35, | k100 | |
| Meat meal: 2.76–3.88 | t3, e80–83, w64, | k100 | |
| Meat meal (low ash): 2.28 | t45, | ||
| Peas, extruded: 0.39 | t43, u100, | p45 | |
| Peanut meal: 0.59–0.65 | g70, | m45, v53, w58, o55, | k0–33, p12 |
| Poultry byproduct meal: 2.17–2.50 | t35–64, m57, n87, a81, e30, c68, d27, z94, | k100–101 | |
| Poultry byproduct meal (low-ash): 1.65–2.09 | t47–56, e60, v63, w60–62, | ||
| Rapeseed meal (solv. ext.): 1.01–1.11 | h35, | t26, m39, u49, i26, w56, q26, o52, | p23–32, k0–29, p16–21 |
| Rapeseed meal (heated) | t42, u65, | ||
| Rice bran: 1.61–2.06 | h25, | t19, n90, f51, | p12, k4–16, p25 |
| Sorghum: 0.27–0.29 | f36, | k0–33, p28 | |
| Soybean meal (solv. ext.): 0.64–0.76 | h11, g67, | m47, n44–88, a8–36, e36–59, t14–57, f27–54, v30–77, c28–43, d47, b82, r13, z88, i39, j28, w60, q42, o56, | p24–42, k3–43, p18–38 |
| Soybean meal (full fat): 0.59 | t20, q41, | k42 | |
| Soybean meal (de-phytinized) | t93, | ||
| Wheat: 0.32–0.39 | t17–69, f56, c50, d79, j31, | p40–74, k38–62, p49–69 | |
| Wheat middling: 0.53–0.93 | g54, | n71, a32, e–10, t55–61, f28–78, c41, | p28–41, k26, p34–41 |
| Wheat bran: 0.99–1.20 | p41, k23–49, p29–55 | ||
| Wheat germ: 0.99 | h57, | e19, t58, | |
| Wheat gluten meal: 0.26 | t62–75, c57, b73, | ||
| Yeast (brewer’s, dried): 1.44–1.72 | h93, | a79, e39, t69–91 | |
| Phosphoric acid H3PO4: 31.6 | k128, p100 | ||
| KH2PO4: 22.8, NaH2PO4∙nH2O: | h90–98, g90–91 | a94–95, t96–98, f90, b72–97, c93, y96, | s68, x67, p87–96, k96, p100 |
| Ca(H2PO4)2∙H2O: 24.6 | h93–94, g90, | a90, e47–65, t94, f94, b92, y92, i91, | s46, x73, p91, k99–100, p100–121 |
| Monocalcium phosphate (feed-grade) | p82–84 | ||
| Na2HPO4∙nH2O: K2HPO4: 17.8 | h97, | t64–94, b95, | |
| CaHPO4∙2H2O: 18.0 | h46–62, g60, | n46, a72, e66–71, t71, f65, b65, y59, | s19, x28, p32–87, k86–99, p62–107 |
| Dicalcium phosphate (feed-grade) | p74–82, k74–100 | ||
| Ca3(PO4)2: 20.0 | h6–13, g3, | a56, e42–60, t64, b44, y49, | s10, k93–100 |
| Tricalcium phosphate (feed-grade) | p48, k84 | ||
| Soft rock phosphate | p28–57, k38 | ||
| Defluorinated phosphate | p41, k69–96, p87–100 | ||
| Superphosphate, Triple superphosphate (agri-grade) | k93–96 | ||
| Monoammonium phosphate (feed-grade, agri-grade) | k100 | ||
| Ammonium polyphosphate | k95–118 | ||
| Bone meal (fish bone): 7.69 | t13–66, | ||
| Bone meal (unspecified): 12.9 | p68–85, k90–100, p82 | ||
| Phytates, phytin, phytic acid (IP6) | h5–38 | a0–15, e2, t0–19, f1, v50, b32, | k0–60, p25–40 |
* Total P concentrations (%) on an air-dry or as-fed basis. ** Values are apparent digestibility (%) determined by in vivo feeding experiments. Values in italic indicate relative availability (%) with bone ash or bone-breaking strength as response criteria. Species codes: a (Atlantic salmon); b (seabream); c (other salmonids); d (red drum); e (seabass, striped bass, hybrid bass), f (catfish); g (grass carp); h (carp); i (sucker), j (sole), k (chicken, turkey); m (snakehead); n (tambaqui); o (goby), p (pig), q (bagrid catfish), r (rockfish), s (shrimp, prawn); t (trout); u (turbot); v (tilapia); w (cobia), x (abalone), y (yellowtail), z (black bass).
Disclaimer/Publisher’s Note: The statements, opinions and data contained in all publications are solely those of the individual author(s) and contributor(s) and not of MDPI and/or the editor(s). MDPI and/or the editor(s) disclaim responsibility for any injury to people or property resulting from any ideas, methods, instructions or products referred to in the content. |
© 2024 by the author. Licensee MDPI, Basel, Switzerland. This article is an open access article distributed under the terms and conditions of the Creative Commons Attribution (CC BY) license (https://creativecommons.org/licenses/by/4.0/).
Share and Cite
MDPI and ACS Style
Sugiura, S.H. Digestion and Absorption of Dietary Phosphorus in Fish. Fishes 2024, 9, 324. https://doi.org/10.3390/fishes9080324
AMA Style
Sugiura SH. Digestion and Absorption of Dietary Phosphorus in Fish. Fishes. 2024; 9(8):324. https://doi.org/10.3390/fishes9080324
Chicago/Turabian StyleSugiura, Shozo H. 2024. "Digestion and Absorption of Dietary Phosphorus in Fish" Fishes 9, no. 8: 324. https://doi.org/10.3390/fishes9080324