1. Introduction
Thomson scattering (TS) is an important system for diagnosing electron temperature and density, not only in tokamaks [
1,
2,
3,
4,
5,
6,
7,
8,
9,
10,
11,
12] but also in stellarators [
13], amongst others [
14]. The hardware of a typical TS system mainly consists of a high-energy-pulsed laser, collection optics, fiber bundles, polychromators, a high-speed acquisition system, and a control system. The electron temperature and density are obtained by gaining the scattering spectrum from plasma and analyzing it with the incoherent Thomson scattering theory. However, Thomson scattering systems have difficulty obtaining scattered signals because of a sensitive dependence on the alignment between the laser path and the field of view (FOV) of the collection optics, the collection volume size, and the total optical transmission. These are the keys to the final Signal-to-Noise Ratio (SNR). They directly determine the strength of the light that arrives at detectors in a polychromator.
The HL-2A core TS system has a Nd: YAG (yttrium aluminum garnet) laser, which works at 1064 nm(wavelength)/30 Hz (repetition frequency)/3.5 J (energy)/10 ns (pulse width). However, the original collection’s optical lens of HL-2A TS was too small to capture enough scattering light from low-parameter plasma (1 keV and
). Its first-face aperture was only 152.04 mm. This resulted in a small collection volume size and few photons passing it and reaching the polychromator detector. Under this condition, only the very core TS measurement points could collect signals with available SNR. It was thus impossible to reach the required spatial resolution by using the old TS system on HL-2A [
2,
15,
16]. The collection optics are thus redesigned to have a bigger light-input aperture. The aims of the upgrade are to increase the amount of collected scattering light and try to obtain the profile information of the plasma, especially the equilibrium profile, which is the basis of the physics analysis.
The concept of the optical collection module is similar to the one of common camera lenses. Special attention was given to the design of the high light throughput. Therefore, lenses with bigger apertures and new fiber bundles (NA = 0.37) have been systematically designed. The new collection optics can increase the light throughput over three times and provide a spatial resolution with twenty-six fiber slots. In addition, A Y-type design of the fiber bundle has also been used to help us align the fiber end-face to the image of the laser beam [
17,
18]. Finally, an efficient data-processing code is adopted to quickly preview
after every experimental shoot.
2. Collection Lens
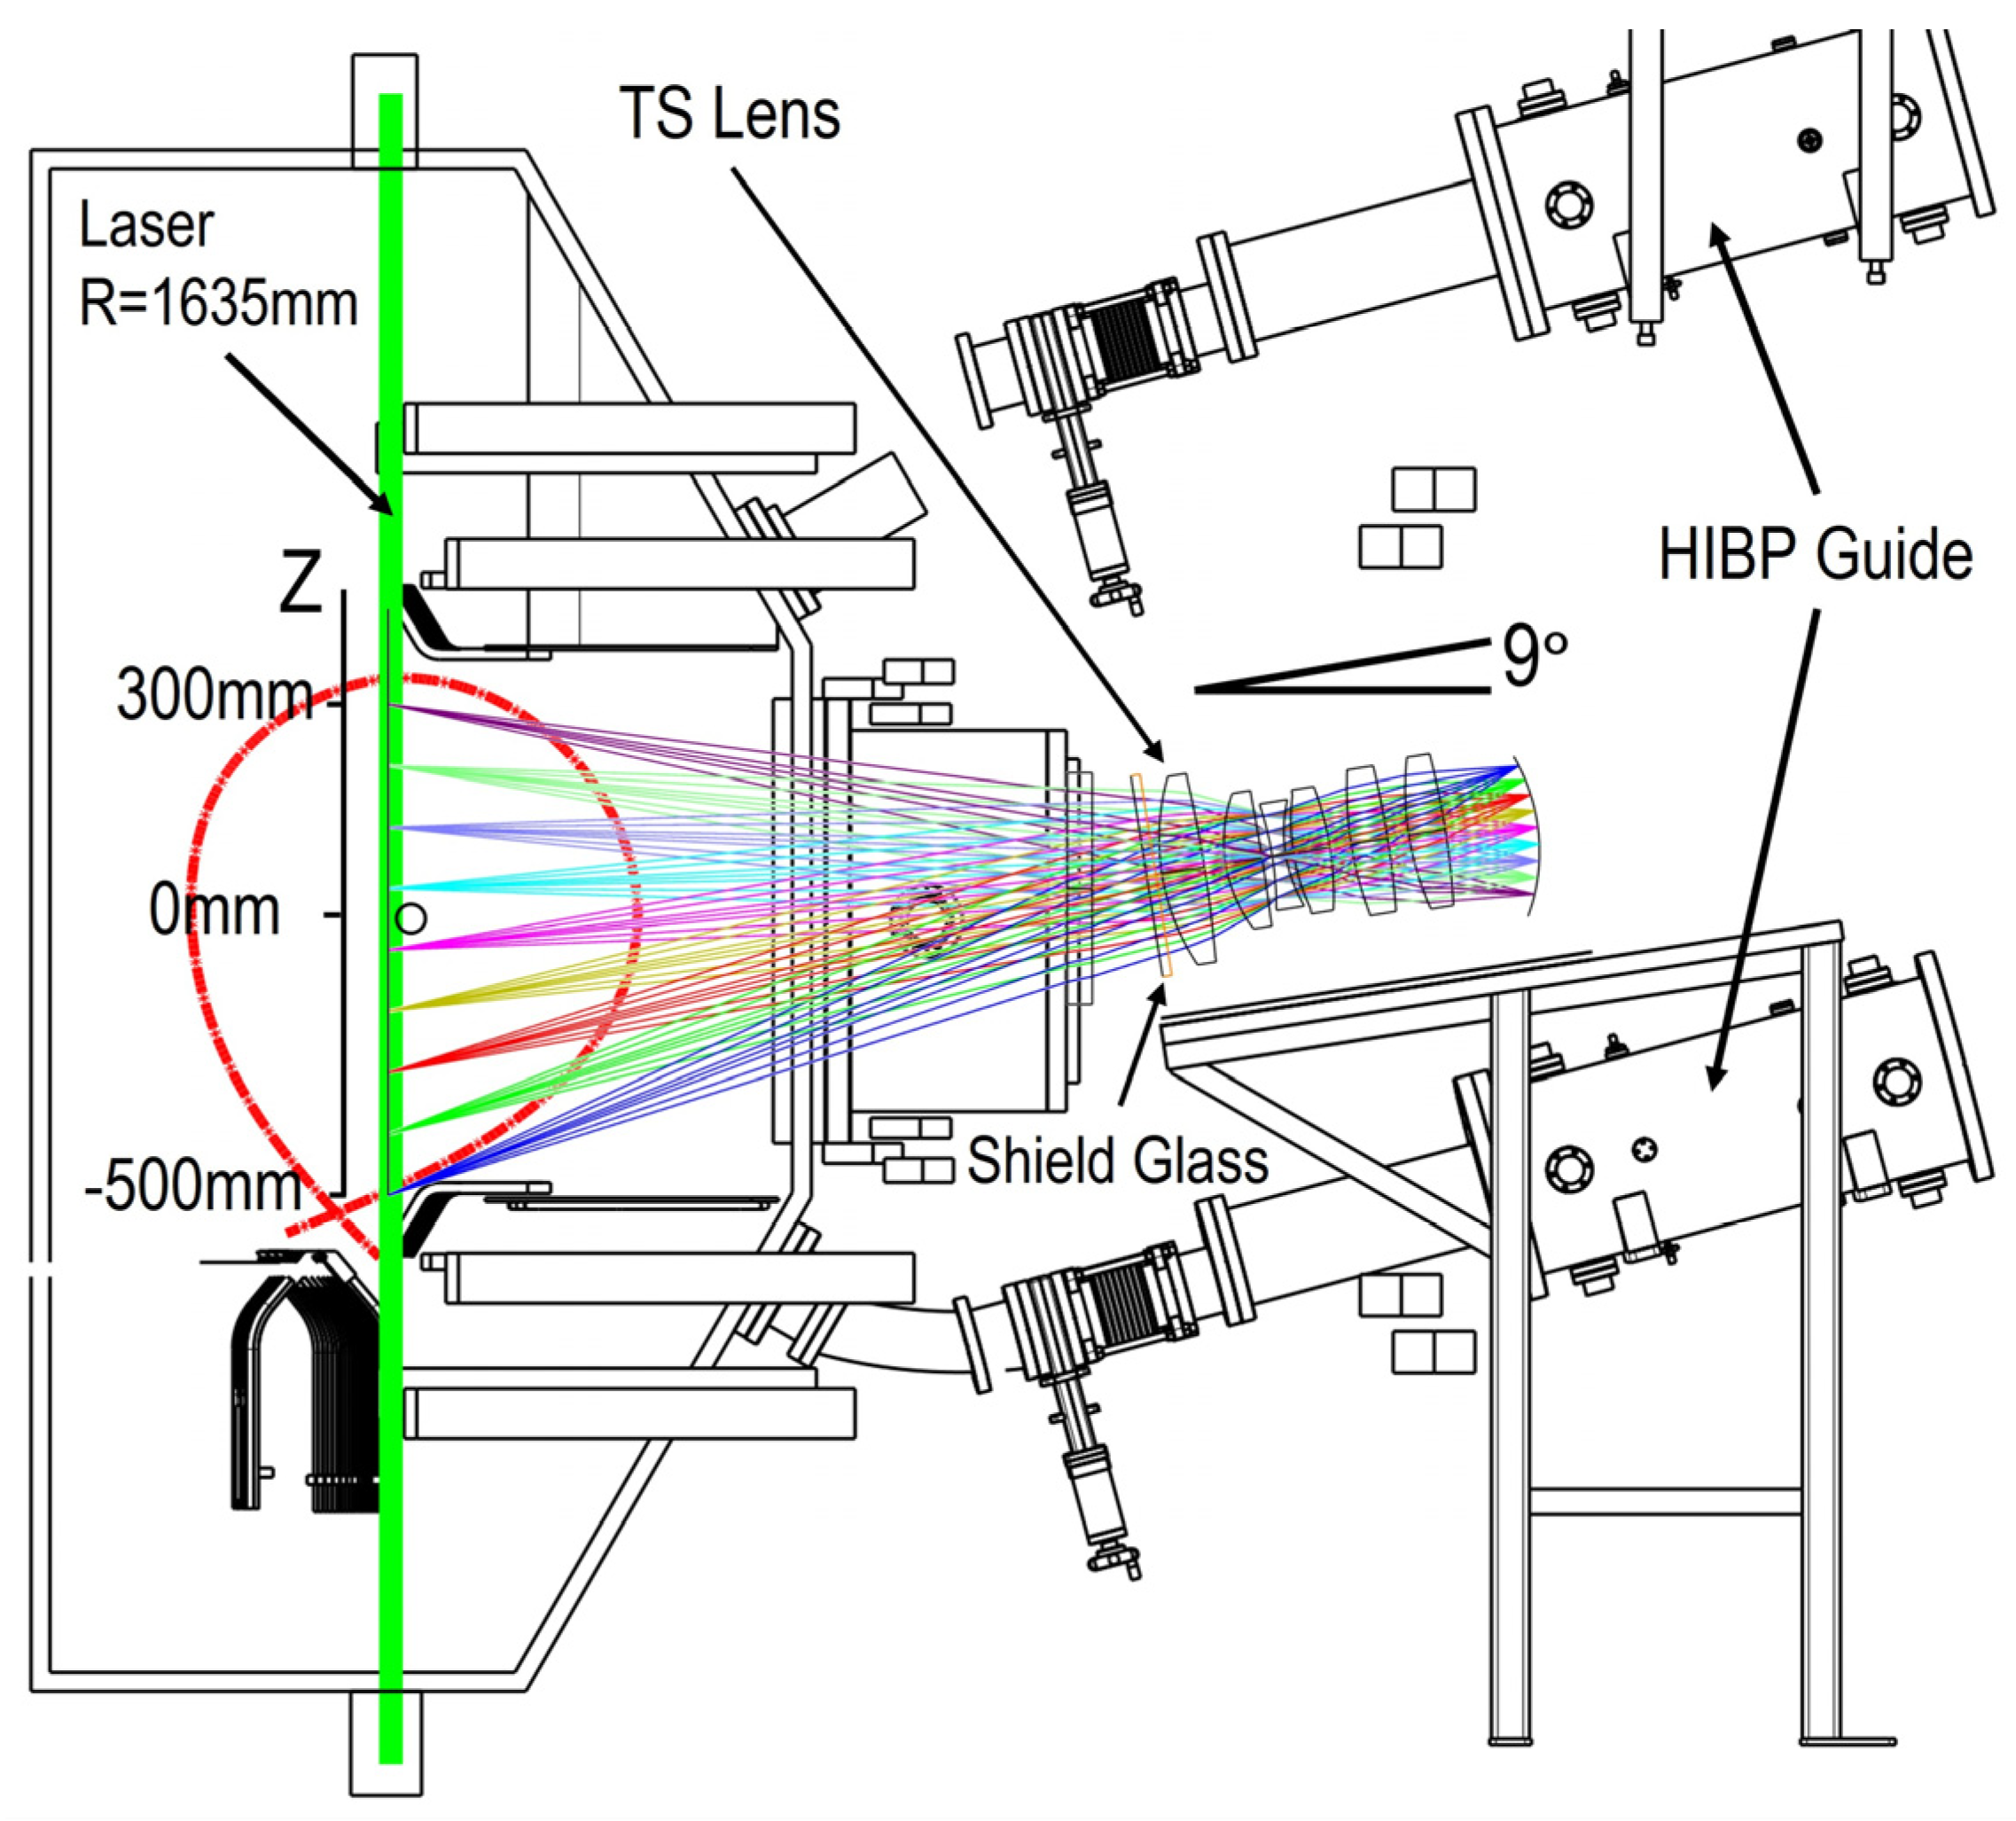
A 350 mm diameter window of silica glass, 1120 mm away from the laser path, has limited the largest FOV for the collection optics. To maximize the collection surface as much as possible and combine it with the newly built heavy ion beam probe (HIBP) system, the optical axis of the new lens is inclined at 9 degrees to the horizontal plane, as
Figure 1. shows. As shown in the layout in
Figure 1, the lens is based on a Cooke achromatic design and is composed of six single pieces [
19]. The height of the corresponding FOV is −500 mm to 300 mm from the midplane. Because the lens module is installed with a
slant angle to the midplane (Z = 0), the intersection point of the optical axis and laser has a value of Z = −100 mm. The FOV can thus cover the plasma downward to the down separatrix of HL-2A, and the length of the line along the laser-beam trajectory from the top to the bottom is
mm.
The design of the lens has also taken into consideration the cost of material fabrication. Three kinds of accessible commercial glass (BK7, H-K9L, and SF6) are chosen. Furthermore, the type of all the surfaces is set as a standard sphere face. The diameter of the first face of the lens is designed to be 310.125 mm, with a collection area that is ~4.1 times that of the old lens. The image surface is also a sphere face with a radius of 305.855 mm, which is simple to manufacture. Finally, the joint weight of the product of collection lenses and the assembled shell is ∼200 kg. The detailed parameters of lenses, such as the curvature, thickness, distance between lenses, refractive index, and mechanical dimensions, are listed in
Table 1.
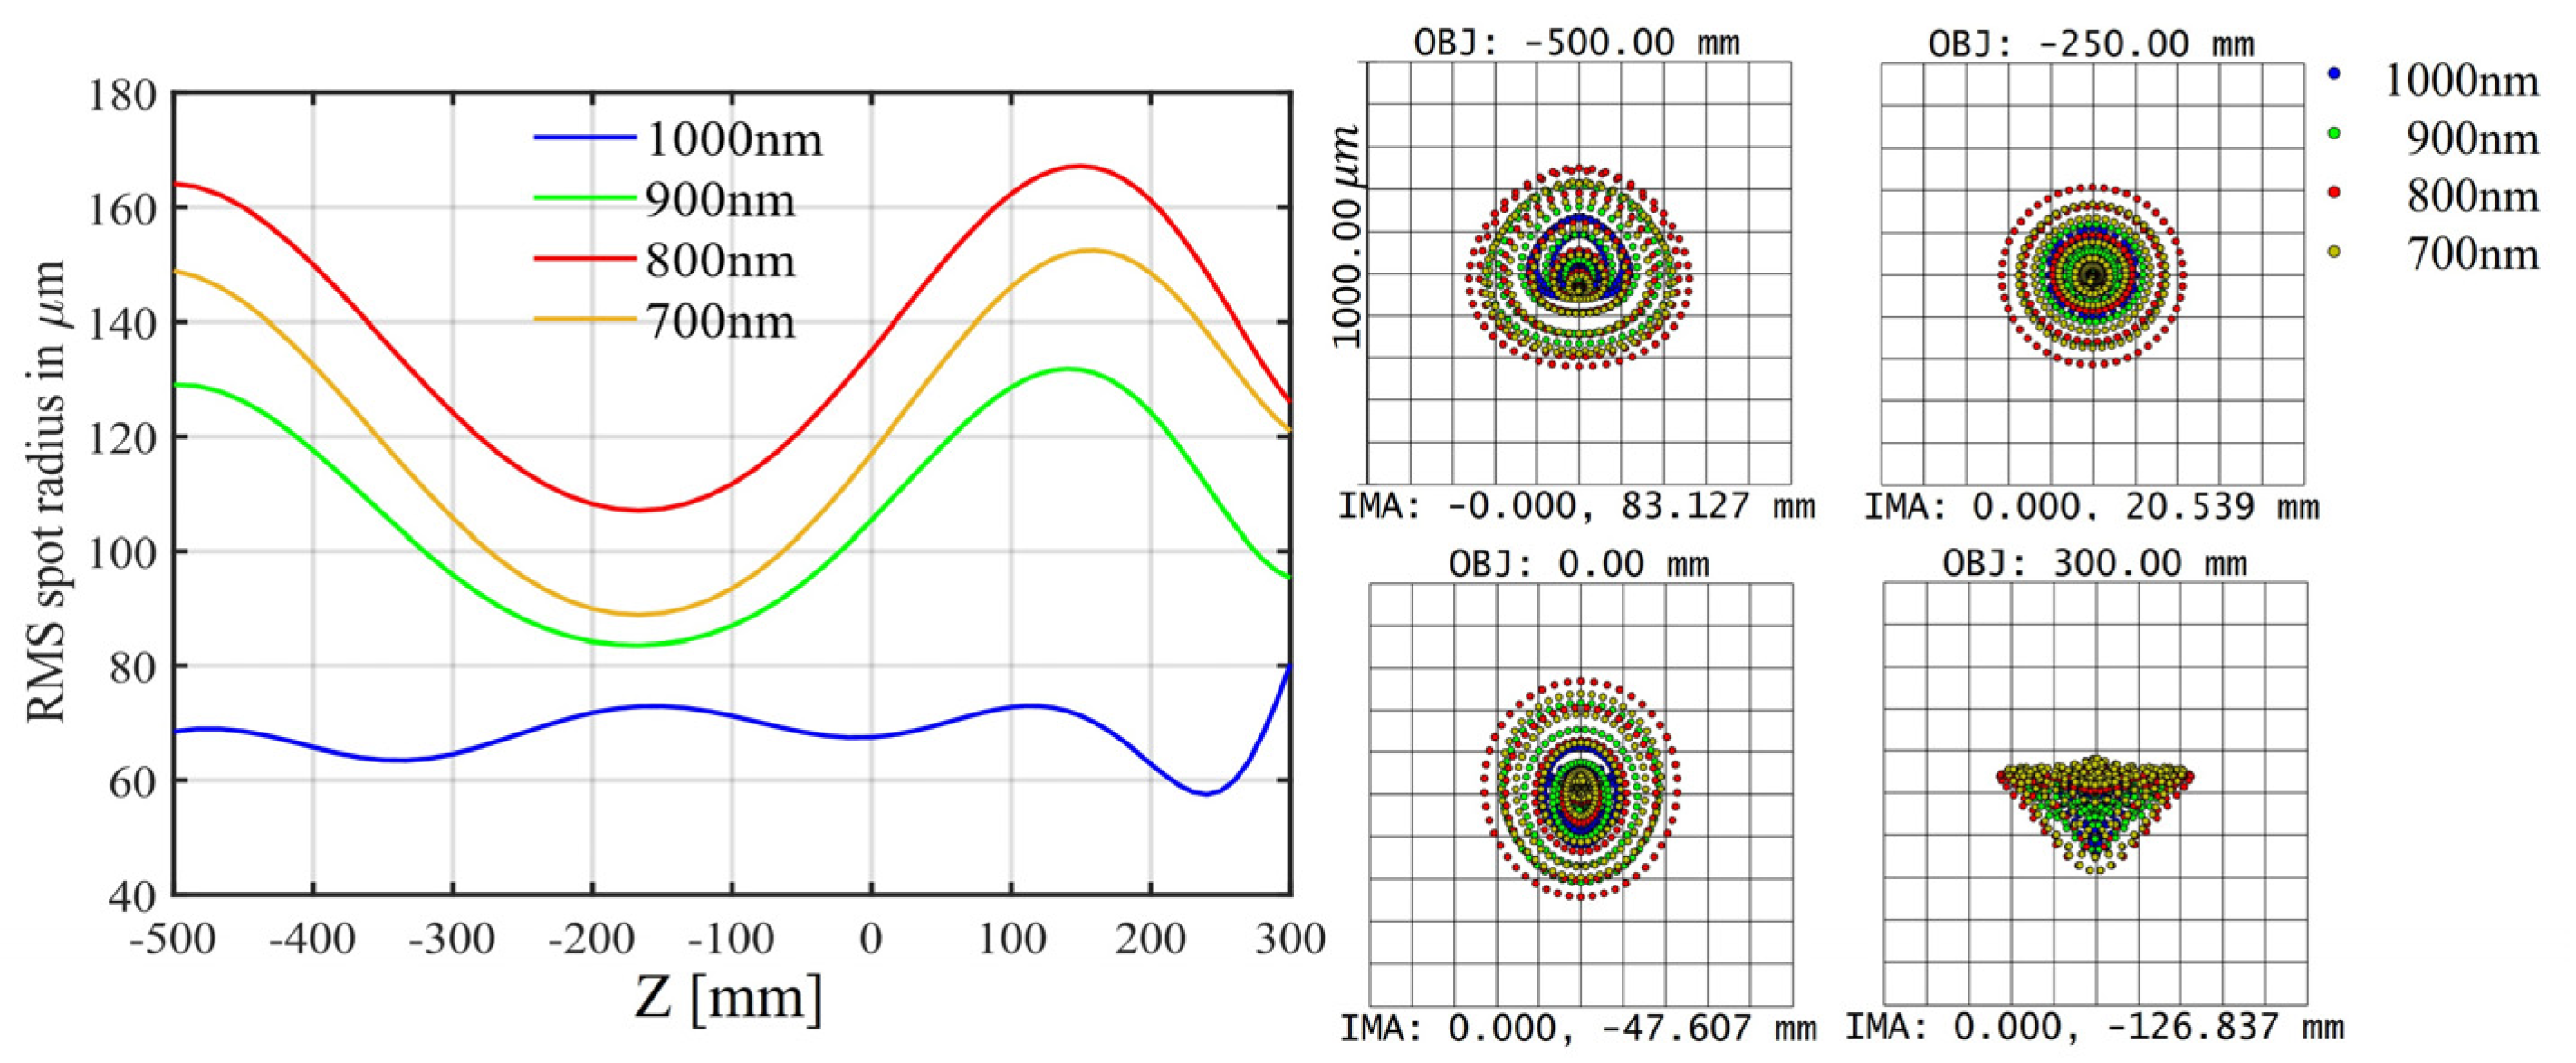
For the experimental configuration, the effective focal length in the image space is 324.219 mm, the working F number is 2.0473, and the paraxial magnification of the lens module is −0.279. The max image space NA is 0.2431. If there is no anti-reflection (AR) coating on the faces, the total transmission of the lens module and silica window is about 46%. Every surface is thus AR-coated for a wavelength of 500–1100 nm, which is expected to increase the total transmission to over 60%. The lens supplies a well-focused image, as shown in the root mean square (RMS) spot radius and spot diagram in
Figure 2. For wavelengths of 700 nm, 800 nm, 900 nm, and 1000 nm, the RMS radii are all smaller than 170
. Here, the RMS spot radius gives a rough idea of the spread of the rays; the distance between each ray and the reference point is squared and averaged over all the rays. It depends on every ray and thus encloses most of the energy. The spot diagrams of the corresponding TS spatial points are also small enough both on and off the axis. As the vignetting diagram shows in
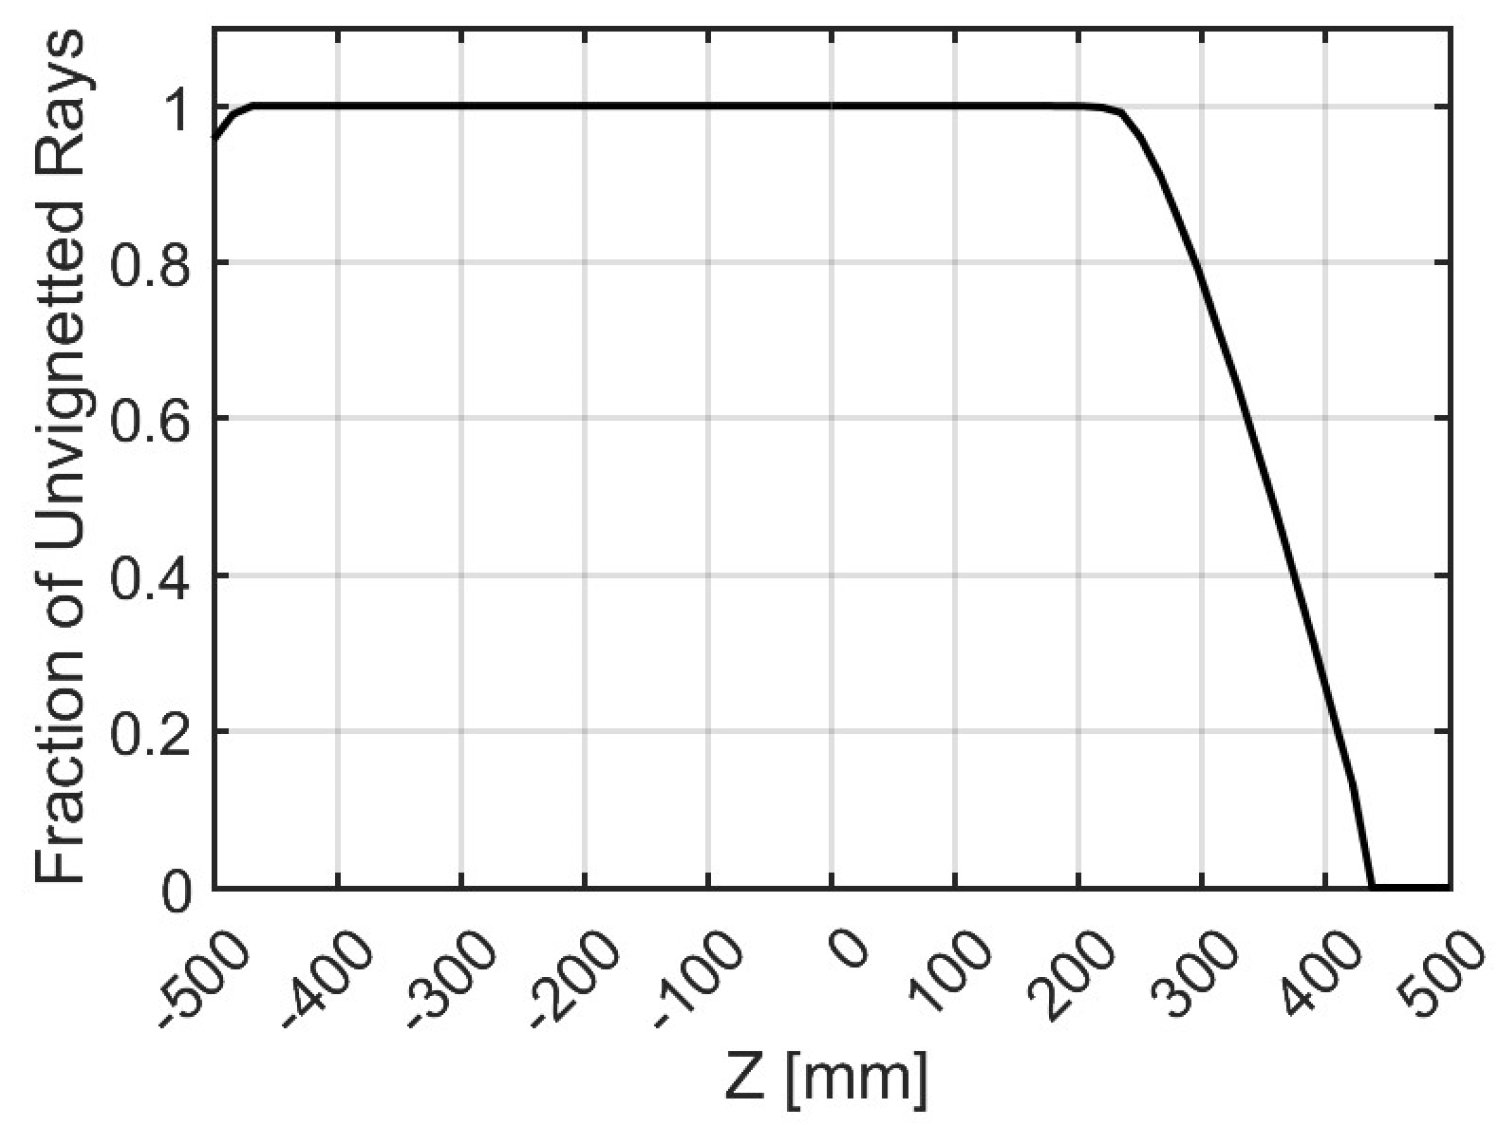
Figure 3, the collection’s optic lens can also present a vignetting under 10% at 300 mm. In other words, most images of the spatial points in the FOV are clear enough and lose little energy.
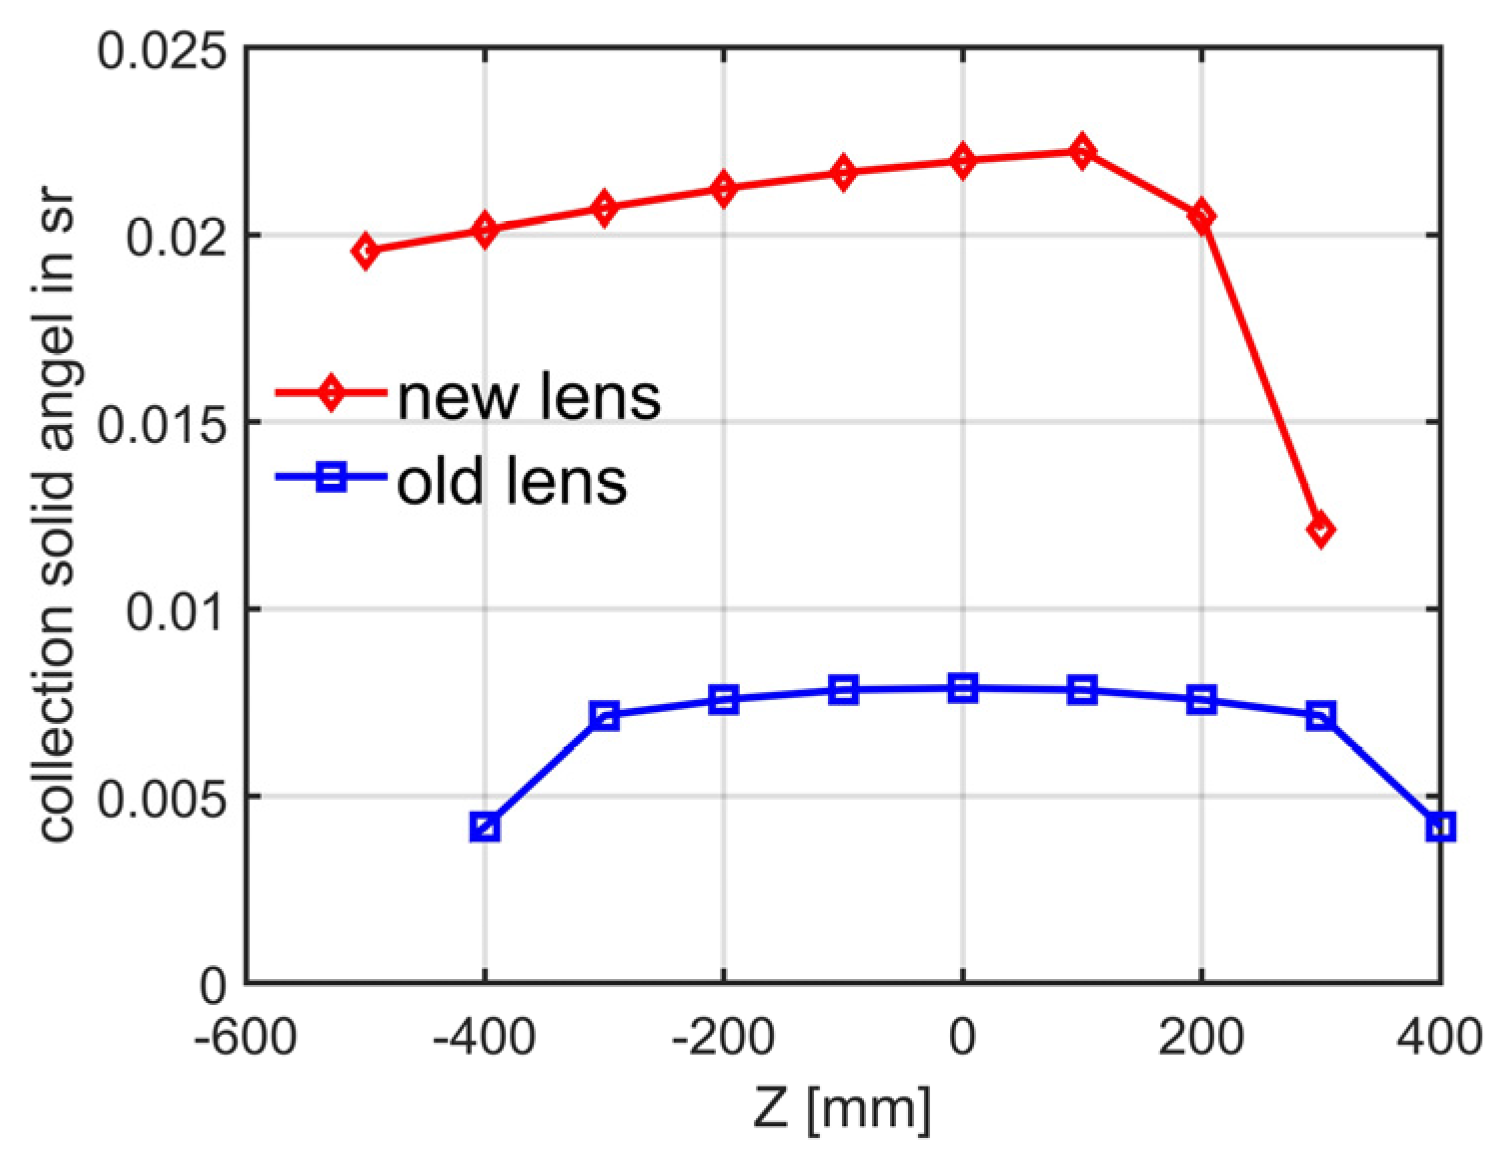
When other parts of the TS system remain the same, the increase of the input solid angle is the key to higher SNR. As a comparison, the old lens was much smaller. The maximum aperture of the old lens was only 152.036 mm. Although the image quality was a little better, the FOV and the amount of light input were much smaller. The FOV of the old one could not cover an area other than ±400 mm. Correspondingly, a comparison of the collection solid angle versus FOV can be found in
Figure 4. The solid angle of the old one was too small to capture enough photons for high SNR signals. Additionally, the new lens can supply about a threefold larger collection solid angle.
3. Fiber Bundles
To transmit as much light as possible from the laser-beam image to the polychromator, a kind of low hydroxyl quartz fiber was used. It has a uniform and high transmission (>99%/m) over a wavelength ranging from 600 nm to 1100 nm. Its NA equals 0.37, and it can thus have the margin to cover the image solid angle of the optical lens. It is also cheaper and just right for the input design of the polychromator. Its core diameter is and the total diameter including cladding is .
To capture the light at the image face, a fiber-bundle clamping apparatus, which holds fiber bundles, is installed on a goniometric rotation stage that stands on a linear stage. The two operational dimensions are both perpendicular to the light axis to make an intensive movement. The clamping apparatus consists of two curved aluminum parts with a radius of 305.855 mm, forming a column of slots between them. The fiber bundles can be inserted into these slots, and the end-face can then locate exactly where the laser-beam image is. Because of gaps for inserting fiber bundles, the module can hold 26 fiber bundles of two types, as shown by the design and pictures in
Figure 5. The length of the two types of bundles is 23 m in both cases. The two end-faces of the fiber bundles are also AR-coated to decrease face reflection. However, a small proportion of fibers were broken during production and installation.
The first type is the Y-type. This type of bundle is divided into two channels according to the left and right sides of the image [
17,
18]. At side A (defined as the input side), ~160 fibers are contained in a square face in a side of 3 mm. At side B (defined as the output side), the fibers from the left and right sides of side A are reshaped into a circular interface to match the energy monitor. Each channel of side B has ~80 fibers. The energy monitor thus has two channels. To satisfy the response-time requirement, it uses the same avalanche photodiode detectors (APD) as other polychromators but without channel filters. However, a narrow-band notch filter for 1064 nm remains in order to suppress stray light. Therefore, we can compare the strength of scattering light from the two sides by using the two-channel energy monitor. When the fiber end-face is exactly aligned with the laser-beam image, the light intensity at the two halves should be equal. Two bundles of this type are set near the up and down edges of the clamping apparatus to ensure that the curved fiber input face is parallel to the image.
The other type of fiber bundle, which is designed for actual TS measurements, holds 112 fibers. Its side A is arranged in a rectangle measuring to collect scattering light along the image face of the laser beam. A bundle corresponds to approximately 1.5~2 cm of plasma along the laser beam. It must also be noted that the laser within the FOV should be focused and thinner than 7 mm. Its image can then be completely covered by the bundle end-face because the magnification of the lens module is ~0.279. At side B of the polychromator entrance, the bundle head is cylindrical with a 3 mm diameter.
4. Data Preview Code
The upgrades of the collection optics can increase the detected scattering signal from ~60 mV up to ~200 mV under the condition of the same environment temperature, same ADP voltage configuration, and similar plasma parameters (
).
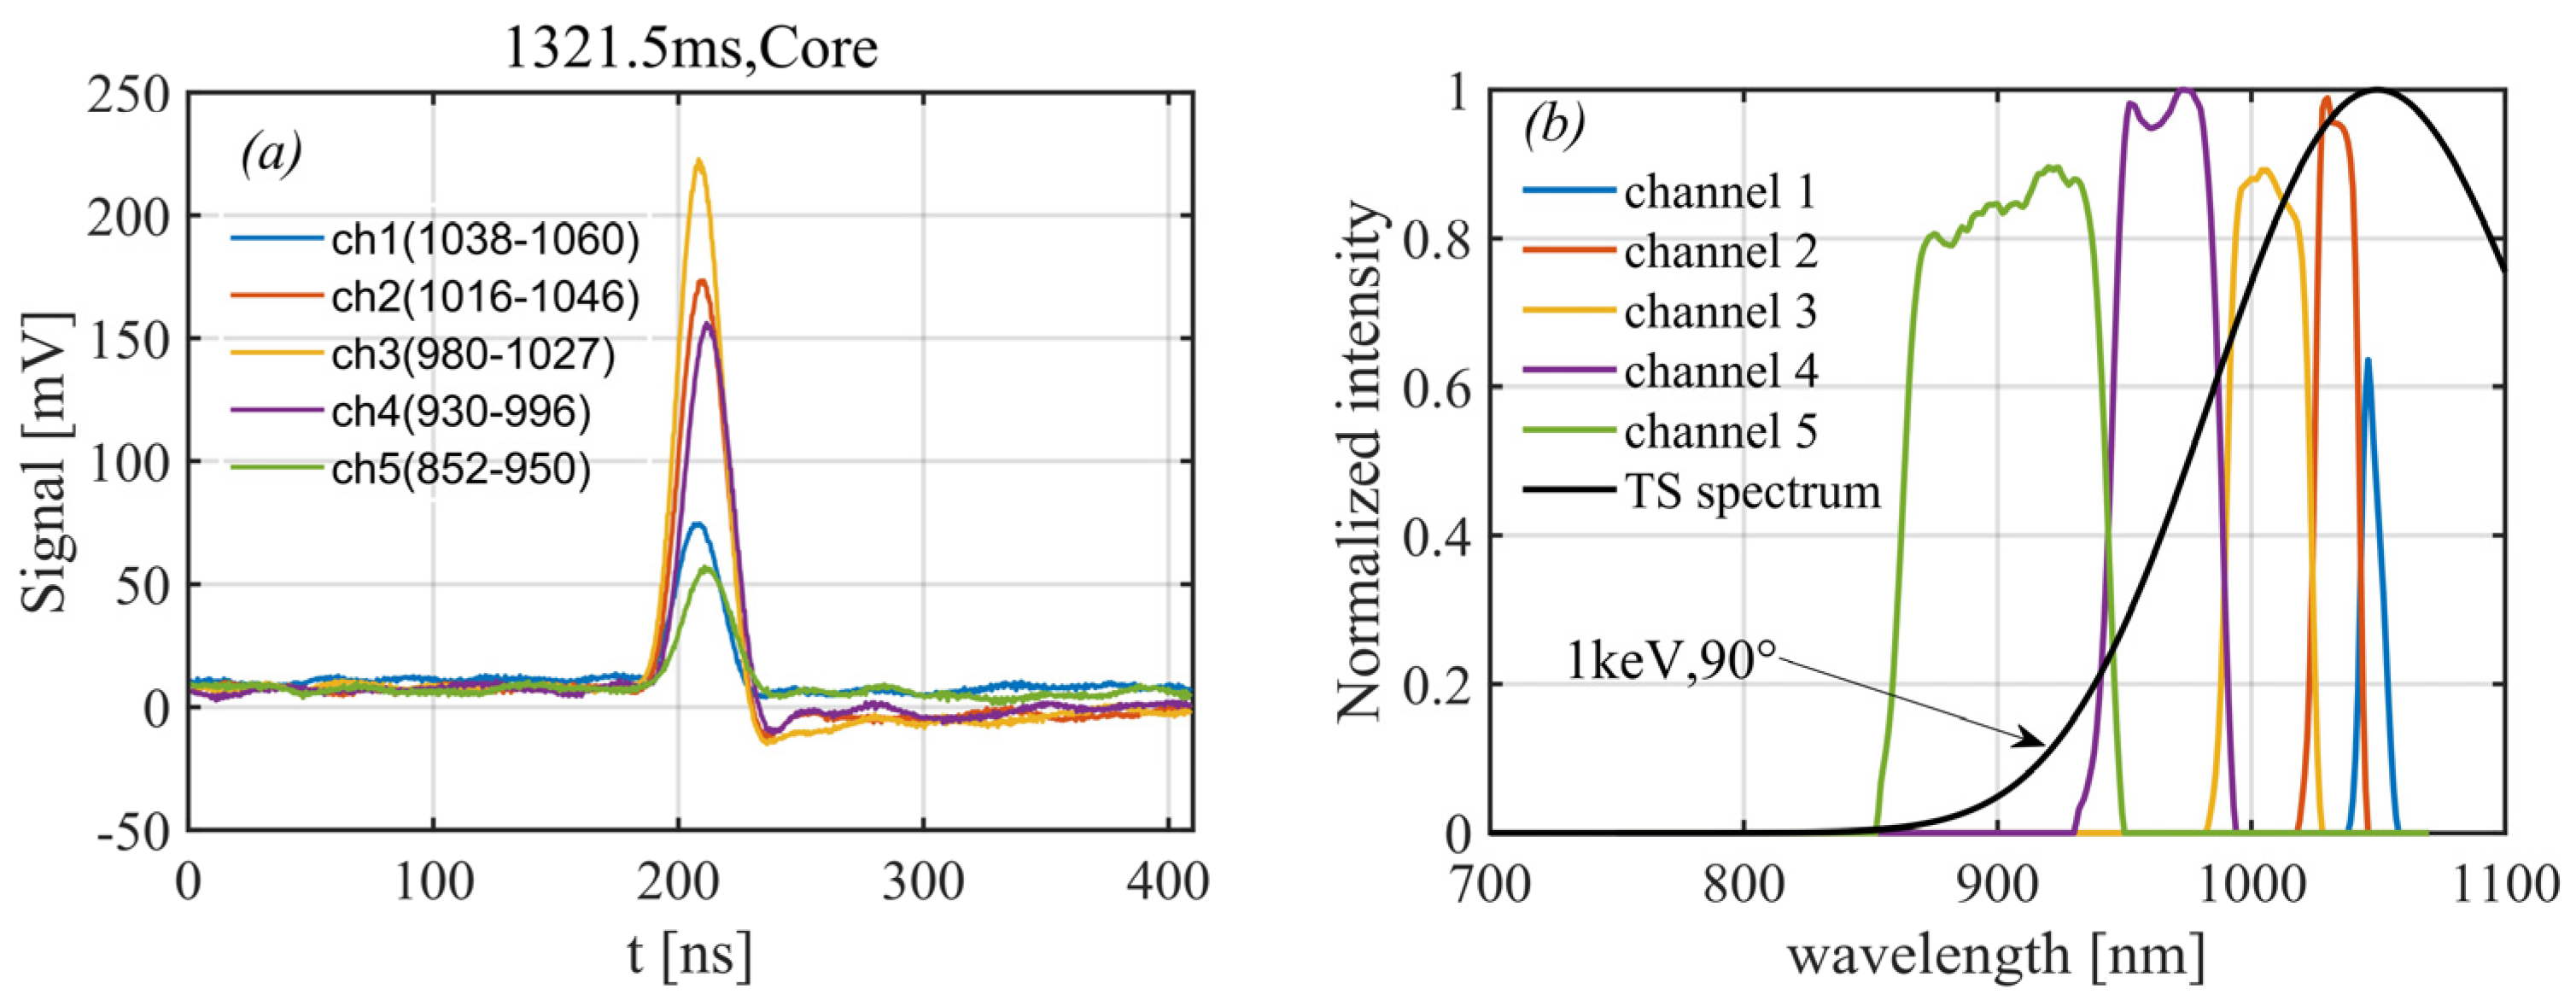
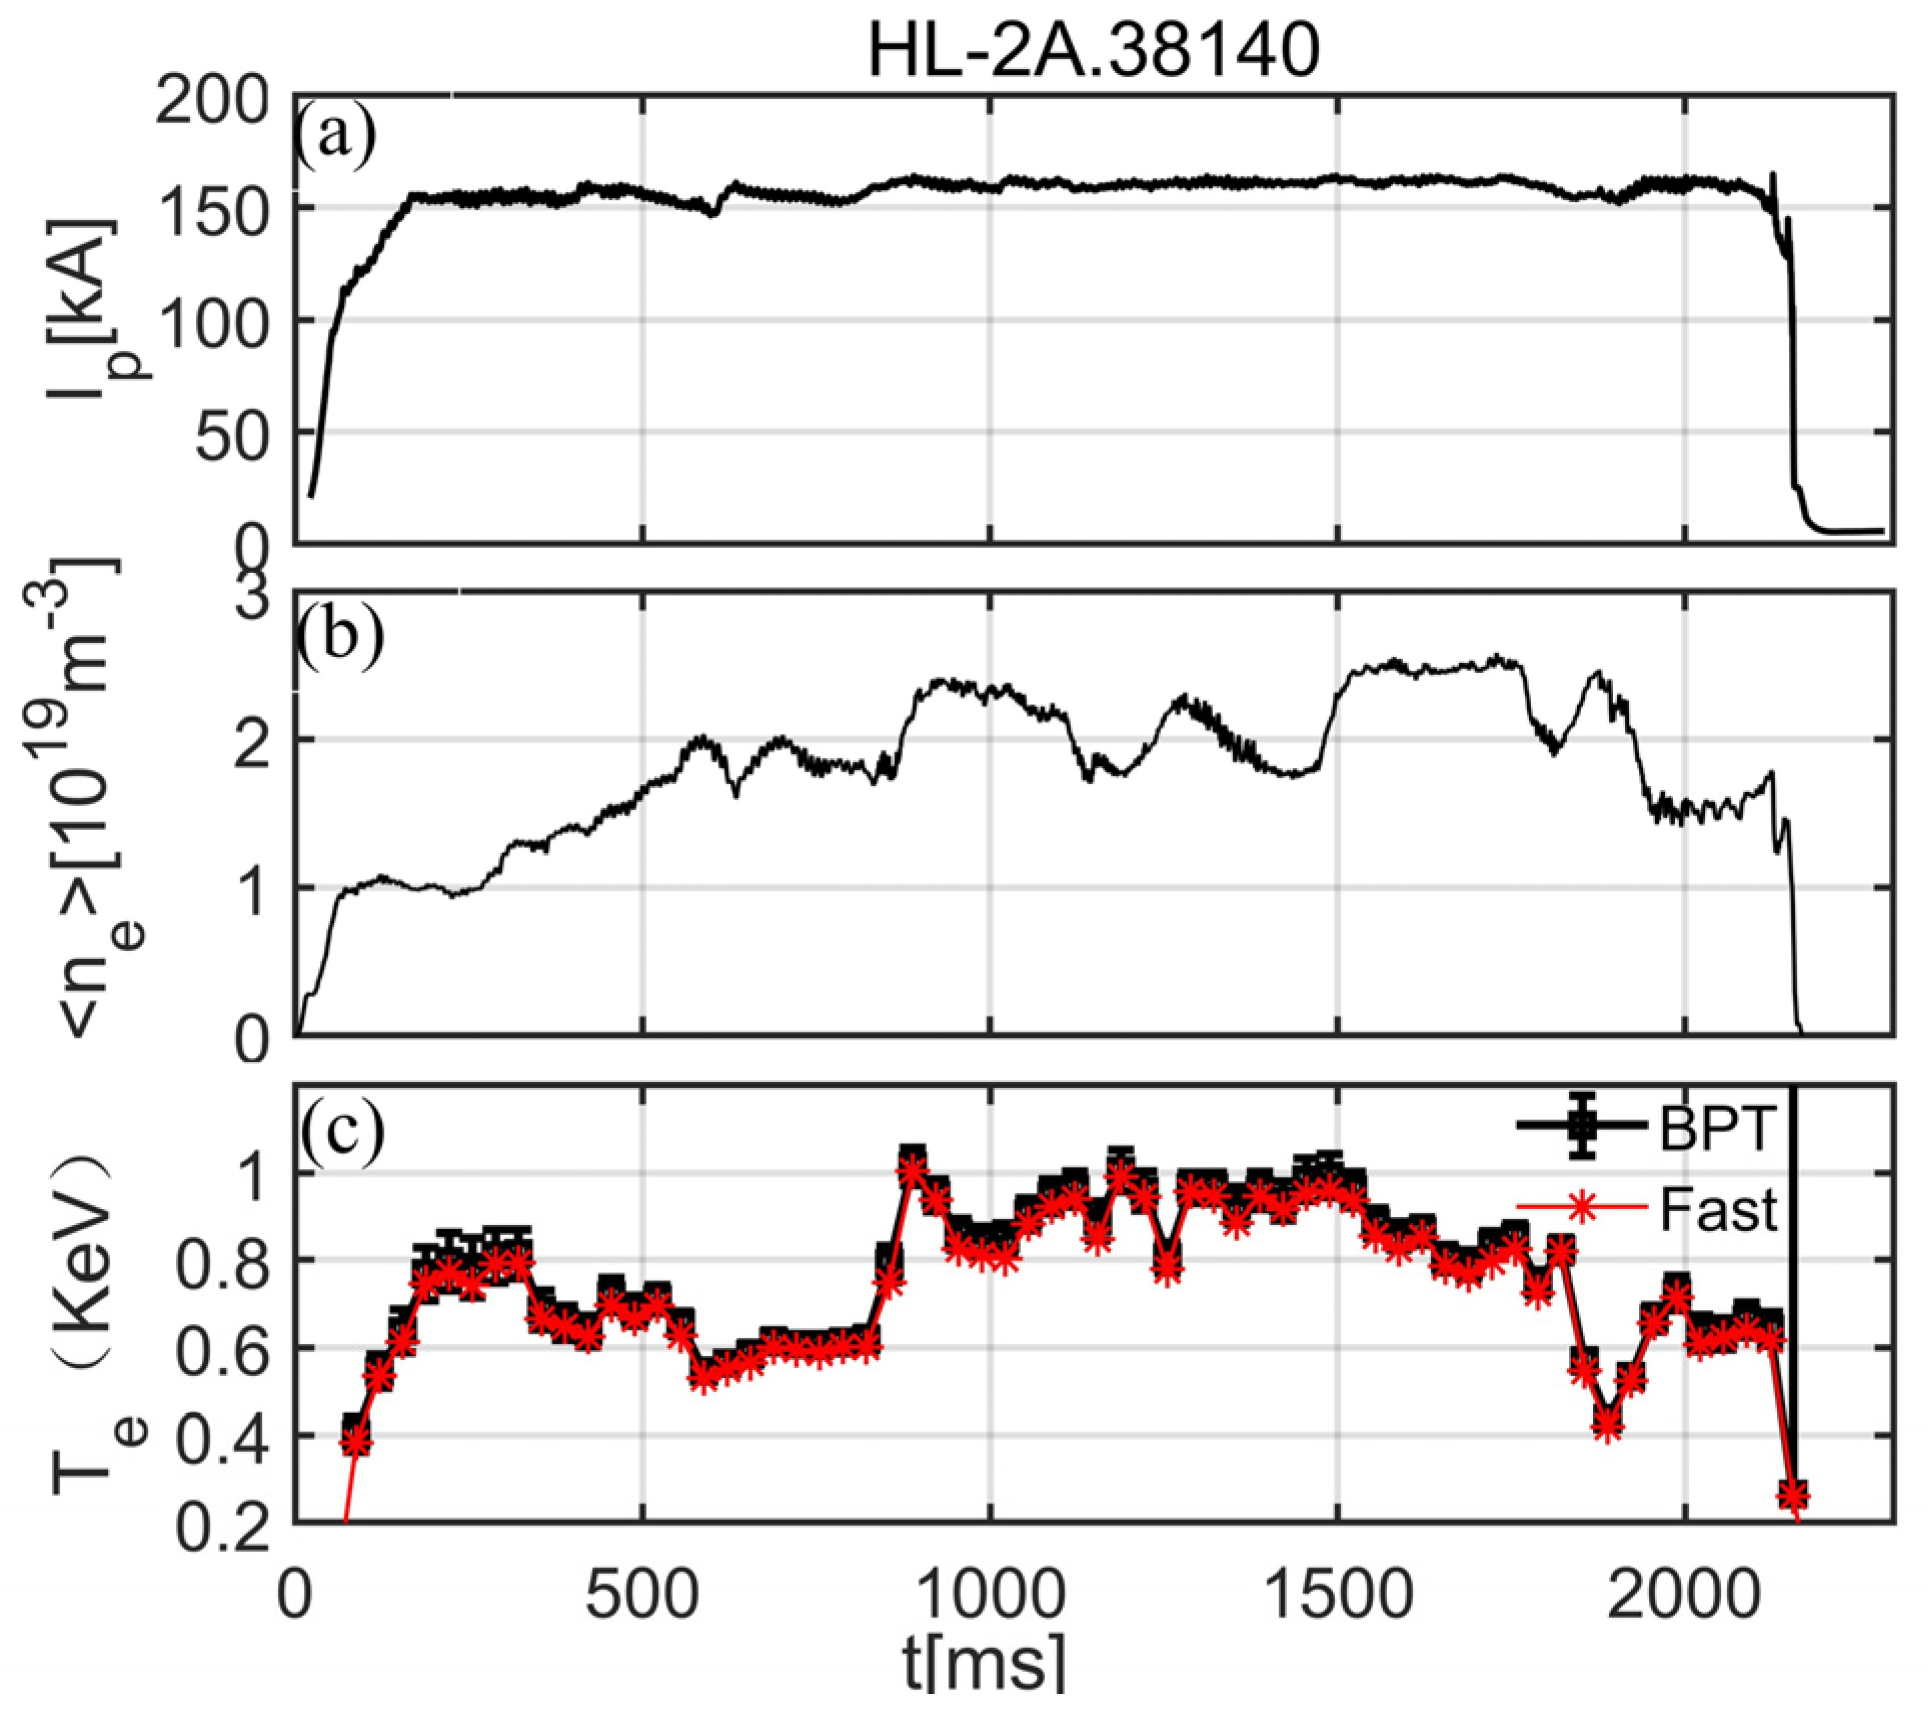
Figure 6 shows the original signals of a 5-channel polychromator for the core point. The legends in panel (a) correspond to the channel responses of the polychromator shown in panel (b). Clear signals can be observed on all five spectral channels. The maximum SNR is more than 40 times on ch3 and over 10 times on ch5. The corresponding plasma current and midplane line average electron density are shown in
Figure 7a,b. It should be noted that the stray light has been completely cut off by a notch filter, located inside the polychromator after its shaping lenses in the entrance.
Better SNR also makes data analyses easier. A simple code is adopted to provide a fast preview of the time evolution of the core . It includes two main functions. The first one is to extract the pure scattering signal intensity for a channel from the outputted pulse waveforms. The waveforms are digitized by the CAEN switched capacitor digitizer V1742 at 2.5 GSa/s. Each segment includes 1025 12-bit data and corresponds to a ~400 ns duration after the trigger from the laser light. However, because the photons arrive at APD at different times and the channels are mutually independent after APD output, there are a few differences between these waveforms. The value of of a pulse waveform is then considered as a pure scattering signal intensity. Here, is the average value of the data outside of the central scattering pulse in the waveform. Generally, the noise amplitude is 5~10 mV for most channels.
The second function of the code is to quickly and accurately match the scattering spectrum with the calibration data to obtain
. The pure response signals of five channels are first standardized to standard scores:
Here,
is the pure signal strength of a channel, and subscript
i is the number of channels that have enough SNR and can thus be used for calculation.
is their average value, and
is their standard deviation.
is the standard score, which shows the relative value of the signal. This standardization can more effectively drop the effect of the vertical dimension (different amplitude of the scattering signals and calibration data). The calibration data of the channel response dependent on
is also transformed into the standard score. Then,
is obtained by scanning the lowest Minkowski distance:
Here, is the total number of channels used for data fitting. is the standard score of the calibration data in function of . is the power series. When , is the Manhattan distance. When p = 2, is the Euclidean distance, and the method of Equation (2) is exactly the least square method of data fitting. is also a general configuration. The above algorithm is also one of the basic methods used for voiceprint recognition.
The error of the data, including photon statistical noise, electronic noise, and plasma background light noise, is considered an uncertain background fluctuation under noise amplitude. The possible
values can thus be obtained by fitting the modified channel signal, which equals
. Here,
is a random value whose absolute value is smaller than the maximum noise
. Moreover, the Bayesian probability inference method was also tested and evaluated [
15]. As the results show in
Figure 7c, the fast preview code can supply results (without an error bar) that are very close to the complex Bayesian algorithms. However, the fast preview code only takes seconds, while BPT (“BP” is Bayesian Probability, and “T” is the mark for “Test”) requires tens of minutes by the same software on the same PC. The error bars for the BPT are also small due to a high SNR.
5. Results
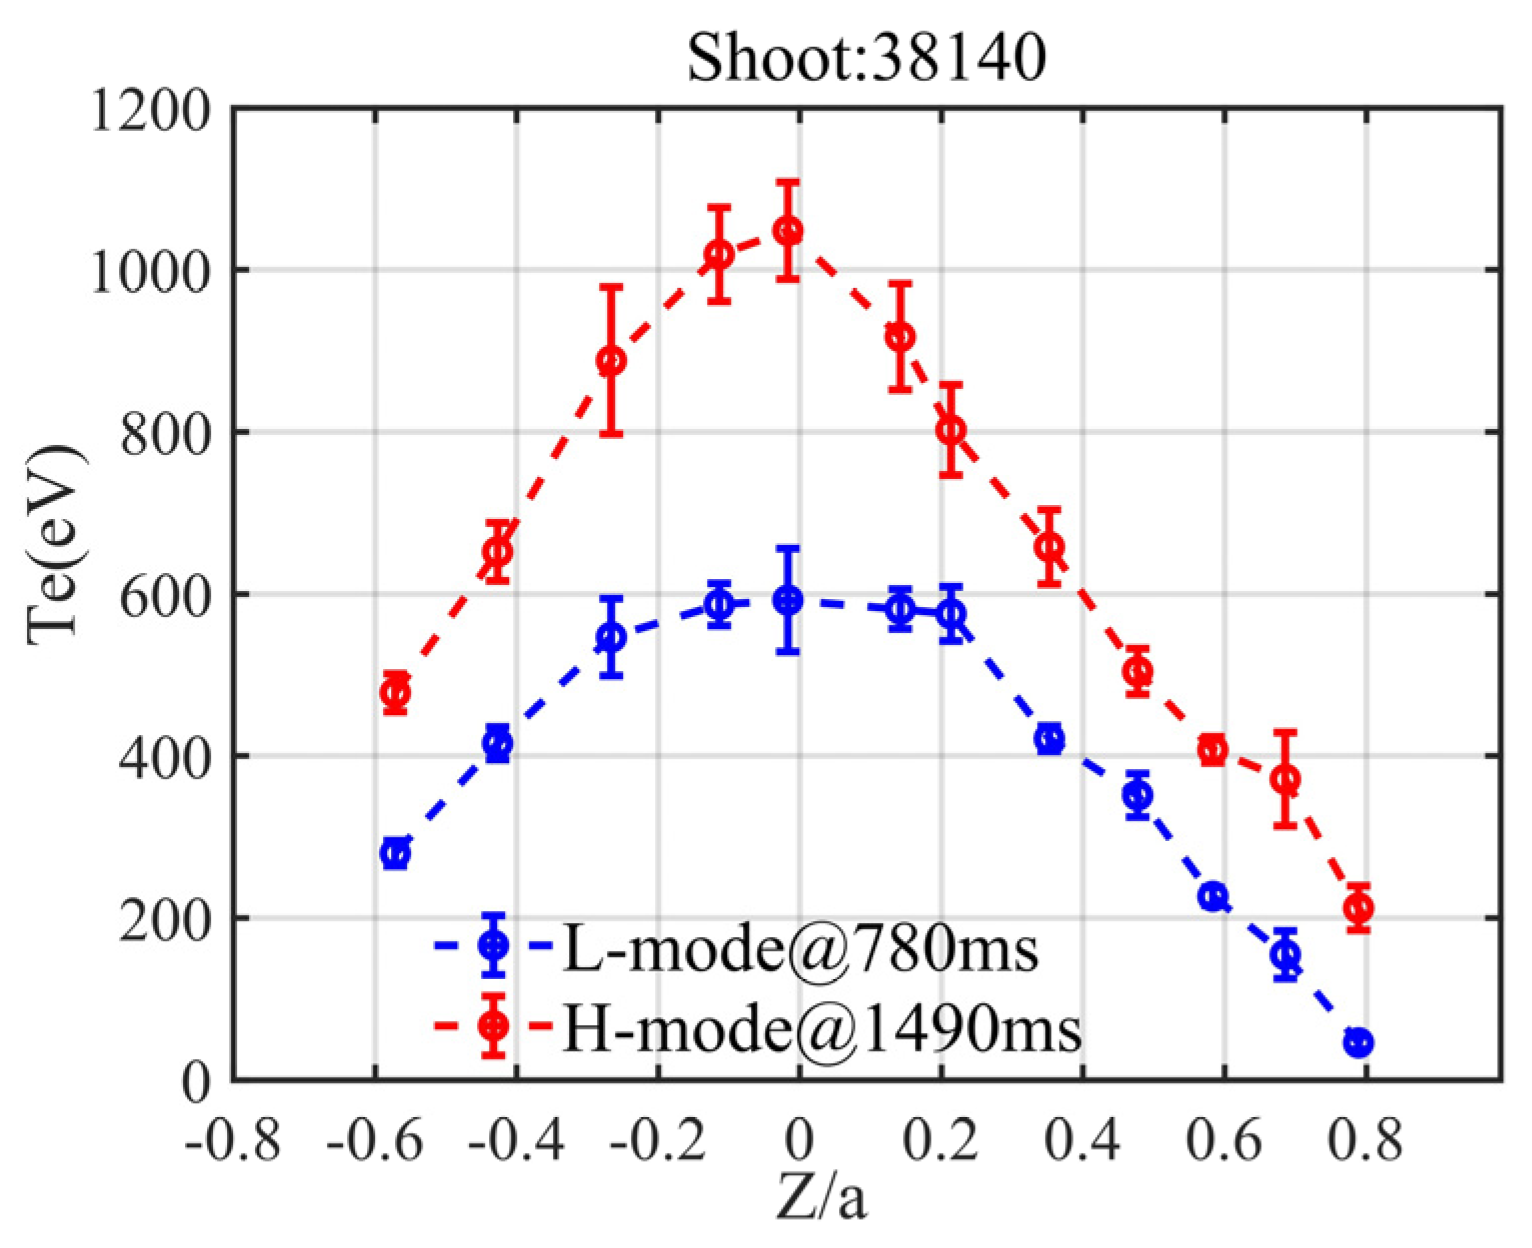
The multi-point plasma temperature profile can now be measured by the upgraded TS system. As shown in the example in
Figure 8, when the plasma current was ~160 kA and the core electron density was ~
, twelve points were successfully measured. The overall temperature profile obviously rose when the Electron Cyclotron Resonance Heating (ECRH), Low Hybrid (LH) waves, and Neutral Beam Injector (NBI) were injected to successfully drive the H-mode, i.e., the Edge-Localized Mode (ELM) happened. The increase of the electron temperature of the outer region (Z/a = ~0.8) predicted a significant increase in the edge temperature gradient, which was in exact agreement with the profile characteristics during ELMs.
There were eighteen polychromators and two aiming monitors assembled after this upgrade. However, only 12 TS measurement points that were closer to the core could capture signals that were sufficiently strong. The SNR of some channels of the other six polychromators for the edge region was too low to be calculated. The first reason for this was that , at the edge was much lower, but the filters of these polychromators were not yet completely compatible with the characteristics of the TS scattering spectrum of the edge plasma. The second reason was that the slit for the beam path of the original divertor plate of HL-2A was too narrow (~10 mm). It caused a strong stray light that significantly affected the signals, especially on the channel for low . Therefore, the available spatial points were still not sufficient to satisfy a fine physics research. An upgrade of the polychromator for edge plasma and partial modification of the divertor plate are in the works.


