
Drone Trajectory Segmentation for Real-Time and Adaptive Time-Of-Flight Prediction

 ,
,  ,
,  ,
,  and
and
Abstract
:1. Introduction
2. Methodology
- -
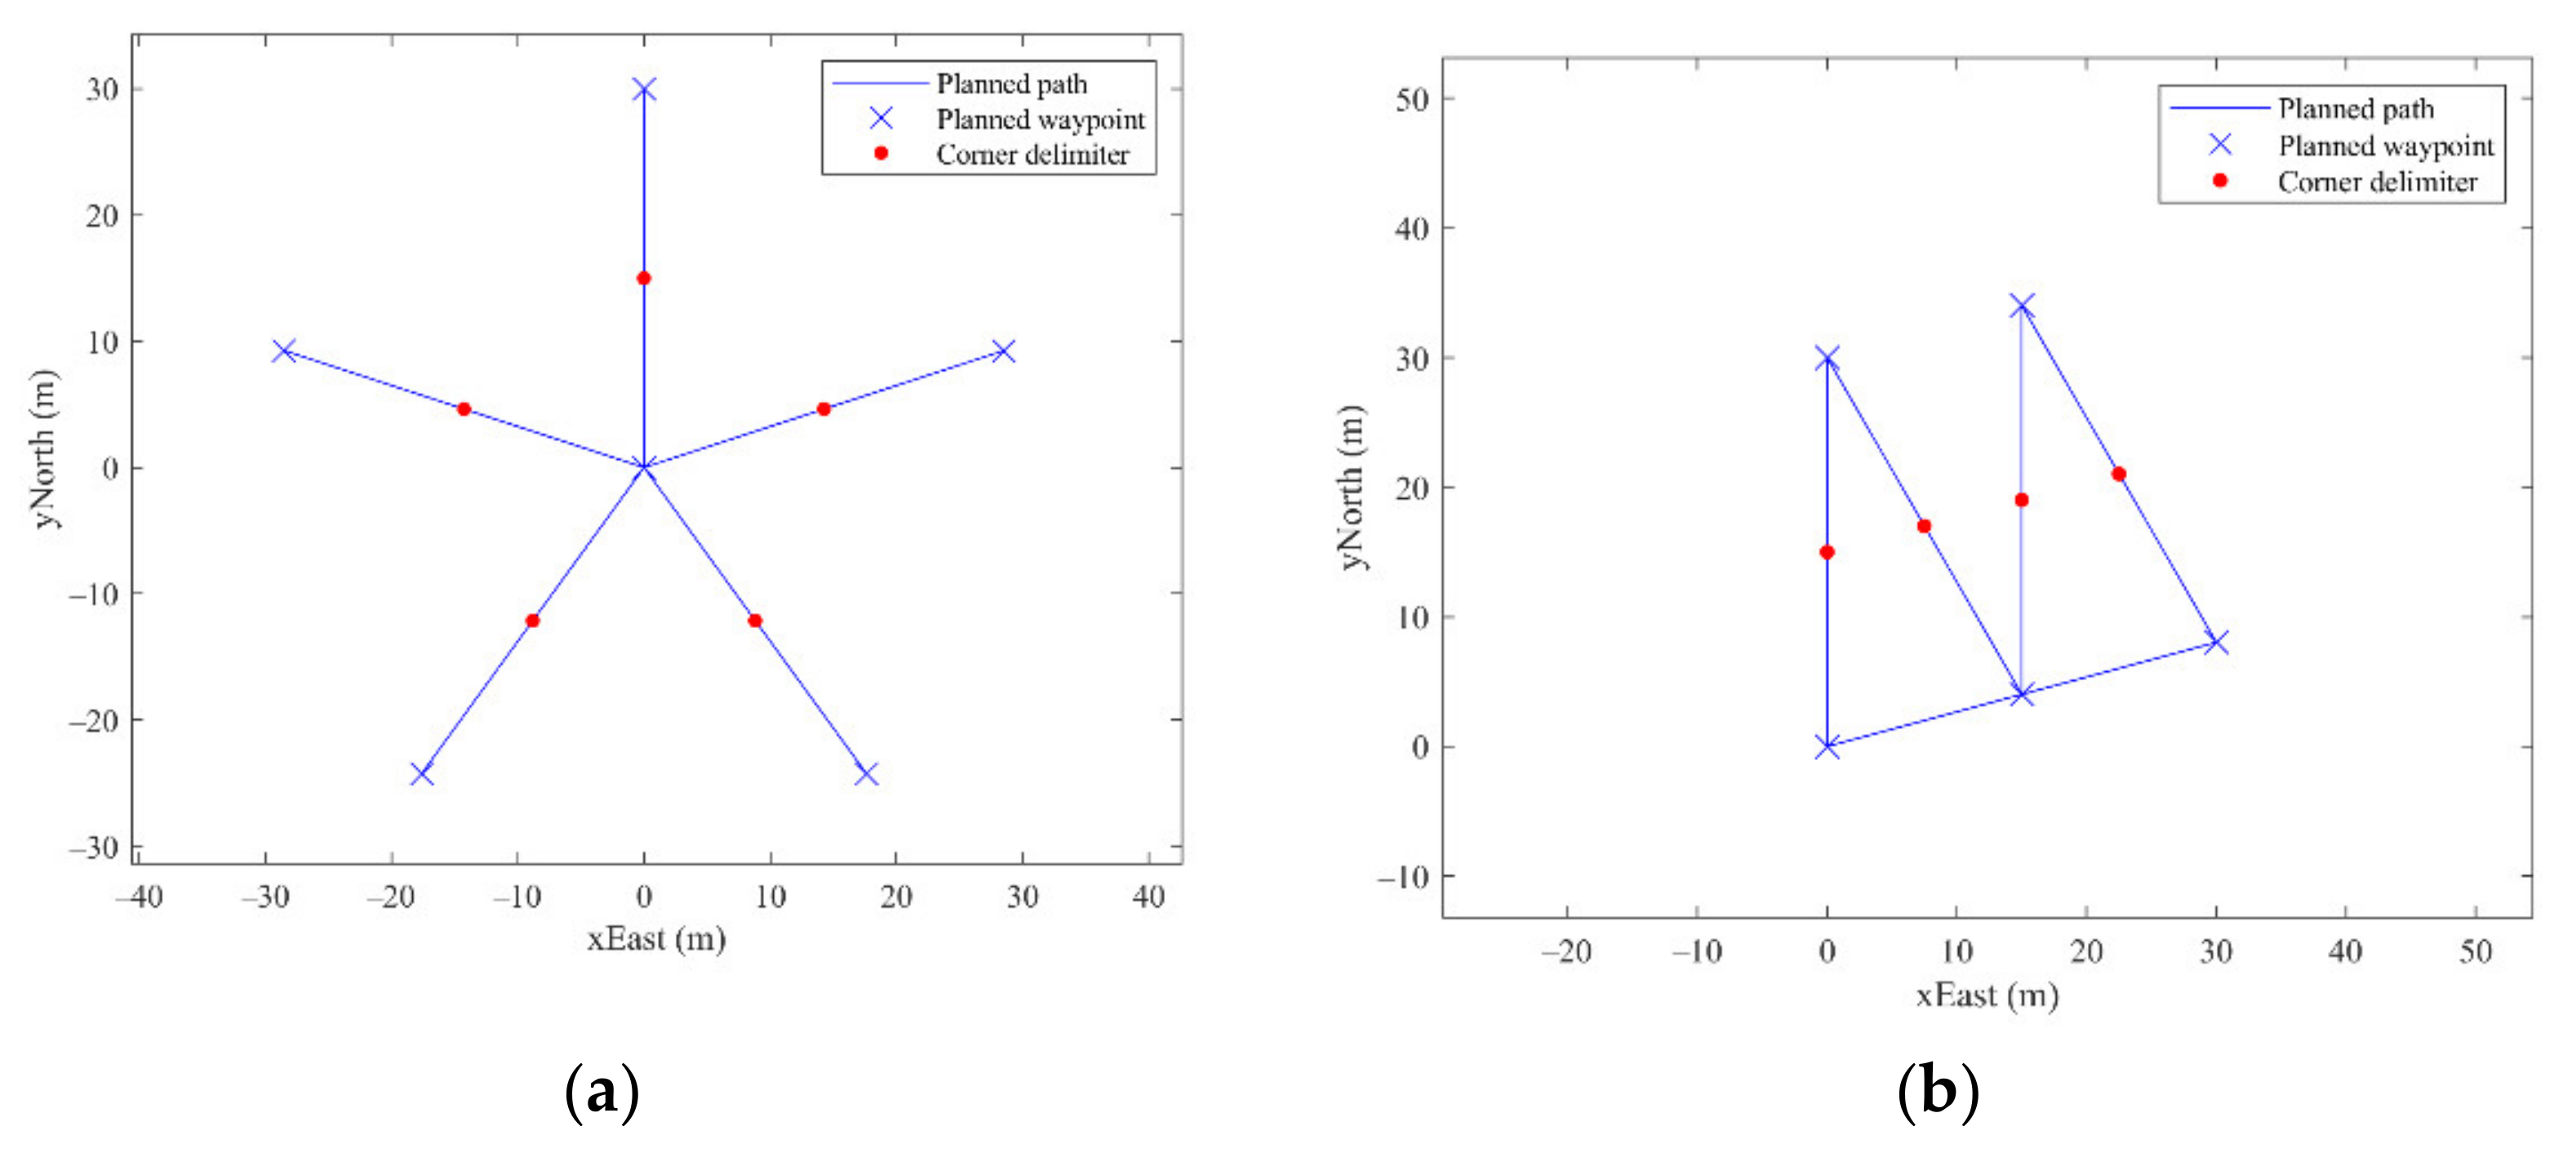
- T0 path: Includes 5 segments of 30-m length that form a star shaped geometry, 5 external waypoints and one central waypoint, as shown in Figure 3a. Each segment is performed outwards and inwards with respect to the central waypoint so that it represents the case of a relative angle of 0 deg. Corners characterized by an angle of 72 deg that are performed in the center of the path were not considered as samples.
- -
- T30 path: Includes 5 segments and 5 planned waypoints, as shown in Figure 3b. The first 4 segments have a 30-m length, and the corner legs involve a relative angle of 30 deg. Instead, the last segment has a 31-m length because it only allows to close the path. So, the relative angles of the couple legs fourth-fifth and fifth-first have not 30-deg size and the flight-time over them was not considered.
- -
- T60 path. Includes 3 segments that represent an equilateral triangle shape and 3 planned waypoints.
- -
- T90 path: Includes 4 segments that represent a square shape and 4 planned waypoints.
- -
- T120 path: Includes 6 segments that represent a hexagon shape and 6 planned waypoints.
- -
- T150 path: Includes 12 segments that represent a dodecagon shape and 12 planned waypoints.
- -
- T180 path: Includes 2 segments and 3 planned waypoints. The path is a straight line with an intermediate stop at the central waypoint.
3. Initial Flight Test Campaign
- -
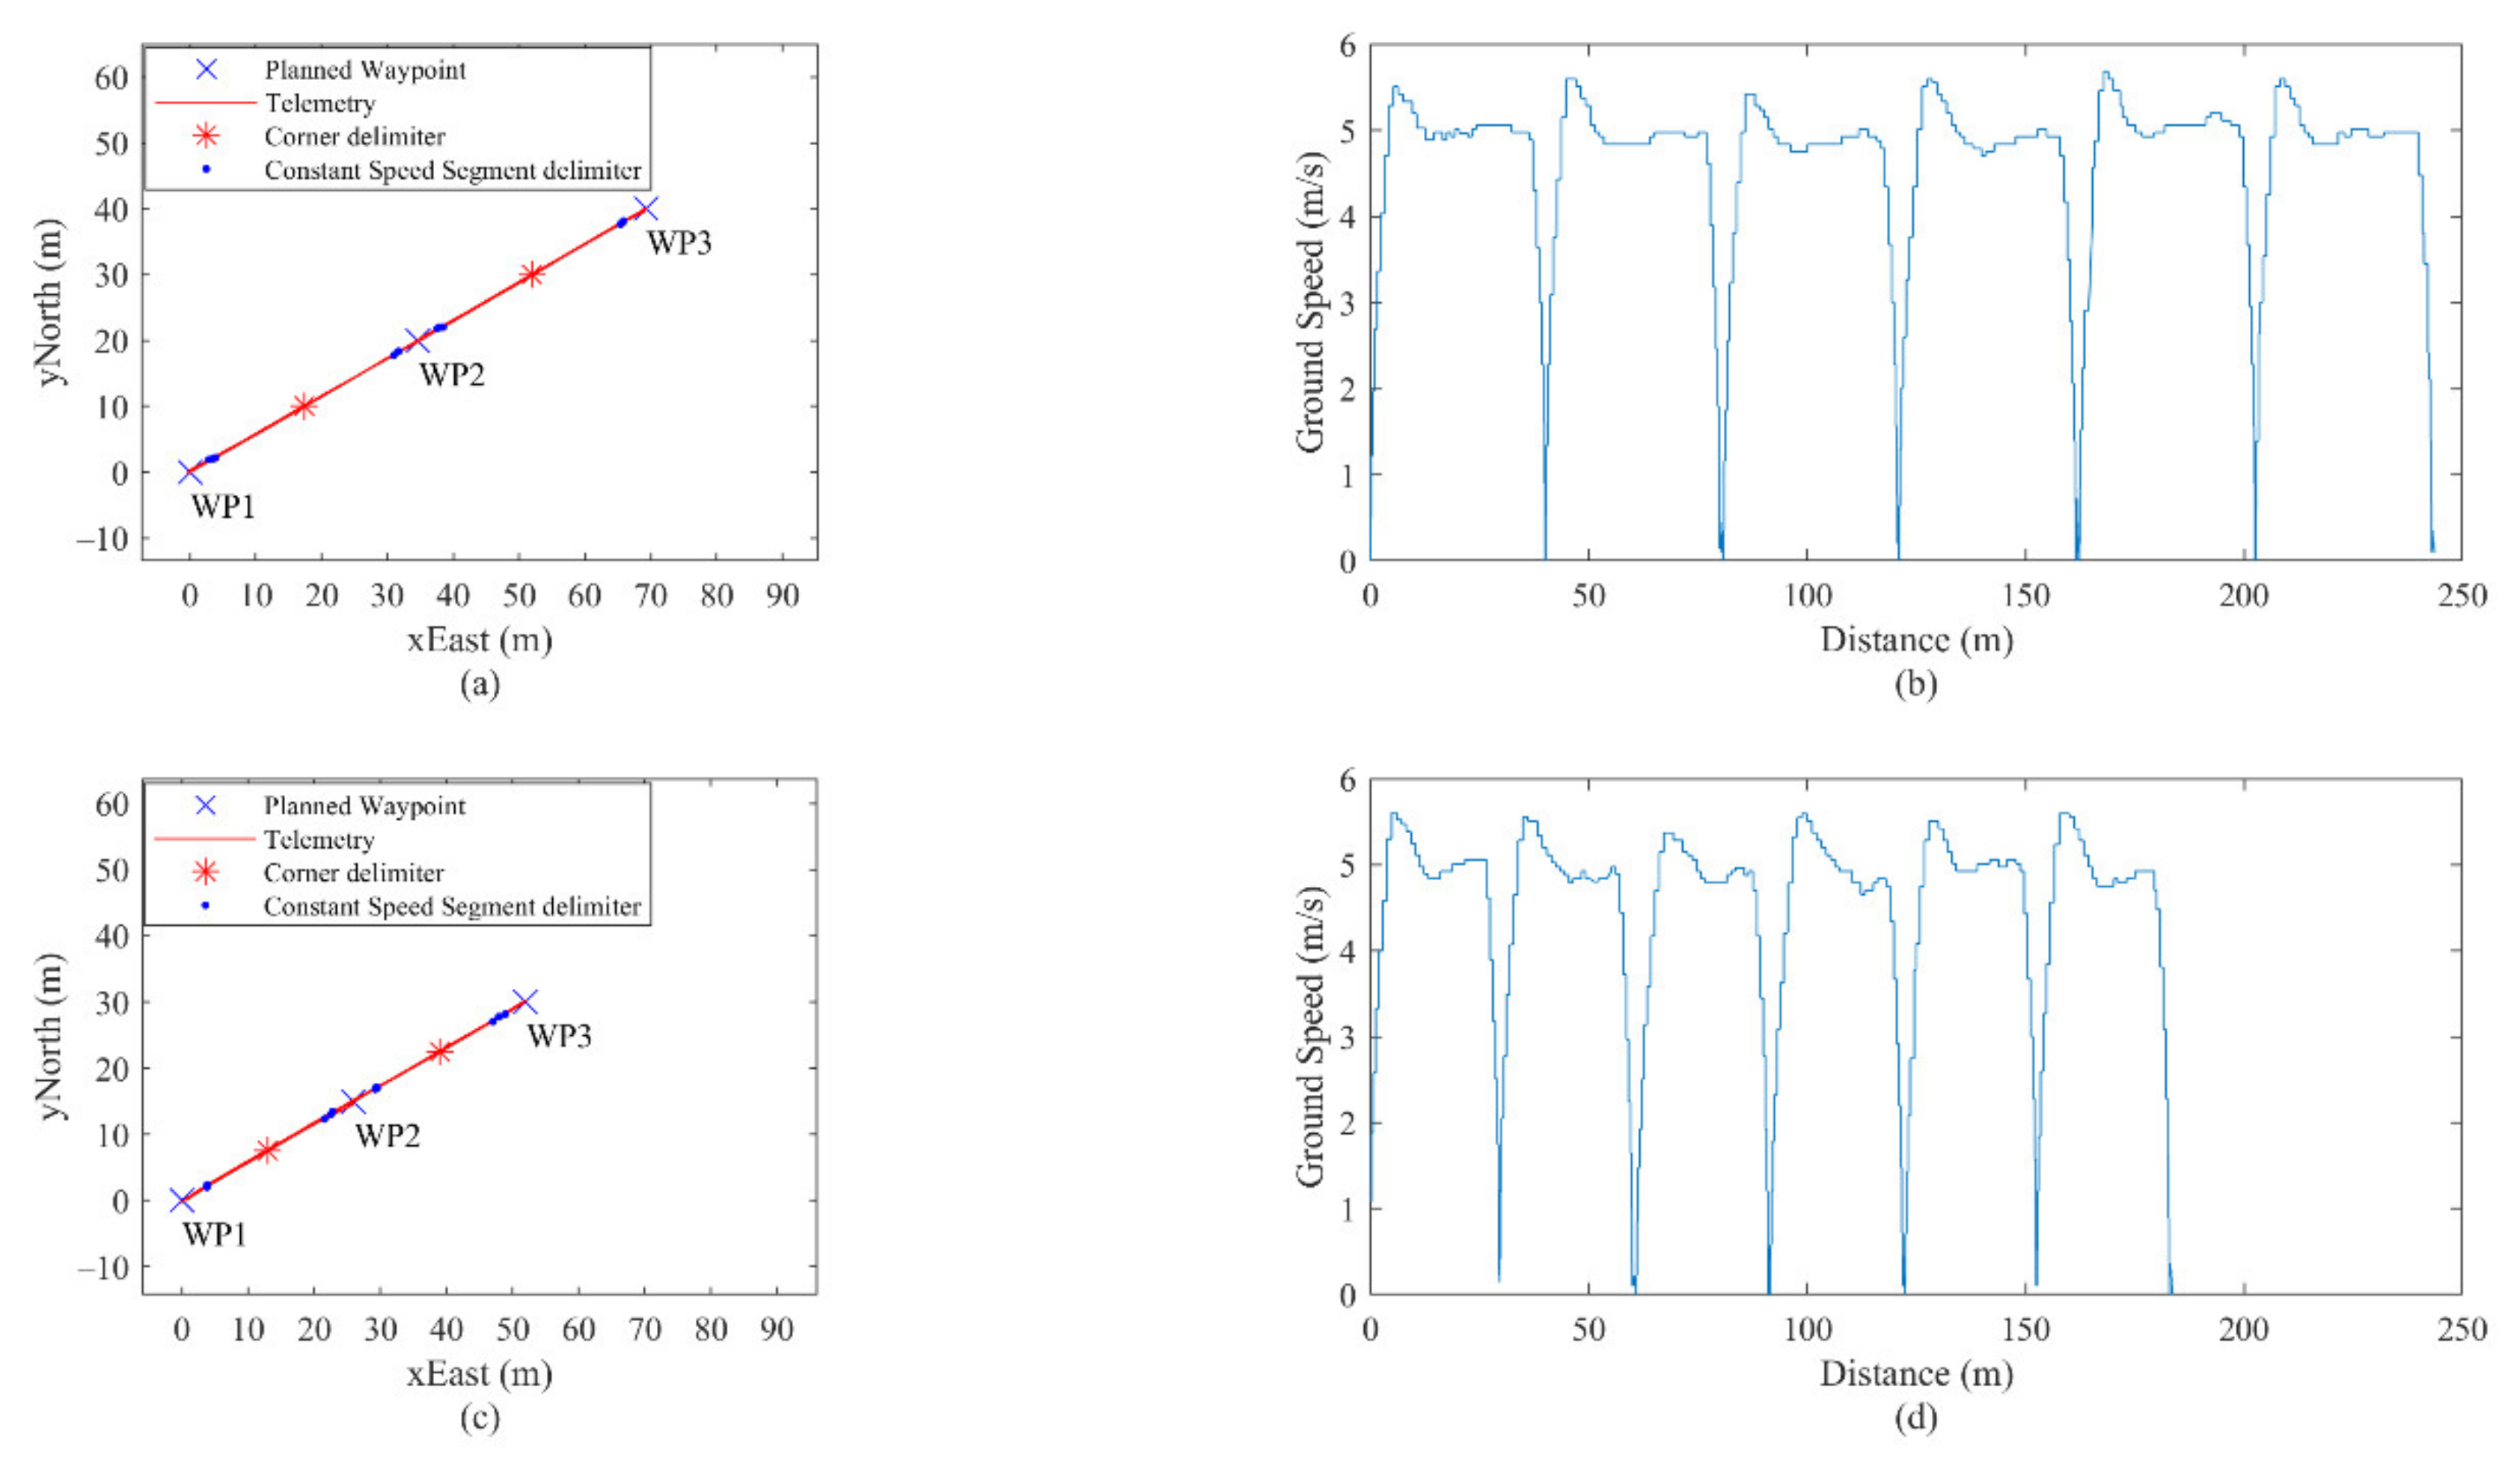
- T60 path;
- -
- T180 path.
4. Flight Tests
- -
- deviations of the performed trajectory with respect to the planned 20-m height AGL;
- -
- deviations of the performed trajectory with respect to the planned 30-m length distance around each corner.
5. Method Based on Machine Learning
- -
- The relative angle between consecutive segments, i.e., corner legs. It is the clockwise angle computed from the second segment direction and the opposite of the first segment direction;
- -
- The clockwise angle computed from the first segment direction and the wind vector;
- -
- The wind intensity category.
6. Analysis of Complete Paths
6.1. Travel Time Prediction over Complex Paths
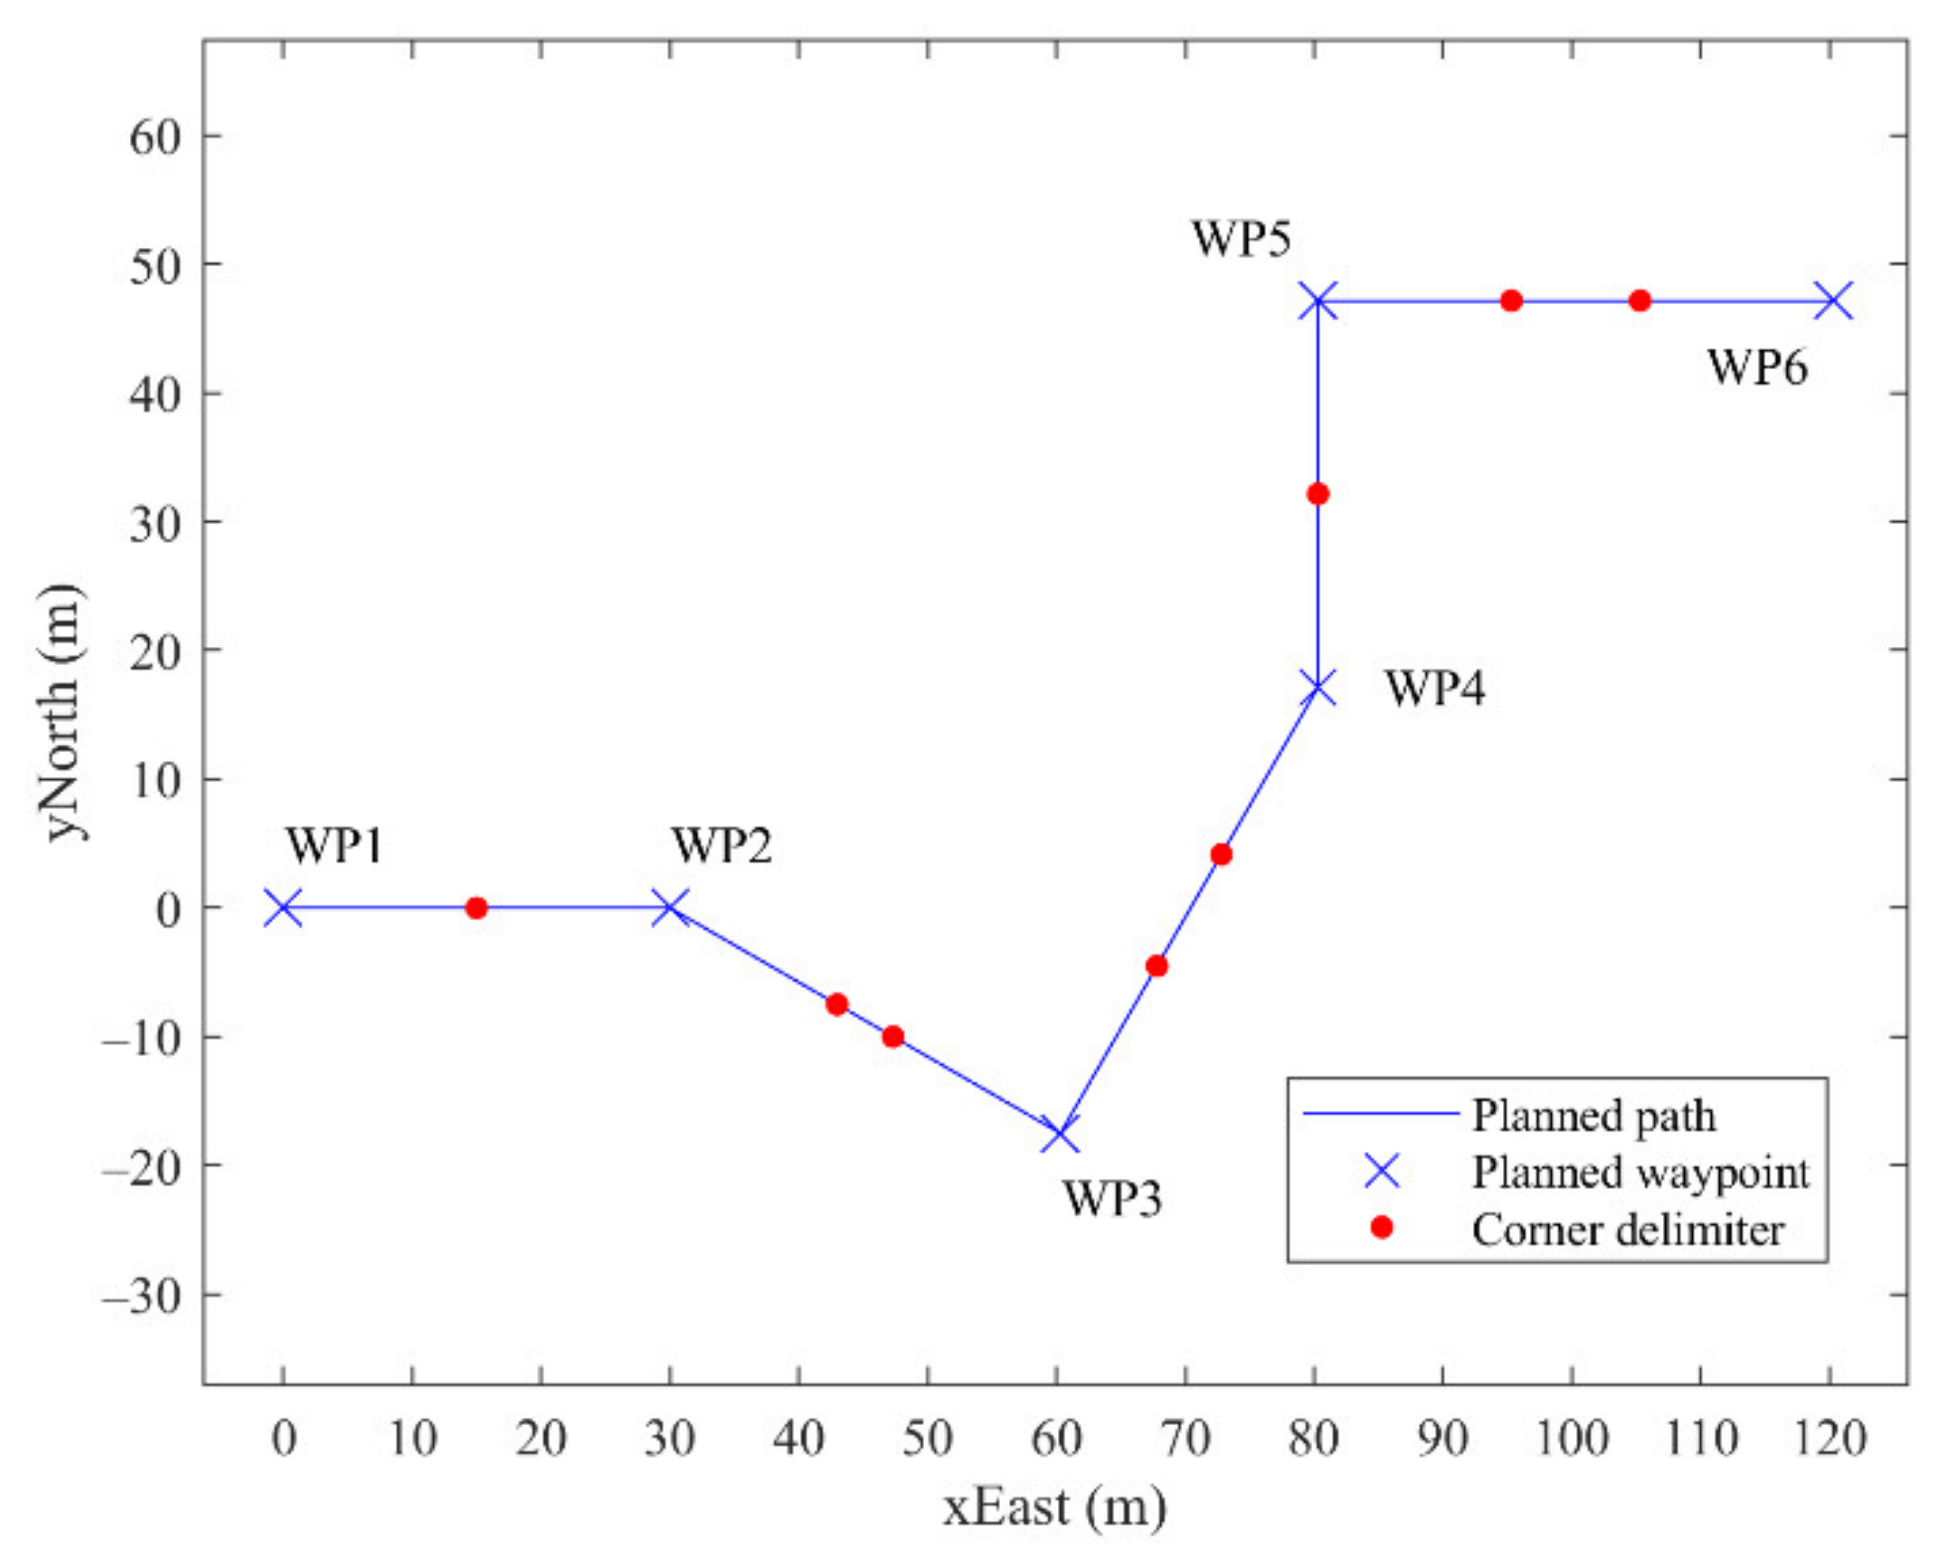
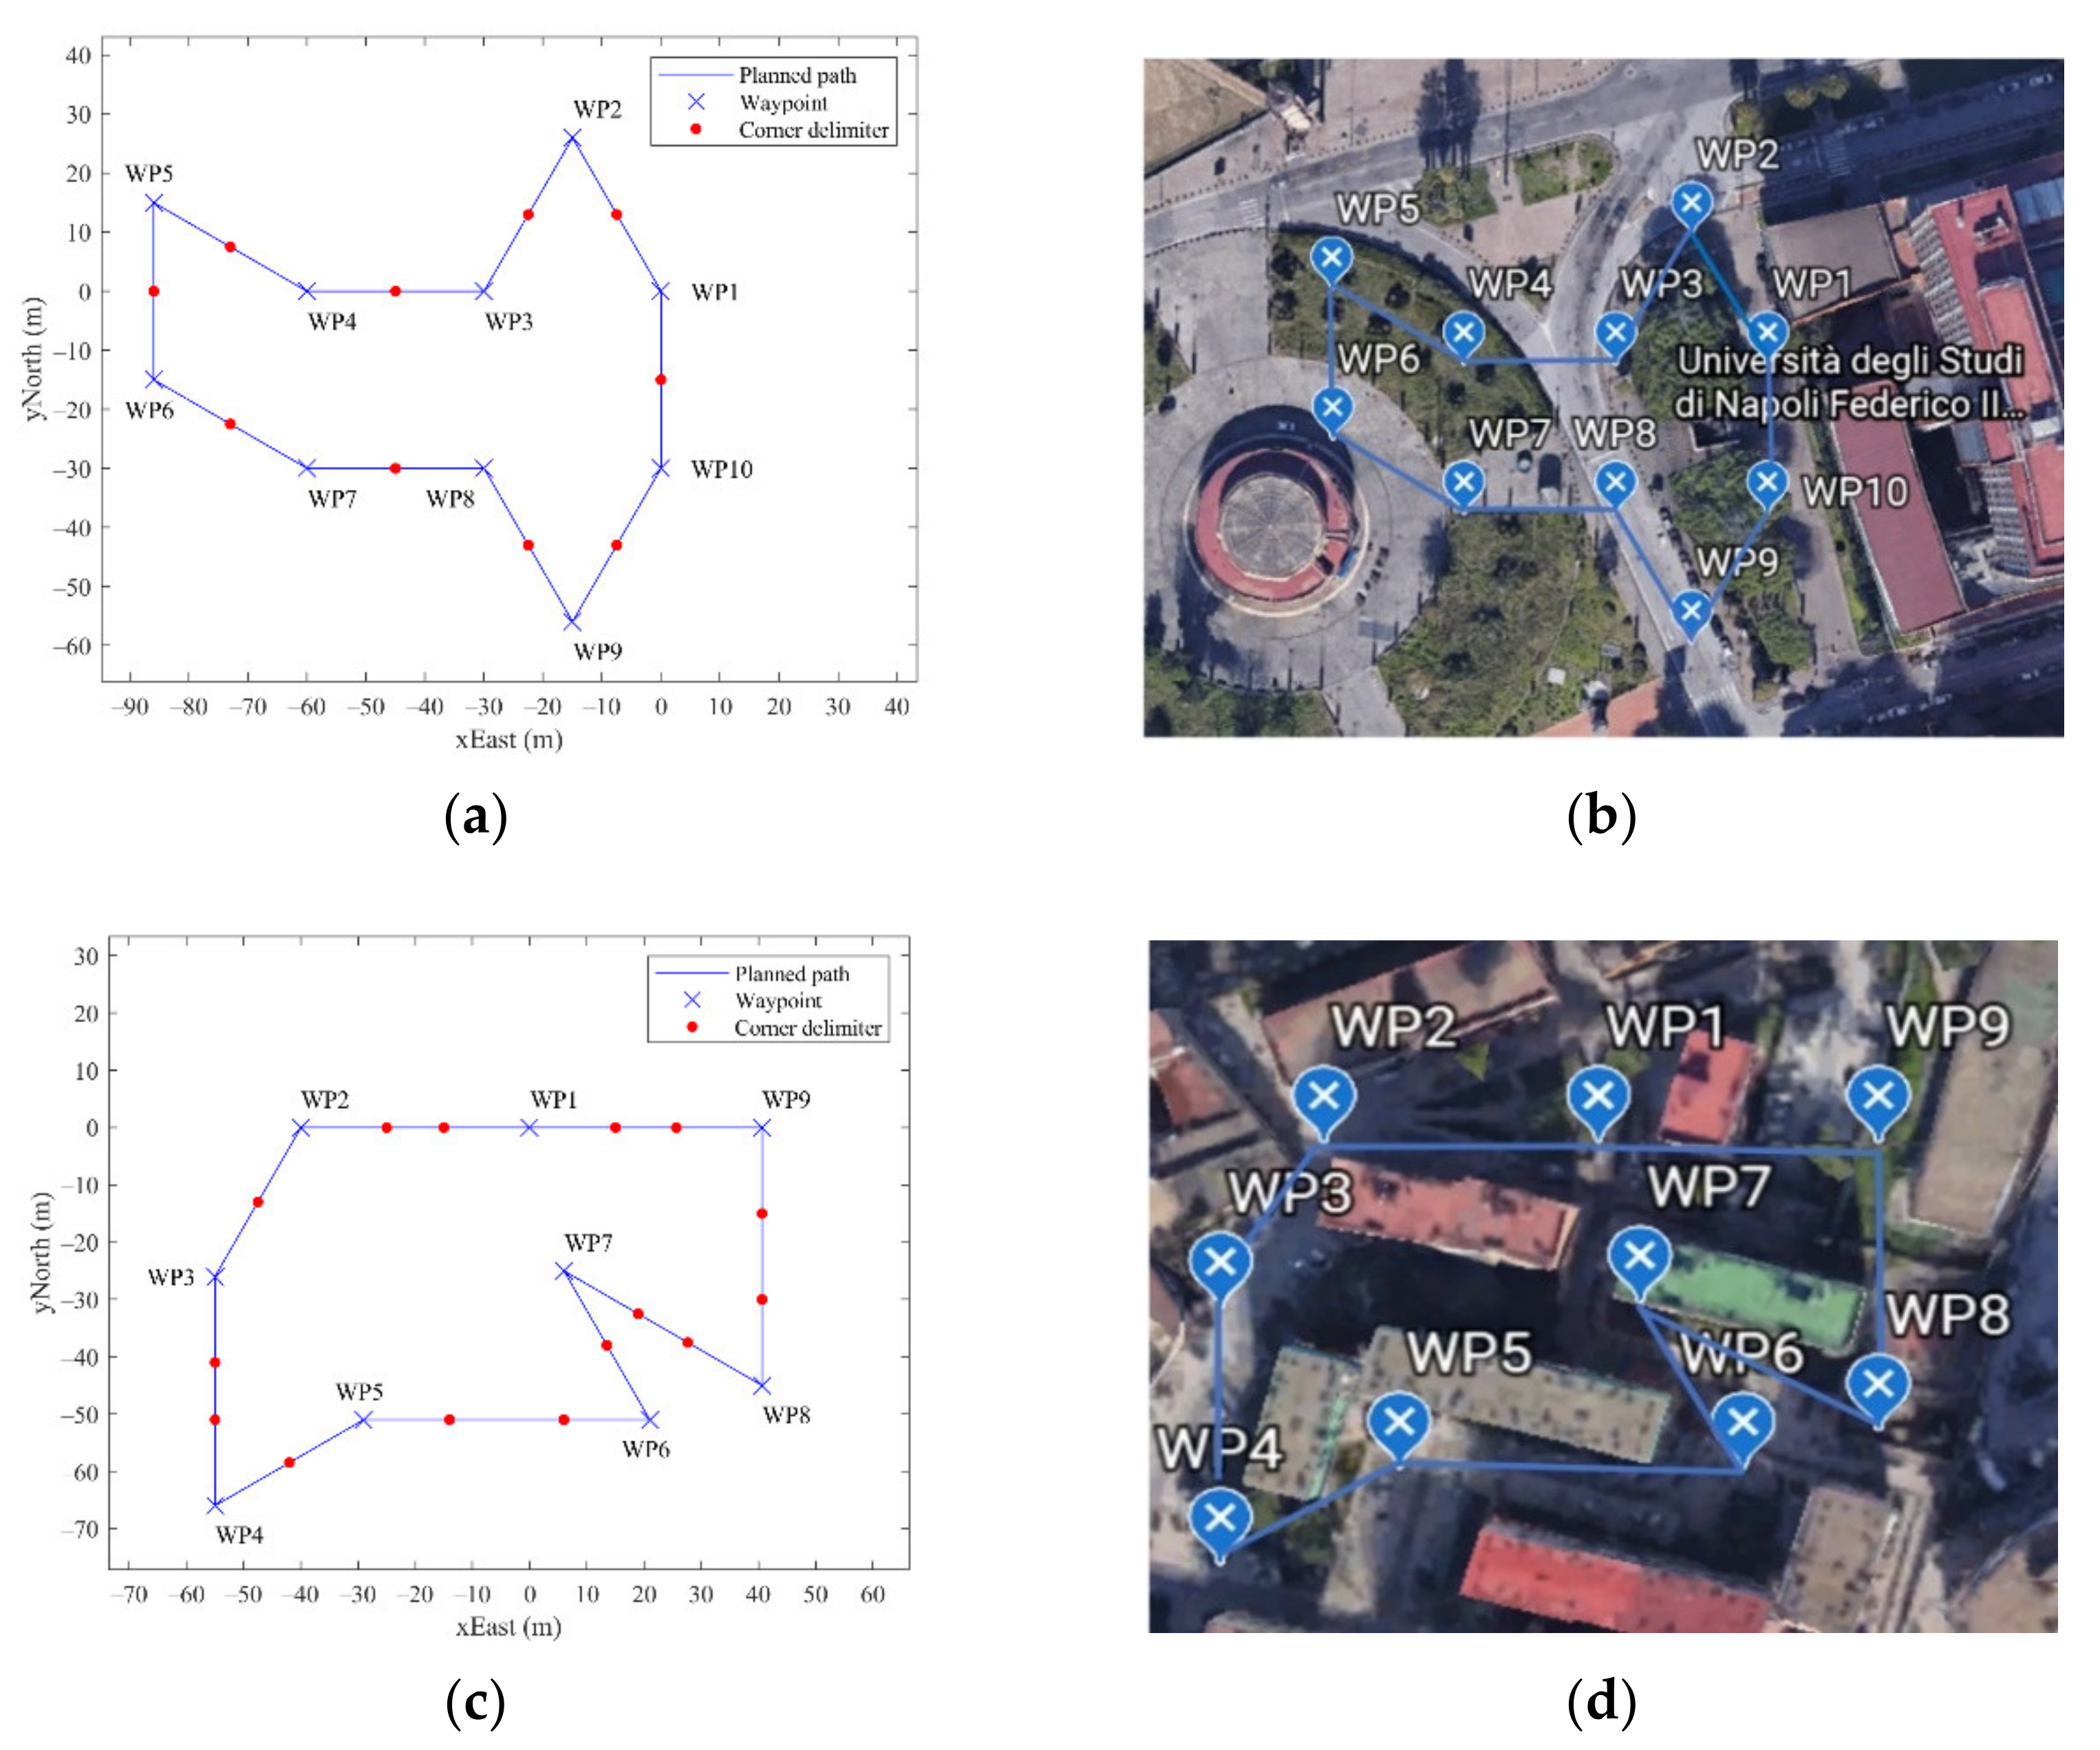
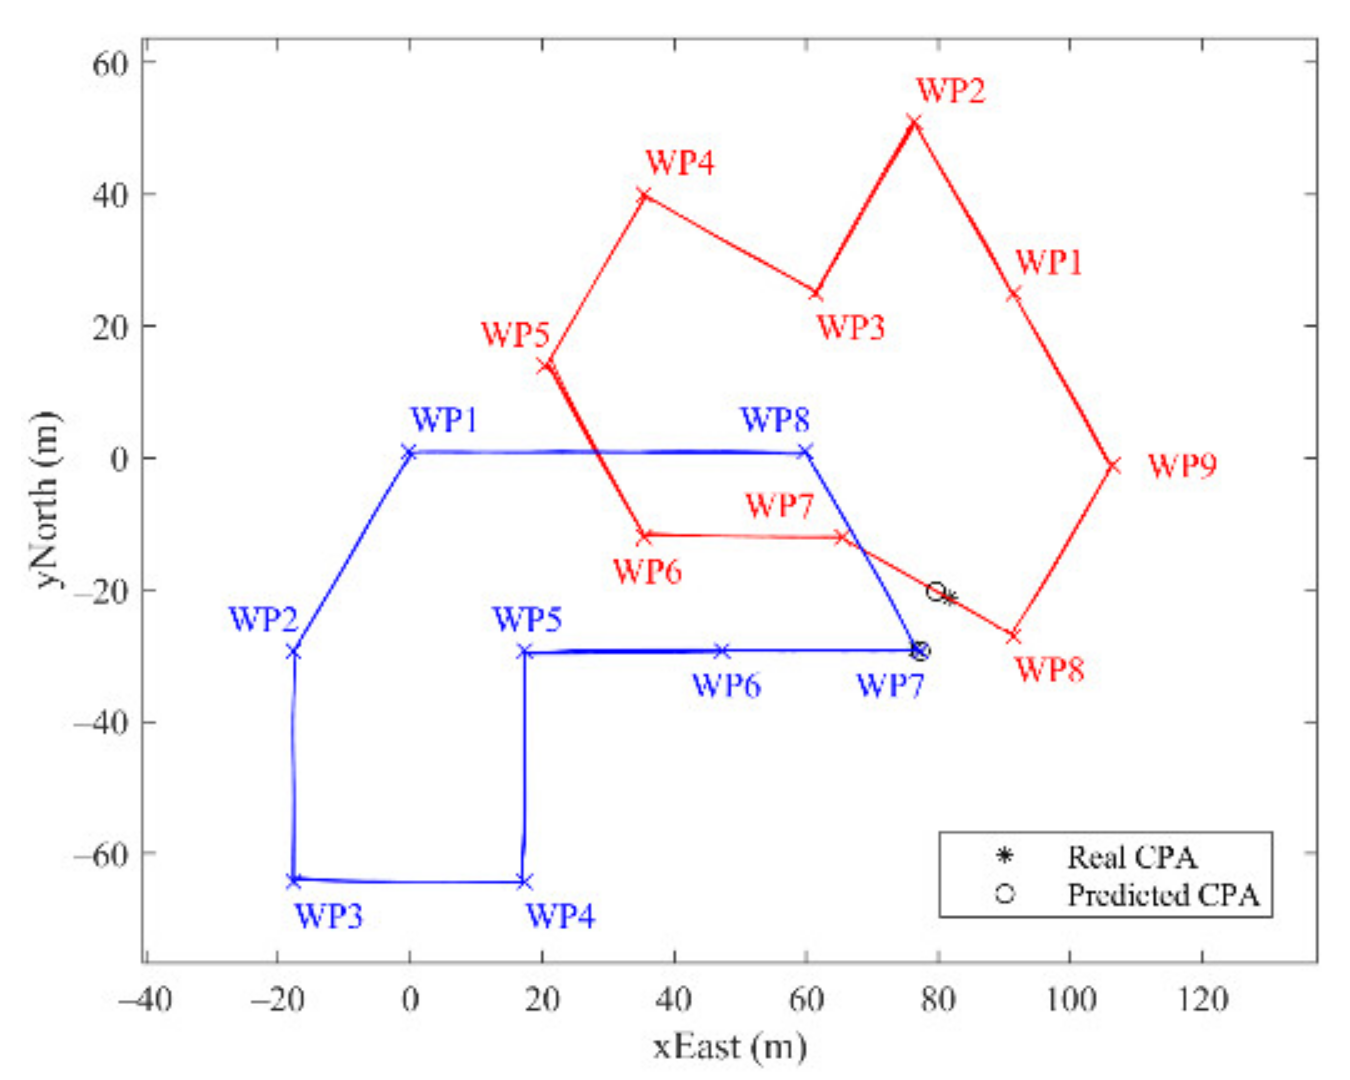
- Case 1. Test path 1 was planned for a monitoring flight. For instance, it can be adopted for a drone to monitor a crowded area. The urban scenario selected for this example is the area in front of a university hall. The path is represented in Figure 7a,b and it includes 10 segments, each one has a length of 30 m. The turn angles between consecutive segments are multiples of the 30 deg angle. The path was performed three times. Summing the NN outputs to compute the total flight time over the path, the first and the last segment of the complete three-lap-path are not included in a corner, because they are included in a half-corner. However, this contribution can be neglected with respect to the order of magnitude of the involved flight-time values. Test path 3 includes 9 segments that have the same length of 30 m, and it was performed three times. It is the red path displayed in Figure 8.
- Case 2. Test path 2 was designed considering an urban canyon scenario among buildings. The path involves 9 segments, as reported in Figure 7c,d, and it was performed once. In this case different length segments were considered to realize the path, assuming a minimum segment length of 30 m. To estimate the flight-time employed to travel the first and the last segment, an additional corner coming from the T180 path was considered. Test path 4 included 8 segments that have different lengths, and it was performed three times. It is the blue path displayed in Figure 8.
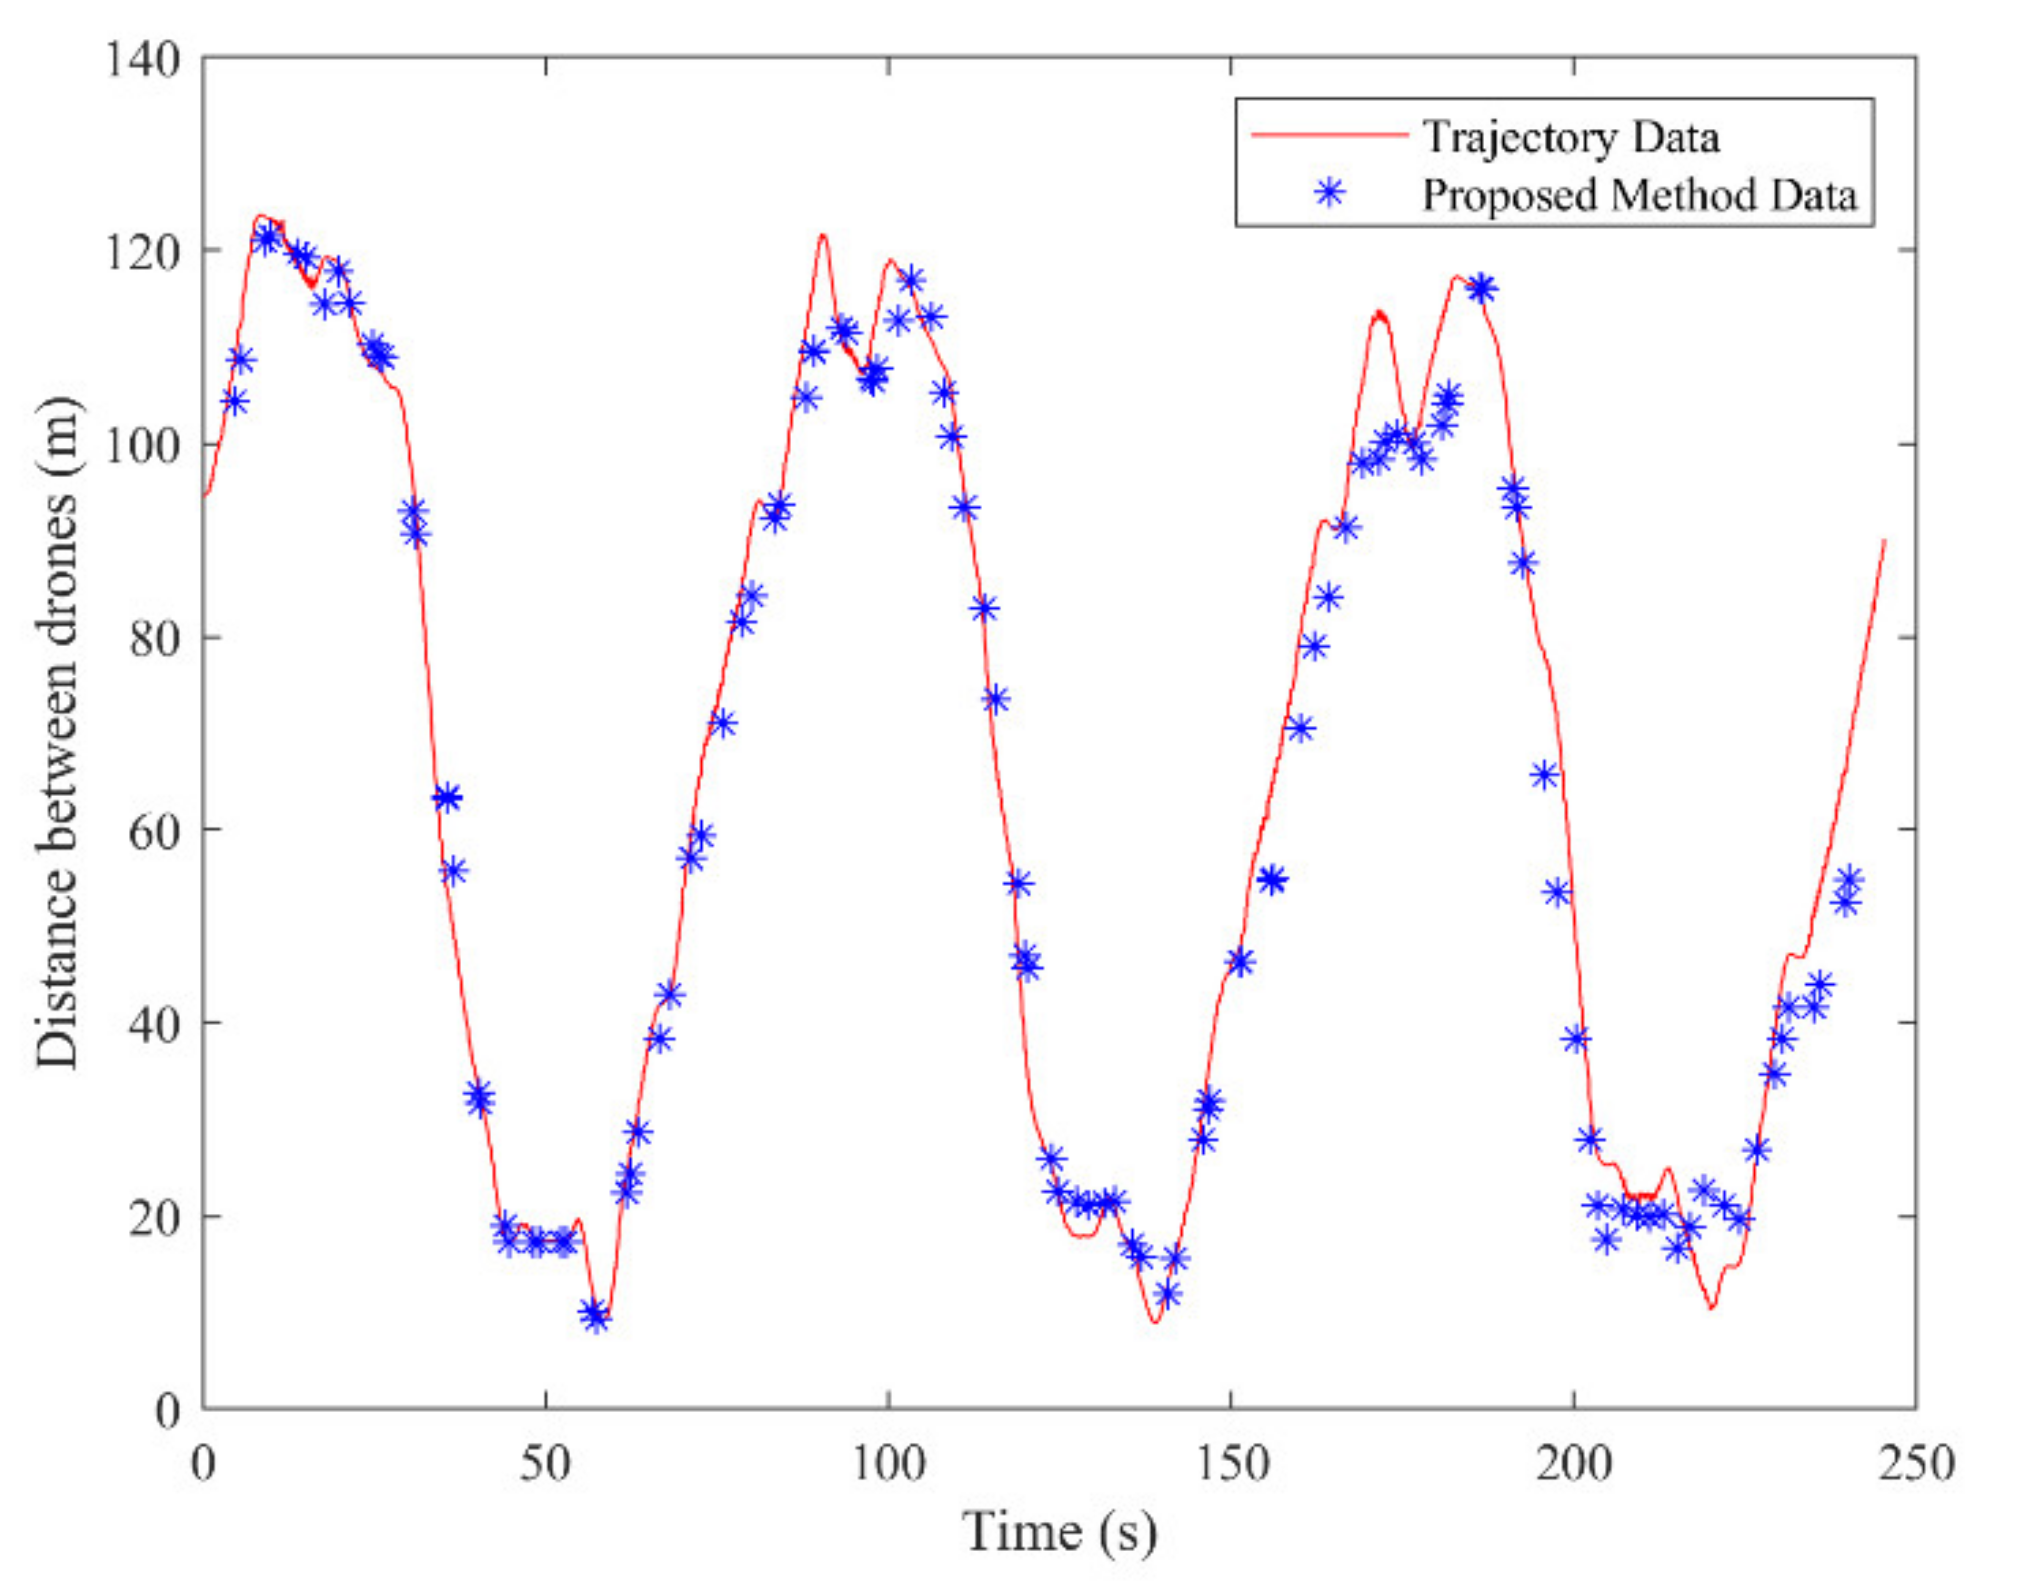
6.2. Prediction of the Closest Point of Approach
7. Conclusions
Author Contributions
Funding
Institutional Review Board Statement
Informed Consent Statement
Data Availability Statement
Acknowledgments
Conflicts of Interest
References
- NextGen; SESAR. State of Harmonization, 3rd ed.; Publications Office of the European Union: Luxemburg, 2018; Available online: https://www.sesarju.eu/newsroom/brochures-publications/state-harmonisation (accessed on 13 May 2021).
- Mondoloni, S.; Rozen, N. Aircraft trajectory prediction and synchronization for air traffic management applications. Prog. Aerosp. Sci. 2020, 119, 100640. [Google Scholar] [CrossRef]
- Prandini, M.; Hu, J.; Lygeros, J.; Sastry, S. A probabilistic approach to aircraft conflict detection. IEEE Trans. Intell. Transp. Syst. 2000, 1, 199–220. [Google Scholar] [CrossRef]
- Bashllari, A.; Kaciroti, N.; Nace, D.; Fundo, A. Conflict Probability Estimations Based on Geometrical and Bayesian Approaches. In Proceedings of the 2007 IEEE Intelligent Transportation Systems Conference, Bellevue, WA, USA, 30 September–3 October 2007; pp. 479–484. [Google Scholar] [CrossRef]
- Zhou, Z.; Chen, J.; Shen, B.; Xiong, Z.; Shen, H.; Guo, F. A trajectory prediction method based on aircraft motion model and grey theory. In Proceedings of the 2016 IEEE Advanced Information Management, Communicates, Electronic and Automation Control Conference (IMCEC), Xi’an, China, 3–5 October 2016; pp. 1523–1527. [Google Scholar] [CrossRef]
- Schuster, W. Trajectory prediction for future air traffic management—Complex manoeuvres and taxiing. Aeronaut. J. 2015, 119, 121–143. [Google Scholar] [CrossRef] [Green Version]
- Base of Aircraft Data (BADA). Available online: https://www.eurocontrol.int/model/bada (accessed on 13 May 2021).
- Uzun, M.; Koyuncu, E. Data-Driven Trajectory Uncertainty Quantification For Climbing Aircraft To Improve Ground-Based Trajectory Prediction. Anadolu Univ. J. Sci. Technol. Appl. Sci. Eng. 2017, 18, 1. [Google Scholar] [CrossRef]
- Fernández, E.C.; Cordero, J.M.; Vouros, G.; Pelekis, N.; Kravaris, T.; Georgiou, H.; Fuchs, G.; Andrienko, N.; Andrien-ko, G.; Casado, E.; et al. DART: A Machine-Learning Approach to Trajectory Prediction and Demand-Capacity Balancing. In Proceedings of the Seventh SESAR Innovation Days, Belgrade, Serbia, 28–30 November 2017. [Google Scholar]
- Sun, J.; Ellerbroek, J.; Hoekstra, J. Modeling Aircraft Performance Parameters with Open ADS-B Data. In Proceedings of the 12th USA/Europe Air Traffic Management Research and Development Seminar, Seattle, WA, USA, 27–30 June 2017. [Google Scholar]
- Xu, G.; Long, T.; Wang, Z.; Cao, Y. Matrix Structure Driven Interior Point Method for Quadrotor Real-Time Trajectory Planning. IEEE Access 2019, 7, 90941–90953. [Google Scholar] [CrossRef]
- Xiang, L.; Lei, L.; Chatzinotas, S.; Ottersten, B.; Schober, R. Towards Power-Efficient Aerial Communications via Dynamic Multi-UAV Cooperation. In Proceedings of the 2020 IEEE Wireless Communications and Networking Conference (WCNC), Seoul, Korea, 25–28 May 2020; pp. 1–7. [Google Scholar]
- Hu, S.; Wu, Q.; Wang, X. Energy Management and Trajectory Optimization for UAV-Enabled Legitimate Monitoring Systems. IEEE Trans. Wirel. Commun. 2021, 20, 142–155. [Google Scholar] [CrossRef]
- Zhang, X.; Ma, J.; Cheng, Z.; Huang, S.; Ge, S.S.; Lee, T.H. Trajectory Generation by Chance-Constrained Nonlinear MPC With Probabilistic Prediction. IEEE Trans. Cybern. 2020, 1–14. [Google Scholar] [CrossRef]
- Sun, C.; Ni, W.; Wang, X. Joint Computation Offloading and Trajectory Planning for UAV-Assisted Edge Computing. IEEE Trans. Wirel. Commun. 2021, 1. [Google Scholar] [CrossRef]
- Gui, G.; Liu, F.; Sun, J.; Yang, J.; Zhou, Z.; Zhao, D. Flight Delay Prediction Based on Aviation Big Data and Machine Learning. IEEE Trans. Veh. Technol. 2020, 69, 140–150. [Google Scholar] [CrossRef]
- Wang, X.; Liu, J.; Qiu, T.; Mu, C.; Chen, C.; Zhou, P. A Real-Time Collision Prediction Mechanism With Deep Learning for Intelligent Transportation System. IEEE Trans. Veh. Technol. 2020, 69, 9497–9508. [Google Scholar] [CrossRef]
- Xue, M. UAV Trajectory Modeling Using Neural Networks. In Proceedings of the 17th AIAA Aviation Technology, Integration, and Operations Conference, Denver, CO, USA, 5–9 June 2017. [Google Scholar]
- Alligier, R.; Gianazza, D. Learning aircraft operational factors to improve aircraft climb prediction: A large scale multi-airport study. Transp. Res. Part C: Emerg. Technol. 2018, 96, 72–95. [Google Scholar] [CrossRef] [Green Version]
- Cherian, A.K.; Rai, A.; Jain, V. Flight trajectory prediction for air traffic management. J. Crit. Rev. 2020, 7, 412–416. [Google Scholar] [CrossRef]
- Barratt, S.T.; Kochenderfer, M.J.; Boyd, S.P. Learning Probabilistic Trajectory Models of Aircraft in Terminal Airspace From Position Data. IEEE Trans. Intell. Transp. Syst. 2018, 20, 3536–3545. [Google Scholar] [CrossRef]
- Wang, Z.; Liang, M.; Delahaye, D. Data-driven Conflict Detection Enhancement in 3D Airspace with Machine Learning. In Proceedings of the 2020 International Conference on Artificial Intelligence and Data Analytics for Air Transportation (AIDA-AT), Singapore; 2020; pp. 1–9. [Google Scholar] [CrossRef] [Green Version]
- Ma, L.; Tian, S. A Hybrid CNN-LSTM Model for Aircraft 4D Trajectory Prediction. IEEE Access 2020, 8, 134668–134680. [Google Scholar] [CrossRef]
- Zeng, W.; Quan, Z.; Zhao, Z.; Xie, C.; Lu, X. A Deep Learning Approach for Aircraft Trajectory Prediction in Terminal Airspace. IEEE Access 2020, 8, 151250–151266. [Google Scholar] [CrossRef]
- Hashemi, S.M.; Botez, R.M.; Grigorie, L.T. New Reliability Studies of Data-Driven Aircraft Trajectory Prediction. Aerospace 2020, 7, 145. [Google Scholar] [CrossRef]
- Casado, R.; Bermúdez, A. Neural Network-Based Aircraft Conflict Prediction in Final Approach Maneuvers. Electronics 2020, 9, 1708. [Google Scholar] [CrossRef]
- Galkin, B.; Kibilda, J.; DaSilva, L.A. A Stochastic Model for UAV Networks Positioned Above Demand Hotspots in Urban Environments. IEEE Trans. Veh. Technol. 2019, 68, 6985–6996. [Google Scholar] [CrossRef] [Green Version]
- Qadir, Z.; Ullah, F.; Munawar, H.S.; Al-Turjman, F. Addressing disasters in smart cities through UAVs path planning and 5G communications: A systematic review. Comput. Commun. 2021, 168, 114–135. [Google Scholar] [CrossRef]
- Khoufi, I.; Laouiti, A.; Adjih, C.; Hadded, M. UAVs Trajectory Optimization for Data Pick Up and Delivery with Time Window. Drones 2021, 5, 27. [Google Scholar] [CrossRef]
- Barrado, C.; Boyero, M.; Brucculeri, L.; Ferrara, G.; Hately, A.; Hullah, P.; Martin-Marrero, D.; Pastor, E.; Rushton, A.P.; Volkert, A. U-Space Concept of Operations: A Key Enabler for Opening Airspace to Emerging Low-Altitude Operations. Aerospace 2020, 7, 24. [Google Scholar] [CrossRef] [Green Version]
- Regulation (EU) 2019/945 of 12 March 2019 on Unmanned Aircraft Systems and on Third-Country Operators of Unmanned Aircraft Systems. Available online: https://eur-lex.europa.eu/legal-content/EN/TXT/?uri=CELEX:32019R0945 (accessed on 13 July 2021).
- Regulation (EU) 2019/947 of 24 May 2019 on the Rules and Procedures for the Operation of Unmanned Aircraft. Available online: https://eur-lex.europa.eu/legal-content/EN/TXT/?uri=CELEX:32019R0947 (accessed on 13 July 2021).
- Eurocontrol, Concept of Operations for European UTM Systems. Available online: https://www.eurocontrol.int/project/concept-operations-european-utm-systems. (accessed on 13 May 2021).
- SESAR Joint Undertaking, “AMU-LED”. Available online: https://www.sesarju.eu/projects/AMU-LED. (accessed on 13 May 2021).
- LaValle, S.M. Planning Algorithms; Cambridge University Press: Cambridge, UK, 2006. [Google Scholar]
- DJI, Mavic 2 Enterprise. Available online: https://www.dji.com/it/mavic-2-enterprise. (accessed on 13 May 2021).
- UgCS. Leading Drone Control Software to Elevate Your Productivity. 2019. Available online: https://www.ugcs.com/ (accessed on 4 March 2019).
- Regulation (EU) 2020/639 of 12 May 2020 Amending Implementing Regulation (EU) 2019/947 as Regards Standard Scenarios for Operations Executed in or Beyond the Visual Line of Sight. Available online: https://eur-lex.europa.eu/eli/reg_impl/2020/639/oj. (accessed on 13 July 2021).
- Chatfield, A.B. Fundamentals of High Accuracy Inertial Navigation; AIAA: Reston, VA, USA, 1997. [Google Scholar]
- Conte, C.; Accardo, D.; Rufino, G. Trajectory Flight-Time Prediction based on Machine Learning for Unmanned Traffic Management. In Proceedings of the 2020 AIAA/IEEE 39th Digital Avionics Systems Conference (DASC), San Antonio, TX, USA, 11–15 October 2020; pp. 1–6. [Google Scholar]
- Goodfellow, I.; Bengio, Y.; Courville, A. Deep Learning; The MIT Press: Cambridge, MA, USA, 2016. [Google Scholar]
- Hassan, H.; Ahmed, I.; Ahmad, R.; Khammari, H.; Bhatti, G.; Ahmed, W.; Alam, M.M. A Machine Learning Approach to Achieving Energy Efficiency in Relay-Assisted LTE-A Downlink System. Sensors 2019, 19, 3461. [Google Scholar] [CrossRef] [Green Version]
- Garbett, L.G. Admiral Sir Francis Beaufort and the Beaufort Scales of wind and weather. Q. J. R. Meteorol. Soc. 1926, 52, 161–172. [Google Scholar] [CrossRef]


| T60 | T180 | |||
|---|---|---|---|---|
| 40 m | 30 m | 40 m | 30 m | |
| Ground speed mean value (m/s) | 5.0 | 5.0 | 5.0 | 5.0 |
| Ground speed std deviation (m/s) | 0.2 | 0.2 | 0.2 | 0.2 |
| Distance corner side length mean value (m) | 32 | 22 | 33 | 22 |
| Distance corner side length std deviation (m) | 0.6 | 0.5 | 0.4 | 0.4 |
| Flight-time mean value (s) | 6.5 | 4.5 | 6.6 | 4.5 |
| Flight-time std deviation (s) | 0.13 | 0.07 | 0.16 | 0.12 |
| Path ID | n Samples | Std (m) |
|---|---|---|
| A0 | 17 | 0.5 |
| A30 | 7 | 0.3 |
| A60 | 8 | 0.3 |
| A90 | 18 | 0.5 |
| A120 | 57 | 0.9 |
| A150 | 26 | 0.6 |
| A180 | 5 | 0.2 |
| Path ID | Height Mean Value (m) | Height Std (m) |
|---|---|---|
| A0 | 19.9 | 0.2 |
| A30 | 20.0 | 0.2 |
| A60 | 20.0 | 0.2 |
| A90 | 19.9 | 0.2 |
| A120 | 20.0 | 0.2 |
| A150 | 20.0 | 0.2 |
| A180 | 19.9 | 0.2 |
| Path ID | Corner Length Mean Value (m) | Corner Length Std (m) |
|---|---|---|
| A0 | 30.0 | 0.4 |
| A30 | 30.0 | 0.6 |
| A60 | 30.0 | 0.4 |
| A90 | 30.0 | 0.5 |
| A120 | 30.0 | 0.4 |
| A150 | 30.0 | 0.4 |
| A180 | 30.0 | 0.4 |
| Path ID | Number of Valid Samples |
|---|---|
| A0 | 75 |
| A30 | 55 |
| A60 | 58 |
| A90 | 69 |
| A120 | 59 |
| A150 | 68 |
| A180 | 58 |
| Total Number | 442 |
| NN Performance | Training Phase | Test Phase |
|---|---|---|
| Percentage Error | 4.5% | 5.0% |
| Method Performance | Test Path 1 3 Laps | Test Path 2 1 Lap | Test Path 3 3 Laps | Test Path 4 3 Laps |
|---|---|---|---|---|
| Real flight time (s) | 272.3 | 97.1 | 239.6 | 245.3 |
| Predicted flight time (s) | 263.6 | 96.9 | 240.1 | 250.2 |
| Predicted percentage error | 3.2% | 0.2% | −0.2% | −2.0% |
| Flight time at nominal speed (s) | 180.0 | 69.1 | 162.0 | 177.0 |
| Benchmark percentage error | 34% | 29% | 32% | 28% |
| Time to CPA | 1 Lap | 2 Laps | 3 Laps |
|---|---|---|---|
| Real time to CPA (s) | 58.5 | 138.9 | 220.0 |
| Predicted time to CPA (s) | 57.3 | 140.8 | 215.0 |
Publisher’s Note: MDPI stays neutral with regard to jurisdictional claims in published maps and institutional affiliations. |
© 2021 by the authors. Licensee MDPI, Basel, Switzerland. This article is an open access article distributed under the terms and conditions of the Creative Commons Attribution (CC BY) license (https://creativecommons.org/licenses/by/4.0/).
Share and Cite
Conte, C.; de Alteriis, G.; Schiano Lo Moriello, R.; Accardo, D.; Rufino, G. Drone Trajectory Segmentation for Real-Time and Adaptive Time-Of-Flight Prediction. Drones 2021, 5, 62. https://doi.org/10.3390/drones5030062
Conte C, de Alteriis G, Schiano Lo Moriello R, Accardo D, Rufino G. Drone Trajectory Segmentation for Real-Time and Adaptive Time-Of-Flight Prediction. Drones. 2021; 5(3):62. https://doi.org/10.3390/drones5030062
Chicago/Turabian StyleConte, Claudia, Giorgio de Alteriis, Rosario Schiano Lo Moriello, Domenico Accardo, and Giancarlo Rufino. 2021. "Drone Trajectory Segmentation for Real-Time and Adaptive Time-Of-Flight Prediction" Drones 5, no. 3: 62. https://doi.org/10.3390/drones5030062