Article

Mobile and Immobile Obstacles in Supported Lipid Bilayer Systems and Their Effect on Lipid Mobility

by
Luisa Coen
,
Daniel Alexander Kuckla
,
Andreas Neusch
and
Cornelia Monzel
*
Experimental Medical Physics, Heinrich-Heine University, 40225 Düsseldorf, Germany
*
Author to whom correspondence should be addressed.
Colloids Interfaces 2024, 8(5), 54; https://doi.org/10.3390/colloids8050054
Submission received: 13 July 2024 / Revised: 2 September 2024 / Accepted: 20 September 2024 / Published: 24 September 2024

Abstract

:
Diffusion and immobilization of molecules in biomembranes are essential for life. Understanding it is crucial for biomimetic approaches where well-defined substrates are created for live cell assays or biomaterial development. Here, we present biomimetic model systems consisting of a supported lipid bilayer and membrane coupled proteins to study the influence of lipid–lipid and lipid–protein interactions on membrane mobility. To characterize the diffusion of lipids or proteins, the continuous photobleaching technique is used. Either Neutravidin coupled to DOPE-cap-Biotin lipids or GFP coupled to DOGS-NTA lipids is studied at 0.005–0.5 mol% concentration of the linker lipid. Neutravidin creates mobile obstacles in the membrane, while GFP coupling results in immobile obstacles. By actin filament coupling to Neutravidin-lipid complexes, obstacles are crosslinked, resulting in lipid mobility reduction along with the appearance of a membrane texture. Theoretical considerations accurately describe lipid diffusion changes at high obstacle concentration as a function of obstacle size and viscous effects. The mobility of membrane lipids depends on the concentration of protein-binding lipids and on the concentration and charge of the coupled protein. Next to diffusion and friction coefficients, we determine the effective obstacle size as well as a charge-dependent effect that dominates the decrease in lipid mobility.

Graphical Abstract

1. Introduction

Changes in lipid and protein mobility in the plasma membrane are a hallmark of many vital biological functions [1], such as adhesion [2,3], recognition [4], or transport [5], and contribute to the formation of biomolecular condensates [6]. Next to the understanding of biological membranes, mobility changes in synthetic systems may further be harnessed for biotechnological applications [7,8,9]. On a molecular scale, a breakdown of mobility in the cellular membrane has been attributed to the combined effect of molecular crowding on the cell surface, hydrodynamic drag, molecular interactions, or attachment of peripheral proteins, such as the cytoskeleton [10,11]. Most recently, it was shown that drug treatment influences the diffusion of transmembrane proteins [12]. Biological and biophysical studies have probed each of these effects in cells [13,14,15,16,17,18]; however, in cellular studies, it is difficult to quantify and separate their respective contributions.
To study the influence of individual membrane components on the local membrane dynamics, simplified synthetic membranes, such as supported lipid bilayers (SLB) [19,20,21,22,23], or giant unilamellar vesicles [24,25,26,27,28,29,30,31] proved to be powerful systems. While SLBs are particularly suitable for examination under the microscope due to their planarity, other aspects such as membrane curvature can only be examined with vesicles [32,33]. Lipid diffusion in the membrane was shown to be affected by introducing discrete obstacles, such as non-diffusing protein clusters, membrane adhesion sites, or artificial barriers [34]. For example, (i) membrane-associated proteins (coupled or reconstituted into the membrane) that oligomerize, reduced lipid mobility within the membrane [19,22,35]; (ii) specific adhesion of membranes to a solid surface inevitably led to an immobilization of bound receptors and associated lipids [36,37,38,39]; and (iii) micropatterned barriers have been demonstrated to inhibit free lipid diffusion [40]. Another prominent example is the cortical cytoskeleton, a dense fiber network of actin and spectrin, connecting to the plasma membrane via lipid-binding proteins, transmembrane proteins, or membrane-attached proteins [41,42,43,44]. These examples show that obstacles may appear in different geometries, in a mobile or immobile form, and may consist of several molecules due to multivalent coupling or (non-)specific interactions. The model membranes mentioned exhibit rich structural and dynamical behavior in the presence of obstacles; yet, systematic and quantitative studies on how obstacles alter membrane molecular mobility are sparse [45,46].
It is extremely important to know the influence of each membrane component (different lipids and proteins, etc.) on membrane mobility for the future design of these systems for biotechnological applications. For example, these mimetic models serve as well-defined substrates to understand and modify cell adhesion and signaling processes [47,48] and, to this end, must be precisely understood. Other diffusion-specific examples include the following: (1) Diffusion controls the frequency of random protein–protein encounters, which underlies other cellular processes [49]; (2) it has been shown in bacteria that diffusion and membrane viscosity have an influence on the rates of respiratory metabolism and cell growth [50]; and (3) diffusion of transmembrane proteins can be reduced by drug treatment [12]. In addition, (4) SLBs with the surface glycoprotein hemagglutin can serve as model systems for the viral envelope of Influenza A H1N1 and can give insights into the stability of the virus at low humidity [23]. (5) Furthermore, SLBs can be used as highly tunable substrates to let cells adhere to them. For example, CAR T cells were placed on a SLB in order to precisely control which proteins are presented to the receptor of the CAR T cells [51].
A breakdown of mobility can arise from specific molecular interactions, Coulomb or van der Waals forces, as well as physical forces due to friction within the membrane [52], at the membrane-buffer or the membrane-substrate interface [53]. For the diffusion of lipids in a bilayer, different theoretical models of increasing complexity have been developed and are applied in this work: (1) a basic model by Saffman and Delbrück [54], which was later verified by Axelrod [55], where cylindrical objects diffuse thermally within a two-dimensional homogeneous membrane (for larger membrane inclusions, the model was further extended [56]); (2) an extended model by Evans and Sackmann [57], which was verified experimentally by Merkel et al. [58] and others [59] to describe a supported lipid bilayer where the embedded object exhibits an increased hydrodynamic drag due to interaction with the membrane–substrate interface; and (3) the theory by Saxton, which, along with other models, deals with the variable nature of the membrane components where tracers diffuse around immobilized or mobile lipid or protein obstacles [60,61]. Here, we use these models and test Saxton’s theory to describe lipid tracer mobility in the presence of mobile or immobile obstacles in the membrane.
In this work, we present a systematic experimental study on how lipids within the membrane, or proteins coupled to the membrane, give rise to lipid mobility changes in a supported lipid bilayer. To this end, we use an in vitro model system consisting of a SLB doped with an increasing concentration of linker lipids and couple either GFP or Neutravidin proteins to the membrane surface. Next to these lipid and lipid–protein obstacles, an actin network is used to crosslink lipid–protein complexes (see Figure 1). Expanding on previous studies [62,63,64,65], our system enables the direct quantification of diffusion constant changes and friction in the different membrane systems. We observe significant lipid mobility changes already when different linker lipid concentrations are used, further reduced by the coupling of proteins to the membrane, and find that obstacle crosslinking by actin gives rise to a membrane texture.

2. Materials and Methods

2.1. Materials

All lipids: SOPC (1-stearoyl-2-oleoyl-sn-glycero-3-phosphocholine), DOPE-NBD (1,2-dioleoyl-sn-glycero-3-phosphoethanolamine-N-(7-nitro-2-1,3-benzoxadiazol-4-yl)), NBD-DOPE (1-oleoyl-2-{12-[(7-nitro-2-1.3-benzoxadiazol-4-yl)amino]dodecanoyl}-sn-glycero-3-phosphoethanolamine), DOPE-Cy5 (1,2-dioleoyl-sn-glycero-3-phosphoethanolamine-N-(Cyanine 5)), DOPE-cap-biotin (1,2-dioleoyl-sn-glycero-3-phosphoethano-lamine-N-(cap biotinyl), and DOGS-NTA (1,2-dioleoyl-sn-glycero-3-[(N-(5-amino-1-carboxypentyl)iminodiacetic acid)succinyl] (nickel salt)) were purchased from Avanti Polar Lipids (Birmingham, AL, USA) and used without further purification.
The Green Fluorescent Protein (GFP) with a 6-Histidine tag on the N-terminus was purchased from Merck (Darmstadt, Germany; UniProt ID: P42212). To ensure that protein samples were free from small oligomers, GFP was reconstituted in PBS (140 mM NaCl, 3 mM KCl, 10 mM Na2HPO4, 2 mM KH2PO4, pH 7.5) and ultracentrifuged at 214,880 rcf at 4 °C for 2 h. For GFP coupling to DOGS-NTA, nickel(II) chloride (NiCl2·6H2O, Sigma-Aldrich, St. Louis, MO, USA) was used. Neutravidin covalently linked to the fluorescent dye Oregon Green (488 conjugate), termed NAVOG, or linked to the fluorescent dye tetramethylrhodamine, termed NAVTMR, was purchased from Thermo Fisher Scientific Inc. (Waltham, MA, USA). NAVOG and NAVTMR were treated equally to GFP. Preformed actin filaments from rabbit skeletal muscles (Cytoskeleton Inc., Denver, CO, USA) were bound to NAVTMR via Biotin-XX Phalloidin (PromoCell, Heidelberg, Germany). The actin filaments were stained with Acti-Stain 488 Phalloidin (Cytoskeleton Inc., Denver, CO, USA). Thickness-corrected glass coverslips (d = 170 ± 5 µm, Paul Marienfeld, Lauda-Königshofen, Germany) were cleaned as follows: ultrasonication in a 2% Hellmanex solution (Hellma, Müllheim, Germany) for 15 min followed by two cycles of ultrasonication for the same duration in ultrapure water. Ultrapure water was produced by a water purification system (Milli-Q Gradient A10, Merck Millipore, Burlington, MA, USA). After each ultrasonic treatment, the coverslips were rinsed 10 times with ultrapure water.

2.2. Sample Preparation

Supported lipid bilayers (SLBs) were prepared with a film balance (Biolin Scientific, KSV Nima, Gothenburg, Sweden) using the Langmuir–Blodgett [66,67] technique for the first layer and a modified Langmuir–Schäfer technique for the second layer. As a modification for the second layer, the glass substrate with the first layer was pressed onto the second lipid layer and into the subphase. The subphase was ultrapure water. The first membrane layer consisted of 2 mg/mL pure SOPC. In the second layer, next to the matrix lipid SOPC, 2.5 mol% of a fluorescent lipid was added: DOPE-Cy5, DOPE-NBD, or NBD-DOPE. In addition, the protein-anchor lipids DOGS-NTA or DOPE-Cap-Biotin were included in concentrations of 0.5 mol%, 0.05 mol%, or 0.005 mol% for DOGS-NTA, and 10 mol%, 5 mol%, 0.5 mol%, 0.05 mol%, 0.025 mol%, or 0.005 mol% for DOPE-Cap-Biotin. All SLB layers were prepared at a transfer pressure of 25 mN/m and were constantly kept underwater. In order to passivate the SLB surface and to diminish nonspecific binding, SLBs were passivated with BSA (Bovine Serum Albumin Fraction V, ITW Reagents, Monza, Italy) dissolved in PBS (5 mg/mL) for 15 min. For SLBs containing DOGS-NTA, the sample was incubated with nickel(II) chloride in large excess at a final concentration of at least 5 mM for 45 min at 37 °C to prepare the NTA binding site for GFP coupling via its His-tag. Thereafter, GFP was incubated in large excess with a concentration of at least 1 mg/mL for 48 h at 5 °C. After each step, excess nickel(II) chloride or GFP was removed by a tenfold exchange of PBS. To prepare the Biotin–Neutravidin system, the SLB containing DOPE-Cap-Biotin was incubated after BSA passivation with NAVOG in large excess at a final concentration of at least 50 µg/mL (400 µL total volume) for 1.5 h at room temperature. Excess proteins were removed using ten washing steps as before. To produce the Biotin–Neutravidin–Actin system, SLBs containing DOPE-Cap-Biotin were passivated with BSA and NAVTMR as described in the case of NAVOG coupling. Afterwards, the SLB was incubated with 2 µM (300 µL) Biotin-XX Phalloidin for 40 min at room temperature and thereafter with 35 µg/mL (300 µL) of preformed actin filaments for 20 min at room temperature. Finally, the sample was incubated with 1 µM (300 µL) actin-stain 488 phalloidin for 20 min at room temperature. In between and after the last incubation step, the sample was washed ten times with PBS. Prior to imaging, SLBs were scanned extensively to ensure their homogeneity.

2.3. Image Acquisition

All movies were recorded with the epifluorescence IX73 microscope from Olympus (Olympus Corporation, Tokyo, Japan), equipped with a 60x NA 1.25 objective (Olympus Corporation, 60x Planfluor PH3 UPLFLN60XOIPH/1.25, Tokyo, Japan). All samples were illuminated via the solid-state light source SOLA SE 395 light engine (Lumencor, Beaverton, OR, USA). Appropriate excitation (482/18 (green), 563/9 (red), 563/18 (far red)) and emission filters (525/39 (green), 595/31 (red), 655+ (far red); all from AHF Analysentechnik AG, Tübingen, Germany) were used to only excite and detect light from the fluorophore of interest. Furthermore, illumination intensities were chosen to observe the bleaching process in a reasonable amount of time (~5–15 min). Illuminated regions of interest were chosen large enough to ensure complete bleaching of diffusing lipids once they reached the center of the bleached area. Each movie consisted of 300 images, corresponding to a measurement time of 5 to 15 min depending on the exposure time. Movies were recorded at room temperature (21 °C) in different locations on each SLB to obtain robust average diffusion constants.

2.4. Measurements of Diffusion Constants

The diffusion constant is determined here using a technique called continuous photobleaching (CP) [68]. It is applicable to a wide range of fluorophores since it is not dependent on the instantaneous bleaching of fluorophores like in fluorescent recovery after photobleaching (FRAP). In addition, CP has the advantage in determining the diffusion constant over a large measuring area, making the diffusion constant more robust and representative of the whole sample. In CP, the diffusion constant of proteins or lipids is derived from continuously bleaching a region of interest (ROI) on the SLB (see Video S1). To select the ROI, the field diaphragm of the microscope is closed to about 1/3 of the field of view. Thus, fluorescent lipids that enter or are present within the ROI are continuously bleached, causing the intensity at the center to vanish completely. Due to lipid or protein diffusion in the membrane, lipids and proteins located at the edge of the field diaphragm can be replaced by unbleached ones, giving rise to a bright fluorescent signal at the edge of the diaphragm (see Figure 2). This fluorescent signal exponentially decays toward the center of the ROI. At the center, the fluorescence vanishes over long time scales. During the entire process of bleaching and diffusion, a bleaching curve is recorded at the center of the ROI. This is also referred to as the temporal intensity profile. After reaching a steady state, the spatial intensity profile is recorded and evaluated at a fixed time point.
The temporal intensity profile at the central position hence depends only on the bleaching rate B of the fluorophore [19]:
I t = I 0 · e B t + I B g
Here, I0 is the intensity at the center of the area at the beginning of the recording, t is the time, and IBg is the background intensity. The spatial intensity profile from the edge of the ROI toward the center follows a simple exponential function that depends on the bleaching rate and the diffusion constant [19]:
I x = I 0 · e x B / D + I B g
where x is the spatial coordinate from the edge toward the center. Experimentally, the temporal intensity profile at the center was derived by averaging the intensity over a 5 × 5 pixel square. The spatial intensity profile was derived from the last acquired frame from 4 lines, which were averaged over a width of 5 pixels. A diffusion constant was determined from the fit to each line and an average value from these 4 lines (see Figure 2) was calculated. Errors are standard deviations of intensities or errors in fit parameters. For an automated evaluation, self-written routines in Matlab (R2018a, The Math Works, Natick, MA, USA) were used.

2.5. Statistical Analyses

Statistical analyses were performed using Matlab (R2018a-R2021a). All samples prepared and measured under identical conditions were combined in one boxplot. A Wilcoxon rank-sum test was used to identify significance levels of diffusion constant changes between samples. Significance levels p are defined as follows: n.s.: p > 0.05, *: p ≤ 0.05, **: p ≤ 0.01, ***: p ≤ 0.001.

2.6. Theory

There are various models for describing diffusion in lipid membranes. The first and simplest is the theory of Saffman and Delbrück [54], which describes the diffusion of a lipid in a homogeneous fluid. The theory of Evans and Sackmann [57] further includes frictional effects that occur in the SLBs. Mobile obstacles are taken into account in Saxton’s theory [60]. These models are applied to the systems used in this study. A detailed explanation of the theories can be found in the Supplementary Materials.

3. Results and Discussion

3.1. General Characterization of the SLB

In this study, SLBs are chosen as an appropriate model system due to the high control of lipid composition and packing density, along with the easy production process. With SLBs not only can the molecular composition be controlled, but also other important parameters such as the membrane phase, the lipid lateral density, and their biofunctionalization. In addition, SLBs are suitable for various microscopic imaging techniques (TIRF, RICM, FCS, CP, FRAP, etc.) to allow for the quantification of system parameters (e.g., cell–bilayer interactions, as in [48,51]). Furthermore, in SLBs, it is possible to compose the two lipid layers differently, which we used here to minimize the effects of the membrane–substrate interaction. Nevertheless, the limitations of using SLBs must also be recognized. Primarily, this due to the limited lipid or protein mobility, which leads to an underestimation of the diffusion constant compared to free-standing membranes (black-lipid membranes or GUVs) [69,70,71]. However, our measured diffusion constants compare well to those measured in cell membranes (0.8–3.7 µm2/s for different membrane tracers), and based on the previously mentioned advantages, SLBs are the most suitable model system for the present study.
Prior to the probing effects of protein–lipid interactions, we determined lipid diffusion in a simplified SLB, consisting only of a matrix lipid and doped with a tracer lipid. We tested whether these measurements compare well with those of other publications and whether the theoretical approximation allows assuming unhindered diffusion in an obstacle-free system. SLBs were fabricated at a final lateral pressure of 25 mN/m, where lipids cover a 63 2 area per molecule. This value was derived from the measured isotherm, which further verified a homogeneous fluid membrane phase [72]. To verify unconstrained lipid mobility, we first determined the diffusion constant of the fluorescent tracer lipid DOPE-NBD in an otherwise pure SOPC SLB. Here, a diffusion constant of (2.4 ± 0.2) µm2/s was obtained (N = 46 measurements, S = 5 independent samples). This value is, within error margins, identical to the diffusion constant of SOPC measured by Fenz et al. ((2.5 ± 0.2) µm2/s) [19], also using NBD as tracer fluorophore, as well as measured by Horton et al. ((2.3 ± 0.4) µm2/s) [35], using TR-DPPE as a tracer lipid [35]. Since the SLB here consisted only of tracer lipids and SOPC, but no additional components, the Saffman/Delbrück theory is readily applied to theoretically calculate the diffusion constant in an obstacle-free membrane, which amounted to 1.9 µm2/s. Here, the lipid radius a = 4.5 Å (from the measured lipid area) and the lipid membrane height h = 4 nm were used [73]. η = 0.1 kg/(m · s), η ' = 1 · 10 3 kg/(m · s), and ɣ = 0.5772 were taken from the original publication by Saffman and Delbrück [54]. The theoretical model is in high agreement with the experimentally determined tracer diffusion constant, with the experimental values slightly exceeding the theoretical estimate. It should be noted that recent lipid molecule tracking experiments find that an extended Saffman–Delbrück model must be used, when measurements on a single-molecule scale are performed, to correctly describe the membrane hydrodynamics [74]. For our microscale measurements, however, the venerable Saffman/Delbrück theory (Equation (S1)) applies. Hence, our diffusion constants are typical of free lipid diffusion in a membrane [75], corroborating our conclusion of unconstrained diffusion in an obstacle-free system for this membrane configuration.
We then tested whether the position of the lipid fluorophore label has a significant impact on the diffusion constant and found that headgroup-labeled lipids generate fewer friction effects. Using a SLB composition as before, with only the headgroup-labeled DOPE-NBD exchanged with the NBD chain-labeled DOPE (NBD-DOPE), the diffusion constants amounted to (1.9 ± 0.1) µm2/s (N = 9, S = 2) in comparison to (2.4 ± 0.2) µm2/s in the case of DOPE-NBD (see Figure S1). Thus, the chain labeling causes a larger friction in the system. For the following experiments, we decided to use headgroup-labeled lipids in order to minimize any friction effects arising from the lipid label. Since the NBD spectrum overlaps with the green fluorescence of the coupled proteins, the lipid DOPE with headgroup-coupled fluorophore Cy5, i.e., DOPE-Cy5, was tested as a tracer molecule in the following experiments. To ensure comparability throughout the measurements, identical illumination settings were used, and lamp intensities were chosen just high enough to ensure bleaching of all fluorophores once they reached the center of the selected ROI.

3.2. Immobile Obstacles

GFP turned out to be an immobile obstacle using CP (see Figure S2), i.e., it exhibits a diffusion constant that is at least two orders of magnitude slower than lipid diffusion, which is the estimated detection limit of CP. With CP, no bright ring at the edge of the ROI could be detected (see Figure S2), indicating no diffusion. Nevertheless, it is possible that GFP diffuses very slowly, which is not detectable with CP. Other methods have indeed shown that GFP is mobile when coupled to the SLB via a His-Tag, albeit very slowly (0.026–0.009 µm2/s) [23]. Since the lipids will not ‘perceive’ the movement of GFP, given these values, the NTA-GFP system thus served as an example to effectively study immobile obstacles in the context of lipid diffusion in membranes. First, the diffusion constants of tracer lipids were measured in SLBs with linker concentrations of 0 mol%, 0.005 mol%, 0.05 mol%, and 0.5 mol%. Diffusion constants were measured before and after passivation with bovine serum albumin (BSA), a protein used to passivate the bilayer against nonspecific interactions, as well as after GFP coupling, whose His-Tag specifically binds to DOGS-NTA. In all of the latter experiments, GFP was confirmed to be immobile on timescales of lipid diffusion.
Both an increase in the linker concentration and coupling of GFP led to a drop in the diffusion constant of the tracer lipid. Figure 3 summarizes the recorded diffusion constants of the NTA–GFP system. Intriguingly, increasing the linker concentration yielded a systematic decrease of the tracer lipid diffusion constant (see Figure 3). Thus, replacing already five out of one thousand SOPC lipids with DOGS-NTA led to a decrease in the diffusion constant by 34%. Such a decrease in diffusion constant was also observed when a lipid tracer with a chain label was used (see Figure S1). Besides the decrease in lipid mobility with increasing tracer lipid concentration, mere passivation of the control sample with BSA also resulted in a reduced diffusion constant by 18%. Even though BSA simply rests on the membrane and is used to cover up potential defects on the SLB, the hydrodynamic friction at the bilayer-BSA/buffer interface increases. GFP coupling further decreases the lipid diffusion constant on average by 69%.
A drastic increase in the friction parameter after GFP coupling indicates a high influence of friction at the protein-membrane interface. For the NTA-GFP system, we hence considered the theoretical model from Evans/Sackmann (Equations (S2) and (S3)) to calculate the friction parameter b (see Figure S3). The Saffman/Dellbrück model is no longer applicable, since an unconstrained diffusion after the introduction of linker lipids and the coupling of GFP no longer exists. The friction coefficients for SLBs doped with DOGS-NTA are in the 0.4   ·   10 8 2 · 10 8 Pa · s/m range and change only slightly with increasing amounts of DOGS-NTA. These friction coefficients are in the same range as values derived by Fenz et al. [19] and Purrucker et al. [59] using continuous photobleaching. They are also consistent with friction coefficients obtained using other techniques [58,76]. Interestingly, after GFP-coupling on the lipid head group, the friction coefficients dramatically increased to values ≥ 1 · 10 9 Pa · s/m. This change by an order of magnitude cannot be explained by an obstacle consisting of lipids alone, since friction coefficients within the membrane would only change slightly in this case. Instead, b appears to be largely influenced by friction at the membrane–protein interface. This is supported by the diffusion constant change of tracer lipids after passivation with BSA, since BSA can only interact with the lipids at the protein–membrane interface. Nevertheless, it is important to keep in mind that the model only considers weak membrane–substrate interactions [57] by an effective friction coefficient and does not consider individual contributions such as hydration forces or surface roughness. Thickness-corrected coverslips are used as the substrate to diminish surface roughness effects.
In addition to friction, charge-dependent effects could cause the immobility of GFP as well as a significant drop in tracer lipid diffusion after GFP coupling. GFP is known to carry a negative surface charge at pH 7.5, which was used in this study [77]. According to Wang et al. [78], such negatively charged molecules can lead to nonspecific interactions between SOPC—the main component of SLBs in this study—and the charged molecule. This is justified by the structure of the lipid SOPC, which exhibits a zwitterionic headgroup whose orientation highly influences lipid mobility: The phosphocholine consists of a positively charged choline group and a negatively charged phosphate group. This headgroup reorients depending on charges in the molecular environment. When the positively charged choline group is facing the surface, the head group is longitudinally oriented, resulting in a higher packing density of the lipids. The lipid is then in the gel phase, which limits its mobility. When the negatively charged phosphate group faces the surface, the head group is kinked. In this case, lipids are less densely packed in a liquid phase and are consequently more mobile [78]. It appears likely that the presence of the negatively charged GFP leads to interactions with the positively charged choline group of SOPC and its transition to a densely packed gel-phase. This is consistent with our observation of a decrease in the lipid diffusion constant.
In the following, it is shown that an increase in pH results in a smaller drop in the diffusion constant of the tracer lipid after GFP coupling. To test if the membrane and GFP mobility changes when the protein effective charge is changed, experiments with the NTA–GFP system at pH 6.4 were performed. This pH was chosen as it is closer to the pH were GFP is neutral (isoelectric point 5.7, calculated with Prot pi, Version 2.2.29.152) while avoiding the pH where histidine fused to the GFP becomes increasingly protonated (pKa of 6) and less likely to bind to Ni(II)-NTA. Figure 4 illustrates the direct comparison of lipid diffusion constants before and after GFP coupling at buffer pH 6.4 (see Figure 4) and 7.5 (see Figure 3).
Figure 4. Diffusion constants for the NTA–GFP system. DOGS-NTA concentrations of 0.005 mol%, 0.05 mol%, and 0.5 mol% were used. (a): pH of the buffer: 7.5 or 6.4. SLB alone (filled circles (pH 7.5) or unfilled circles (pH 6.4)) and after BSA passivation and GFP coupling (filled box (pH 7.5) or unfilled box (pH 6.4)). Data points are median ± MAD. (b): Table of diffusion constants for the NTA–GFP system at pH 6.4 (for changes at pH 7.5 see Figure 3b). N: Number of measurements, S: Number of independent samples, X: Passivation/coupling with the protein. Diffusion constants are measured for different linker concentrations before and after incubation with GFP. Diffusion constants are given as median ± MAD.
Colloids 08 00054 g004
To test if the change in pH has an effect only when GFP is coupled, we first determined the diffusion constants of the tracer lipid before GFP coupling at pH 6.4. Figure 4 (circles) shows that the tracer mobility perfectly agrees with the values measured at pH 7.5; therefore, in the absence of GFP, no effect arises, as desired. Interestingly, after the coupling of GFP, the diffusion constant of the tracer lipid decreases, but significantly less compared to the measurements at pH 7.5. Specifically, instead of an average decrease of 69% at pH 7.5, diffusion constants decrease by only 31% at pH 6.4. The faster diffusion of the tracer lipid can be attributed to the following: The charge-dependent interaction between GFP and the SOPC headgroup is diminished; therefore, lipid headgroups remain in the kinked orientation, keeping the lipid in the liquid phase. A second indication for the charge dependent interactions is that at pH 6.4, the more neutral GFP leads to only half as many charge-dependent interactions as the more negatively charged GFP at pH 7.5 (see Figure S4). The mobility of GFP itself, however, was not affected by this change, and GFP remained immobile at pH 7.5 and pH 6.4. Of note, BSA is also more negatively charged at pH 7.5 than at pH 6.4 [79]; therefore, BSA charge effects may also contribute to the higher diffusion constant at pH 6.4

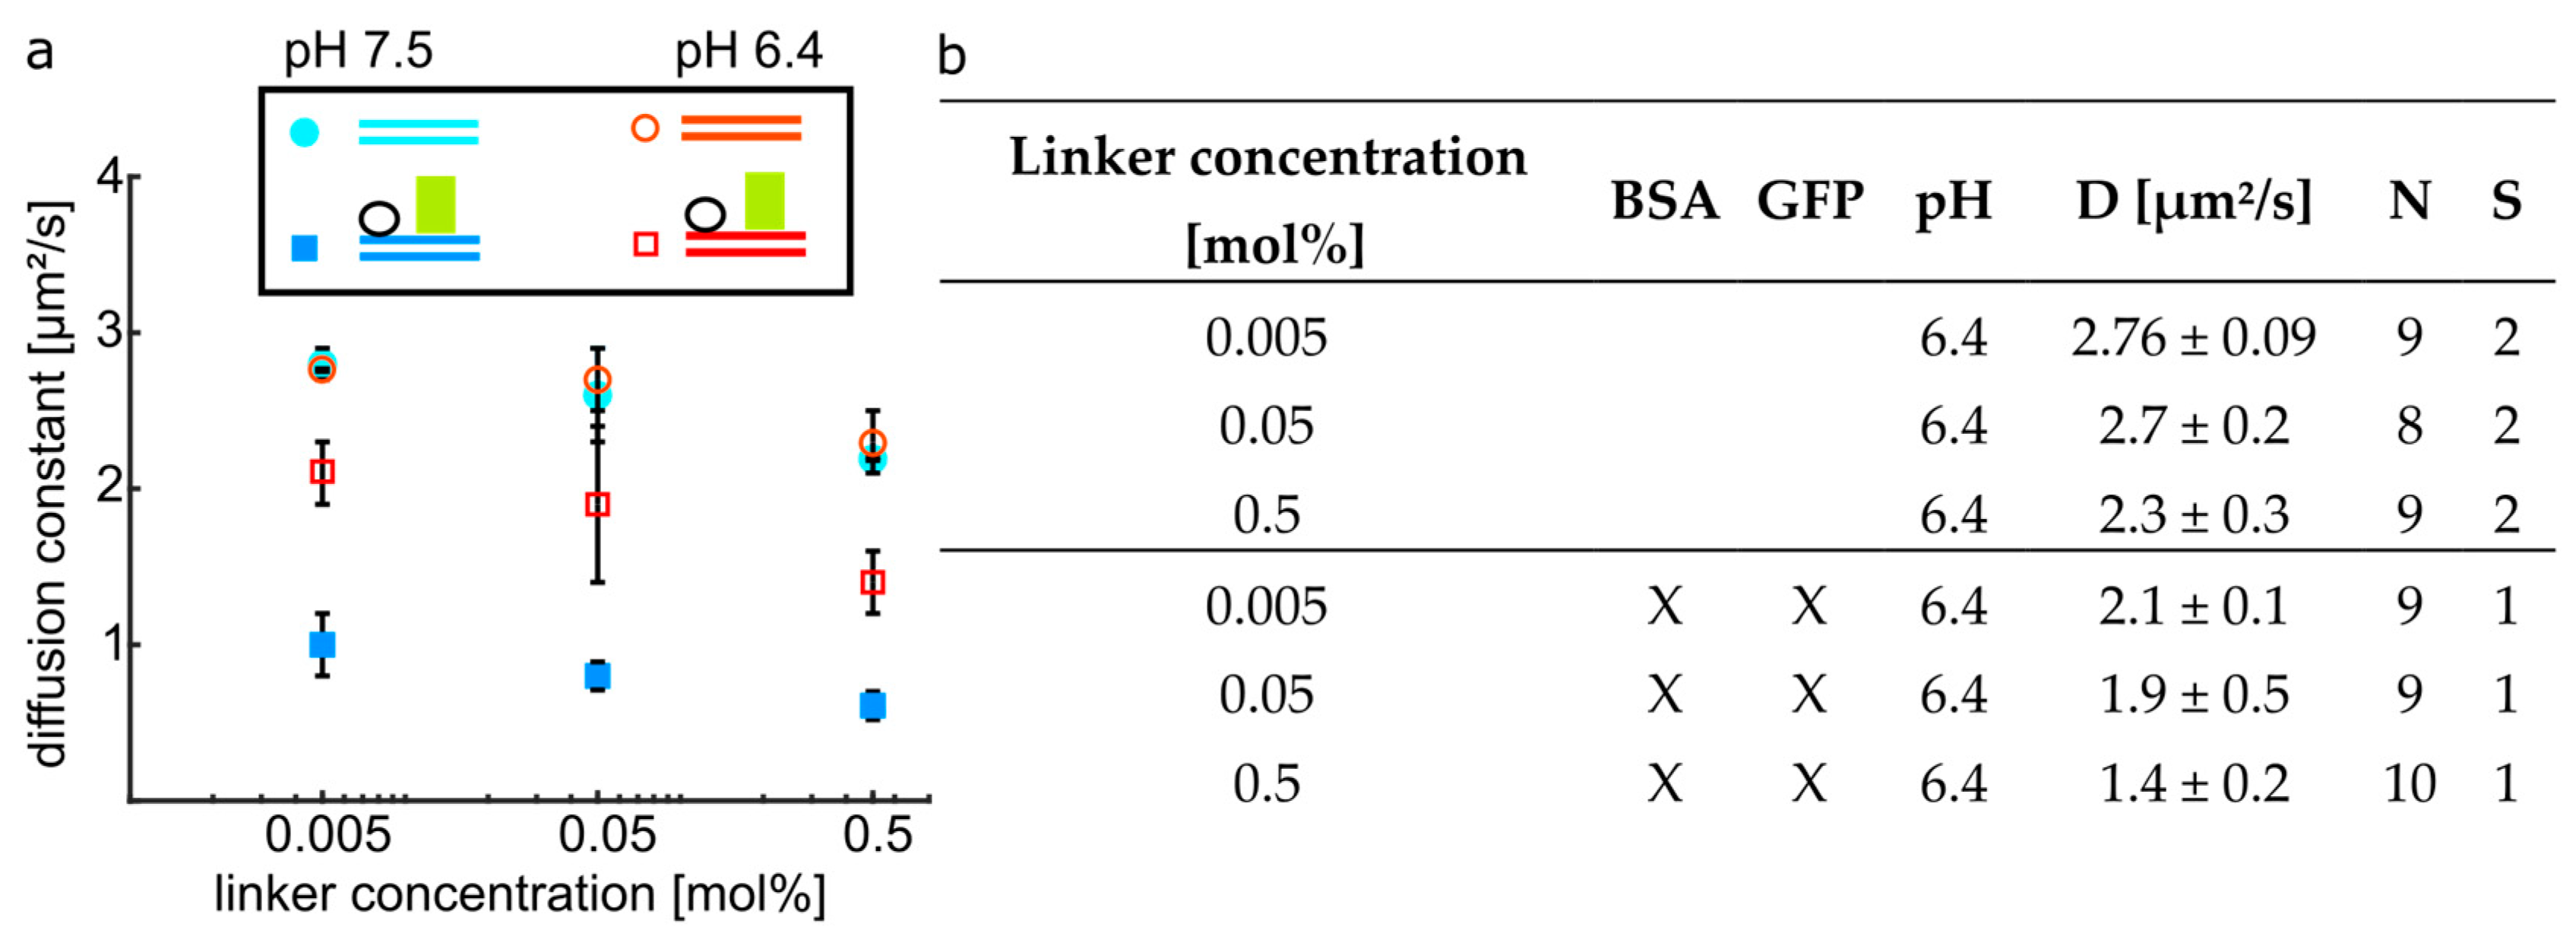
3.3. Mobile Obstacles

As an example of a mobile obstacle, the protein NAVOG was investigated. NAVOG, together with the SLB containing SOPC, DOPE-Cy5, and DOPE-Cap-Biotin lipids, form the Biotin–Neutravidin system. In this case, in addition to the diffusion constants of the tracer lipid, the diffusion constants of NAVOG were determined (see Figure 5).
Both the diffusion constant of the tracer lipid before and after protein coupling and the diffusion constant of NAVOG exhibited a decrease with increasing DOPE-Cap-Biotin concentration. Qualitatively, these results are in accordance with the study by Vaz et al. [80], who report the direct dependency of the lateral diffusion of lipids and proteins on the protein concentration in the membrane. Hence, the presence of the linker at the highest concentration in comparison to the linker-lipid-free membrane led to a drop in the diffusion constant of the tracer lipid by 22%. Coupling of NAVOG resulted in an additional average decrease in the tracer lipid mobility by 31%.
As for the NTA–GFP system, the tracer lipid diffusion here also exhibits a linker concentration dependency, which strongly decreases once the protein is coupled. For NAVOG, a nearly linear dependency between linker and protein concentration can be observed (see Figure S6). Therefore, the diffusion constant of the tracer lipid decreases with the amount of bound protein. This suggests a change in friction that occurs in a similar manner, independent of the system. Interestingly, NAVOG coupling resulted in the same average breakdown as the coupling of GFP at pH 6.4 (31%), corresponding to a comparable effective friction acting on the membrane lipids. The similar drop in membrane mobility may be attributed to a similar membrane-surface interaction of the proteins, albeit some differences can arise from the different protein sizes (28 nm2 for NAVOG; 5 nm2 for GFP). In this comparison, both proteins should be only slightly negatively charged (NAVOG at pH 7.5 with pI 6.3 [81]; GFP at pH 6.4 with pI 5.7), which should result in only a slight distortion of the matrix lipids (SOPC) into the gel phase. NAVOG turned out to be a mobile obstacle for all the recorded conditions, with measured diffusion constants reported in Figure 5. For linker concentrations of 0.025 mol% and 0.005 mol%, the number of binding sites and, hence, the number of NAVOG were too small to have a measurable intensity gradient with continuous photobleaching; therefore, no NAVOG diffusion constant could be determined. On average, the diffusion constant of the protein NAVOG was 66% lower than the diffusion constant of the lipid with bound NAVOG.
As for the NTA–GFP system, the friction parameter b was calculated for the Biotin–Neutravidin system from Equations (S2) and (S3) (see Figure S5). Here, the membrane surface viscosity, η m = 0.16 · 10 9 Pa · s/m, from Fenz et al. [19] and the hydrodynamic radius of Neutravidin, a = 3 nm, were used. The latter value is based on a theoretical calculation of protein diameters from PDB files according to the HydroPro algorithm [82]. For both the lipid and the protein, friction coefficients increased with increasing DOPE-Cap-biotin concentration. Friction coefficients for the tracer lipid alone were in the range of 1 · 10 8 Pa · s/m, which is similar to those in the NTA–GFP system and on the same order of magnitude as reported by Fenz et al. [19]. After NAVOG coupling, the values strongly increased from 4 · 10 7 Pa · s/m to 6 · 10 8 Pa · s/m with increasing linker density. Here, the effective friction is significantly smaller in comparison to the friction generated by GFP coupling in the NTA-GFP system at pH 7.5, i.e., > 10 9 Pa · s/m.
All absolute diffusion constants of the tracer lipids measured in this study are in the range of ~ 1 µm2/s. Previous studies in the adhesion zone of cells have shown that diffusion constants are of the same order of magnitude [2]. This demonstrates that the SLB model system is well suited to mimick diffusion processes in cells close to an interface.
Membrane curvature was also shown to influence diffusion. For example, Kumar et al. [32] showed in MD simulations that the diffusion constant drops with increasing membrane curvature (1/radius > 0.8 nm−1). However, this only holds for high curvatures, whereas small curvatures do not cause this effect (1/radius < 0.01 nm−1) [33]. Since the curvature of the cell membrane in adherent regions is negligibly small (roughness around 20 nm [83]), as it is the case for the planar SLB on the substrate, any curvature effect in this study should be negligible. It should be kept in mind, though, that in case of non-adherent cells or vesicle model systems, diffusion constants can be altered at high membrane curvature.
For the following study, where the influence of cytoskeleton filament coupling to the membrane is probed, and in order to enable a dense filament network formation, even higher linker concentrations, up to 10 mol%, were used. Additionally, in the case of higher linker concentrations, a declining trend in the diffusion constant is obtained. Figure 6 shows the change in the diffusion constant as a function of linker concentration for the tracer before and after coupling of NAVTMR.
Here, NAVTMR is used instead of NAVOG to allow for the subsequent imaging of green-labeled actin (see Section 3.4). Since the diffusion constant exhibited a dependency on the initial SLB fabrication pressure (see Figure S7), we plot the relative diffusion constant here. To this end, we corrected the initial SLB fabrication pressure of the Biotin–Neutravidin–Actin system (12 mN/m) for the initial pressure used in the Biotin–NAVOG system (8 mN/m) and normalized the diffusion constants to the value of the linker-free SLB. For all experimental conditions (SLB, after NAVTMR coupling, and after actin filament coupling), a decrease in membrane mobility was observed when the linker concentration in the SLB was increased. At 10 mol% linker concentration, the diffusion constant dropped by 49% compared to the linker-free case. After NAVTMR coupling, the lipid diffusion constant decreased, in the case of 5 mol% and 10 mol% linker concentrations, by 20% to 48%, respectively, in comparison to the SLB without NAVTMR.
For higher linker concentrations, we derived a measure of the effective obstacle size of ao = 12 nm2 from Saxton’s theory for the case of mobile obstacles. To this end, a triangular lattice was used as grid model (as stated in the SI section “1.3 Friction due to mobile obstacles”). From the data, the jump rate γ was extrapolated for negligible c to γ = 1, where jump rates of tracers and obstacles are identical. Figure 6 shows the comparison of experimental data with Saxton’s theory (Equations (S4) and (S5)) for different jump rates γ = 1 and 10. We then used Saxton’s theory as a fit function and set ao as a free parameter to determine the effective size of the lipid complex. The best fit was found for an effective obstacle size of ao = 12 nm2, which was less than 1 2 of the area the protein covers on the lipid membrane (5.6 nm · 5 nm = 28 nm2 [84]). Since this effective obstacle size corresponds to 19 lipids that are restricted in mobility, the theory suggests that next to the two linker lipids bound to the protein, several neighboring lipids in the membrane plane are part of the obstacle. Interestingly, Saxton’s theory accurately represents the experimentally determined values at concentrations > 0.5 mol%, but it underestimates the decrease in tracer lipid mobility in the 0.005 mol% to 0.5 mol% linker lipid regime. Since deviations could not be explained by a higher γ or a larger effective obstacle size, an extended theoretical framework would be desirable that correctly describes the diffusion dynamics in the low obstacle concentration regime as well as for the limit of immobile obstacles.

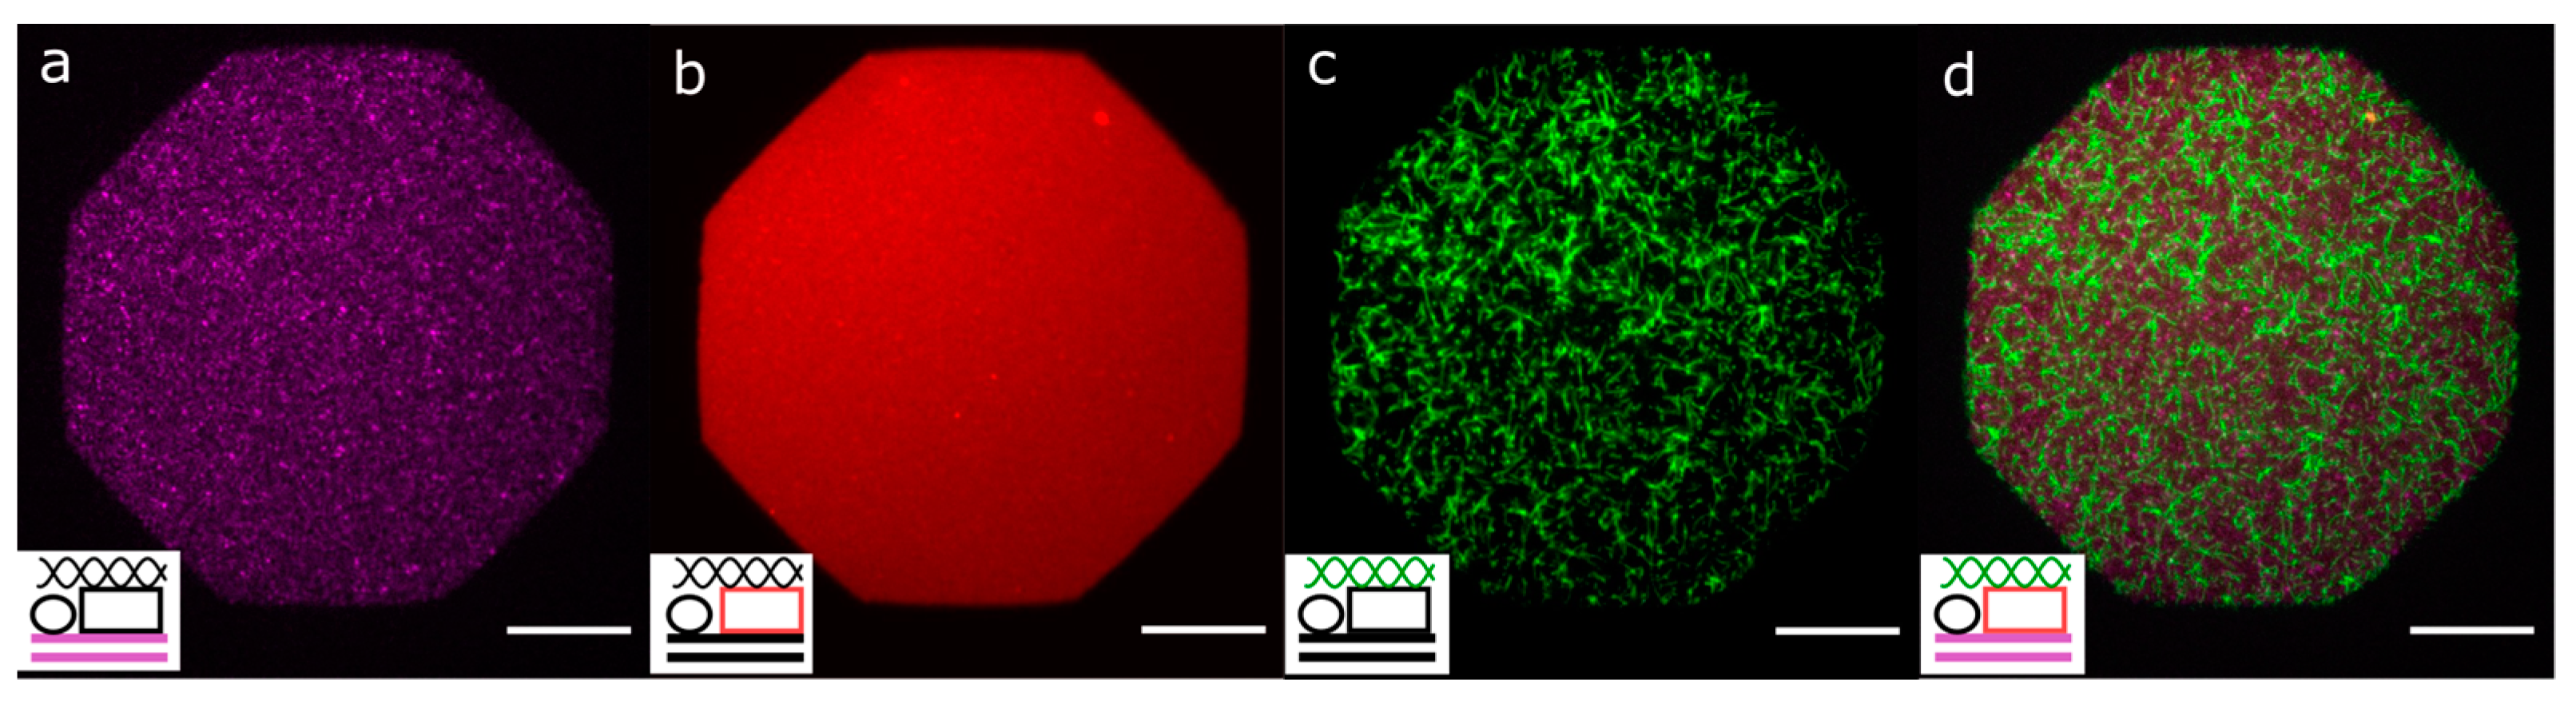
3.4. Filament to Mobile Obstacle Coupling

We then studied the influence of cytoskeleton filament coupling on the mobility of the membrane, since the anchoring of actin filaments to SLBs was recently shown to sort and phase-separate lipids in the membrane—in a similar manner as reported here, but using the highly different ternary lipid composition consisting of a saturated phospholipid, an unsaturated phospholipid, and cholesterol [85]. In the Biotin–Neutravidin–Actin system of this study (see Figure 1), phalloidin-biotin was coupled to Neutravidin on the SLB, and, thereafter, actin filaments were bound to the Phalloidin-protein complexes. Due to the substantial actin filament length of ~1–10 µm and the high phalloidin abundance on the substrate, actin filaments could crosslink several of the mobile Neutravidin obstacles. Since coupling effects were determined to become significant at linker concentrations 0.5 mol%, linker concentrations up to 10 mol% were used. A representative image of actin filaments bound to the SLB is shown in Figure 7. Note that in this system, NAVOG was replaced by NAVTMR to avoid spectral overlap with the actin-stain 488 phalloidin.
Interestingly, actin filament coupling decreased lipid mobility (see Figure 6). In the case of 0.5 mol%, 5 mol%, and 10 mol% linker concentration, the additional diffusion constant drops amounted to 22%, 20%, and 11%, respectively. The 22% drop at 0.5 mol% suggests that NAVTMR is crosslinked via actin filaments (length of ~1–10 µm) and creates obstacles of larger effective size that significantly affect the tracer lipid mobility. At 5 mol% and 10 mol% linker concentrations, the diffusion constants decrease less with actin filament crosslinking. This appears to result from the a priori high density of protein–lipid obstacles, such that the actin filament crosslinking, resulting in a larger obstacle size, is barely detectable. Overall, actin coupling created lipid–protein complexes, yielding a higher effective friction for tracer lipids within the SLB. A rough estimate of this obstacle size can be made using the theory of Petrov and Schwille [56] (Figure S8). Intriguingly, in addition to detecting changes in lipid diffusion constants, a significant change in the apparent SLB homogeneity occurred after NAVTMR and actin coupling: The SLB appeared homogeneous when NAVTMR alone was present or when actin alone without NAVTMR was incubated on the sample (see control measurements in Figure S9). However, after the actin coupling, the SLB exhibited a granular appearance. This finding matches previous studies [85] in which lipid phase separation in the presence of actin filaments was observed. In the cited case, linker lipids would colocalize with actin structures, whereas matrix lipids were expelled from these regions. However, the ternary lipid–cholesterol mixture used in the cited work is well-known to phase separate at particular temperatures and is therefore highly different from the lipid composition used in this study. Since the control measurement (see Figure S9) excludes any nonspecific interaction of actin with the membrane and since DOPE-Cy5 did not colocalize with actin filaments, we reasoned that the membrane texture arises from the steric expulsion of tracer lipids from the locations of protein–lipid complexes. This observation is of interest for more comprehensive study in a subsequent work.

4. Conclusions

Here, we investigated the effects of immobile and mobile obstacles on lipid mobility in supported bilayer systems using continuous photobleaching. GFP coupled to DOGS-NTA lipids served as an immobile obstacle system and exhibited a 69% decrease in the lipid tracer diffusion constant in comparison to the obstacle-free system. Part of this breakdown could be attributed to SOPC–GFP interactions, where the negative GFP charge would switch SOPC from the liquid into the more densely packed gel phase. Repeated experiments at a pH where GFP is neutral (but still immobile) resulted in a smaller 31% decrease in diffusion constants. Neutravidin coupled to DOPE-cap-Biotin lipids in the bio-membrane served as a mobile obstacle system. Interestingly, the coupling of Neutravidin to the bilayer resulted in the same average decrease of the tracer lipid diffusion constant as for GFP at the pH where it is neutral, suggesting a substantial friction effect at the membrane–protein interface. Additional coupling of actin filaments to Neutravidin at high linker concentrations was used as a potential crosslinker of obstacles and led to a maximum 53% breakdown of tracer lipid mobility in comparison to the obstacle free case. The decrease in lipid mobility is well described by the theory of Saxton at high linker lipid concentrations. Here, the obstacle consisted of 19 membrane lipids associating with the initially formed lipid–protein complex. This study highlights the dependency of lipid membrane mobility on linker lipid concentration as well as on the concentration, charge, and type of the coupled protein. We determined diffusion constants and friction parameters for the systems. We further found that complex lipid–protein obstacles consisting of the linker lipid and Neutravidin crosslinked by actin filaments can give rise to a visible change in membrane texture. This comprehensive study of mobility changes in biological membranes provides new insights into our present understanding of membrane mobility [1,2,15,16] and may further be harnessed in semisynthetic systems or cell studies to create well-defined biomaterials with tunable properties [7,8,9].

Supplementary Materials

The following supporting information can be downloaded at: https://www.mdpi.com/article/10.3390/colloids8050054/s1. Theory, Figure S1: Fatty acid labeled tracer; Figure S2: SLB with bound protein after bleaching; Figure S3: Calculated friction parameter for the NTA–GFP system; Figure S4: GFP intensity changes at 0 mol% linker concentration, as a function of pH; Figure S5: Calculated friction parameter for the Biotin–Neutravidin system; Figure S6: NAVOG intensity change, as a function of linker concentration of the Biotin–Neutravidin system; Figure S7: Calibration data for initial pressure correction for the Biotin–Neutravidin–Actin system; Figure S8: Diffusion constant as a function of obstacle radius; Figure S9: Representative images of the SLB before and after coupling of proteins; Supplementary references; Video S1: Continuous Photobleaching. Additional References are provided in the supporting information [86,87,88].

Author Contributions

The manuscript was written through contributions of all authors. Conceptualization: C.M.; Methodology: L.C.; Software: L.C. and D.A.K.; Validation: L.C. and C.M.; Formal analysis: L.C. and D.A.K.; Investigation: L.C., D.A.K., A.N. and C.M.; Resources: C.M.; Data Curation: L.C. and D.A.K.; Writing—Original Draft: L.C. and C.M.; Writing—Review and Editing: L.C., C.M., D.A.K. and A.N.; Visualization: L.C.; Supervision: C.M.; Project Administration: C.M.; Funding Acquisition: C.M. All authors have read and agreed to the published version of the manuscript.

Funding

C.M. acknowledges financial support by the DFG Collaborative Research Center 1208 “Identity and dynamics of biological membranes” (project ID 267205415), the DFG Collaborative Research Center 1535 “MiBiNet” (project ID 458090666), Volkswagen Foundation “Freigeist Fellowship”, and Fonds der Chemischen Industrie. We acknowledge the DFG and the state NRW for establishing the Abberior STED microscope (at the Molecular Physical Chemistry, HHU) with the funding ID (INST 208/741-1 FUGG) within the Major Research Instrumentation program as per Art. 91b GG.

Data Availability Statement

All data supporting the conclusions are included in this article. Any raw data will be made available by the authors upon request.

Acknowledgments

We thank the Institute of Physical Chemistry at HHU for providing the Langmuir-Blodgett trough. We thank Martin Schramm (Molecular Physical Chemistry, HHU) for upgrading the Langmuir-Blodgett trough by a motorized sample holder.

Conflicts of Interest

The authors declare no conflicts of interests.

References

  1. Bolmatov, D.; Soloviov, D.; Zhernenkov, M.; Zav’Yalov, D.; Mamontov, E.; Suvorov, A.; Cai, Y.Q.; Katsaras, J. Molecular Picture of the Transient Nature of Lipid Rafts. Langmuir 2020, 36, 4887–4896. [Google Scholar] [CrossRef] [PubMed]
  2. Kleusch, C.; Monzel, C.; Sridhar, K.C.; Hoffmann, B.; Csiszár, A.; Merkel, R. Fluorescence Correlation Spectroscopy Reveals Interaction of Some Microdomain-Associated Lipids with Cellular Focal Adhesion Sites. Int. J. Mol. Sci. 2020, 21, 8149. [Google Scholar] [CrossRef] [PubMed]
  3. Burk, A.S.; Monzel, C.; Yoshikawa, H.Y.; Wuchter, P.; Saffrich, R.; Eckstein, V.; Tanaka, M.; Ho, A.D. Quantifying Adhesion Mechanisms and Dynamics of Human Hematopoietic Stem and Progenitor Cells. Sci. Rep. 2015, 5, 9370. [Google Scholar] [CrossRef]
  4. Knight, J.D.; Lerner, M.G.; Marcano-Velázquez, J.G.; Pastor, R.W.; Falke, J.J. Single Molecule Diffusion of Membrane-Bound Proteins: Window into Lipid Contacts and Bilayer Dynamics. Biophys. J. 2010, 99, 2879. [Google Scholar] [CrossRef] [PubMed]
  5. Stieger, B.; Steiger, J.; Locher, K.P. Membrane Lipids and Transporter Function. Biochim. Biophys. Acta (BBA)—Mol. Basis Dis. 2021, 1867, 166079. [Google Scholar] [CrossRef]
  6. Cheng, X.; Ullo, M.F.; Case, L.B. Reconstitution of Phase-Separated Signaling Clusters and Actin Polymerization on Supported Lipid Bilayers. Front. Cell Dev. Biol. 2022, 10, 932483. [Google Scholar] [CrossRef]
  7. Banger, A.; Pasch, P.; Blawitzki, L.C.; Weber, S.; Otten, M.; Monzel, C.; Schmidt, S.; Voskuhl, J.; Hartmann, L. Detection of Lectin Clustering in Self-Assembled, Glycan-Functionalized Amphiphiles by Aggregation-Induced Emission Luminophores. Macromol. Chem. Phys. 2023, 224, 2200314. [Google Scholar] [CrossRef]
  8. Urban, P.; Pritzl, S.D.; Ober, M.F.; Dirscherl, C.F.; Pernpeintner, C.; Konrad, D.B.; Frank, J.A.; Trauner, D.; Nickel, B.; Lohmueller, T. A Lipid Photoswitch Controls Fluidity in Supported Bilayer Membranes. Langmuir 2020, 36, 2629–2634. [Google Scholar] [CrossRef]
  9. Ulmefors, H.; Nissa, J.; Pace, H.; Wahlsten, O.; Gunnarsson, A.; Simon, D.T.; Berggren, M.; Höök, F. Formation of Supported Lipid Bilayers Derived from Vesicles of Various Compositional Complexity on Conducting Polymer/Silica Substrates. Langmuir 2021, 37, 5494–5505. [Google Scholar] [CrossRef]
  10. Tolentino, T.P.; Wu, J.; Zarnitsyna, V.I.; Fang, Y.; Dustin, M.L.; Zhu, C. Measuring Diffusion and Binding Kinetics by Contact Area FRAP. Biophys. J. 2008, 95, 920–930. [Google Scholar] [CrossRef]
  11. Zhu, D.M.; Dustin, M.L.; Cairo, C.W.; Golan, D.E. Analysis of Two-Dimensional Dissociation Constant of Laterally Mobile Cell Adhesion Molecules. Biophys. J. 2007, 92, 1022–1034. [Google Scholar] [CrossRef] [PubMed]
  12. Kure, J.L.; Karlsson, T.; Andersen, C.B.; Lagerholm, B.C.; Loitto, V.; Magnusson, K.E.; Arnspang, E.C. Using KICS to Reveal Changed Membrane Diffusion of AQP-9 Treated with Drugs. Membranes 2021, 11, 568. [Google Scholar] [CrossRef] [PubMed]
  13. Kusumi, A.; Suzuki, K. Toward Understanding the Dynamics of Membrane-Raft-Based Molecular Interactions. Biochim. Biophys. Acta Mol. Cell Res. 2005, 1746, 234–251. [Google Scholar] [CrossRef] [PubMed]
  14. Kusumi, A.; Nakada, C.; Ritchie, K.; Murase, K.; Suzuki, K.; Murakoshi, H.; Kasai, R.S.; Kondo, J.; Fujiwara, T. Paradigm Shift of the Plasma Membrane Concept from the Two-Dimensional Continuum Fluid to the Partitioned Fluid: High-Speed Single-Molecule Tracking of Membrane Molecules. Annu. Rev. Biophys. Biomol. Struct. 2005, 34, 351–378. [Google Scholar] [CrossRef] [PubMed]
  15. Lommerse, P.H.M.; Spaink, H.P.; Schmidt, T. In Vivo Plasma Membrane Organization: Results of Biophysical Approaches. Biochim. Biophys. Acta Biomembr. 2004, 1664, 119–131. [Google Scholar] [CrossRef] [PubMed]
  16. Adkins, E.M.; Samuvel, D.J.; Fog, J.U.; Eriksen, J.; Jayanthi, L.D.; Vaegter, C.B.; Ramamoorthy, S.; Gether, U. Membrane Mobility and Microdomain Association of the Dopamine Transporter Studied with Fluorescence Correlation Spectroscopy and Fluorescence Recovery after Photobleaching. Biochemistry 2007, 46, 10484–10497. [Google Scholar] [CrossRef] [PubMed]
  17. Dietrich, C.; Yang, B.; Fujiwara, T.; Kusumi, A.; Jacobson, K. Relationship of Lipid Rafts to Transient Confinement Zones Detected by Single Particle Tracking. Biophys. J. 2002, 82, 274–284. [Google Scholar] [CrossRef]
  18. Jacobson, K.; Mouritsen, O.G.; Anderson, R.G.W. Lipid Rafts: At a Crossroad between Cell Biology and Physics. Nat. Cell Biol. 2007, 9, 7–14. [Google Scholar] [CrossRef]
  19. Fenz, S.F.; Merkel, R.; Sengupta, K. Diffusion and Intermembrane Distance: Case Study of Avidin and E-Cadherin Mediated Adhesion. Langmuir 2009, 25, 1074–1085. [Google Scholar] [CrossRef]
  20. Mossman, K.; Groves, J. Micropatterned Supported Membranes as Tools for Quantitative Studies of the Immunological Synapse. Chem. Soc. Rev. 2007, 36, 46–54. [Google Scholar] [CrossRef]
  21. Sackmann, E. Supported Membranes: Scientific and Practical Applications. Science (1979) 1996, 271, 43–48. [Google Scholar] [CrossRef] [PubMed]
  22. Yamazaki, V.; Sirenko, O.; Schafer, R.J.; Groves, J.T. Lipid Mobility and Molecular Binding in Fluid Lipid Membranes. J. Am. Chem. Soc. 2005, 127, 2826–2827. [Google Scholar] [CrossRef] [PubMed]
  23. Iriarte-Alonso, M.A.; Bittner, A.M.; Chiantia, S. Influenza A Virus Hemagglutinin Prevents Extensive Membrane Damage upon Dehydration. BBA Adv. 2022, 2, 100048. [Google Scholar] [CrossRef] [PubMed]
  24. Baumgart, T.; Hess, S.T.; Webb, W.W. Imaging Coexisting Fluid Domains in Biomembrane Models Coupling Curvature and Line Tension. Nature 2003, 425, 821–824. [Google Scholar] [CrossRef] [PubMed]
  25. Limozin, L.; Sackmann, E. Polymorphism of Cross-Linked Actin Networks in Giant Vesicles. Phys. Rev. Lett. 2002, 89, 168103. [Google Scholar] [CrossRef]
  26. Smith, A.S.; Sengupta, K.; Goennenwein, S.; Seifert, U.; Sackmann, E. Force-Induced Growth of Adhesion Domains Is Controlled by Receptor Mobility. Proc. Natl. Acad. Sci. USA 2008, 105, 6906–6911. [Google Scholar] [CrossRef]
  27. Fenz, S.F.; Sengupta, K. Giant Vesicles as Cell Models. Integr. Biol. 2012, 4, 982–995. [Google Scholar] [CrossRef]
  28. Dimova, R.; Aranda, S.; Bezlyepkina, N.; Nikolov, V.; Riske, K.A.; Lipowsky, R. A Practical Guide to Giant Vesicles. Probing the Membrane Nanoregime via Optical. J. Phys. Condens. Matter 2006, 18, S1151. [Google Scholar] [CrossRef]
  29. Monzel, C.; Schmidt, D.; Kleusch, C.; Kirchenbüchler, D.; Seifert, U.; Smith, A.S.; Sengupta, K.; Merkel, R. Measuring Fast Stochastic Displacements of Bio-Membranes with Dynamic Optical Displacement Spectroscopy. Nat. Commun. 2015, 6, 8162. [Google Scholar] [CrossRef]
  30. Monzel, C.; Sengupta, K. Measuring Shape Fluctuations in Biological Membranes. J. Phys. D Appl. Phys. 2016, 49, 243002. [Google Scholar] [CrossRef]
  31. Drabik, D.; Drab, M.; Penič, S.; Iglič, A.; Czogalla, A. Investigation of Nano- and Microdomains Formed by Ceramide 1 Phosphate in Lipid Bilayers. Sci. Rep. 2023, 13, 18570. [Google Scholar] [CrossRef] [PubMed]
  32. Kumar, J.; Chng, C.P.; Huang, C. Curvature-Enhanced Membrane Asymmetry Slows down Protein Diffusion. Extrem. Mech. Lett. 2024, 66, 102114. [Google Scholar] [CrossRef]
  33. Urbančič, I.; Brun, J.; Shrestha, D.; Waithe, D.; Eggeling, C.; Chojnacki, J. Lipid Composition but Not Curvature Is a Determinant of a Low Molecular Mobility within HIV-1 Lipid Envelope. bioRxiv 2018, 315168. [Google Scholar] [CrossRef]
  34. Domanov, Y.A.; Aimon, S.; Toombes, G.E.S.; Renner, M.; Quemeneur, F.; Triller, A.; Turner, M.S.; Bassereau, P. Mobility in Geometrically Confined Membranes. Proc. Natl. Acad. Sci. USA 2011, 108, 12605–12610. [Google Scholar] [CrossRef] [PubMed]
  35. Horton, M.R.; Reich, C.; Gast, A.P.; Rädler, J.O.; Nickel, B. Structure and Dynamics of Crystalline Protein Layers Bound to Supported Lipid Bilayers. Langmuir 2007, 23, 6263–6269. [Google Scholar] [CrossRef]
  36. Monzel, C.; Schmidt, D.; Seifert, U.; Smith, A.S.; Merkel, R.; Sengupta, K. Nanometric Thermal Fluctuations of Weakly Confined Biomembranes Measured with Microsecond Time-Resolution. Soft Matter 2016, 12, 4755–4768. [Google Scholar] [CrossRef]
  37. Monzel, C.; Fenz, S.F.; Giesen, M.; Merkel, R.; Sengupta, K. Mapping Fluctuations in Biomembranes Adhered to Micropatterns. Soft Matter 2012, 8, 6128–6138. [Google Scholar] [CrossRef]
  38. Fenz, S.F.; Merkel, R.; Sengupta, K. Inter-Membrane Adhesion Mediated by Mobile Linkers: Effect of Receptor Shortage. Biophys. J. 2010, 98, 665a. [Google Scholar] [CrossRef]
  39. Fenz, S.F.; Bihr, T.; Schmidt, D.; Merkel, R.; Seifert, U.; Sengupta, K.; Smith, A.S. Membrane Fluctuations Mediate Lateral Interaction between Cadherin Bonds. Nat. Phys. 2017, 13, 906–913. [Google Scholar] [CrossRef]
  40. Groves, J.T.; Ulman, N.; Cremer, P.S.; Boxer, S.G. Substrate-Membrane Interactions: Mechanisms for Imposing Patterns on a Fluid Bilayer Membrane. Langmuir 1998, 14, 3347–3350. [Google Scholar] [CrossRef]
  41. Saarikangas, J.; Zhao, H.; Lappalainen, P. Regulation of the Actin Cytoskeleton-Plasma Membrane Interplay by Phosphoinositides. Physiol. Rev. 2010, 90, 259–289. [Google Scholar] [CrossRef] [PubMed]
  42. Mangeat, P.; Roy, C.; Martin, M. ERM Proteins in Cell Adhesion and Membrane Dynamics. Trends Cell Biol. 1999, 9, 187–192. [Google Scholar] [CrossRef] [PubMed]
  43. Janmey, P.A.; Lindberg, U. Cytoskeletal Regulation: Rich in Lipids. Nat. Rev. Mol. Cell Biol. 2004, 5, 658–666. [Google Scholar] [CrossRef] [PubMed]
  44. Janmey, P.A. The Cytoskeleton and Cell Signaling: Component Localization and Mechanical Coupling. Physiol. Rev. 1998, 78, 763–781. [Google Scholar] [CrossRef]
  45. Deverall, M.A.; Gindl, E.; Sinner, E.K.; Besir, H.; Ruehe, J.; Saxton, M.J.; Naumann, C.A. Membrane Lateral Mobility Obstructed by Polymer-Tethered Lipids Studied at the Single Molecule Level. Biophys. J. 2005, 88, 1875–1886. [Google Scholar] [CrossRef]
  46. Lin, W.C.; Blanchette, C.D.; Ratto, T.V.; Longo, M.L. Lipid Asymmetry in DLPC/DSPC-Supported Lipid Bilayers: A Combined AFM and Fluorescence Microscopy Study. Biophys. J. 2006, 90, 228–237. [Google Scholar] [CrossRef]
  47. Gülcüler Balta, G.S.; Monzel, C.; Kleber, S.; Beaudouin, J.; Balta, E.; Kaindl, T.; Chen, S.; Gao, L.; Thiemann, M.; Wirtz, C.R.; et al. 3D Cellular Architecture Modulates Tyrosine Kinase Activity, Thereby Switching CD95-Mediated Apoptosis to Survival. Cell Rep. 2019, 29, 2295–2306.e6. [Google Scholar] [CrossRef]
  48. Grakoui, A.; Bromley, S.K.; Sumen, C.; Davis, M.M.; Shaw, A.S.; Allen, P.M.; Dustin, M.L. The Immunological Synapse: A Molecular Machine Controlling T Cell Activation. Science (1979) 1999, 285, 221–227. [Google Scholar] [CrossRef]
  49. Levental, I.; Lyman, E. Regulation of Membrane Protein Structure and Function by Their Lipid Nano-Environment. Nat. Rev. Mol. Cell Biol. 2023, 24, 107–122. [Google Scholar] [CrossRef]
  50. Budin, I.; de Rond, T.; Chen, Y.; Chan, L.J.G.; Petzold, C.J.; Keasling, J.D. Viscous Control of Cellular Respiration by Membrane Lipid Composition. Science (1979) 2018, 362, 1186–1189. [Google Scholar] [CrossRef]
  51. Gudipati, V.; Rydzek, J.; Doel-Perez, I.; Gonçalves, V.D.R.; Scharf, L.; Königsberger, S.; Lobner, E.; Kunert, R.; Einsele, H.; Stockinger, H.; et al. Inefficient CAR-Proximal Signaling Blunts Antigen Sensitivity. Nat. Immunol. 2020, 21, 848–856. [Google Scholar] [CrossRef] [PubMed]
  52. Okamoto, Y.; Motegi, T.; Morita, K.; Takagi, T.; Amii, H.; Kanamori, T.; Sonoyama, M.; Tero, R. Lateral Diffusion and Molecular Interaction in a Bilayer Membrane Consisting of Partially Fluorinated Phospholipids. Langmuir 2016, 32, 10712–10718. [Google Scholar] [CrossRef] [PubMed]
  53. Nissen, J.; Gritsch, S.; Wiegand, G.; Rädler, J.O. Wetting of Phospholipid Membranes on Hydrophilic Surfaces—Concepts towards Self-Healing Membranes. Eur. Phys. J. B 1999, 10, 335–344. [Google Scholar] [CrossRef]
  54. Saffman, P.G.; Delbrueck, M. Brownian Motion in Biological Membranes. Proc. Natl. Acad. Sci. USA 1975, 72, 3111–3113. [Google Scholar] [CrossRef]
  55. Axelrod, D.; Koppel, D.E.; Schlessinger, J.; Elson, E.; Webb, W.W. Mobility Measurement by Analysis of Fluorescence Photobleaching Recovery Kinetics. Biophys. J. 1976, 16, 1055–1069. [Google Scholar] [CrossRef]
  56. Petrov, E.P.; Schwille, P. Translational Diffusion in Lipid Membranes beyond the Saffman-Delbrück Approximation. Biophys. J. 2008, 94, L41. [Google Scholar] [CrossRef]
  57. Evans, E.; Sackmann, E. Translational and Rotational Drag Coefficients for a Disk Moving in a Liquid Membrane Associated with a Rigid Substrate. J. Fluid. Mech. 1988, 194, 553–561. [Google Scholar] [CrossRef]
  58. Merkel, R.; Sackmann, E.; Evans, E. Molecular Friction and Epitactic Coupling between Monolayers in Supported Bilayers. J. Phys. 1989, 50, 1535–1555. [Google Scholar] [CrossRef]
  59. Purrucker, O.; Förtig, A.; Jordan, R.; Sackmann, E.; Tanaka, M. Control of Frictional Coupling of Transmembrane Cell Receptors in Model Cell Membranes with Linear Polymer Spacers. Phys. Rev. Lett. 2007, 98, 078102. [Google Scholar] [CrossRef]
  60. Saxton, M.J. Lateral Diffusion in an Archipelago. The Effect of Mobile Obstacles. Biophys. J. 1987, 52, 989–997. [Google Scholar] [CrossRef]
  61. Saxton, M.J. Anomalous Diffusion Due to Obstacles: A Monte Carlo Study. Biophys. J. 1994, 66, 394–401. [Google Scholar] [CrossRef] [PubMed]
  62. Liu, A.P.; Fletcher, D.A. Actin Polymerization Serves as a Membrane Domain Switch in Model Lipid Bilayers. Biophys. J. 2006, 91, 4064–4070. [Google Scholar] [CrossRef] [PubMed]
  63. Heinemann, F.; Vogel, S.K.; Schwille, P. Lateral Membrane Diffusion Modulated by a Minimal Actin Cortex. Biophys. J. 2013, 104, 1465–1475. [Google Scholar] [CrossRef] [PubMed]
  64. Subramaniam, A.B.; Guidotti, G.; Manoharan, V.N.; Stone, H.A. Glycans Pattern the Phase Behaviour of Lipid Membranes. Nat. Mater. 2012, 12, 128–133. [Google Scholar] [CrossRef]
  65. Vogel, S.K.; Petrasek, Z.; Heinemann, F.; Schwille, P. Myosin Motors Fragment and Compact Membrane-Bound Actin Filaments. eLife 2013, 2, e00116. [Google Scholar] [CrossRef] [PubMed]
  66. Langmuir, I. The Constitution and Fundamental Properties of Solids and Liquids. II. Liquids. J. Am. Chem. Soc. 1917, 39, 1848–1906. [Google Scholar] [CrossRef]
  67. Blodgett, K.B. Films Built by Depositing Successive Monomolecular Layers on a Solid Surface. J. Am. Chem. Soc. 1935, 57, 1007–1022. [Google Scholar] [CrossRef]
  68. Dietrich, C.; Merkel, R.; Tampé, R. Diffusion Measurement of Fluorescence-Labeled Amphiphilic Molecules with a Standard Fluorescence Microscope. Biophys. J. 1997, 72, 1701–1710. [Google Scholar] [CrossRef]
  69. Beckers, D.; Urbancic, D.; Sezgin, E. Impact of Nanoscale Hindrances on the Relationship between Lipid Packing and Diffusion in Model Membranes. J. Phys. Chem. 2020, 2020, 124–1487. [Google Scholar] [CrossRef]
  70. Przybylo, M.; Sýkora, J.; Humpolíčová, J.; Benda, A.; Zan, A.; Hof, M. Lipid Diffusion in Giant Unilamellar Vesicles Is More than 2 Times Faster than in Supported Phospholipid Bilayers under Identical Conditions. Langmuir 2006, 22, 9096–9099. [Google Scholar] [CrossRef]
  71. Thomas, F.A.; Visco, I.; Petrášek, Z.; Heinemann, F.; Schwille, P. Introducing a Fluorescence-Based Standard to Quantify Protein Partitioning into Membranes. Biochim. Biophys. Acta 2015, 1848, 2932–2941. [Google Scholar] [CrossRef] [PubMed]
  72. Tamm, L.K.; McConnell, H.M. Supported Phospholipid Bilayers. Biophys. J. 1985, 47, 105–113. [Google Scholar] [CrossRef]
  73. Kučerka, N.; Nieh, M.P.; Katsaras, J. Fluid Phase Lipid Areas and Bilayer Thicknesses of Commonly Used Phosphatidylcholines as a Function of Temperature. Biochim. Biophys. Acta (BBA)—Biomembr. 2011, 1808, 2761–2771. [Google Scholar] [CrossRef] [PubMed]
  74. Schoch, R.L.; Brown, F.L.H.; Haran, G. Correlated Diffusion in Lipid Bilayers. Proc. Natl. Acad. Sci. USA 2021, 118, e2113202118. [Google Scholar] [CrossRef] [PubMed]
  75. Wolfe, C.A.; James, P.S.; Mackie, A.R.; Ladha, S.; Jones, R. Regionalized Lipid Diffusion in the Plasma Membrane of Mammalian Spermatozoa. Biol. Reprod. 1998, 59, 1506–1514. [Google Scholar] [CrossRef] [PubMed]
  76. Evans, E.; Yeung, A. Hidden Dynamics in Rapid Changes of Bilayer Shape. Chem. Phys. Lipids 1994, 73, 39–56. [Google Scholar] [CrossRef]
  77. Gurunathan, S.; Woong Han, J.; Kim, E.; Kwon, D.N.; Park, J.K.; Kim, J.H. Enhanced Green Fluorescent Protein-Mediated Synthesis of Biocompatible Graphene. J. Nanobiotechnol. 2014, 12, 41. [Google Scholar] [CrossRef]
  78. Wang, B.; Zhang, L.; Sung, C.B.; Granick, S. Nanoparticle-Induced Surface Reconstruction of Phospholipid Membranes. Proc. Natl. Acad. Sci. USA 2008, 105, 18171–18175. [Google Scholar] [CrossRef]
  79. Servagent-Noinville, S.; Revault, M.; Quiquampoix, H.; Baron, M.H. Conformational Changes of Bovine Serum Albumin Induced by Adsorption on Different Clay Surfaces: FTIR Analysis. J. Colloid. Interface Sci. 2000, 221, 273–283. [Google Scholar] [CrossRef]
  80. Vaz, W.L.C.; Goodsaid-Zalduondo, F.; Jacobson+, K. Lateral Diffusion of Lipids and Proteins in Bilayer Membranes. FEBS Lett. 1984, 174, 199–207. [Google Scholar] [CrossRef]
  81. NeutrAvidin Protein. Available online: https://www.thermofisher.com/order/catalog/product/de/de/31000 (accessed on 6 August 2024).
  82. García De La Torre, J.; Huertas, M.L.; Carrasco, B. Calculation of Hydrodynamic Properties of Globular Proteins from Their Atomic-Level Structure. Biophys. J. 2000, 78, 719. [Google Scholar] [CrossRef] [PubMed]
  83. Zhang, Y.; De Mets, R.; Monzel, C.; Acharya, V.; Toh, P.; Chin, J.F.L.; Van Hul, N.; Ng, I.C.; Yu, H.; Ng, S.S.; et al. Biomimetic Niches Reveal the Minimal Cues to Trigger Apical Lumen Formation in Single Hepatocytes. Nat. Mater. 2020, 19, 1026–1035. [Google Scholar] [CrossRef] [PubMed]
  84. Pugliese, L.; Coda, A.; Malcovati, M.; Bolognesi, M. Three-Dimensional Structure of the Tetragonal Crystal Form of Egg-White Avidin in Its Functional Complex with Biotin at 2·7 Å Resolution. J. Mol. Biol. 1993, 231, 698–710. [Google Scholar] [CrossRef] [PubMed]
  85. Honigmann, A.; Sadeghi, S.; Keller, J.; Hell, S.W.; Eggeling, C.; Vink, R. A Lipid Bound Actin Meshwork Organizes Liquid Phase Separation in Model Membranes. eLife 2014, 3, 1671. [Google Scholar] [CrossRef] [PubMed]
  86. Sackmann, E.; Tanaka, M. Supported Membranes on Soft Polymer Cushions: Fabrication, Characterization and Applications. Trends Biotechnol. 2000, 18, 58–64. [Google Scholar] [CrossRef]
  87. Pace, H.; Simonsson Nyström, L.; Gunnarsson, A.; Eck, E.; Monson, C.; Geschwindner, S.; Snijder, A.; Höök, F. Preserved Transmembrane Protein Mobility in Polymer-Supported Lipid Bilayers Derived from Cell Membranes. Anal. Chem. 2015, 87, 9194–9203. [Google Scholar] [CrossRef]
  88. Bartels, N.; van der Voort, N.T.M.; Opanasyuk, O.; Felekyan, S.; Greife, A.; Shang, X.; Bister, A.; Wiek, C.; Seidel, C.A.M.; Monzel, C. Advanced Multiparametric Image Spectroscopy and Super-Resolution Microscopy Reveal a Minimal Model of CD95 Signal Initiation. Sci. Adv. 2024, 10, 3238. [Google Scholar] [CrossRef]
Figure 1. Sketch of model systems consisting of SLB and coupled proteins. Left: immobile obstacle system with GFP and DOGS-NTA. Middle: mobile obstacle system with NAVOG and DOPE-Cap-Biotin. Right: mobile obstacles that are crosslinked by actin filaments coupling to NAVTMR on a DOPE-Cap-Biotin doped membrane. Middle and right system separated by dashed line. See text for details and abbreviations.
Colloids 08 00054 g001
Figure 2. Continuous photobleaching. (a) SLB before bleaching. (b) SLB after 250 s of bleaching. Intensities within the square at the center and along four lines of the ROI were used to determine the temporal and spatial intensity profile, respectively. Scale bar in (a,b) 25 µm. (c) Central intensity profile and fit (dashed line) according to Equation (1). (d) Spatial intensity profile along one direction and fit (dashed line) according to Equation (2).
Colloids 08 00054 g002
Figure 3. Measured diffusion constants for the NTA–GFP system. DOGS-NTA concentrations of 0 mol%, 0.005 mol%, 0.05 mol%, and 0.5 mol% were used. (a): SLB alone (circle), SLB after BSA passivation (triangle), SLB after BSA passivation, and GFP coupling (box). Data points are median ± median absolute deviation (MAD). (b): Table of diffusion constants for the NTA–GFP system at pH 7.5. Diffusion constants are measured for different linker concentrations before and after incubation with GFP. N: Number of measurements, S: Number of independent samples, X: Passivation/coupling with the protein. The diffusion constants are measured at pH 7.5 (for changes at pH 6.4, see Figure 4b). Diffusion constants are given as median ± MAD.
Colloids 08 00054 g003
Figure 5. Measured diffusion constants for the Biotin–Neutravidin system. DOPE-Cap-Biotin concentrations of 0 mol%, 0.005 mol%, 0.025 mol%, 0.05 mol%, and 0.5 mol% were used. The diffusion constants are measured at pH 7.5. (a): SLB alone (circle), SLB after BSA passivation (triangle), SLB after BSA passivation and NAVOG coupling (box), and NAVOG diffusion constant (diamond). Data points are median ± MAD. (b): Diffusion constants are measured for different linker concentrations before and after incubation with NAVOG. N: Number of measurements, S: Number of independent samples, X: Passivation/coupling with the protein. Diffusion constants are given as median ± MAD. * D of protein NAVOG (not the tracer lipid).
Colloids 08 00054 g005
Figure 6. Effect of higher linker concentration on diffusion constants in the Biotin–Neutravidin system. (a) Change in diffusion constant relative to SLB alone (circle) for the SLB after NAVTMR coupling (box) and the SLB after NAVTMR and actin coupling (diamond). Data points are median ± MAD. (b) Comparison of experiment (Biotin–Neutravidin system) with the theory of Saxton for mobile obstacles with γ = 1 and α = 0.2820 (solid line) or γ = 10 and α = 0.2820 (dashed line). Fit of Saxton’s theory to the experimental data yields the effective obstacle size ao = 12 nm2, corresponding to 19 lipids, γ = 1, and α = 0.2820. Data points are median ± MAD.
Colloids 08 00054 g006
Figure 7. Effect of actin-coupling on diffusion constants in the Biotin–Neutravidin system. Representative images of the SLB tracer lipid (purple) (a), of coupled NAVTMR (red) (b), and actin (green) (c) after the last actin coupling step at 10 mol% linker concentration. (d) Overlay of (ac). Scale bar in (ad) 25 µm.
Colloids 08 00054 g007
Disclaimer/Publisher’s Note: The statements, opinions and data contained in all publications are solely those of the individual author(s) and contributor(s) and not of MDPI and/or the editor(s). MDPI and/or the editor(s) disclaim responsibility for any injury to people or property resulting from any ideas, methods, instructions or products referred to in the content.

