Article

Plasma Coating for Hydrophobisation of Micro- and Nanotextured Electrocatalyst Materials

1
Centre for Nanoscale Science and Technology, Flinders University, Adelaide, SA 5042, Australia
2
Future Industries Institute, University of South Australia, Adelaide, SA 5095, Australia
*
Author to whom correspondence should be addressed.
These authors contributed equally to this work.
Plasma 2024, 7(3), 749-766; https://doi.org/10.3390/plasma7030039
Submission received: 1 July 2024 / Revised: 26 August 2024 / Accepted: 10 September 2024 / Published: 17 September 2024

Abstract

:
The need for sustainable energy solutions is steering research towards green fuels. One promising approach involves electrocatalytic gas conversion, which requires efficient catalyst surfaces. This study focuses on developing and testing a hydrophobic octadiene (OD) coating for potential use in electrocatalytic gas conversion. The approach aims to combine a plasma-deposited hydrophobic coating with air-trapping micro- and nanotopographies to increase the yield of electrocatalytic reactions. Plasma polymerisation was used to deposit OD films, chosen for their fluorine-free non-polar properties, onto titanium substrates. We assessed the stability and charge permeability of these hydrophobic coatings under electrochemical conditions relevant to electrocatalysis. Our findings indicate that plasma-deposited OD films, combined with micro-texturing, could improve the availability of reactant gases at the catalyst surface while limiting water access. In the presence of nanotextures, however, the OD-coated catalyst did not retain its hydrophobicity. This approach holds promise to inform the future development of catalyst materials for the electrocatalytic conversion of dinitrogen (N2) and carbon dioxide (CO2) into green fuels.

1. Introduction

The need for sustainable energy solutions is steering research efforts towards the development of green fuels [1]. The electrocatalytic conversion of dinitrogen (N2) and carbon dioxide (CO2) gases into valuable fuels is a promising route [2]. Electrocatalytic systems are designed to use electricity to destabilise reactant gas molecules without high energy consumption [3]. Yet the gas conversion reactions are typically hindered by two common bottlenecks: the poor solubility of the reactant gases in aqueous electrolytes [4] and the competing hydrogen evolution reaction (HER) [4,5]. To address these challenges, it is pivotal to control the wettability of the catalyst to increase contact with the reactant gas and limit water adsorption at the solid surface. MacFarlane et al. addressed these challenges for electrocatalytic nitrogen reduction reaction into ammonia (eNRR) by using a non-aqueous solvent [6]. Specifically, almost 100% Faradaic efficiency was achieved by using tetrahydrofuran (THF) as the solvent and ethanol as the hydrogen donor with a phosphate-based proton shuttle in a pressurised reactor. However, moving away from aqueous media comes at an environmental cost. Another possible solution to these challenges is to advance the design of the catalytic material itself, both in terms of chemistry and microstructure, aiming at increasing the amount of reactant gas reaching the reaction site while limiting water access/adsorption. Previous studies have analysed the efficiency of various catalytic materials for these types of reactions [7,8,9,10], and forming nanostructures on the surface has also been shown to increase electrocatalytic efficiency [11,12,13]. For instance, Mougel et al. proved the merit of this strategy for CO2 conversion in pioneer work where hydrophobised nanostructured copper was shown to facilitate air trapping. This unique catalyst design increased the supply of CO2 reactant gases available at the reaction sites and in turn, augmented the electrocatalytic conversion yield [14]. This novel approach demonstrated the potential of three-phase systems to transform the field of green fuel production via electrocatalytic conversion of insoluble gases like N2 and CO2 [15]. However, the hydrophobisation of catalyst material at scale remains a technical challenge.
Plasma-based methods could be used to impart hydrophobic properties to catalyst materials. In particular, plasma polymerisation is a versatile and eco-friendly thin film deposition technique used to achieve surface modifications. This technique consists of vaporising, fragmenting and ionising an organic monomer in a vacuum chamber [16] which then forms a highly cross-linked organic film on the electrode. There are three variables that can be readily adjusted to produce plasma polymer films with different physicochemical properties. These include deposition time, radiofrequency (RF) power and ignition pressure [17]. The longer the deposition time, the thicker the film becomes [18]. Controlling the deposition power and ignition pressure adjusts the density of cross-links within the film and in turn its functionality and stability [19]. These variables have been studied for a range of precursors, typically small volatile organic monomers which have low vapour pressure at ambient conditions. Though optimal deposition conditions are reactor- and application-specific, the interplay between the three parameters allows for fine-tuning of the thin film properties. For application in electrocatalytic reactions aiming to convert a gas reactant into a soluble product, a hydrophobic catalytic surface is desirable, and therefore 1,7-octadiene has been selected as a suitable monomer. Octadiene (OD) is fluorine-free, non-polar and has previously been shown to successfully produce hydrophobic thin films using plasma polymerisation [18].
In this work, we explore the feasibility of using plasma polymerisation to hydrophobise the surface of a catalyst material with a thin OD film, designed to enhance gas trapping via micro- and nanotexturing. We hypothesise that combining a plasma-deposited hydrophobic coating with air-trapping micro- and nanotopography could enhance the yield of electrocatalytic conversion of gaseous reactants like CO2 and N2. Indeed, if the catalyst surface is inherently hydrophobic, then when appropriately textured, it is expected that reactant gas bubbles will accumulate at the surface, thus increasing the concentration of the reactant adjacent to the catalyst reaction site [20,21]. Our approach uses plasma polymerisation to coat the catalyst surface with a nanothin hydrophobic coating, moving away from solvent-based processes in favour of a more environmentally friendly, scalable and versatile method. Since plasma polymer deposition is a substrate-independent technique, it is possible to create large areas of hydrophobic catalysts from a variety of metals tailored for specific electrocatalytic reactions.
For the proposed application, the thin film must be (1) permeable to protons and (2) stable in electrolyte solution and under current exposure. Protons must be able to reach the catalyst for the electrochemical reaction to occur (Scheme 1). Additionally, the film must be unaffected by the electrocatalytic environment and maintain its hydrophobic properties. This involves the thin film withstanding acidic electrolyte environment, as well as mechanical and electrical stress. Previous works have shown that hydrophobic plasma polymer films deposited from the vapour phase of perfluorooctane with a thickness of 30 nm or less allowed charge transfer [22]. However, the stability of fluorine-free plasma polymerised octadiene films at the solid-electrolyte interface of an electrocatalytic cell has yet to be demonstrated. This study aims to determine appropriate plasma deposition conditions to synthesise stable and hydrophobic consistent thin films. The surface properties of octadiene coatings, namely thickness and wetting properties, were characterised using ellipsometry and optical contact angle measurements. Film stability was assessed by comparing the film thickness and surface wettability before and after various treatments. Specifically, to test the octadiene plasma polymer films in conditions relevant to catalysis, their electrochemical properties were determined when deposited on titanium substrates, and subjected to cyclic voltammetry cycles. Titanium was chosen as it has a high affinity towards nitrogen and is also corrosion resistant, making it a suitable conductive working electrode [21].
The hydrophobic OD films were also tested as potential surface modifiers for micro- and nanotextured electrodes. In classic electrochemical set-ups, a solid catalyst is used, which can be textured and hydrophobised on the top side in contact with the electrolyte (Scheme 1, left). However, in this configuration, the amount of solubilised gas being trapped in the surface texture and reaching the catalyst is limited. Another configuration has been proposed to create through 3-phase cells, where the substrate is porous in its entire thickness. The amount of reactant available in this case is increased as the gas can be supplied from the bottom side of the substrate and transported through the porous working electrode (Scheme 1, right). The gas conversion reaction can then occur at the three-phase interface between the aqueous electrolyte solution, gas bubbles and catalytic surface. In this 3-phase configuration, it is important that the surface modification be hydrophobic enough to prevent electrolyte solution leaking through the porous catalyst. This set-up also limits water access to the catalyst, hindering the HER. In this work, we tested the suitability of two types of porous titanium substrates—meshes and microporous sponges—for 3-phase cells configuration when combined with optimised OD films. Lastly, we tested the effect of surface nanostructuring on the properties of the catalyst. Indeed, intrinsically hydrophobic surfaces (contact angle > 90°) are expected to become even more hydrophobic as their roughness increases according to Cassie’s and Wenzel’s frameworks which take into account surface roughness [23]. This was tested by creating nanopores into the microporous titanium substrate via electrochemical etching. This nanotexturing could not only increase the catalyst surface area but also enhance the hydrophobicity of the surface, thus creating a potential new type of material for enhanced electrocatalysis of gaseous reactants into green fuels.

2. Materials and Methods

2.1. Plasma Polymer Deposition

2.1.1. Substrate Preparation

Plasma polymer deposition was used to coat different types of substrates with octadiene thin films. A selection of substrates was used to test the different properties of the OD coating. Silicon wafers (10 × 10 mm) were used as standard smooth reference surfaces to evaluate film thickness and stability. Solid Ti (Titanium foil, 0.2 mm thick, GoodFellow, Cambridge, UK) was used to assess the films’ proton permeability and porous micro Ti (Titanium foam frit, 1.5 mm thick, with 1 μm, 5 μm and 10 μm average pore sizes) and Ti mesh (0.1 mm woven wire mesh diameter, 1 mm hole size, TiShop, London, UK) was used to assess the capability of OD film to be used as a hydrophobic layer in 3-phase electrochemical set-up. All titanium substrates were cut into 10 × 20 mm size to fit the electrochemical cell. The selected substrates were first sonicated in ethanol for 15 min and then acetone for another 15 min before drying with N2 gas. The substrates were placed in a convection oven (Binder, Tuttlingen, Germany) to dry at 100 °C for 1 h.

2.1.2. Plasma Polymerisation of Octadiene

Plasma polymer deposition was performed using a custom-made acrylic and glass chamber fitted with brass electrodes (Figure S1). The plasma reactor chamber was cleaned with air plasma at the RF power of 30 W at 2.0 × 10⁻¹ mbar for 30 min. The monomer, 1,7-octadiene (C8H14, 98% purity, Sigma-Aldrich, Melbourne, Australia) was then attached to the reactor via a needle valve. A degassing procedure was performed by three freeze-thaw cycles using liquid nitrogen. The substrates (titanium samples and Si wafers) were then placed on the bottom brass electrode and an additional air plasma cleaning cycle was conducted for 3 min to remove surface impurities. The plasma polymer deposition conditions tested are detailed in Table 1.

2.2. Octadiene Film Characterisation

2.2.1. Thin Film Thickness

A spectroscopic ellipsometer (VASE, J.A Woollam, Lincoln, USA) was used to determine the thickness of the plasma polymer thin film coatings. Data were collected at three angles of incidence (65°, 70° and 75°) over a 250–1100 nm wavelength range in 10 nm intervals. The plasma coating on the Si wafer was modelled as a Cauchy layer. As a starting point for the fit, the refractive index was set to 1.4 as a wavelength-independent parameter and the adsorption coefficient at 0. The optical properties and film thickness were then determined from the comparison of the data with the model.

2.2.2. Thin Film Wetting Properties

Advancing and receding water contact angles were measured using an optical contact angle measurement system (OCA 25, DataPhysics Instruments, Filderstadt, Germany). For each measurement, a 1.0 μL Milli-Q water droplet was deposited onto the sample. After baseline alignment, 1.5 μL was continuously dispensed via a needle into the original droplet, and advancing contact angle measurements were carried out when the droplet base diameter was growing. This was repeated in reverse where 2.0 μL were continuously withdrawn from the same droplet and receding contact angle measurements were performed when the droplet base diameter began decreasing. Contact angles of three water droplets were measured for each sample. A dosing rate of 0.06 µL/s and a 500 µL Hamilton glass syringe equipped with a thin needle was used for all measurements. The tangent leaning method was applied to extract the contact angles from the acquired images.

2.3. Film Stability Test

2.3.1. Stability in Aqueous Electrolyte

Octadiene thin films were deposited onto silicon wafers and allowed to stabilise for 24 h. The samples were then subjected to a stability test by incubation in K2SO4 electrolyte solution (0.1 M, pH 3, ChemSupply, Gillman, Australia) for 1 and 24 h. After incubation, the samples were rinsed with Milli-Q water to remove the electrolyte, and then air dried for 24 h. The changes in film thickness and wetting properties of each sample were determined with ellipsometry and optical contact angle measurements before and after the electrolyte incubation test, following the methodology described in the previous sections.

2.3.2. Stability under Current

Octadiene thin films were deposited onto solid (non-porous) titanium substrates and allowed to stabilise for 24 h before measuring advancing and receding water contact angles on the deposited films. The films were then subjected to an applied current via cyclic voltammetry. The electrochemical potential was ramped from −0.1 to −1.0 V vs. RHE with a step of 10 mV and a scan rate of 1080 mV/s for 10 cycles in K2SO4 electrolyte solution (0.1 M, pH 3, ChemSupply, Gillman, Australia). A platinum wire was used as the counter electrode and Ag/AgCl as the reference electrode. After the 10th cycle, the samples were removed from the electrochemical cell, rinsed with Milli-Q water, and allowed to dry for 24 h. Water contact angles were remeasured on the dried substrate and compared with the initial values.

2.3.3. Stability in Three-Phase Electrochemical Cell

A selection of coated and uncoated samples (1 μm micro Ti, 10 μm micro Ti and 0.1 mm Ti mesh) were secured between two Teflon® blocks with a 0.336 cm2 diameter hole in each block (Figure S2). The coated side of the titanium was placed facing upward and in contact with the electrolyte. Electrolyte solution, K2SO4 (0.1 M, pH 3), was pipetted into the top well. The substrate was observed for 1 min to see if any of the electrolyte solution leaked through. If the sample successfully held the solution without leakage, the substrate was then used for step potential chronoamperometry. The potential was increased if the substrate continued to hold the solution. Initially, the potential was set to −0.1 V for 200 s, then −0.5 V for 90 s, −0.75 V for 90 s and finally −1 V for 90 s.

2.4. Electro-Etching

The formation of nanoporous structures was achieved with a two-step electrochemical process, as previously described [24]. Micro Ti samples were ultrasonically cleaned for 15 min in acetone, then ethanol, and dried with N2 gas. A two-electrodes system was used for the electrochemical steps described hereafter. For the electropolishing step, the titanium plate, acting as the working electrode, was secured between two Teflon® blocks, and a silver wire was used as the counter electrode (0.5 mm in diameter, 99.99% purity, GoodFellow, Cambridge, UK). The well in the top Teflon® block was filled with 750 μL of NH4F (0.0675 M in ethylene glycol with 1.0% water; ethylene glycol, Reagent Plus grade, purity > 99%, Sigma-Aldrich, Melbourne, Australia). The working and counter electrodes were connected to an EA-PS 9080-60T power supply (Elektro-Automatik, Viersen, Germany). The power supply was controlled by the equipment’s EA power control program. A constant potential of 80 V was applied to the working electrode for 45 min at room temperature. Afterward, the plate was rinsed with ethanol and sonicated in Milli-Q water for 15 min to remove the sacrificial layer. Next, the polished titanium substrate was again secured between the Teflon® blocks with the set-up described above. A total of 750 μL of the same electrolyte was added to the cell and a constant power of 80 V was applied for 1 min etching time. When the etching was complete, the sample was rinsed with ethanol and dried with N2 gas. The sample was then again cleaned ultrasonically for 15 min in ethanol at room temperature [25].

2.5. Surface Characterisation

2.5.1. X-ray Photoelectron Spectroscopy

X-ray photoelectron spectroscopy (XPS) analysis was performed using a Kratos Supra+ spectrometer with a monochromatic Al Kα X-ray source operating at a power output of 225 W and X-ray photon energy of 1486.6 eV. The analysis area was 0.3 × 0.7 mm2. Survey scans were collected over a range of 0–1100 eV binding energy with a dwell time of 55 ms using 160 eV pass energy and 0.5 eV step size with three sweeps. The results were processed using CasaXPS software (Ver. 2.3.24PR1.0, Casa Software Ltd., Teignmouth, UK) [26].

2.5.2. Scanning Electron Microscopy

Morphological analysis was carried out using a Zeiss Gemini 460 field emission scanning electron microscope (FESEM). The imaging was obtained at an acceleration voltage of 2.0 kV, a spot size of 9.0 pA and a working distance of 2 mm or less.

2.6. Electrochemistry

2.6.1. Cyclic Voltammetry and Chronoamperometry

All cyclic voltammetry and electrochemical impedance spectroscopy measurements were performed using an electrochemical analyser (Ivium-n-Stat, Ivium Technologies, Eindhoven, the Netherlands). All chronoamperometry measurements were performed with potentiostat (Gamry Instruments, Warminster, USA) and analysed with the equipment software Gamry EchemAnalyst (Version 7.8.2).
All measurements used a standard three-electrode system where Ti substrates acted as the working electrodes, a Pt coil as the counter electrode, and an Ag/AgCl electrode as the reference electrode (RE-1B, ALS Co., Ltd., Tokyo, Japan). The analysis area was a circle with a diameter of 0.336 cm2.

2.6.2. Electrochemical Impedance Spectroscopy

The electrochemical impedance spectroscopy (EIS) measurements were conducted in static electrolytes in the frequency range of 1,000,000 Hz to 0.01 Hz with a 10 mV amplitude at open circuit potential (OCP). The acquired EIS data were fitted and analysed using IviumSoft (Ivium-n-Stat, Ivium Technologies, Eindhoven, the Netherlands). Equation (1) was used to calculate proton conductivity, adapted from a previous study [27]:
K f = 1 R f . d t
where Kf is proton conductivity, Rf is film resistance in ohms (Ω), obtained from fit using an equivalent circuit (detailed in Section 3.6), d is the distance between electrodes (0.2 cm) and t is film thickness in nm.

3. Results

3.1. Film Stability in Electrolyte

There are three main deposition variables that affect the stability of a thin film deposited via plasma polymerisation. These are as follows: (1) deposition time, (2) power and (3) ignition pressure. The stability of the OD thin films under investigation was assessed for different deposition times, RF power and ignition pressure, by determining their wettability and thickness before and after exposure to the electrolyte solution (1 h/24 h incubation). Evaluating film thickness following prolonged exposure to electrolyte also provides some insight into the film adhesion to the substrate, which can be deemed satisfactory when no delamination is observed.

3.1.1. Time

With increasing deposition time, the film thickness increases following a linear trend (Figure 1a). This trend is consistent with all samples regardless of the incubation, and no delamination was observed indicating good film adhesion to the underlying substrate. Notably, films that were deposited for 90 s and more exhibited a considerable increase in thickness following the 24 h incubation in electrolyte treatment. A 17% increase in thickness after 24 h incubation was observed for the 30 s film, whereas for the 120 s sample, the thickness increased by 50%. This “swelling” phenomenon is attributed to the absorption of the electrolyte solution, which is also expected to influence film permeability and surface wettability properties [28]. Films deposited for 60 s and less were more consistent in terms of post-incubation thickness. The mean advancing contact angle of the deposited film was consistent across all deposition times, 90 ± 4° (Figure 1b). However, incubation in electrolyte solution did affect the hydrophobicity of the surface. The advancing water contact angle reduced by 5% on average after 24 h incubation for all the samples deposited for 120 s or less (Figure 1b).

3.1.2. Power

Octadiene films were deposited with increasing ignition powers from 5 to 40 W. Deposition at 5 and 10 W produced thinner films than those deposited at 20 W and above (Figure 1c). This is likely due to the low monomer fragmentation rate occurring at low powers, which limits polymerisation and cross-linking on the surface. Films deposited at higher power were found to be highly stable in the electrolyte solution, demonstrated by consistent thicknesses and contact angles before and after incubation (Figure 1c,d). Other studies have also observed an increase in film thickness and stability with higher powers [28]. It was demonstrated that the smaller the pressure-to-power ratio is, the more cross-linked the film becomes. This finding is consistent with the results presented in Figure 1d, which implies that dense films are less permeable to solvent. The mean contact angle has a slight decreasing trend with increasing power. This suggests that films deposited at lower powers are more hydrophobic. Films deposited at 20 W are the most stable, but not as hydrophobic as those deposited at 10 W.

3.1.3. Pressure

Films deposited at low pressures (1.0 × 10⁻¹ mbar) were unstable, as evidenced by a 24% decrease in thickness after 24 h incubation, indicating film loss. On the other hand, very high pressures (2.2 × 10⁻¹ mbar) also showed instability due to solvent/electrolyte absorption. The thickness of this sample increased by 34% of its original thickness after 24 h incubation (Figure 1e). In contrast, ignition pressures between 1.3 × 10⁻¹ and 2.0 × 10⁻¹ mbar produced stable films. For these ignition pressures, similar thicknesses and contact angles were recorded for all treatments (Figure 1f), although the wider distribution in the receding contact angle values also suggests the films were overall less homogeneous than films deposited for longer times and at higher powers.
Overall results from the stability tests post incubation indicate that films deposited for less than 60 s, at 20 W and with the medium pressure of 1.3 × 10⁻¹ mbar were the most stable.

3.2. Film Stability under Current

For electrocatalytic applications, not only is it important that the thin film is stable and hydrophobic in the electrolyte solution, but also that the film is able to maintain its surface properties and integrity after exposure to an electrical current. This was tested by subjecting OD plasma polymer films deposited on a conductive titanium substrate to cyclic voltammetry.
Five octadiene plasma polymers were deposited between 30 and 180 s on solid Ti for electrochemical stability testing. The advancing and receding contact angles were measured before and after 10 cyclic voltammetry cycles. The advancing contact angles before and after cyclic voltammetry were found to be largely unchanged, displaying high stability down to −1.0 V vs. RHE. When the receding angle was compared before and after CV, the samples deposited for 2 min and longer maintained higher angles than films deposited for 90 s or less. Therefore, thicker films displayed greater stability to current exposure in terms of wetting properties (Figure 2a), but displayed higher absorption of the electrolyte solution than thinner films, as shown in the previous section (Figure 1a). Figure 2b shows that the films deposited at 10 W had the highest advancing contact angle. The receding contact angle of the film deposited at 5 W is significantly lower than 10 W and 20 W. This could indicate that the film is non-continuous over the substrate causing the droplet to adhere more strongly to the titanium while the droplet recedes, thus lowering the receding angle.

3.3. XPS

XPS was used to analyse the chemical composition of the octadiene films deposited over a range of ignition pressures.
The carbon content of the film went through a maximum for films deposited at 1.3 × 10⁻¹ mbar before decreasing again as the pressures went up to 2.2 × 10⁻¹ mbar. Inversely, the oxygen content was higher for the lowest and highest pressures (Figure 3a). This finding is consistent with the previous observation that both extreme pressures led to lower film stability and lower contact angles (Figure 1e,f). The samples analysed after cyclic voltammetry were found to have a higher oxygen percentage than the samples prior to CV measurements, and more so for the films deposited at higher pressures. The cyclic voltammetry treatment was conducted in an aqueous solution where oxygen can be produced at the counter electrode contributing to the increased oxygen percentage. Exposure to the atmosphere would also be expected to contribute to the O content. Other studies have found that without any treatment, carbon-centred radicals can oxidise to peroxy radicals and hydroperoxides before forming stable C-O groups on the surface [29]. During plasma deposition, octadiene is fragmented and ionised, forming a variety of carbon-hydrogen cross-linked species that can contain radicals. Therefore, it is reasonable to expect that C-O groups will form in octadiene films regardless of the treatment. This oxidation would also be expected to accelerate with higher exposure to oxygen, such as during CVs.
After consideration of all three plasma deposition variables and their effect on film stability in aqueous solutions and under electrical stress, it was confirmed that films deposited with 1.3 × 10⁻¹ mbar ignition pressure, 10 W RF power and 2 min deposition time were the most appropriate compromise between stability and hydrophobicity.

3.4. Porous Substrate Selection

In 3-phase electrochemical cell set-ups used for gas conversion, a conductive porous substrate is required to support the thin film and serve as an electrocatalyst. This substrate must be porous to allow gas transport, but also hydrophobic enough to prevent electrolytes from passing through the substrate (Scheme 1). A 0.1 mm titanium mesh and two types of porous titanium sponges, referred to as micro Ti, were tested as potential candidates and are shown in Figure 4a,b. As seen in these photographs, there is a large difference in pore size between these two materials (3 orders of magnitude). It is also important to note that the labels “1 μm” and “10 μm” are merely commercial identifiers for micro Ti, and not accurate labels related to the actual pore sizes. The SEM images in Figure 4c,d demonstrate the irregularities of the actual pore sizes. The contact angle for all uncoated Ti samples was unmeasurable as the droplet would immediately absorb into these hydrophilic substrates. In contrast, the contact angle for octadiene-coated mesh was above 100°, though not as high as the contact angle for the micro Ti samples. Coated micro Ti with pore size of 1 μm was found to be the substrate with the highest contact angle of 137° on average (Figure 4e). It is expected that this high contact angle is achieved through the hydrophobic thin film promoting air bubbles to form in the micro pores [17,23].
These three substrates were then subjected to leak tests to determine which coated material would remain the most hydrophobic in the electrolyte solution and under exposure to current. This test involved aqueous electrolyte solution (K2SO4) being pipetted onto each of the coated substrates (see Figure S2). If the sample could prevent electrolytes from penetrating through the substrate for 1 min, a voltage was then applied to the titanium. In Table 2, the samples shown in green are those that were able to maintain hydrophobic properties under electrical stress down to −1.0 V vs. RHE. All bare (i.e., uncoated) titanium materials absorbed electrolyte solution within 1 min and were therefore not tested further. The 1 µm micro Ti is the only substrate that did not allow any leakage even under electrical stress.
XPS survey analysis was repeated to investigate the thin film composition before and after electrical stress on micro Ti. Figure 5 shows that a very small change in the C:O ratio after 10 CV cycles was observed. This is a good indicator for high resilience to electrical stress of the octadiene coating on both micro Ti substrates. Therefore, the 10 µm micro Ti failing the leak test can be attributed to the effect of pore size rather than a change in chemistry.
Step potential chronoamperometry was then conducted to investigate the conductivity of the OD films on various titanium substrates.

3.5. Chronoamperometry
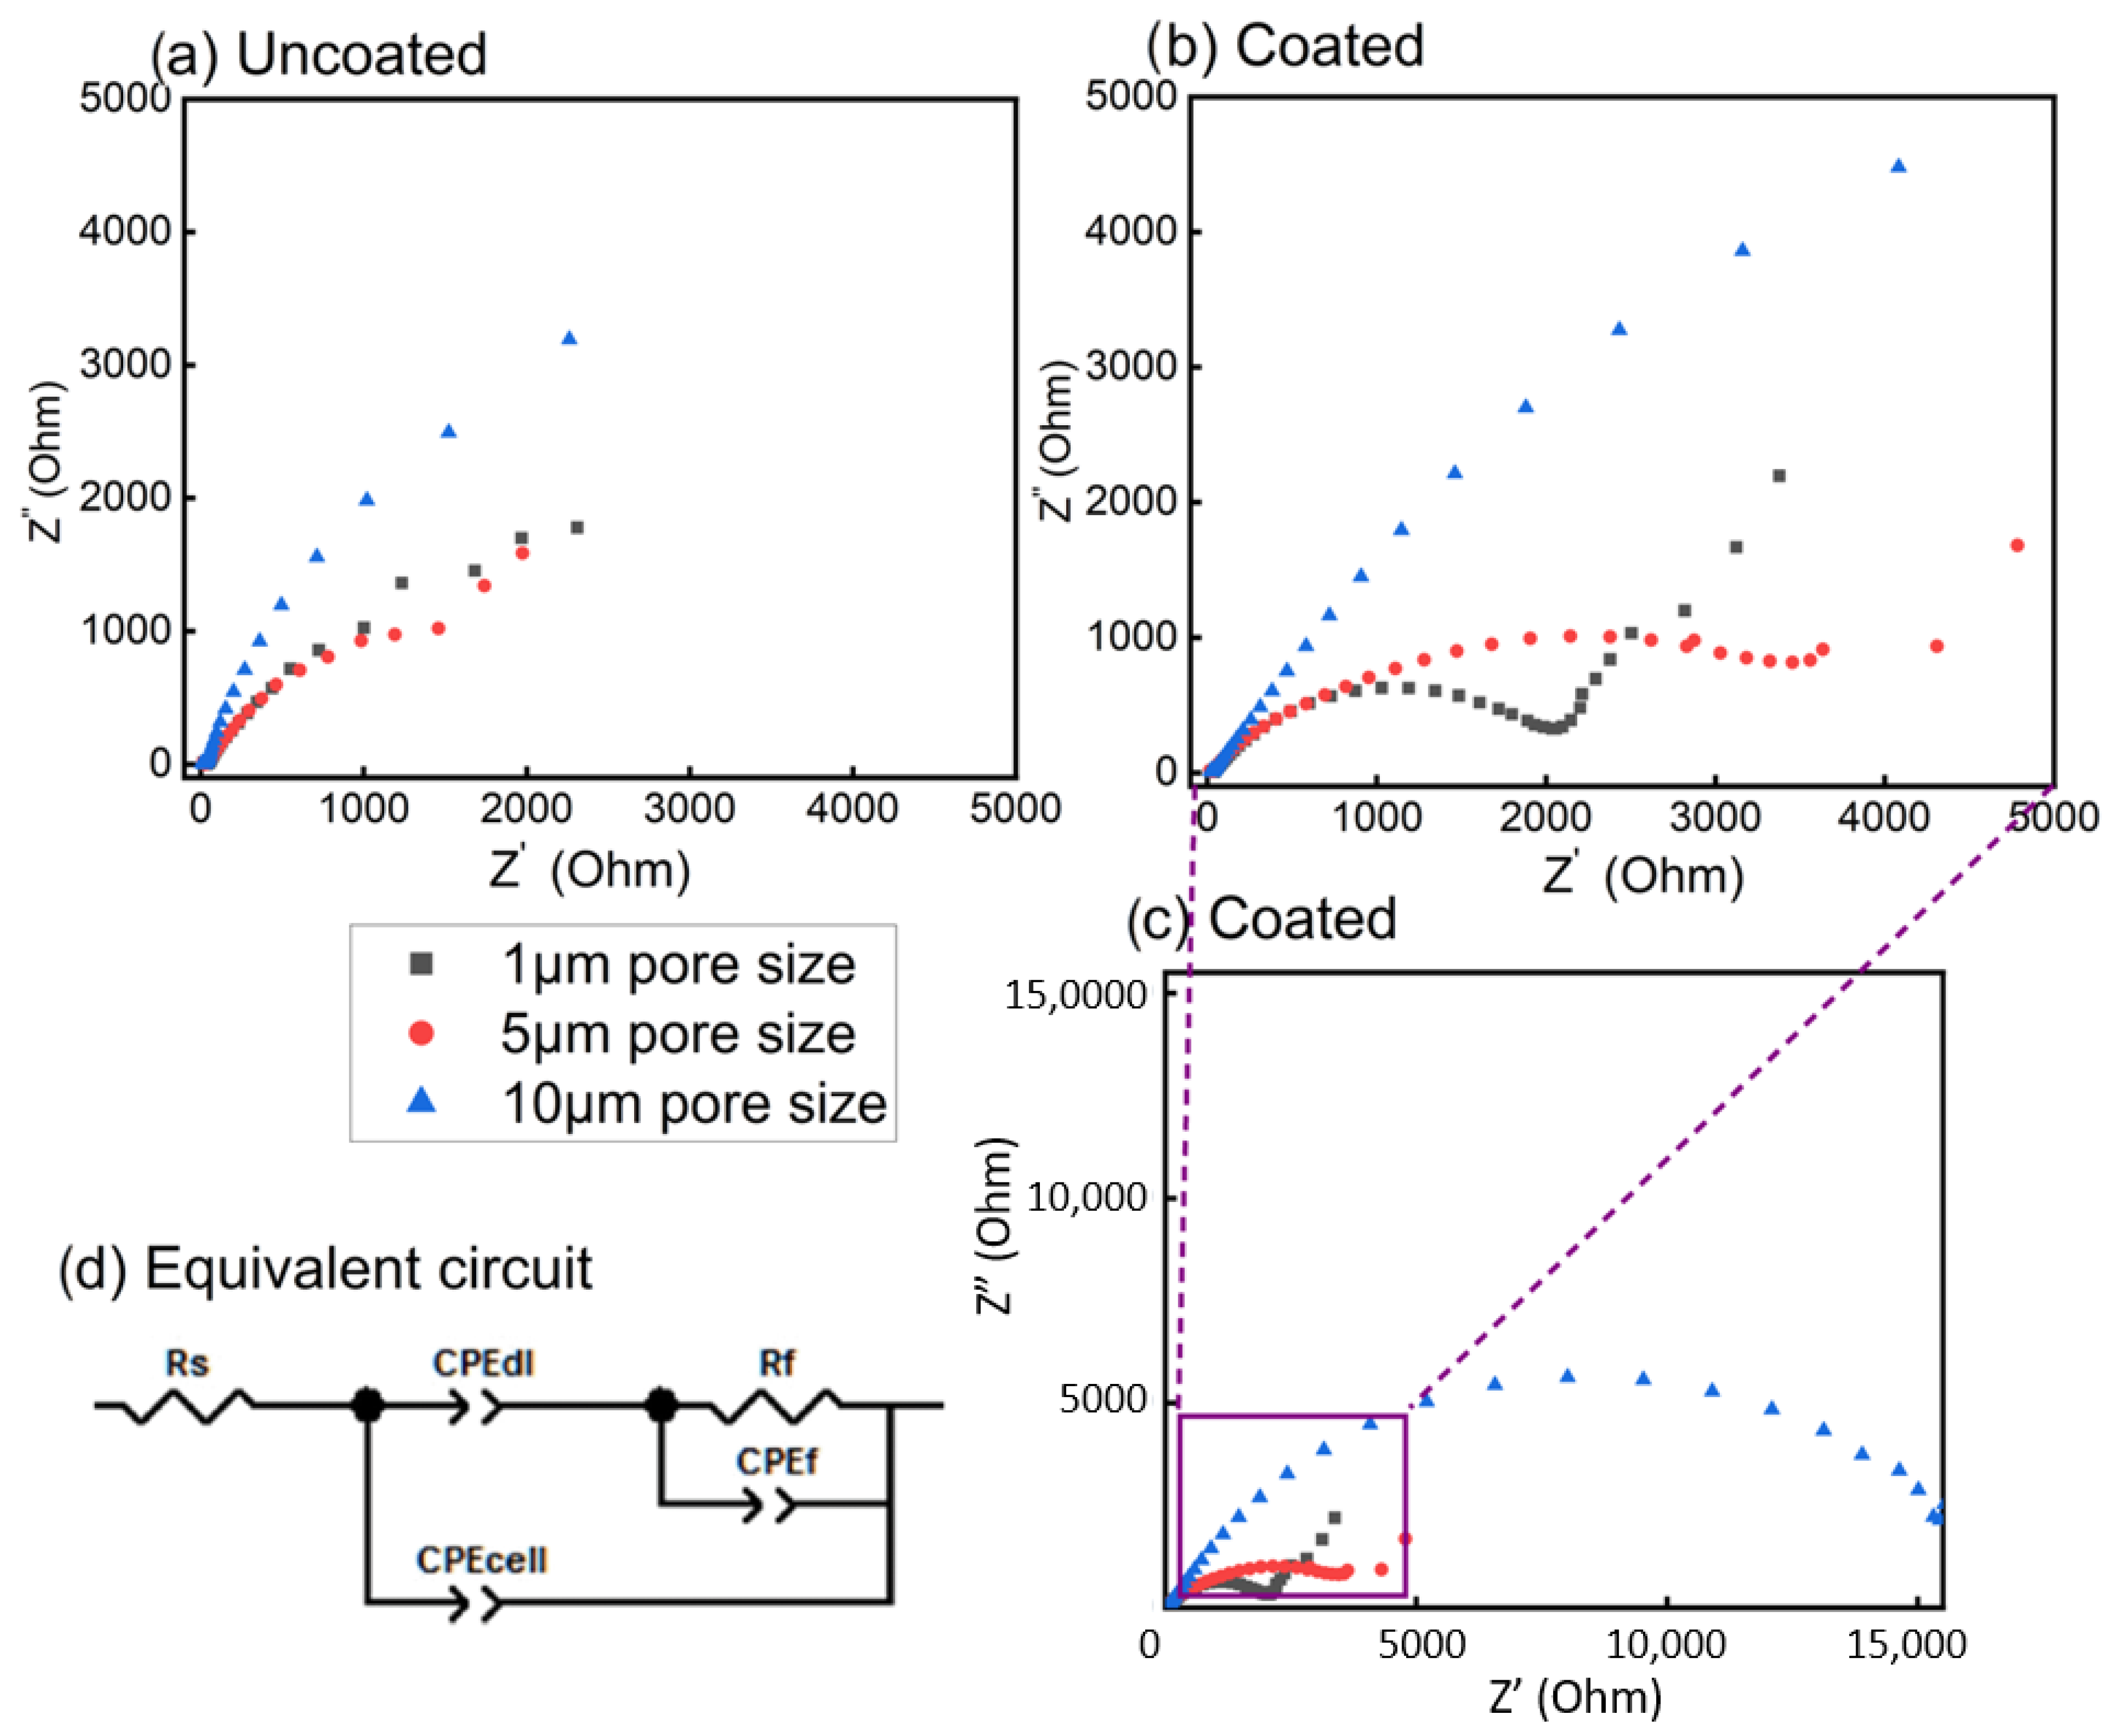
Chronoamperometry is another technique that can provide information on the stability of thin films when exposed to electrical stress. A completely insulative film would show no current produced at any potential, whereas a conductive sample would produce current signals (in absolute value) that follow Ohm’s law.
In Figure 6, the conductivity of a solid titanium substrate coated with a thin film of only 7 nm in thickness (Figure 6a) is compared to that of the same substrate coated with a 23 nm thick film (Figure 6b) over a range of potentials. As the potential increases from −0.1 V to −1.5 V vs. RHE, the current increases for both samples. As the potential becomes more negative, water reaching the electrode undergoes a reduction reaction, where protons are reduced to form hydrogen gas. As this reaction occurs, electrons are produced at the anode causing an increased flow of current. Here, the substrate coated with the thinner film shows a greater current than the thick film. This indicates that the thin film is more permeable to water than the thicker film, producing a higher current.
Solid Ti has a flat and uniform surface which, when coated with a thin OD film, is completely concealed. Micro Ti on the other hand is made up of irregular pores which when coated are not sealed by the film. In a working cell with coated micro Ti, electrolytes can travel through the electrode porous structure without significant film resistance and make contact with a larger electrode surface area thanks to its microporous structure. As a result, a higher current is observed with micro Ti as the substrate (Figure 6c,d) compared to solid Ti (Figure 6a,b). It is worth noting that whilst Figure 6b,c were obtained with the 23 nm thick films, the current produced was significantly different between the different pore sizes. This difference in current is therefore due to the microstructure of the titanium material, not the thin film. The current does not stabilise in 10 μm micro Ti with an applied potential of −0.75 V or −1.0 V vs. RHE (Figure 6d). This is perhaps due to large volumes of water reaching the titanium through large pores and damaging the film. In contrast, large currents were measured on the 1 µm micro Ti substrates.

3.6. EIS

Figure 7a shows the impedance of uncoated micro Ti samples. This can be compared to Figure 7b,c which show the impedance of the same substrates but coated with octadiene. The Nyquist plots presented here consist of an inductive behaviour shown at the high-frequency region and a capacitive behaviour shown at the low-frequency region. Figure 7d represents the equivalent circuit fitted with the following elements: Rs (solvent resistance), Rf (film resistance), CPEdl (constant phase element representing double layer capacitance), CPEcell (constant phase element representing cell capacitance) and CPEf (constant phase element representing film capacitance). Similar responses for proton transfer in thin film have been reported [27]. For 1 μm and 5 μm micro Ti, whether uncoated or coated, all samples produce similar impedances (Table S1). These results demonstrate how insignificantly the thin film impacts sample conductivity when deposited on micro Ti with small pores. While the wettability test demonstrated that the coated micro Ti was hydrophobic, the OD coatings were too thin to conceal the pores. The hydrophobicity arises from air trapping in the pores, as the coatings follow the topography of the substrates which retain their porous structures. These “holes” in the coating allow for high charge and electrolyte permeability to the electrode [30]. Thus, the proton conductivity calculations are not expected to be an accurate representation of film permeability despite the relatively large calculated Rf values (Table S1) [31]. Although Figure 7 does not clearly provide information on film permeability, it does highlight the effect of pore size on the overall substrate resistance. Specifically, it appears that increasing the pore size to 10 μm significantly impacts the impedance. The 10 μm sample has a much higher resistance than the 1 μm and 5 μm samples. This suggests that larger free space (pore size) increases resistance when the pores are not filled with solution [32]. This finding is consistent with other studies [33]. Since the small pore sizes had a positive effect on both the hydrophobicity retention (leak test in Table 2) and the electrochemical properties (higher current in Figure 6c, transfer and lower charge transfer resistance in Figure 7b), the titanium substrates were then endowed with even smaller nanostructures to investigate whether a greater increase in surface area would further improve the properties of the system.

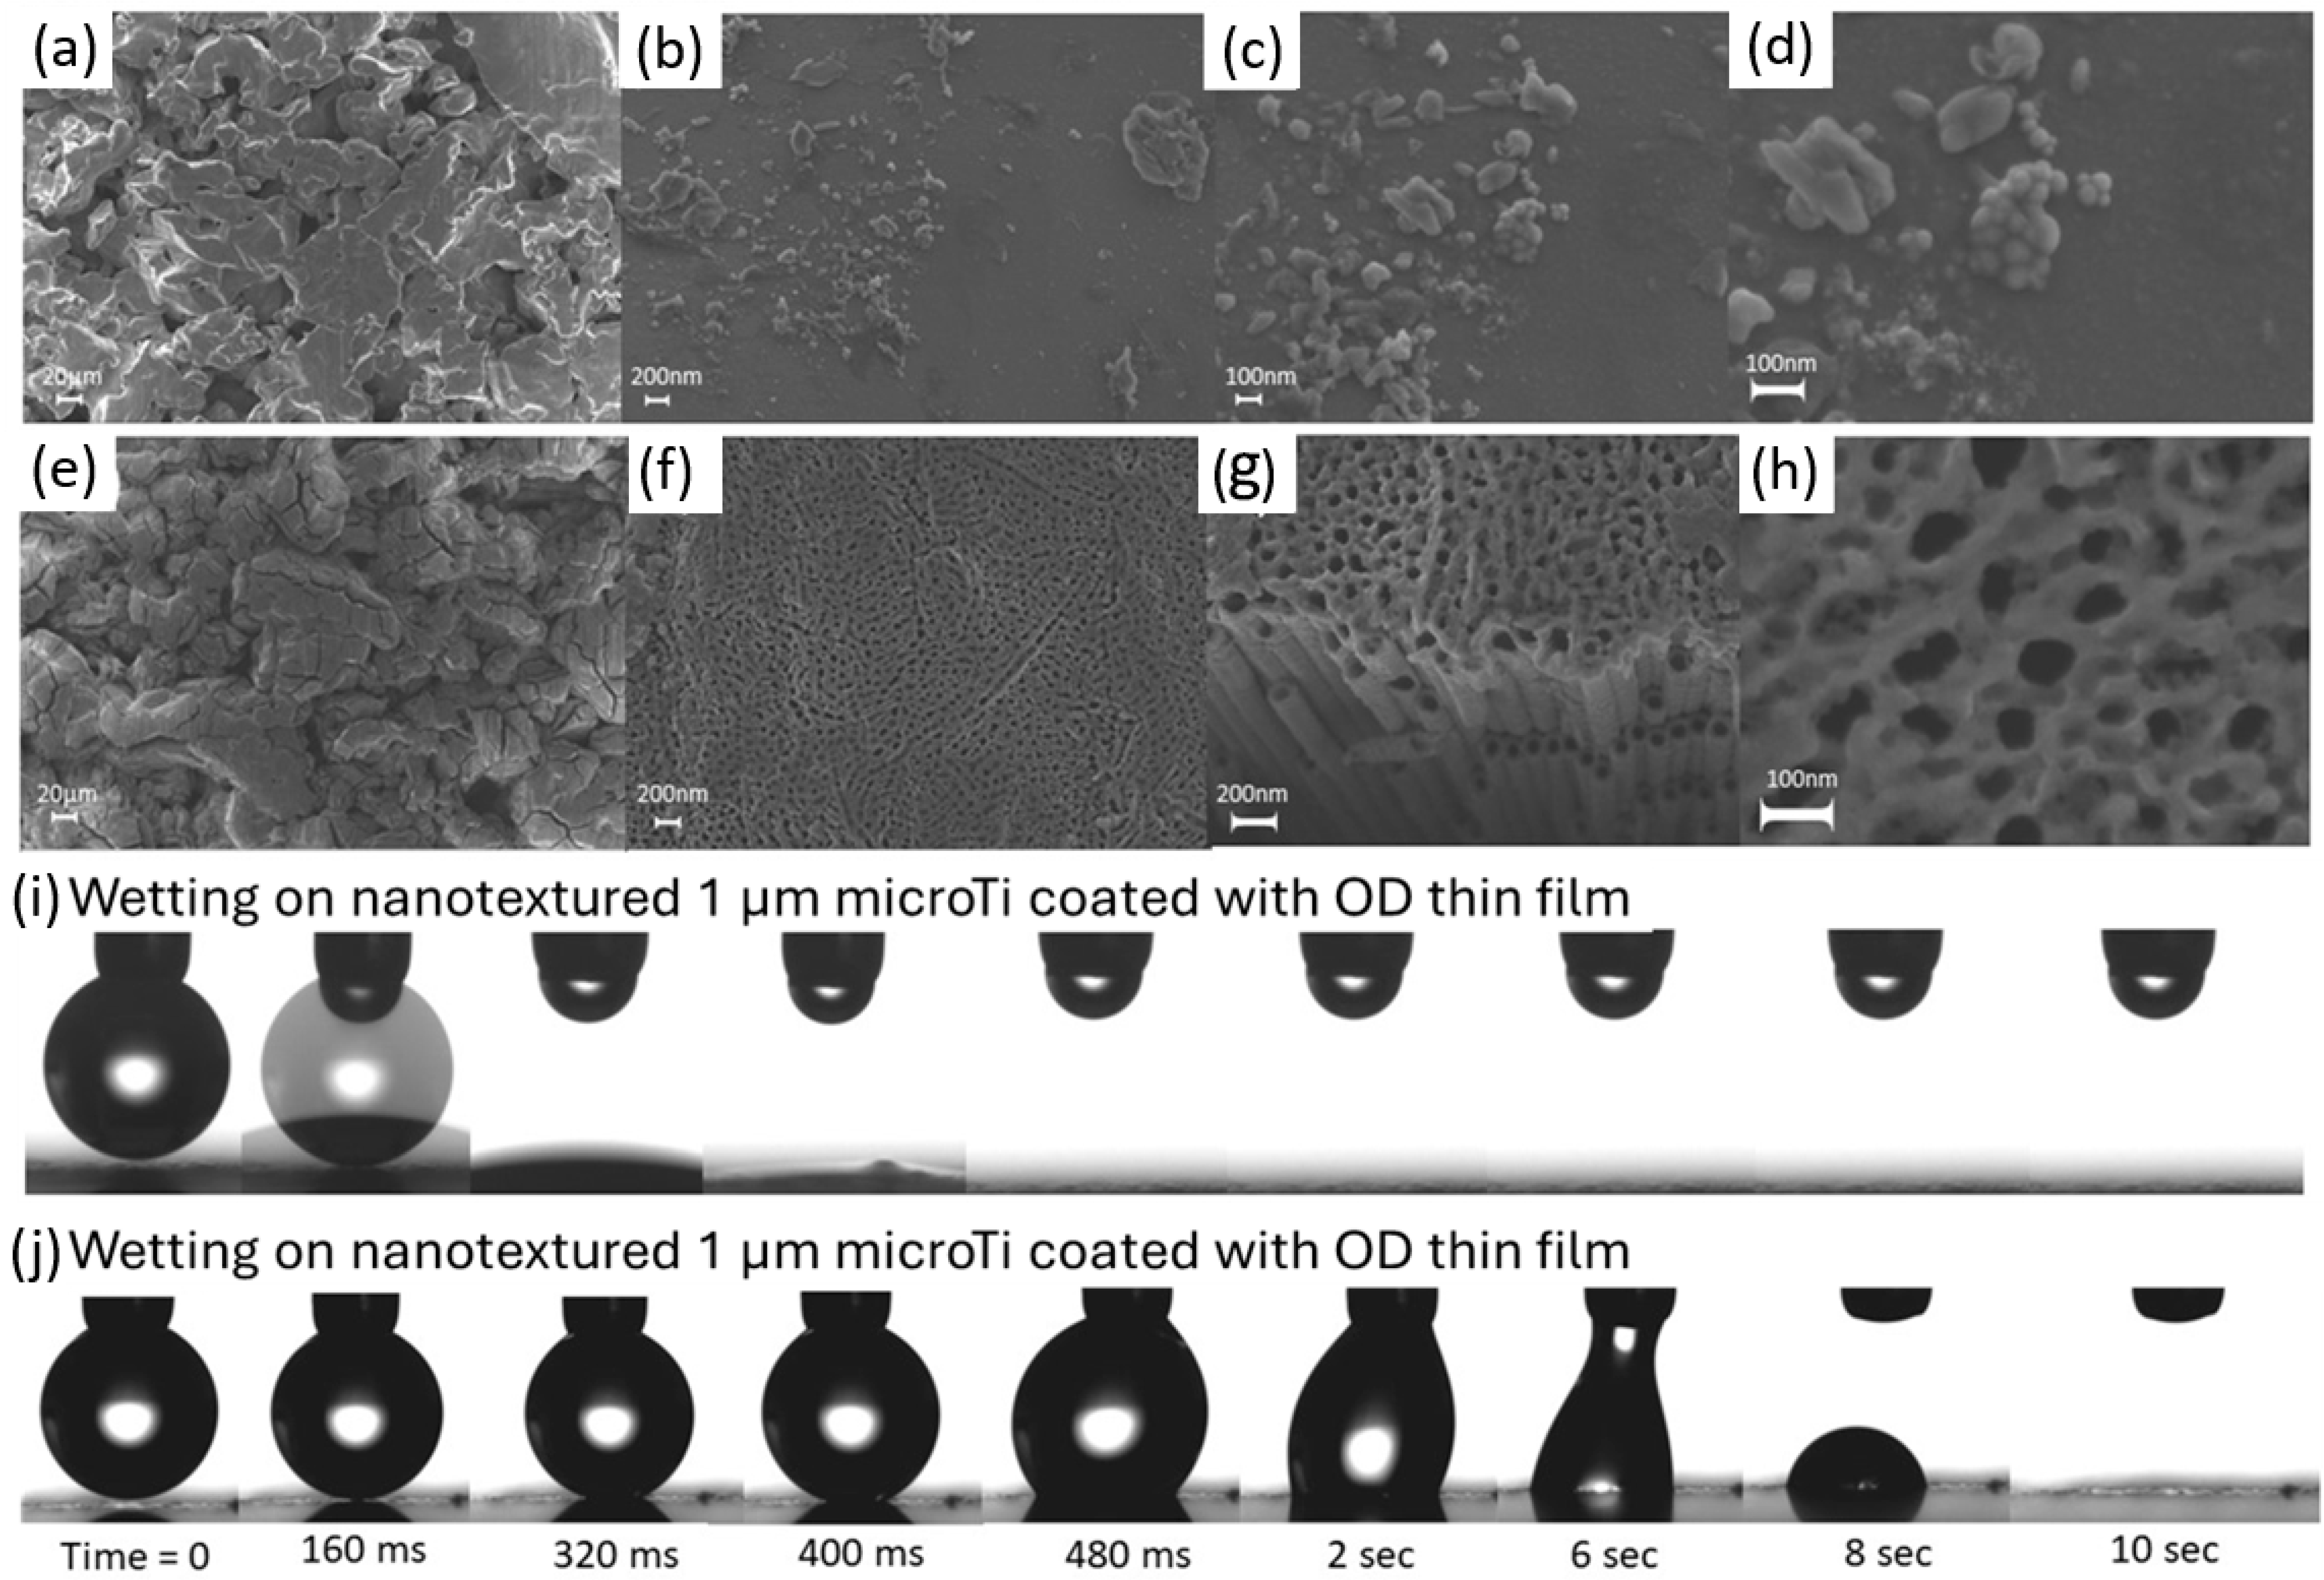
3.7. Effect of Nanotexture

Nanopores were etched in the micro Ti substrates following established procedures [24]. SEM images of the unetched and etched micro Ti are provided in Figure 8. Beyond increasing the overall surface area of the substrate, nanoporosity is expected to also modify the apparent wettability of the surface. Indeed, classic wetting models have shown that hydrophobic surfaces become more hydrophobic when microstructures are added on the surface, while hydrophilic surfaces become more hydrophilic when microstructured. In theoretical wetting models describing the effect of microstructuring, the cut-off contact angle between hydrophilic and hydrophobic surfaces is 90° face nanostructures [23]. Here the intrinsic water contact angle of the OD films on smooth surfaces (Figure 1) falls just around 90° (±4°) and so nanotexturing could either increase or decrease the overall wettability.
Following electrochemical etching, deep nanopores that cover the entire surface are formed. The diameter of the pores is between 30–80 nm. The nano etched micro Ti was then coated with octadiene at 1.3 × 10⁻¹ mbar at 10 W for 30 s or 2 min, corresponding to films with 7 nm and 23 nm in thickness, and the hydrophobicity of the surface was determined via water contact angles measurement (Figure 8c,d).
Both etched micro Ti, with thin and thick OD coatings, absorb aqueous solutions, though the process is much faster for the thin film sample compared to the thick one where the droplet immediately absorbs into the substrate after 400 ms. For the thicker coating, the water contact angle can be measured using a high-speed camera and is over 130°. Yet the surface still absorbs the liquid within 10 s (Figure 8d). The nanotexture did not increase the overall hydrophobicity of the OD-coated substrates. These results suggest that in order for the surface to become more hydrophobic with nanotexturing, the surface must be coated with an inherently more hydrophobic film than octadiene. It is interesting to see that when coated with the same OD thin films, the unetched 1 µm micro Ti becomes more hydrophobic than smooth Ti plates, but the nano etched micro Ti is not hydrophobic. This finding suggests that nanostructures affect surface wettability differently in comparison to microstructures.

4. Conclusions

The effect of plasma polymer deposition conditions on the stability and hydrophobicity of nanothin (below 40 nm) octadiene films was investigated. Longer deposition times led to thicker octadiene films that are capable of absorbing more electrolyte solution, but are also more resilient under electrical stress. OD plasma polymers deposited at low powers (10 W and less) and medium pressures (1.3 to 2.0 × 10⁻¹ mbar) produced films with higher hydrophobicity. The best compromise between stability and hydrophobicity was identified as films deposited with 1.3 × 10⁻¹ mbar ignition pressure and 10 W radio frequency power. OD films deposited in these conditions successfully increased the hydrophobicity of Ti mesh and microporous Ti. This increase in hydrophobicity could withstand exposure to current. For the smallest micropores (1 µm micro Ti), the OD coating hydrophobised the substrate enough to prevent electrolyte penetrating the porous material in a custom-made leak test cell, and yet allowed current transfer with low resistance. This proof-of-concept result shows that the OD surface modification and 1 µm micro Ti material combination could be a viable option as the porous substrate for use in 3-phase electrochemical cells requiring reactant gas trapping. Additional characterisation of the film’s mechanical properties would be insightful in determining the robustness of the film for practical applications. However, further increasing the surface area of the 1 µm micro Ti substrate via nanostructuring did not improve the system. The material instead lost its hydrophobic capacity to prevent liquid penetration in the porous substrate
The results showed that octadiene does not produce a thin film that is hydrophobic enough to form superhydrophobic surfaces with the addition of nanostructures. Future endeavours should take into account the chemistry of the monomer in the selection criteria to guarantee higher hydrophobicity which could result in a superhydrophobic state of the electrode due to a combination of micro- and nano roughness.

Supplementary Materials

The following supporting information can be downloaded at https://www.mdpi.com/article/10.3390/plasma7030039/s1: Figure S1: Custom plasma reactor set up; Figure S2: Custom electrochemical cell set up; Table S1: Equivalent circuit elements from fitted EIS data.

Author Contributions

Conceptualization, M.M.; Methodology, G.E., K.W.H., Z.J. and M.M.; Validation, G.E., K.W.H. and I.D.; Formal Analysis, G.E., K.W.H., Z.J. and I.D.; Investigation, G.E.; Resources, M.M.; Data Curation, G.E., I.D. and M.M.; Writing—Original Draft Preparation, G.E.; Writing—Review & Editing, G.E., K.W.H., I.D., Z.J. and M.M.; Supervision, I.D., Z.J. and M.M.; Project Administration, M.M.; Funding Acquisition, M.M. All authors have read and agreed to the published version of the manuscript.

Funding

The authors acknowledge the financial support of the Australian Research Council (grant: FT200100301) and the instruments and expertise of Microscopy Australia at the Future Industries Institute, University of South Australia, enabled by NCRIS, university, and state government support. This work was performed in part at the South Australian node of the Australian National Fabrication Facility under the National Collaborative Research Infrastructure Strategy.

Institutional Review Board Statement

Not applicable.

Informed Consent Statement

Not applicable.

Data Availability Statement

The data presented in this study are available on request from the corresponding author due to privacy reasons.

Conflicts of Interest

The authors declare no conflicts of interest.

References

  1. Tawalbeh, M.; Murtaza, S.Z.M.; Al-Othman, A.; Alami, A.H.; Singh, K.; Olabi, A.G. Ammonia: A versatile candidate for the use in energy storage systems. Renew. Energy 2022, 194, 955–977. [Google Scholar] [CrossRef]
  2. Wang, Y.; Cui, X.; Zhao, J.; Jia, G.; Gu, L.; Zhang, Q.; Meng, L.; Shi, Z.; Zheng, L.; Wang, C.; et al. Rational Design of Fe–N/C Hybrid for Enhanced Nitrogen Reduction Electrocatalysis under Ambient Conditions in Aqueous Solution. ACS Catal. 2019, 9, 336–344. [Google Scholar] [CrossRef]
  3. Qi, Y.; Zhao, S.; Pang, Y.; Yang, Y. Hydrophobic Nanoporous Silver with ZIF Encapsulation for Nitrogen Reduction Electrocatalysis. Molecules 2023, 28, 2781. [Google Scholar] [CrossRef] [PubMed]
  4. Zheng, J.; Lyu, Y.; Qiao, M.; Wang, R.; Zhou, Y.; Li, H.; Chen, C.; Li, Y.; Zhou, H.; Jiang, S.P.; et al. Photoelectrochemical Synthesis of Ammonia on the Aerophilic-Hydrophilic Heterostructure with 37.8% Efficiency. Chem 2019, 5, 617–633. [Google Scholar] [CrossRef]
  5. Lee, C.; Yan, Q. Electrochemical reduction of nitrogen to ammonia: Progress, challenges and future outlook. Curr. Opin. Electrochem. 2021, 29, 100808. [Google Scholar] [CrossRef]
  6. MacFarlane, D.R.; Cherepanov, P.V.; Choi, J.; Suryanto, B.H.R.; Hodgetts, R.Y.; Bakker, J.M.; Ferrero Vallana, F.M.; Simonov, A.N. A Roadmap to the Ammonia Economy. Joule 2020, 4, 1186–1205. [Google Scholar] [CrossRef]
  7. Li, S.J.; Bao, D.; Shi, M.M.; Wulan, B.R.; Yan, J.M.; Jiang, Q. Amorphizing of Au Nanoparticles by CeOx–RGO Hybrid Support towards Highly Efficient Electrocatalyst for N2 Reduction under Ambient Conditions. Adv. Mater. 2017, 29, 1700001. [Google Scholar] [CrossRef]
  8. Geng, Z.; Liu, Y.; Kong, X.; Li, P.; Li, K.; Liu, Z.; Du, J.; Shu, M.; Si, R.; Zeng, J. N2 Electrochemical Reduction: Achieving a Record-High Yield Rate of 120.9 [MU]gNH3mgcat.-1h-1 for N2 Electrochemical Reduction over Ru Single-Atom Catalysts. Adv. Mater. 2018, 30. [Google Scholar] [CrossRef]
  9. Liu, H.-M.; Han, S.H.; Zhao, Y.; Zhu, Y.-Y.; Tian, X.-L.; Zeng, J.-H.; Jiang, J.-X.; Xia, B.Y.; Chen, Y. Surfactant-free atomically ultrathin rhodium nanosheet nanoassemblies for efficient nitrogen electroreduction. J. Mater. Chem. A 2018, 6, 3211–3217. [Google Scholar] [CrossRef]
  10. Shi, M.M.; Bao, D.; Li, S.J.; Wulan, B.R.; Yan, J.M.; Jiang, Q. Anchoring PdCu Amorphous Nanocluster on Graphene for Electrochemical Reduction of N2 to NH3 under Ambient Conditions in Aqueous Solution. Adv. Energy Mater. 2018, 8, 1800124. [Google Scholar] [CrossRef]
  11. Karapinar, D.; Tran, N.-H.; Giaume, D.; Ranjbar, N.; Jaouen, F.; Mougel, V.; Fontecave, M. FeNC catalysts for CO2 electroreduction to CO: Effect of nanostructured carbon supports. Sustain. Energy Fuels 2019, 3, 1833–1840. [Google Scholar] [CrossRef]
  12. Firoz Babu, K.; Marxe, K.; Anbu Kulandainathan, M. Anodically fabricated TiO 2 nanopores for electrocatalytic reduction of aldehydes. J. Electroanal. Chem. 2011, 663, 79–83. [Google Scholar] [CrossRef]
  13. Goesmann, H.; Feldmann, C. Nanoparticulate Functional Materials. Angew. Chem. 2010, 49, 1362–1395. [Google Scholar] [CrossRef] [PubMed]
  14. Wakerley, D.; Lamaison, S.; Ozanam, F.; Menguy, N.; Mercier, D.; Marcus, P.; Fontecave, M.; Mougel, V. Bio-inspired hydrophobicity promotes CO2 reduction on a Cu surface. Nat. Mat. 2019, 18, 1222–1227. [Google Scholar] [CrossRef]
  15. Wu, H.; Singh-Morgan, A.; Qi, K.; Zeng, Z.; Mougel, V.; Voiry, D. Electrocatalyst Microenvironment Engineering for Enhanced Product Selectivity in Carbon Dioxide and Nitrogen Reduction Reactions. ACS Catal. 2023, 13, 5375–5396. [Google Scholar] [CrossRef]
  16. Macgregor, M.; Vasilev, K. Perspective on Plasma Polymers for Applied Biomaterials Nanoengineering and the Recent Rise of Oxazolines. Materials 2019, 12, 191. [Google Scholar] [CrossRef]
  17. Ramiasa-MacGregor, M.; Mierczynska, A.; Sedev, R.; Vasilev, K. Tuning and predicting the wetting of nanoengineered material surface. Nanoscale 2016, 8, 4635–4642. [Google Scholar] [CrossRef]
  18. Akhavan, B.; Jarvis, K.; Majewski, P. Evolution of Hydrophobicity in Plasma Polymerised 1,7-Octadiene Films. Plasma Process. Polym. 2013, 10, 1018–1029. [Google Scholar] [CrossRef]
  19. Swaraj, S.; Oran, U.; Lippitz, A.; Schulze, R.-D.; Friedrich, J.F.; Unger, W.E.S. Surface analysis of plasma-deposited polymer films, 2a analysis of post-plasma air reacted plasma polymerized styrene by X-ray photoelectron spectroscopy and X-ray absorption spectroscopy. Plasma Process. Polym. 2004, 1, 134–140. [Google Scholar] [CrossRef]
  20. Seckin, E.; Urgen, M. A kinetic model for determining morphology transitions and growth kinetics of titania nanotubes during anodization of titanium in ethylene glycol based electrolytes. Surf. Coat. Technol. 2021, 409, 126840. [Google Scholar] [CrossRef]
  21. McEnaney, J.M.; Blair, S.J.; Nielander, A.C.; Schwalbe, J.A.; Koshy, D.M.; Cargnello, M.; Jaramillo, T.F. Electrolyte Engineering for Efficient Electrochemical Nitrate Reduction to Ammonia on a Titanium Electrode. ACS Sustain. Chem. Eng. 2020, 8, 2672–2681. [Google Scholar] [CrossRef]
  22. Delcheva, I.; Weinfurter, A.; Hui, K.W.; Gheorghiu, A.; Tran, T.T.D.; Vasilev, K.; Mougel, V.; Harmer, S.L.; MacGregor, M.N. Hydrophobic Coatings with Charge Permeability via Plasma Deposition of Long-Chain Perfluorocarbons. ACS Appl. Energy Mater. 2024. [Google Scholar] [CrossRef] [PubMed]
  23. MacGregor-Ramiasa, M.N.; Vasilev, K. Questions and Answers on the Wettability of Nano-Engineered Surfaces. Adv. Mater. Interfaces 2017, 4, 1700381. [Google Scholar] [CrossRef]
  24. Gheorghiu, A.; Chhasatia, R.; Delcheva, I.; Hui, K.W.; de Eulate, E.A.; MacGregor, M. Nanoscale steric hindrance guides size-selective adsorption of gold nanoparticles into titanium nanowells. Nano-Struct. Nano-Objects 2023, 34, 100966. [Google Scholar] [CrossRef]
  25. Gao, A.; Hang, R.; Bai, L.; Tang, B.; Chu, P.K. Electrochemical surface engineering of titanium-based alloys for biomedical application. Electrochim. Acta 2018, 271, 699–718. [Google Scholar] [CrossRef]
  26. Fairley, N.; Fernandez, V.; Richard-Plouet, M.; Guillot-Deudon, C.; Walton, J.; Smith, E.; Flahaut, D.; Greiner, M.; Biesinger, M.; Tougaard, S. Systematic and collaborative approach to problem solving using X-ray photoelectron spectroscopy. Appl. Surf. Sci. Adv. 2021, 5, 100112. [Google Scholar] [CrossRef]
  27. Paul, D.K.; McCreery, R.; Karan, K. Proton Transport Property in Supported Nafion Nanothin Films by Electrochemical Impedance Spectroscopy. J. Electrochem. Soc. 2014, 161, F1395. [Google Scholar] [CrossRef]
  28. Macgregor-Ramiasa, M.N.; Cavallaro, A.A.; Vasilev, K. Properties and reactivity of polyoxazoline plasma polymer films. J. Mater. Chem. B Mater. Biol. Med. 2015, 3, 6327–6337. [Google Scholar] [CrossRef]
  29. Drummond, C.J.; Vasic, Z.R.; Geddes, N.; Jurich, M.C.; Chatelier, R.C.; Gengenbach, T.R.; Griesser, H.J. Hydrophobic radiofrequency plasma-deposited polymer films: Dielectric properties and surface forces. Colloids Surf. A Physicochem. Eng. Asp. 1997, 129, 117–129. [Google Scholar] [CrossRef]
  30. Li, X.; Wang, Z.; Li, X.; Wang, G. Synthesis of a super-hydrophilic conducting polyaniline/titanium oxide hybrid with a narrow pore size distribution. Appl. Surf. Sci. 2012, 258, 4788–4793. [Google Scholar] [CrossRef]
  31. Chang, B.-Y. Conversion of a Constant Phase Element to an Equivalent Capacitor. J. Electrochem. Sci. Technol. 2020, 11, 318–321. [Google Scholar] [CrossRef]
  32. Kong, Y.; Nanjundan, A.K.; Liu, Y.; Song, H.; Huang, X.; Yu, C. Modulating Ion Diffusivity and Electrode Conductivity of Carbon Nanotube@Mesoporous Carbon Fibers for High Performance Aluminum–Selenium Batteries. Small 2019, 15, 1904310. [Google Scholar] [CrossRef] [PubMed]
  33. Liu, C.; Qiu, Y.; Liu, Y.; Xu, K.; Zhao, N.; Lao, C.; Shen, J.; Chen, Z. Novel 3D grid porous Li4Ti5O12 thick electrodes fabricated by 3D printing for high performance lithium-ion batteries. J. Adv. Ceram. 2022, 11, 295–307. [Google Scholar] [CrossRef]
Scheme 1. Electrochemical cell configurations, (left) a classic cell with solid catalyst material that provides limited reactant gas supply by bubbling into the electrolyte and (right) a 3-phase cell configuration where ample reactant gas can be provided from the bottom side of a porous catalyst. The hydrophobic coating (red), deposited from the plasma phase of 1,7-octadiene (C8H14 chemical formula in the centre) favours air trapping in both cases, but must also prevent electrolyte leakage through the porous catalyst in the 3-phase cell.
Plasma 07 00039 sch001
Figure 1. Film thickness: (top row, (a,c,e)) as measured via ellipsometry and contact angles; (bottom row, (b,d,f)) as a function of deposition time (a,b), deposition power (c,d) and ignition pressure (e,f). The thickness and contact angles were measured 24 h after deposition (blue markers), 24 h after the 1 h incubation period at room temperature in 0.1 M K2SO4 pH 3 solution (green markers) and 24 h after the 24 h incubation period in the same K2SO4 electrolyte (orange markers).
Plasma 07 00039 g001
Figure 2. Water contact angles on solid Ti plates coated with plasma-deposited OD films before (blue) and after (red) CVs, (a) deposition at 10 W power and 1.3 × 10⁻¹ mbar ignition pressure for various deposition times, (b) deposition at 30 s, 1.3 × 10⁻¹ mbar ignition pressure at various powers. Circles indicate advancing angles, while squares indicate receding angles. CV conditions: −0.1 to −1 V vs. RHE, 10 mV E step, 10 cycles, 1080 mV/s scan rate.
Plasma 07 00039 g002
Figure 3. (a) XPS survey scans of solid Ti plates coated with octadiene at 10 W, 30 s at different ignition pressures deposition. (b) oxygen atomic content (%) before and after CV for all ignition pressures investigated. CV conditions: (−0.1 to −1.0 V), 10 mV E step, 10 cycles, 100 mV/s scan rate.
Plasma 07 00039 g003
Figure 4. Photographs of (a) 1 mm Ti mesh and (b) 1 µm pore-sized micro Ti. Scanning electron microscopy images (SEM) of (c) unetched 1 μm micro Ti and (d) unetched 10 μm micro Ti at 500× magnification (e) Mean water contact angle of 1 μm micro Ti, 10 μm micro Ti and 0.1 mm Ti mesh samples both coated and uncoated.
Plasma 07 00039 g004
Figure 5. (a) X-ray photoelectron spectroscopy survey spectra on coated (octadiene; 10 W, 1.3 × 10⁻¹ mbar, 2 min) micro Ti samples (1 μm pore size and 10 μm pore size) before and after 10 cyclic voltammetry cycles. (b) corresponding C:O atomic ratio. CV conditions: −0.1 to −1.0 V, 10 mV E step, 10 cycles, 100 mV/s scan rate, 0.1 M K2SO4 pH 3 electrolyte solution.
Plasma 07 00039 g005
Figure 6. Step potential chronoamperometry of solid Ti plates coated with octadiene, (a) 10 W, 1.3 × 10⁻¹ mbar, 30 s. (b) 10 W, 1.3 × 10⁻¹ mbar, 2 min, and micro Ti substrates with nominative pore sizes (c) 1 μm and (d) 10 μm, both coated with octadiene 10 W, 0.13 mbar, 2 min.
Plasma 07 00039 g006
Figure 7. Nyquist plot of micro Ti samples: (a) uncoated and (b,c) coated with octadiene, 10 W, 1.3 × 10⁻¹ mbar, 2 min. (d) equivalent circuit, fitted with electrical elements comprising Rs (solvent resistance), Rf (film resistance), CPEdl (constant phase element representing double layer capacitance), CPEcell (constant phase element representing cell capacitance) and CPEf (constant phase element representing film capacitance).
Plasma 07 00039 g007
Figure 8. Scanning electron microscope (SEM) images of unetched (ad) and electro etched (eh) 1 μm micro Ti substrates at increasing magnification. The magnification of each column from left to right: 250×, 20K×, 50K×, 150K×. Snapshots of a water droplet being dispensed at time 0 s and being absorbed over time into the nano etched 1 μm micro Ti substrates coated with (i) 7 nm thin and (j) 23 nm thick OD film. The different film thickness corresponds to 30 s and 2 min plasma deposition at 1.3 × 10⁻¹ mbar and 10 W.
Plasma 07 00039 g008
Table 1. Plasma polymerisation conditions using 1,7-octadiene for titanium substrates surface modification.
ParametersConditions
Base pressure (mbar)2.0 × 10⁻²
Ignition pressure (mbar)1.0, 1.3, 1.6, 2.0, 2.2 × 10⁻¹
Power (W)5, 10, 20, 30, 40
Time (s)30, 60, 90, 120, 150, 180
Table 2. Hydrophobicity test results. A selection of coated and non-coated substrates was secured between two Teflon® blocks with the OD film facing upwards. A total of 900 μL of 0.1 M K2SO4(aq) electrolyte was pipetted into the well supported by only the porous titanium substrate under investigation. The set-up was observed for 1 min to determine if any electrolyte solution leaked through. If the sample passed this hold/leak test, the same substrate was used as the working electrode for step potential chronoamperometry at −0.1 V for 200 s. Following this, a leak test was performed again. If the solution still did not leak through, the potential was increased sequentially to −0.5 V for 90 s, −0.75 V for 90 s and −1.0 V 90 s.
SubstratePore SizeCoated1 min Hold −0.1 V−0.5 V−0.75 V−1 V
Micro Ti1 μmnono----
1 μmyesyesyesyesyesYes
10 μmnono----
10 μmyesyesyesyesnoNo
Ti Mesh1 mmnono----
1 mmyesyesnononono
Disclaimer/Publisher’s Note: The statements, opinions and data contained in all publications are solely those of the individual author(s) and contributor(s) and not of MDPI and/or the editor(s). MDPI and/or the editor(s) disclaim responsibility for any injury to people or property resulting from any ideas, methods, instructions or products referred to in the content.

