


A Review of Rainfall Estimation in Indonesia: Data Sources, Techniques, and Methods


Abstract
:1. Introduction
2. Rainfall Data Source
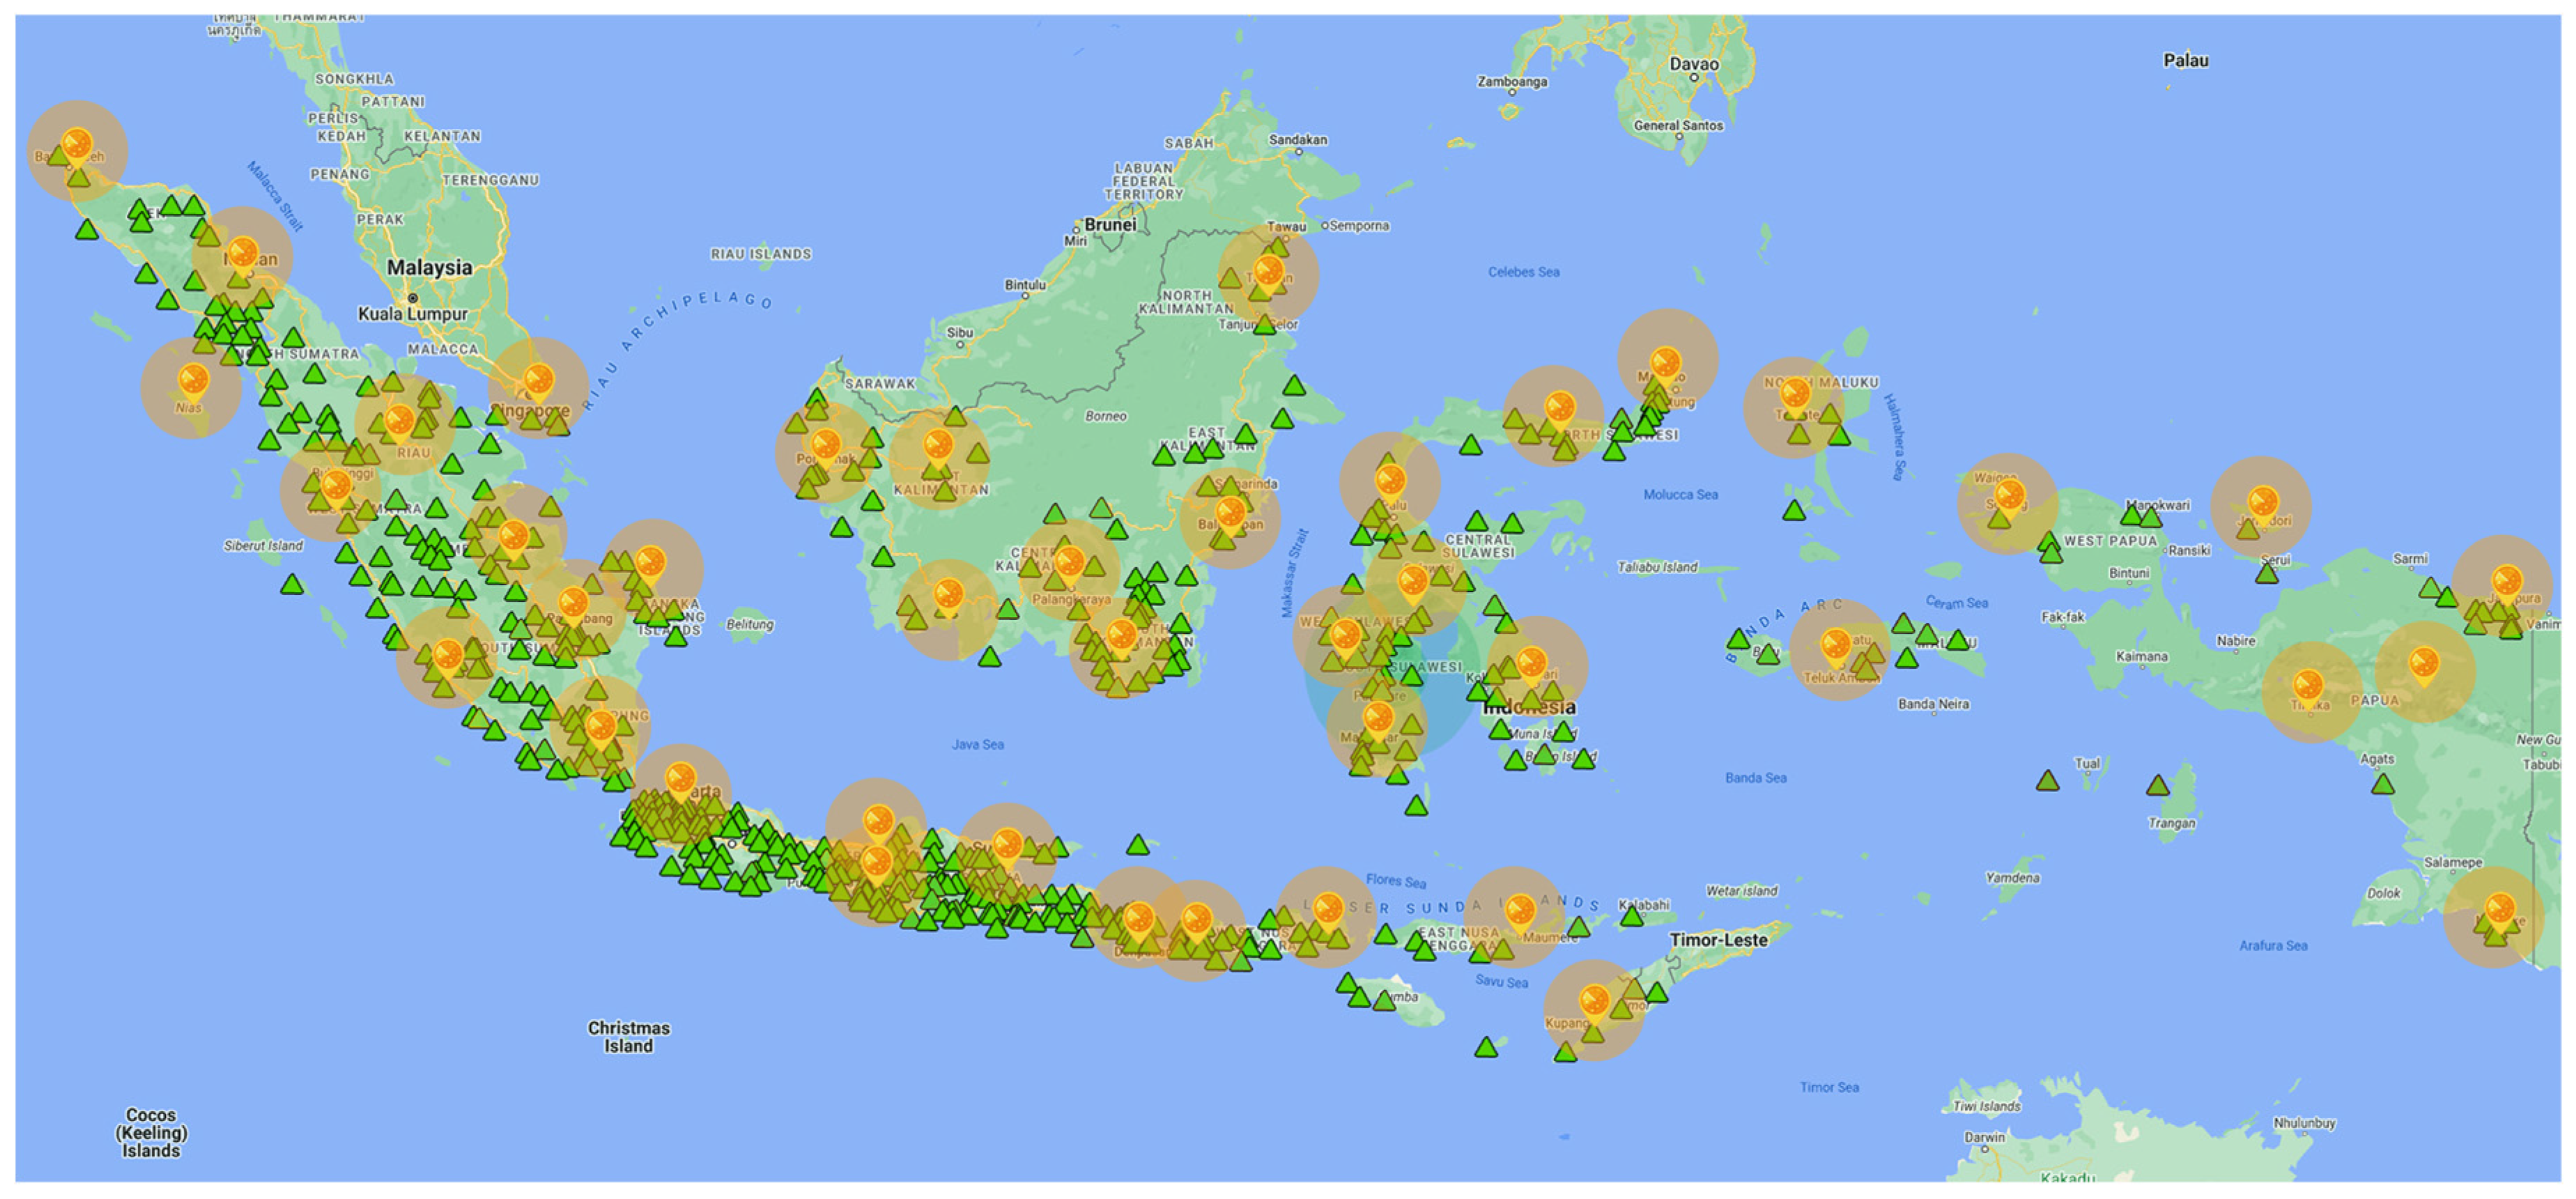
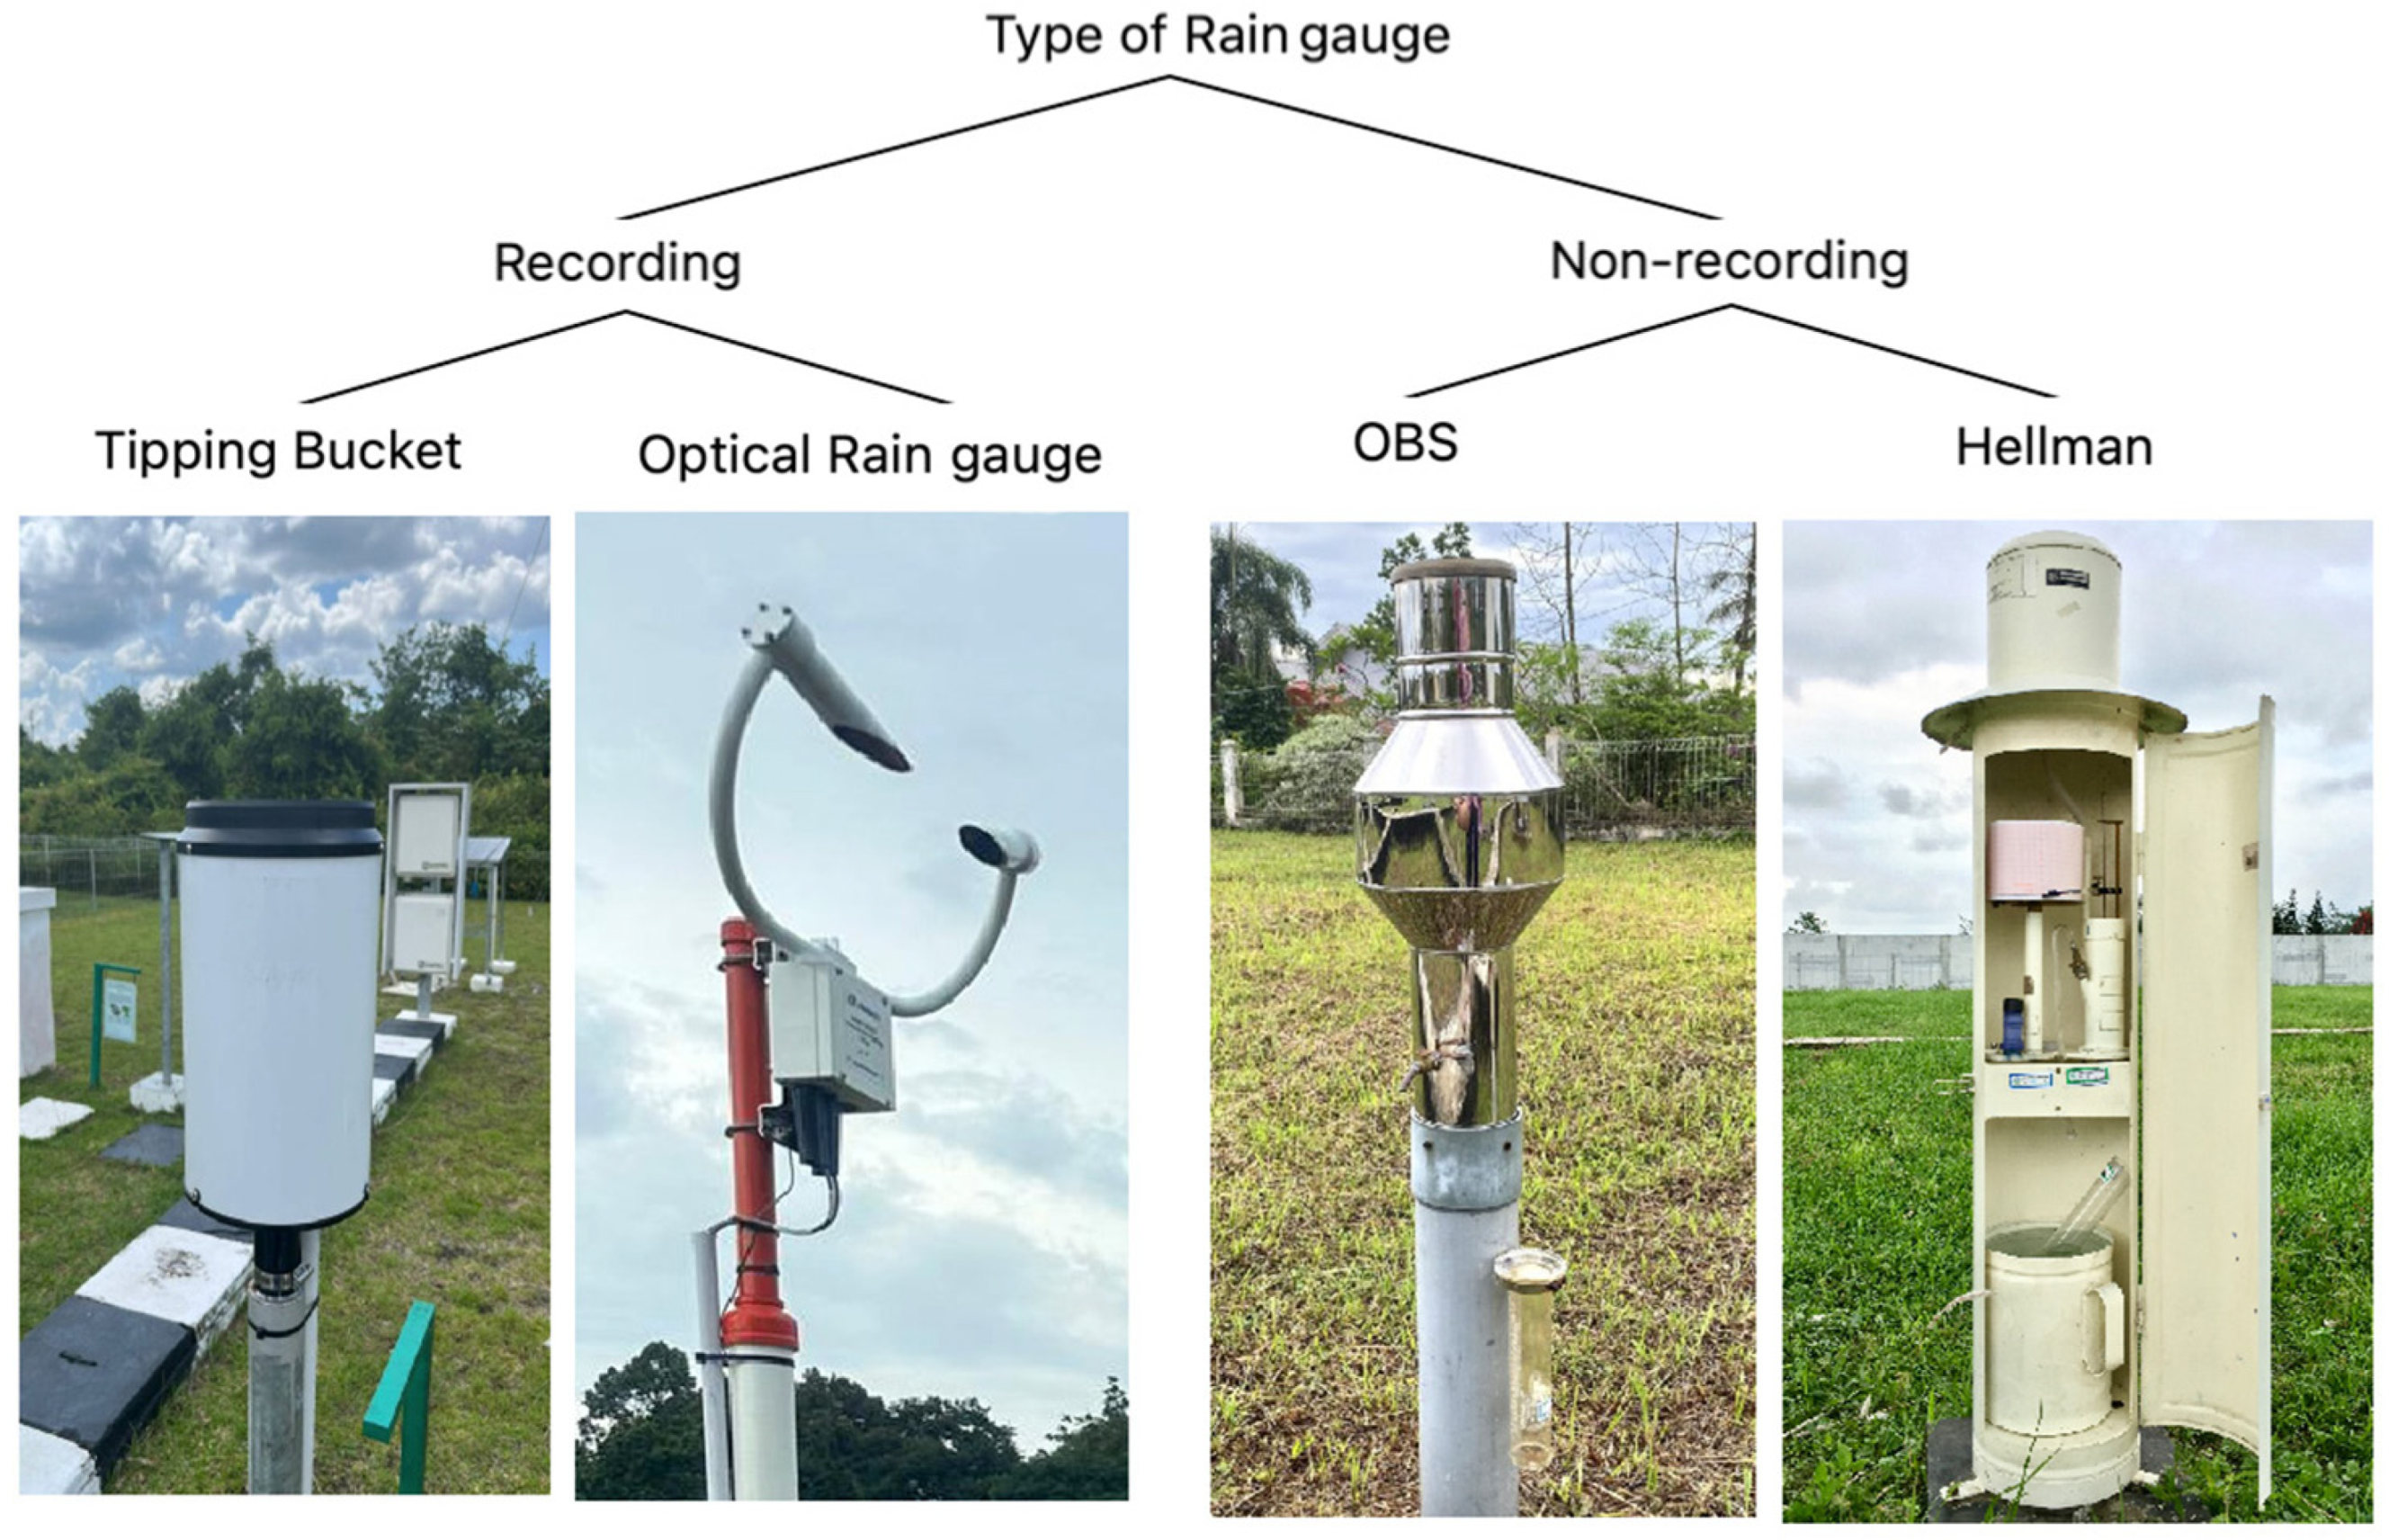
2.1. Rain Gauges
2.2. Weather Radar
2.2.1. Weather Radar Type
- The S-band weather radar operates at a 2.7–2.9 GHz frequency and has an 8–15 cm wavelength. Since attenuation has little effect on this type of radar, it has a range of up to 300 km. However, due to its wide beam width, its quantitative precipitation estimation (QPE) range only approaches 200 km [45]. While the S-band weather radar has advantages, due to several factors it may not be as suitable as the C-band radar if used in Indonesia. The S-band works at low frequencies with large lambda, so the penetration is deep because the attenuation effect is negligible. However, with a large lambda, the resolution and accuracy of the measurement results are low. Therefore, while using the S-band radar has some benefits, the C-band radar remains the best option for weather monitoring and forecasting in Indonesia.
- The C-band weather radar operates at a 5.6–5.65 GHz frequency with a 4–8 cm wavelength. It can detect rainfall up to a distance of 200 km. The signal attenuation received is significantly stronger than that of the S-band radar, limiting the QPE range to 100–150 km [45]. The C-band weather radar is widely used in Indonesia because it effectively detects and monitors the types of precipitation commonly found in the region, such as convective storms, tropical cyclones, and heavy rainfall events [47,48]. For many years, the C-band radar has also been extensively used in Indonesia, and the country has established a reliable network of C-band radar stations [34]. The data from these radar stations are used by the Indonesian Meteorology, Climatology, and Geophysics Agency (BMKG) to provide accurate weather forecasts and early warnings of severe weather events to the public [49].
- The X-band weather radar functions at a 9.3–9.5 GHz frequency and has the smallest wavelength of 2.5–4 cm. It is more sensitive to hydrometeors than the S-band or C-band weather radars. The X-band radar measurement range can extend up to 50 km. Signal attenuation caused by rain is the strongest in the X-band radar compared with that of the S-band and C-band radars, greatly limiting QPE. Accurate QPE is usually achieved at 30 km [45]. The X-band weather radar is not commonly used for weather monitoring in Indonesia due to several factors, such as its limited range and susceptibility to attenuation. Because the X-band radar has a much shorter range than other radar frequencies, it is less practical for weather monitoring over large areas, such as the Indonesian archipelago [35]. Another limitation of the X-band radar is its susceptibility to attenuation, which occurs when the radar signal is absorbed or scattered by particles in the atmosphere. As mentioned, attenuation can result in critical data loss and erroneous forecasts, especially in high-precipitation regions, such as Indonesia [50].
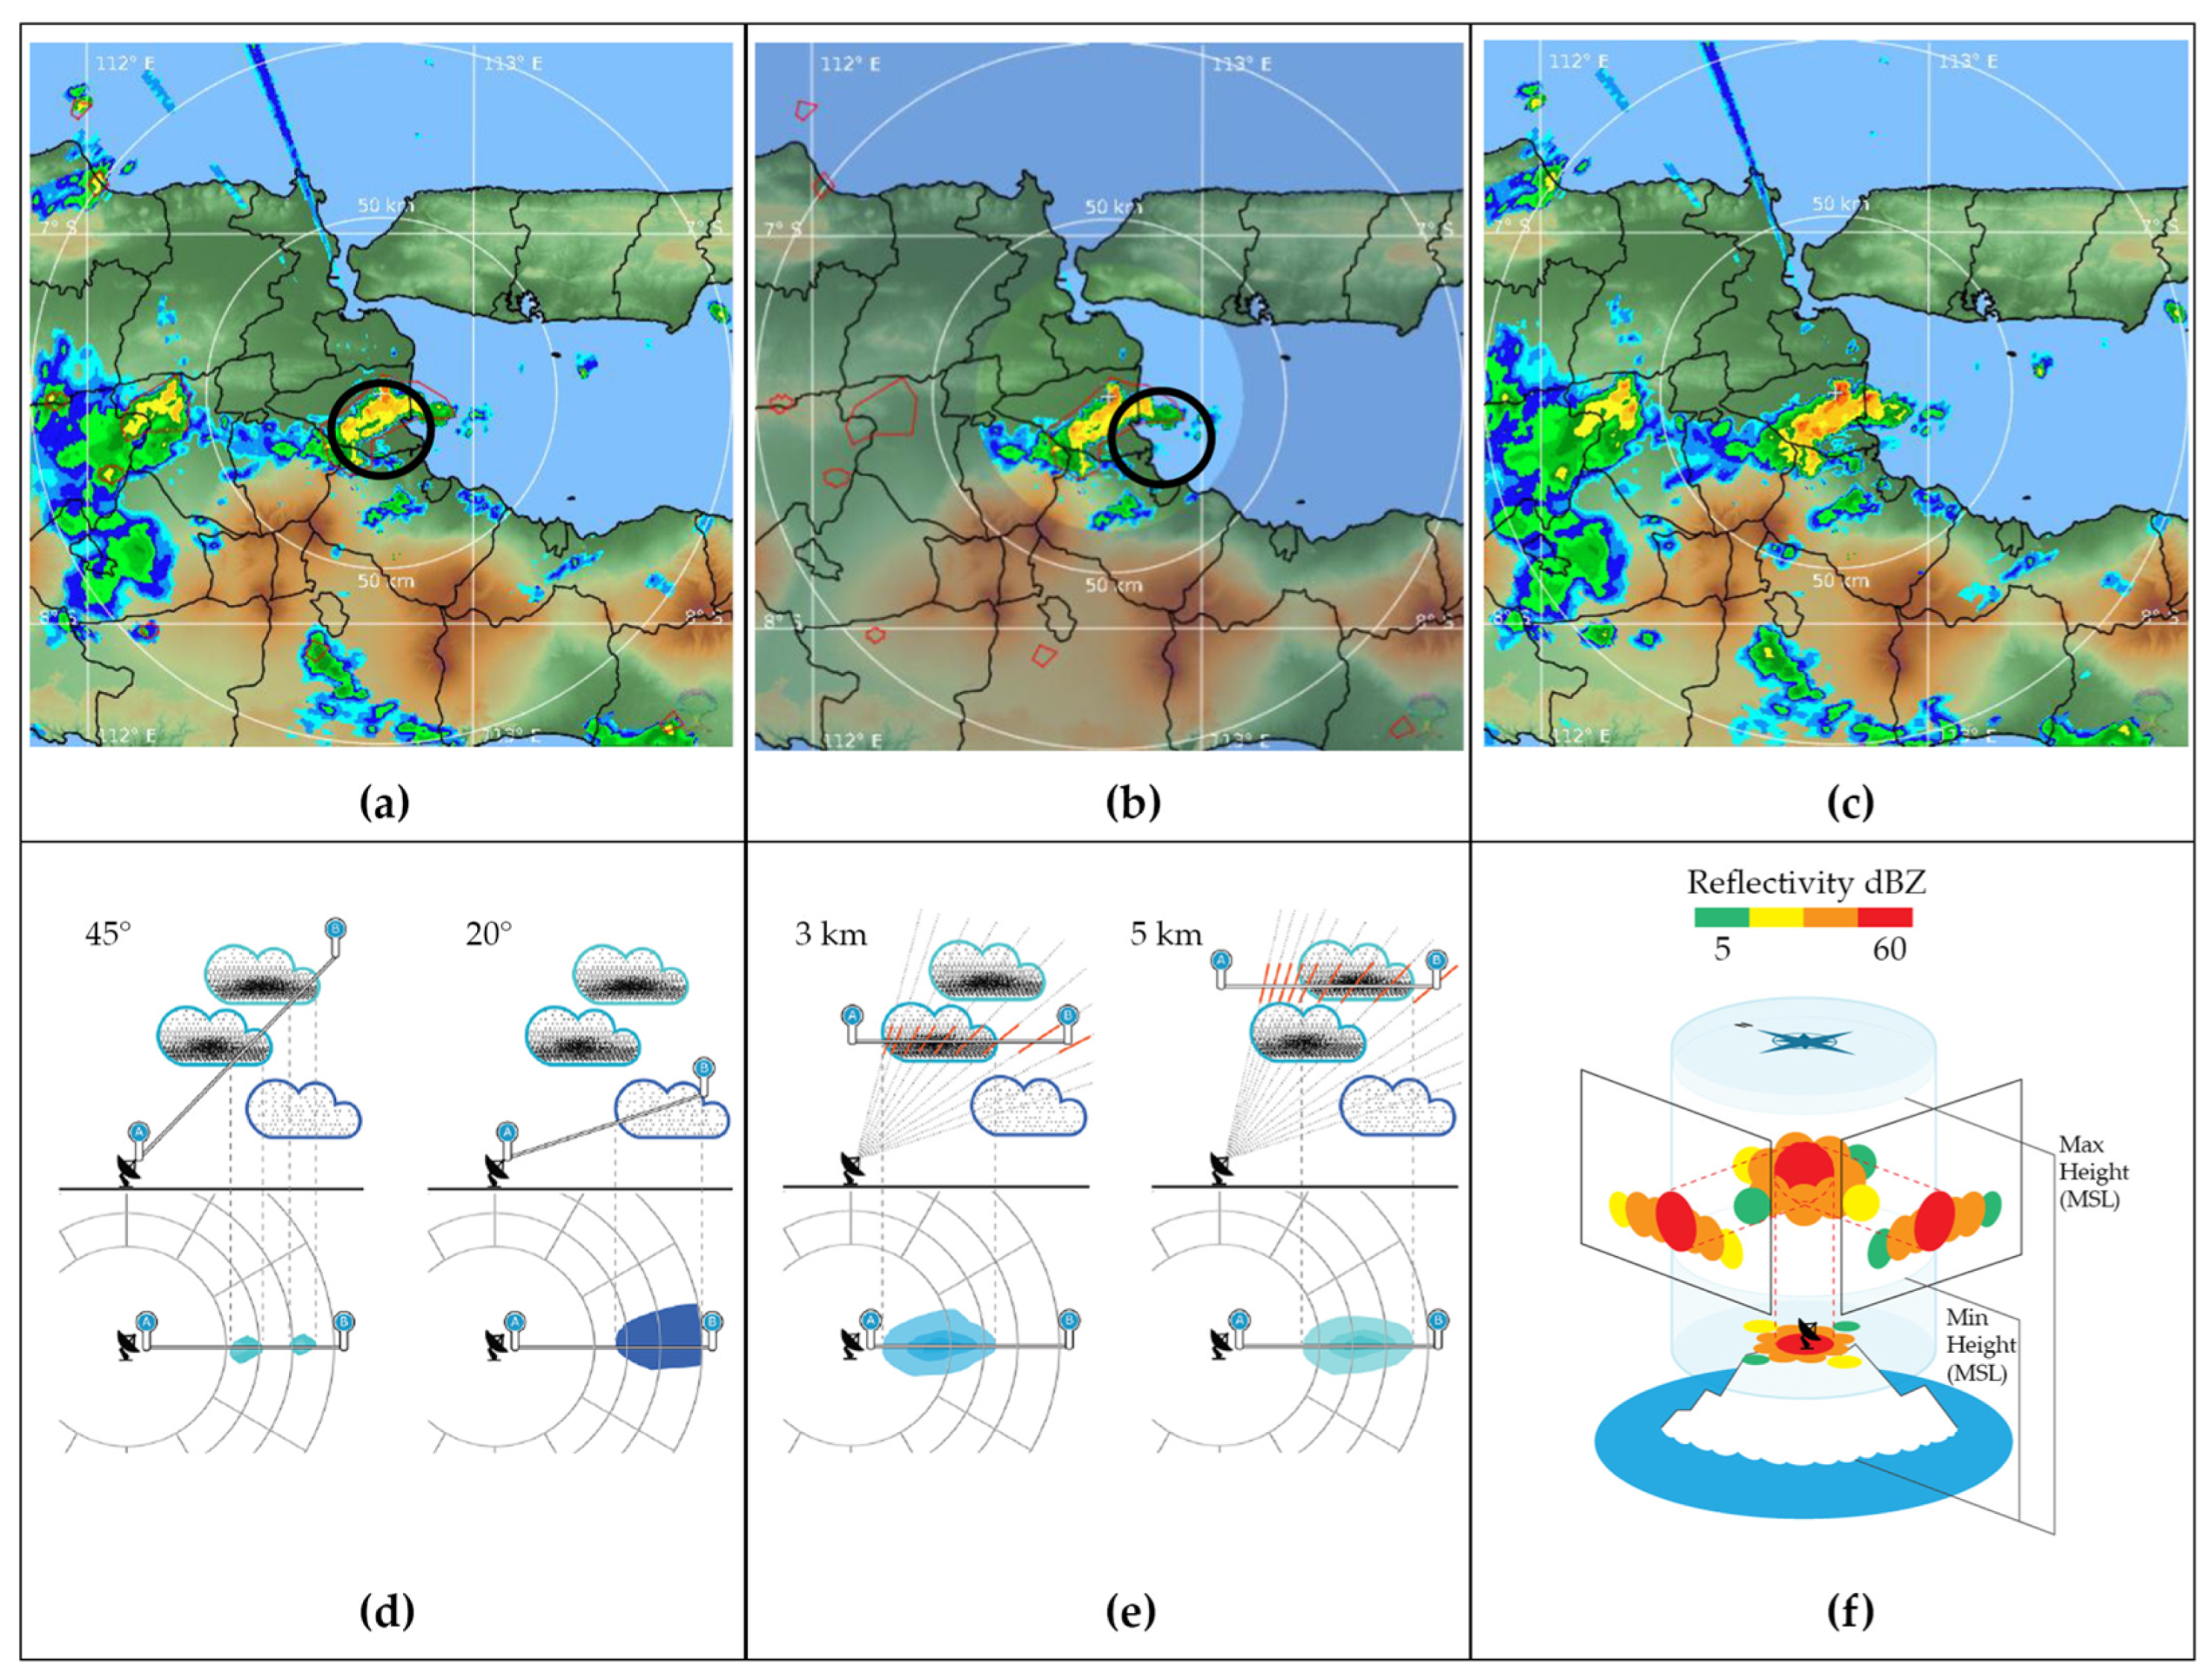
2.2.2. Weather Radar Product
- Plan Position Indicator (PPI)
- Constant Altitude PPI
- Column Maximum

| Weather Radar Product | Advantages | Disadvantages |
|---|---|---|
| PPI | Easy to interpret and used for fast analysis [65], suitable for regions in Indonesia with local rain patterns, such as islands with quick and dynamic rain cycles. | Limited to one elevation angle. |
| CAPPI | It is more accurate for estimating rainfall at a certain height [66]. It is helpful for several users in Indonesia, such as those in the aviation sector. | Requires more time for data processing. |
| CMAX | It provides information on maximum rainfall intensity [66], which is very useful for detecting extreme rainfall, which often occurs in Indonesia. | Potentially overestimates. |
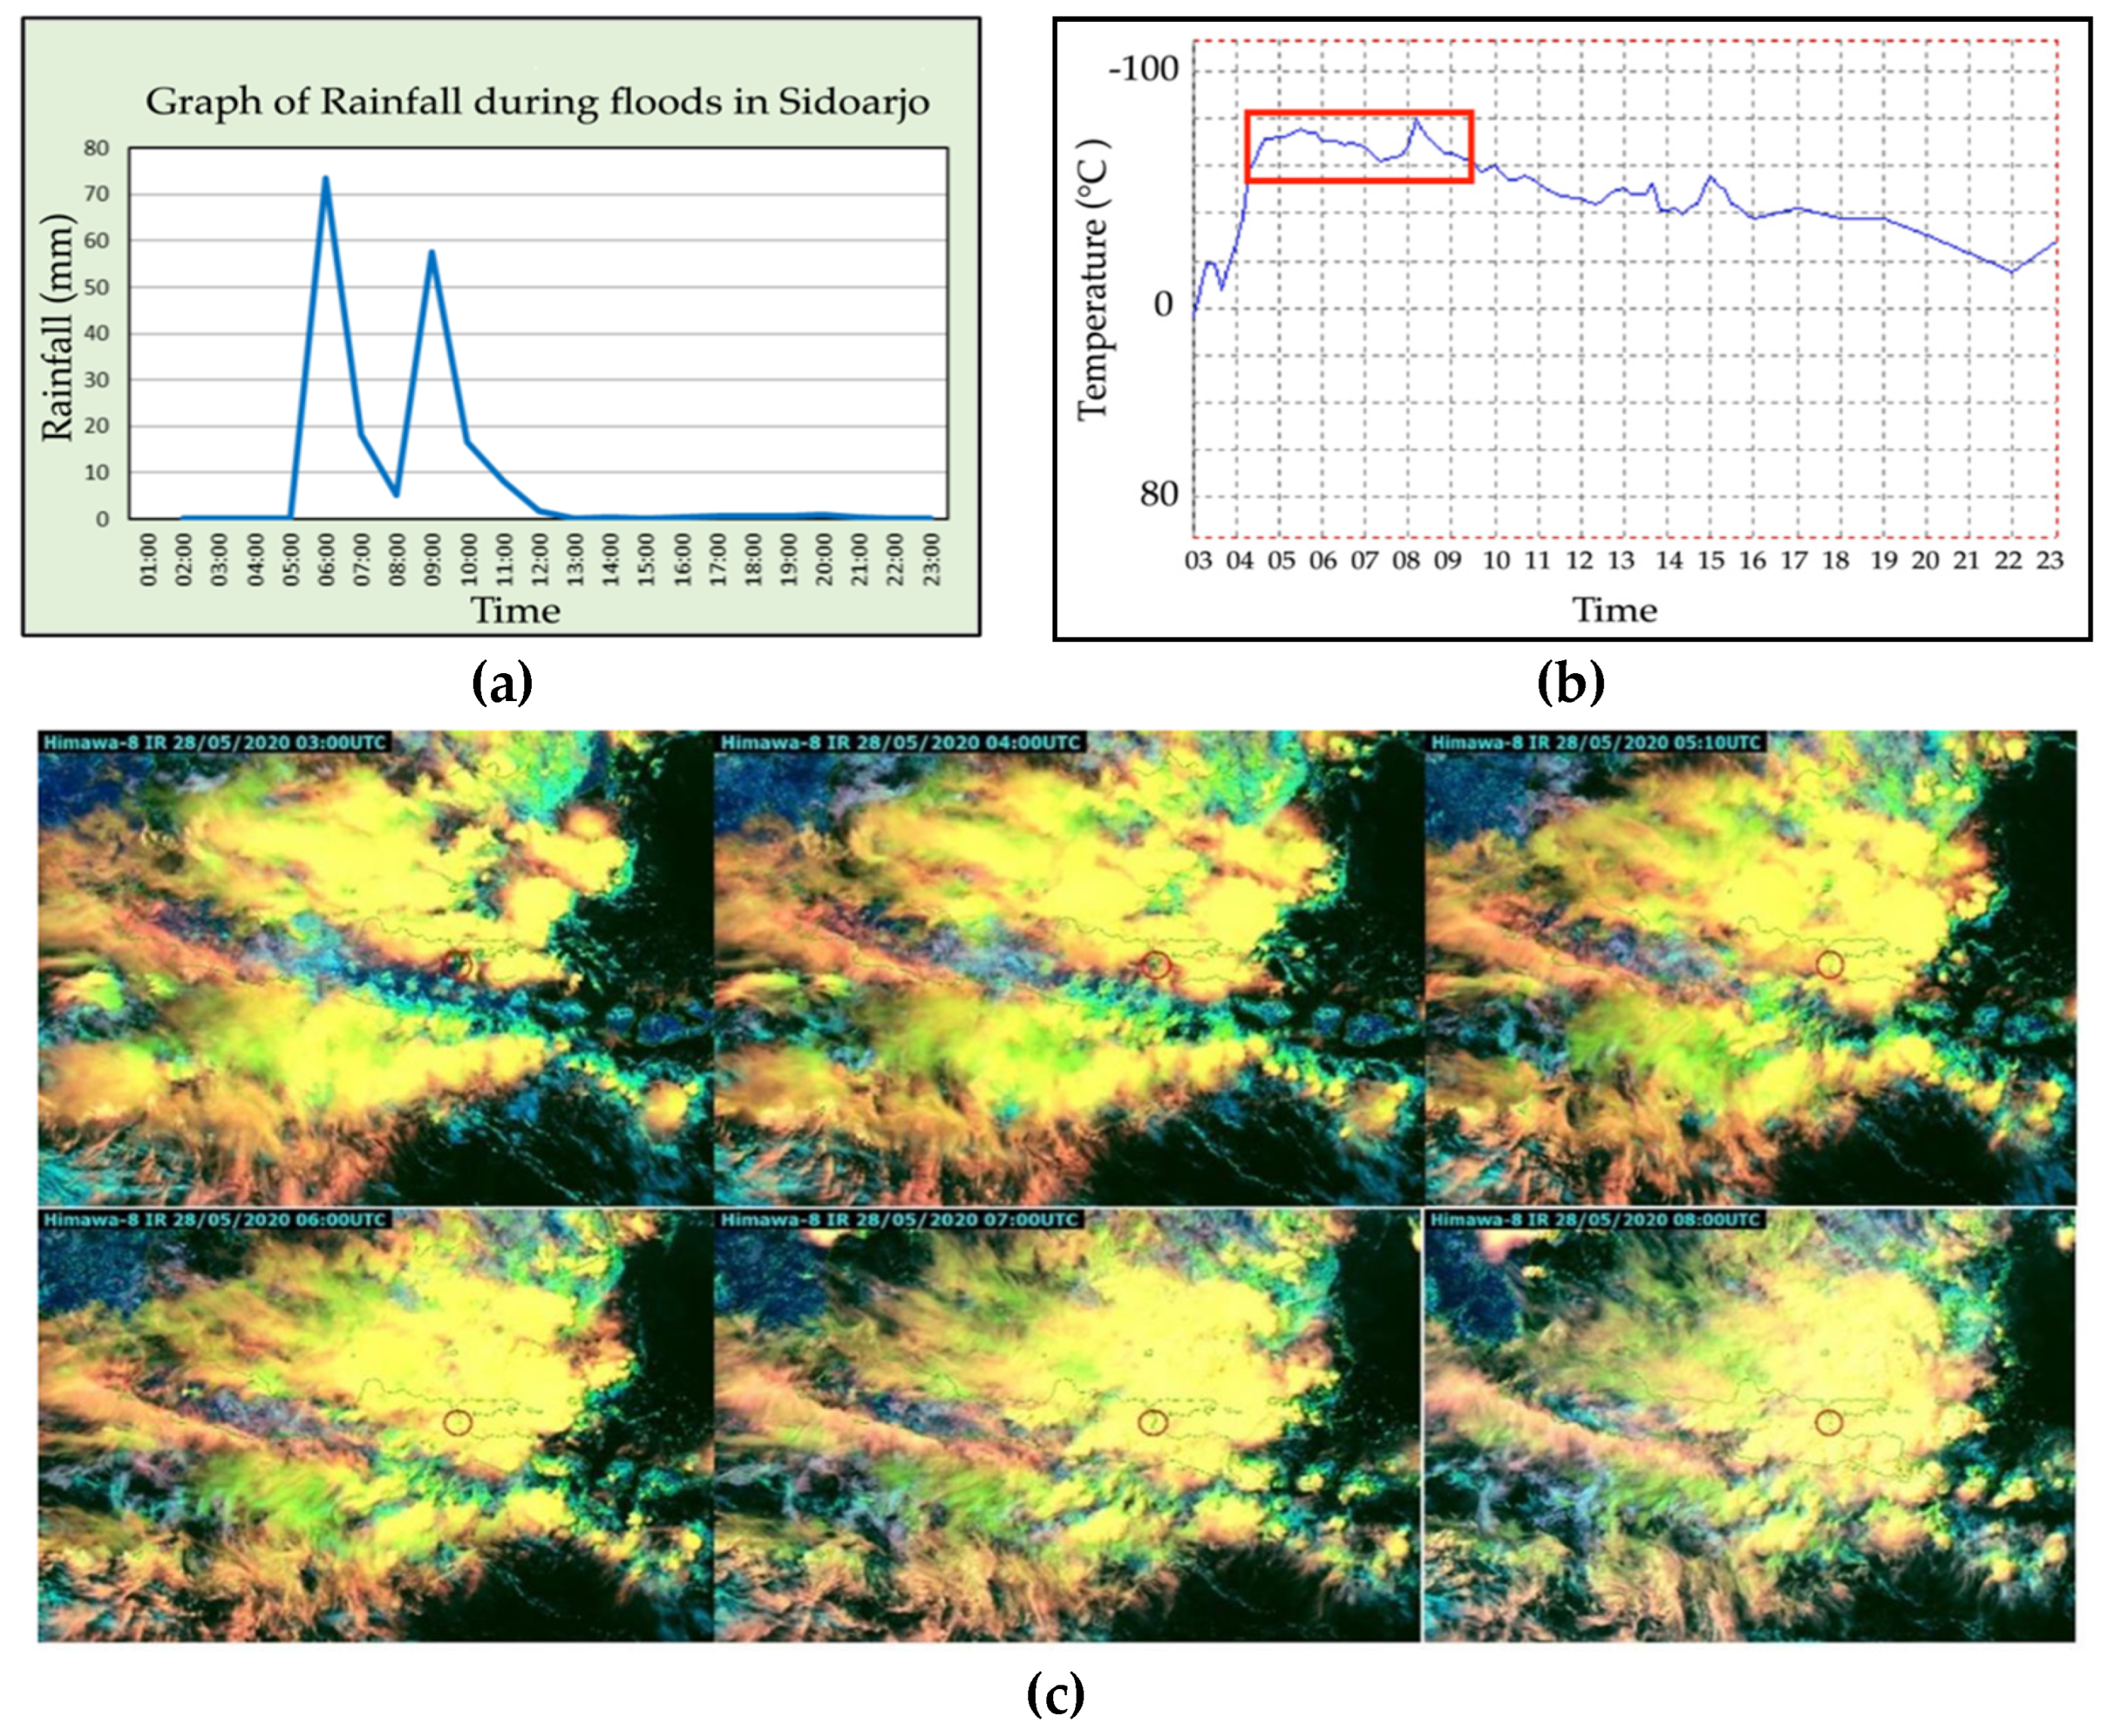
2.3. Weather Satellite
3. Estimation Methods and Techniques
3.1. Statistical Application
3.2. Machine Learning Approaches
4. Discussion
5. Conclusions
Author Contributions
Funding
Data Availability Statement
Acknowledgments
Conflicts of Interest
References
- Nystuen, J.A. Relative Performance of Automatic Rain Gauges under Different Rainfall Conditions. J. Atmos. Ocean. Technol. 1999, 16, 1025–1043. [Google Scholar] [CrossRef]
- Ying, L.K. Rainfall Characteristics and Its Effect on Road Infrastructure Health. Int. J. Integr. Eng. 2019, 11, 234–246. [Google Scholar]
- Mohamed, G.A.I.; Althobiani, F.W. Modern Technology Applications and Rainfall Flooding Disasters Prevention. Int. J. Comput. Technol. 2018, 17, 7350–7354. [Google Scholar] [CrossRef]
- Frisvold, G.B.; Murugesan, A. Use of Weather Information for Agricultural Decision Making. Weather Clim. Soc. 2013, 5, 55–69. [Google Scholar] [CrossRef]
- Torres, M.; Howitt, R.; Rodrigues, L. Analyzing Rainfall Effects on Agricultural Income: Why Timing Matters. EconomiA 2019, 20, 1–14. [Google Scholar] [CrossRef]
- Cao, Y.; Wu, Z.; Xu, Z. Effects of Rainfall on Aircraft Aerodynamics. Prog. Aerosp. Sci. 2014, 71, 85–127. [Google Scholar] [CrossRef]
- Perera, L.P.; Soares, C.G. Weather Routing and Safe Ship Handling in the Future of Shipping. Ocean Eng. 2017, 130, 684–695. [Google Scholar] [CrossRef]
- Sangkharat, K.; Thornes, J.E.; Wachiradilok, P.; Pope, F.D. Determination of the Impact of Rainfall on Road Accidents in Thailand. Heliyon 2021, 7, e06061. [Google Scholar] [CrossRef] [PubMed]
- Zhou, X.; Cheng, L.; Li, M. Assessing and Mapping Maritime Transportation Risk Based on Spatial Fuzzy Multi-Criteria Decision Making: A Case Study in the South China Sea. Ocean Eng. 2020, 208, 107403. [Google Scholar] [CrossRef]
- Adegbehin, A.B.; Iguisi, E.O.; Yusuf, Y.O.; Zubairu, I.; Anumonye, E.N. Effect of Weather Parameters on Hydroelectric Power Generation in Kainji Dam Niger State, Nigeria. In Proceedings of the Annual Conference of the Association of Nigerian Geographers (UNILAG ANG-2016), Lagos, Nigeria, 10–15 April 2016. [Google Scholar]
- Mineo, C.; Ridolfi, E.; Moccia, B.; Russo, F.; Napolitano, F. Assessment of Rainfall Kinetic-Energy–Intensity Relationships. Water 2019, 11, 1994. [Google Scholar] [CrossRef]
- Kidd, C.; Huffman, G. Global Precipitation Measurement. Meteorol. Appl. 2011, 18, 334–353. [Google Scholar] [CrossRef]
- Pickering, B.S.; Iii, R.R.N.; Jeffery, J.; Dufton, D.; Lukach, M. Evaluation of Multiple Precipitation Sensor Designs for Precipitation Rate and Depth, Drop Size and Velocity Distribution, and Precipitation Type. J. Hydrometeorol. 2021, 22, 703–720. [Google Scholar] [CrossRef]
- Sun, Q.; Miao, C.; Duan, Q.; Ashouri, H.; Sorooshian, S.; Hsu, K.L. A Review of Global Precipitation Data Sets: Data Sources, Estimation, and Intercomparisons. Rev. Geophys. 2018, 56, 79–107. [Google Scholar] [CrossRef]
- Nazaripour, H.; Mansouri Daneshvar, M.R. Rain Gauge Network Evaluation and Optimal Design Using Spatial Correlation Approach in Arid and Semi-Arid Regions of Iran. Theor. Appl. Climatol. 2016, 129, 1255–1261. [Google Scholar] [CrossRef]
- Gyasi-Agyei, Y. Identification of the Optimum Rain Gauge Network Density for Hydrological Modelling Based on Radar Rainfall Analysis. Water 2020, 12, 1906. [Google Scholar] [CrossRef]
- Jia, Y.; Li, Z.; Xu, C.; Jin, S.; Deng, H. A Comparison of Precipitation Measurements with A PWS100 Laser Sensor and A Geonor T-200B Precipitation Gauge at A Nival Glacial Zone in Eastern Tianshan, Central Asia. Atmosphere 2020, 11, 1079. [Google Scholar] [CrossRef]
- Leonarduzzi, E.; Molnar, P. Data Limitations and Potential of Hourly and Daily Rainfall Thresholds for Shallow Landslides. Nat. Hazards Earth Syst. Sci. 2020, 2020, 1–25. [Google Scholar] [CrossRef]
- Villarini, G.; Mandapaka, P.V.; Krajewski, W.F.; Moore, R.J. Rainfall and Sampling Uncertainties: A Rain Gauge Perspective. J. Geophys. Res. Atmos. 2008, 113, 11102. [Google Scholar] [CrossRef]
- Wu, H.; Chen, Y.; Chen, X.; Liu, M.; Gao, L.; Deng, H. A New Approach for Optimizing Rain Gauge Networks: A Case Study in the Jinjiang Basin. Water 2020, 12, 2252. [Google Scholar] [CrossRef]
- Franch, G.; Maggio, V.; Coviello, L.; Pendesini, M.; Jurman, G.; Furlanello, C. TAASRAD19, a high-resolution weather radar reflectivity dataset for precipitation nowcasting. Sci. Data 2020, 7, 234. [Google Scholar] [CrossRef] [PubMed]
- Ramli, S.; Abu Bakar, S.H.; Tahir, W. Radar hydrology: New Z/R Relationships for Klang River Basin, Malaysia Based On Rainfall Classification. In Proceedings of the 2011 IEEE Colloquium on Humanities, Science and Engineering, CHUSER 2011, Penang, Malaysia, 5–6 December 2011; pp. 537–541. [Google Scholar] [CrossRef]
- Yeo, J.X.; Lee, Y.H.; Ong, J.T. Radar Measured Rain Attenuation with Proposed Z–R Relationship at A Tropical Location. AEU—Int. J. Electron. Commun. 2015, 69, 458–461. [Google Scholar] [CrossRef]
- Anjaneyulu, A.; Moharana, S.; Ray, K.; Chembolu, V.; Dutta, S. Relation Between Weather Radar Reflectivity and Rainfall Rate: A case Study in North Indian Regions. In Proceedings of the National Conference on Emerging Technology Trends in Agricultural Engineering, Nirjuli, Indian, 7–9 November 2014. [Google Scholar]
- Dutta, D.; Sharma, S.; Kannan, B.A.M.; Venketswarlu, S.; Gairola, R.M.; Rao, T.N.; Viswanathan, G. Sensitivity of ZR Relations and Spatial Variability of Error in A Doppler Weather Radar Measured Rain Intensity. Indian J. Radio Space Phys. 2012, 41, 448–460. [Google Scholar]
- Sobli, N.H.M.; Ismail, A.F.; Md Isa, F.N.; Mansor, H. Assessment of Radar Reflectivity-Rainfall Rate, Z-R Relationships for a Convective Event in Malaysia. Int. J. Electr. Energy 2013, 1, 239–243. [Google Scholar] [CrossRef]
- Wu, S.J.; Lien, H.C.; Hsu, C.T.; Chang, C.H.; Shen, J.C. Modeling Probabilistic Radar Rainfall Estimation at Ungauged Locations Based on Spatiotemporal Errors Which Correspond to Gauged Data. Hydrol. Res. 2013, 46, 39–59. [Google Scholar] [CrossRef]
- Piccolo, F.; Chirico, G.B. Sampling Errors in Rainfall Measurements by Weather Radar. Adv. Geosci. 2005, 2, 151–155. [Google Scholar] [CrossRef]
- Ochou, A.D.; Zahiri, E.-P.; Bamba, B.; Koffi, M. Understanding the Variability of Z-R Relationships Caused by Natural Variations in Raindrop Size Distributions (DSD): Implication of Drop Size and Number. Atmos. Clim. Sci. 2011, 1, 147–164. [Google Scholar] [CrossRef]
- Nikahd, A.; Hashim, M.; Nazemosadat, M.J. A Review of Uncertainty Sources on Weather Ground-Based Radar for Rainfall Estimation. Appl. Mech. Mater. 2016, 818, 254–271. [Google Scholar] [CrossRef]
- Van De Beek, C.Z.; Leijnse, H.; Hazenberg, P.; Uijlenhoet, R. Close-range Radar Rainfall Estimation and Error Analysis. Atmos. Meas. Tech. 2016, 9, 3837–3850. [Google Scholar] [CrossRef]
- Sahoo, S.; Rout, S.; Khare, N.; Patra, S.; Nayak, S. Satellite Meteorology—A review. Van Sangyan 2017, 4, 19–23. [Google Scholar]
- Chua, Z.W.; Kuleshov, Y.; Watkins, A. Evaluation of Satellite Precipitation Estimates Over Australia. Remote Sens. 2020, 12, 678. [Google Scholar] [CrossRef]
- Permana, D.S.; Hutapea, T.D.; Praja, A.S.; A I Paski, J.; Makmur, E.E.S.; Haryoko, U.; Umam, I.H.; Saepudin, M.; Adriyanto, R. The Indonesia In-House Radar Integration System (InaRAISE) of Indonesian Agency for Meteorology Climatology and Geophysics (BMKG): Development, Constraint, and Progress. IOP Conf. Ser. Earth Environ. Sci. 2019, 303, 012051. [Google Scholar] [CrossRef]
- Prakasa, A.; Utami, F.D. Sistem Informasi Radar Cuaca Terintegrasi BMKG. J. Telecommun. Electron. Control Eng. (JTECE) 2019, 1, 78–87. [Google Scholar] [CrossRef]
- Maier, M.W.; Gallagher, F.W.; Germain, K.S.; Anthes, R.; Zuffada, C.; Menzies, R.; Piepmeier, J.; Di Pietro, D.; Coakley, M.M.; Adams, E. Architecting The Future of Weather Satellites. Bull. Am. Meteorol. Soc. 2021, 102, E589–E610. [Google Scholar] [CrossRef]
- Subramanya, K. Engineering Hydrology; Tata McGraw-Hill: New York, NY, USA, 2008. [Google Scholar]
- Maftukhah, T.; Wijonarko, S.; Rustandi, D. Comparison and correlation among measurement results of observatory, hellman, and tipping bucket sensors. Instrumentasi 2016, 40, 7. [Google Scholar] [CrossRef]
- Strangeways, I. Precipitation: Theory, Measurement and Distribution; Cambridge University Press (CUP): Cambridge, UK, 2006; pp. 1–290. ISBN 9780521851176. [Google Scholar] [CrossRef]
- Muñoz, P.; Célleri, R.; Feyen, J. Effect of the Resolution of Tipping-Bucket Rain Gauge and Calculation Method on Rainfall Intensities in an Andean Mountain Gradient. Water 2016, 8, 534. [Google Scholar] [CrossRef]
- Segovia-Cardozo, D.A.; Bernal-Basurco, C.; Rodríguez-Sinobas, L. Tipping Bucket Rain Gauges in Hydrological Research: Summary on Measurement Uncertainties, Calibration, and Error Reduction Strategies. Sensors 2023, 23, 5385. [Google Scholar] [CrossRef] [PubMed]
- Nitu, R.; Wong, K. CIMO Survey on National Summaries of Methods and Instruments for Solid Precipitation Measurement at Automatic Weather Stations; WMO: Geneva, Switzerland, 2010; Volume 425. [Google Scholar]
- Ro, Y.; Chang, K.H.; Hwang, H.; Kim, M.; Cha, J.W.; Lee, C. Comparative study of rainfall measurement by optical disdrometer, tipping-bucket rain gauge, and weighing precipitation gauge. Nat. Hazards 2024, 120, 2829–2845. [Google Scholar] [CrossRef]
- Liu, X.C.; Gao, T.C.; Liu, L. A Comparison of Rainfall Measurements from Multiple Instruments. Atmos. Meas. Tech. 2013, 6, 1585–1595. [Google Scholar] [CrossRef]
- Sokol, Z.; Szturc, J.; Orellana-Alvear, J.; Popová, J.; Jurczyk, A.; Célleri, R. The Role of Weather Radar in Rainfall Estimation and Its Application in Meteorological and Hydrological Modelling—A Review. Remote Sens. 2021, 13, 351. [Google Scholar] [CrossRef]
- Rahayu, W.I.; Prianto, C.; Novia, E.A. Perbandingan Algoritma K-Means dan Naive Bayes untuk Memprediksi Prioritas Pembayaran Tagihan Rumah Sakit Berdasarkan Tingkat Kepentingan Pada PT. Pertamina (Persero). J. Tek. Inform. 2021, 13, 1–8. [Google Scholar]
- Prasetyo, B.; Pusparini, N.; Fitria, W. Weather Radar Application for Identification of Extreme Weather Conditions Fluctuation (Case Study: Flood in Medan City on October 5th 2018). J. Sains Teknol. Modif. Cuaca 2019, 20, 13–21. [Google Scholar] [CrossRef]
- Zhu, B.; Pu, Z.; Putra, A.W.; Gao, Z. Assimilating c-band radar data for high-resolution simulations of precipitation: Case studies over western sumatra. Remote Sens. 2022, 14, 42. [Google Scholar] [CrossRef]
- Anugrah, J.; Paski, I.; Permana, D.S. Using the c-band Doppler weather radar data to reconstruct extreme rainfall event on 11th march 2018 in Bangka island, Indonesia. In MATEC Web of Conferences; EDP Sciences: Les Ulis, France, 2018; pp. 1–6. [Google Scholar] [CrossRef]
- Hambali, R.; Legono, D.; Jayadi, R. Correcting Radar Rainfall Estimates Based on Ground Elevation Function. J. Civ. Eng. Forum 2019, 5, 301–310. [Google Scholar] [CrossRef]
- Daliakopoulos, I.N.; Tsanis, I.K. A Weather Radar Data Processing Module for Storm Analysis. J. Hydroinform. 2012, 14, 332–344. [Google Scholar] [CrossRef]
- Efendi, U.; Nadiansyah, R.; Afriza, P.R.; Nugraheni, I.R.; Ali, A. Uji Akurasi Estimasi Curah Hujan Produk Radar CUACA C-BAND di Wilayah Pontianak. In Proceedings of the Seminar Nasional Geografi III, Yogyakarta, Indonesia, 2 November 2019; pp. 776–785. [Google Scholar]
- Anagnostou, E.N.; Krajewski, W.F.; Smith, J. Uncertainty Quantification of Mean-Areal Radar-Rainfall Estimates. J. Atmos. Ocean. Technol. 1997, 16, 206–215. [Google Scholar] [CrossRef]
- Da Silveira, R.B.; Holt, A.R. An Automatic Identification of Clutter and Anomalous Propagation in Polarization-Diversity Weather Radar Data Using Neural Networks. IEEE Trans. Geosci. Remote Sens. 2001, 39, 1777–1788. [Google Scholar] [CrossRef]
- Tondang, Y.M.; Situmorang, M.; Ikhsan, T.; Darmawan, Y. Accuracy of Weather Radar Products for Rainfall Estimation in North Sumatra Region. Prisma Sains Jurnal Pengkajian Ilmu dan Pembelajaran Matematika dan IPA IKIP Mataram 2023, 11, 351–357. [Google Scholar] [CrossRef]
- Uijlenhoet, R.; Van Der Wielen, S.H.; Berne, A. Uncertainties in rainfall retrievals from ground-based weather radar: Overview, case study, and simulation experiment. Hydrol. Earth Syst. Sci. Discuss. 2006, 3, 2385–2436. [Google Scholar]
- Yoon, S.; Jeong, C.; Lee, T. Flood Flow Simulation Using CMAX Radar Rainfall Estimates in Orographic Basins. Meteorol. Appl. 2014, 21, 596–604. [Google Scholar] [CrossRef]
- Satriyabawa, I.K.M.; Pratama, W.N. Analisis Kejadian Puting Beliung di Stasiun Meteorologi Juanda Surabaya Menggunakan Citra Radar Cuaca dan Model WRF-ARW (Studi Kasus Tanggal 4 Februari 2016). In Prosiding SNSA; Departemen Statistika Fmipa Universitas Padjadjaran: Bandung, Indonesia, 2016; pp. 89–97. [Google Scholar]
- On-Demand Constant Altitude Plan Position Indicator (CAPPI). Available online: https://iris.vaisala.com/doc/en_US/cappi_height_value.html (accessed on 3 May 2024).
- On-Demand Plan Position Indicator (PPI). Available online: https://iris.vaisala.com/doc/en_US/ppi_elevation_angle.html (accessed on 3 May 2024).
- Montopoli, M.; Roberto, N.; Adirosi, E.; Gorgucci, E.; Baldini, L. Investigation of weather radar quantitative precipitation estimation methodologies in complex orography. Atmosphere 2017, 8, 34. [Google Scholar] [CrossRef]
- Sebastianelli, S.; Russo, F.; Napolitano, F.; Baldini, L. On precipitation measurements collected by a weather radar and a rain gauge network. Nat. Hazards Earth Syst. Sci. 2013, 13, 605–623. [Google Scholar] [CrossRef]
- Auipong, N.; Trivej, P. Study of Z-R relationship among different topographies in Northern Thailand. J. Phys. Conf. Ser. 2018, 1144, 012098. [Google Scholar] [CrossRef]
- Kim, H.; Suk, M.; Park, H.; Lee, G.; Ko, J. Dual-polarization radar rainfall estimation in Korea according to raindrop shapes obtained by using a 2-D video disdrometer. Atmos.Meas.Tech 2016, 9, 3863–3878. [Google Scholar] [CrossRef]
- Rinehart, R.E. Radar for Meteorologists; Rinehart Publications: New York, NY, USA, 2010. [Google Scholar]
- Doviak, R.J.; Zrnic, D.S. Doppler Radar and Weather Observations; Elsevier: Amsterdam, The Netherlands, 2006. [Google Scholar]
- Diniyati, E.; Syofyan, D.Q.; Mulya, A. Pemanfaatan Satelit Himawari-8 dengan Metode NWP dan RGB untuk Menganalisis Kondisi Atmosfer Saat Banjir di Sidoarjo Tanggal 28 Mei 2020. JPIG J. Pendidik. Dan Ilmu Geogr. 2021, 6, 1–14. [Google Scholar] [CrossRef]
- Putri, R.J.A. Pemanfaatan Data Satelit Himawari-8 Untuk Analisis Kejadian Hujan Sangat Lebat di Kabupaten Nabire, Papua Tengah (Tanggal 12, 21, dan 22 Maret 2016). In Prosiding SNSA; Departemen Statistika Fmipa Universitas Padjadjaran: Bandung, Indonesia, 2016; pp. 195–204. [Google Scholar]
- Rizkiafama, V.A.; Dzikiro, T.K.; Safril, A. Pemanfaatan Data Satelit Himawari-8 Serta Data Curah Hujan Dan Hari Hujan Bulanan Dalam Analisis Kejadian Banjir Kota Padang, 9 September 2017 dan 26 September 2018. In Prosiding SNFA (Seminar Nasional Fisika Dan Aplikasinya); Universitas Sebelas Maret: Kota Surakarta, Indonesia, 2018; pp. 264–276. [Google Scholar]
- Novitasari, D.C.R.; Supatmanto, B.D.; Rozi, M.F.; Hermansah; Farida, Y.; Setyowati, R.D.N.; Ilham; Junaidi, R.; Arifin, A.Z.; Fatoni, A.R. Rainfall Prediction Based on Himawari-8 IR Enhanced Image Using Backpropagation. J. Phys. Conf. Ser. 2020, 1501, 012011. [Google Scholar] [CrossRef]
- Rinaldy, N.; Saragih, I.J.A.; Wandala Putra, A.; Redha Nugraheni, I.; Wijaya Yonas, B. Identification of Mesoscale Convective Complex (MCC) phenomenon with image of Himawari 8 Satellite and WRF ARW Model on Bangka Island (Case Study: 7–8 February 2016). IOP Conf. Ser. Earth Environ. Sci. 2017, 98, 012002. [Google Scholar] [CrossRef]
- Yudistira, R.D.; Mahubessy, R.; Krisnawan, G.D.; Wisnawa, G.G.; Tirtanegara, I.M.K.; Fadlan, A.; Wardoyo, E. Utilization of surface meteorological data, Himawari-8 satellite data, and radar data to analyze landspout in Sumenep, East Java, Indonesia (case study of 20 November 2017). IOP Conf. Ser. Earth Environ. Sci. 2019, 374, 012038. [Google Scholar] [CrossRef]
- Jumianti, N.; Marzuki, M.; Harjupa, W.; Risyanto; Putranto, M.F. Prediction of Extreme Rainfall of September 9, 2020 in Padang City Based on Clouds Brightness Temperature Difference from Himawari-8 Satellite Data. Springer Proc. Phys. 2022, 275, 771–787. [Google Scholar] [CrossRef]
- Dharma, C.S.; Trilaksono, N.J. Rain Detection using Himawari-8 Imagery; Case Study Singkawang West Kalimantan. IOP Conf. Ser. Earth Environ. Sci. 2021, 750, 012011. [Google Scholar] [CrossRef]
- Nur Auliya, M.; Mulya, A. Hail Identification Based on Weather Factor Analisys and Himawari 8 Satellite Imagery (Case Study of Hail on 2nd March 2021 in Malang Indonesia). Int. J. Remote Sens. Earth Sci. 2021, 18, 217–228. [Google Scholar] [CrossRef]
- Fatkhuroyan; Wati, T. Detection of mesoscale convective complexes using multispectral RGB technique of Himawari-8 (Case Study: Jakarta, 20 February 2017). IOP Conf. Ser. Earth Environ. Sci. 2018, 149, 012032. [Google Scholar] [CrossRef]
- Risyanto; Lasmono, F.; Nugroho, G.A. Identification of rainfall area in Indonesia using infrared channels of Himawari-8 Advance Himawari Imager (AHI). IOP Conf. Ser. Earth Environ. Sci. 2019, 303, 012057. [Google Scholar] [CrossRef]
- Fadhilah, M.J.; Mulya, A. Analisis Dinamika Atmosfer dan Identifikasi Sebaran Awan Konvektif Menggunakan Metode RGB pada Citra Satelit Himawari-8 Terkait Banjir di Kab. Jayawijaya, Wamena (Studi Kasus: Periode 9 Maret 2021). J. Tek. SILITEK 2022, 1, 121–134. [Google Scholar] [CrossRef]
- Asferizal, F. Analisis Perbandingan Kehandalan Data Hujan GSMaP, TRMM, GPM dan PERSIANN Terhadap Data Obsevasi Dalam Rentang Waktu Penelitian 2020–2021. Orig. Artic. J. Infrastruct. Plan. Des. 2022, 2, 33–41. [Google Scholar]
- Saragih, I.J.A.; Putra, A.W.; Nugraheni, I.R.; Rinaldy, N.; Yonas, B.W. Identification of the Sea-Land Breeze Event and Influence to the Convective Activities on the Coast of Deli Serdang. IOP Conf. Ser. Earth Environ. Sci. 2017, 98, 012003. [Google Scholar] [CrossRef]
- Ramadhan, R.; Marzuki, M.; Yusnaini, H.; Muharsyah, R.; Tangang, F.; Vonnisa, M.; Harmadi, H. A Preliminary Assessment of the GSMaP Version 08 Products over Indonesian Maritime Continent against Gauge Data. Remote Sens. 2023, 15, 1115. [Google Scholar] [CrossRef]
- Ramadhan, R.; Muharsyah, R.; Marzuki; Yusnaini, H.; Vonnisa, M.; Hashiguchi, H.; Suryanto, W.; Sholihun. Evaluation of GPM IMERG Products for Extreme Precipitation over Indonesia. J. Phys. Conf. Ser. 2022, 2309, 012008. [Google Scholar] [CrossRef]
- Tulistiawan, P.E.; Karang, I.W.G.A.; Osawa, T. Validation of Satellite Rainfall Product (GPM-IMERG) an Bali and Nusa Tenggara: A Comparison of Normal Seasons, El Nino and La Nina Events. J. Geogr. 2023, 15, 165. [Google Scholar] [CrossRef]
- Talakua, P.; Sediyono, E.; Joko, S.Y. Analisis Rawan Kebakaran Hutan Di Seram Maluku Berbasis Citra Landsat 8 Menggunakan MetodeInverse Distance Weighted. J. Tek. Inform. Sist. Inf. 2018, 4, 511–520. [Google Scholar]
- Binsar Sahat Maruli Tua Simbolon, R.; Soeryamassoeka, S. Jurnal Teknik Sipil Correction Equation of Rainfall Data Maximum a Day on Tropical Rainfall Measuring Mission (TRMM) in Sekayam sub-watershed. J. Tek. Sipil 2023, 23, 2621. [Google Scholar] [CrossRef]
- Sanjaya, S.; Yudianto, D. Application of TRMM in Deriving Intensity-Duration-Frequency Curve in Bandung Area. IOP Conf. Ser. Earth Environ. Sci. 2021, 832, 012046. [Google Scholar] [CrossRef]
- Bieliński, T. A parallax shift effect correction based on cloud height for geostationary satellites and radar observations. Remote Sens. 2020, 12, 365. [Google Scholar] [CrossRef]
- Septian Pandjaitan, B.; Faqih, A.; Alfahmi, F. Overshooting Top of Convective Cloud in Extreme weather Events over Java Region Based on Visual Identification of Himawari 8 Imagery. J. Meteorol. Dan Geofis. 2023, 24, 53–64. [Google Scholar] [CrossRef]
- Morbidelli, R. Rainfall: Modeling, Measurement and Applications; Elsevier: Amsterdam, The Netherlands, 2022. [Google Scholar]
- Ningsih, D.H.U. Metode Thiessen Polygon untuk Ramalan Sebaran Curah Hujan Periode Tertentu pada Wilayah yang Tidak Memiliki Data Curah Hujan. J. Teknol. Inf. Din. 2012, 17, 154–163. [Google Scholar]
- Lotfy, A.; Ali, A.; Hassan, A.; Bakr, M.; Al-Handasah, D.; Elmoustafa, A. Impact of Reducing Rain Gauges Numbers on accuracy of Estimated Mean Areal Precipitation. Curr. Sci. Int. 2018, 7, 70–78. [Google Scholar]
- Cheng, M.; Wang, Y.; Engel, B.; Zhang, W.; Peng, H.; Chen, X.; Xia, H. Performance Assessment of Spatial Interpolation of Precipitation for Hydrological Process Simulation in the Three Gorges Basin. Water 2017, 9, 838. [Google Scholar] [CrossRef]
- Shope, C.L.; Maharjan, G.R. Modeling spatiotemporal precipitation: Effects of density, interpolation, and land use distribution. Adv. Meteorol. 2015, 2015, 174196. [Google Scholar] [CrossRef]
- Arianti, I.; Soemarno; Hasyim, A.W.; Sulistyono, R. Rainfall estimation by using Thiessen polygons, Inverse Distance Weighted, Spline, and Kriging methods: A case study in Pontianak, West Kalimantan. Int. J. Educ. Res. 2018, 6, 1–10. [Google Scholar]
- Giarno, G.; Didiharyono, D.; Fisu, A.A.; Mattingaragau, A. Influence Rainy and Dry Season to Daily Rainfall Interpolation in Complex Terrain of Sulawesi. IOP Conf. Ser. Earth Environ. Sci. 2020, 469, 012003. [Google Scholar] [CrossRef]
- Jaya, I.G.N.M.; Ruchjana, B.N.; Abdullah, A.S.; Andriyana, Y. Comparison of IDW and GP models with application to spatiotemporal interpolation of rainfall in Bali Province, Indonesia. J. Phys. Conf. Ser. 2021, 1722, 012080. [Google Scholar] [CrossRef]
- Yang, W.; Liu, J.; Li, M.; Guo, Z. Isophote-Constrained Autoregressive Model with Adaptive Window Extension for Image Interpolation. IEEE Trans. Circuits Syst. Video Technol. 2018, 28, 1071–1086. [Google Scholar] [CrossRef]
- Tauro, F.; Selker, J.; van de Giesen, N.; Abrate, T.; Uijlenhoet, R.; Porfiri, M.; Manfreda, S.; Caylor, K.; Moramarco, T.; Benveniste, J.; et al. Measurements and Observations in The XXI Century (MOXXI): Innovation and Multi-Disciplinarity to Sense The Hydrological Cycle. Hydrol. Sci. J. 2018, 63, 169–196. [Google Scholar] [CrossRef]
- Pasaribu, J.M.; Haryani, N.S. Perbandingan teknik interpolasi dem srtm dengan metode inverse distance weighted (idw), natural neighbor dan spline (comparison of dem srtm interpolation techniques using inverse distance weighted (idw), natural neighbor and spline method). J. Penginderaan Jauh Pengolah. Data Citra Digit. 2012, 9, 126–139. [Google Scholar]
- Kurniawan, A.; Makmur, E.; Supari. Menentukan Metode Interpolasi Spasial Curah Hujan Bulanan Terbaik Di Jawa Timur (Determining the Best Monthly Rainfall Spatial Interpolation Method in East Java). In Proceedings of the Seminar Nasional Geomatika 2020: Informasi Geospasial Untuk Inovasi Percepatan Pembangunan Berkelanjutan, Bogor, Indonesia, 15–16 October 2020; pp. 263–272. [Google Scholar]
- Paramasivam, C.R.; Venkatramanan, S. An introduction to various spatial analysis techniques. In GIS and Geostatistical Techniques for Groundwater Science; Elsevier: Amsterdam, The Netherlands, 2019; pp. 23–30. [Google Scholar] [CrossRef]
- Rahmawati, N. Space-time variogram for daily rainfall estimates using rain gauges and satellite data in mountainous tropical Island of Bali, Indonesia (Preliminary Study). J. Hydrol. 2020, 590, 125177. [Google Scholar] [CrossRef]
- Kim, T.J.; Kwon, H.H.; Kim, K.B. Calibration of the reflectivity-rainfall rate (Z-R) relationship using long-term radar reflectivity factor over the entire South Korea region in a Bayesian perspective. J. Hydrol. 2021, 593, 125790. [Google Scholar] [CrossRef]
- Ali, A.; Deranadyan, G.; Hairuly Umam, I. An Enhancement to The Quantitative Precipitation Estimation Using Radar-Gauge Merging. Int. J. Remote Sens. Earth Sci. (IJReSES) 2020, 17, 65. [Google Scholar] [CrossRef]
- Marzuki; Hashiguchi, H.; Vonnisa, M.; Harmadi; Muzirwan; Nugroho, S.; Yoseva, M. Z-R Relationships for Weather Radar in Indonesia from the Particle Size and Velocity (Parsivel) Optical Disdrometer. In Proceedings of the Progress in Electromagnetics Research Symposium, Toyama, Japan, 1–4 August 2018; pp. 37–41. [Google Scholar] [CrossRef]
- Hutapea, T.D.F.; Permana, D.S.; Praja, A.S.; Muzayanah, L.F. Modification of Z-R Relationship Constants in Surabaya Radar for Improving The Accuracy of Rainfall Estimates. J. Meteorol. Dan Geofis. 2021, 21, 91–97. [Google Scholar] [CrossRef]
- Rahmawati, N.; Rahayu, K.; Yuliasari, S.T. Performance of daily satellite-based rainfall in groundwater basin of Merapi Aquifer System, Yogyakarta. Theor. Appl. Clim. 2021, 146, 173–190. [Google Scholar] [CrossRef]
- Putri Misnawati, N.L.J.A.; Sagita, N. Bias Correction of Rain Estimation Using GPM-IMERG Over Java Island. Megasains 2022, 13, 26–33. [Google Scholar] [CrossRef]
- Serrat-Capdevila, A.; Merino, M.; Valdes, J.B.; Durcik, M. Evaluation of the performance of three satellite precipitation products over Africa. Remote Sens. 2016, 8, 836. [Google Scholar] [CrossRef]
- Fatkhuroyan, F.; Wati, T.; Sukmana, A.; Kurniawan, R. Validation of Satellite Daily Rainfall Estimates Over Indonesia. Forum Geogr. 2018, 32, 170–180. [Google Scholar] [CrossRef]
- So, D.; Shin, D. Classification of precipitating clouds using satellite infrared observations and its implications for rainfall estimation. Q. J. R. Meteorol. Soc. 2018, 144, 133–144. [Google Scholar] [CrossRef]
- Pejcic, V.; Garfias, P.S.; Mühlbauer, K.; Trömel, S.; Simmer, C. Comparison between precipitation estimates of ground-based weather radar composites and GPM’s DPR rainfall product over Germany. Meteorol. Z. 2020, 29, 451–466. [Google Scholar] [CrossRef]
- Schwaller, M.R.; Robert Morris, K. A ground validation network for the global precipitation measurement mission. J. Atmos. Ocean. Technol. 2011, 28, 301–319. [Google Scholar] [CrossRef]
- Kim, J.H.; Ou, M.L.; Park, J.D.; Morris, K.R.; Schwaller, M.R.; Wolff, D.B. Global precipitation measurement (GPM) ground validation (GV) prototype in the Korean Peninsula. J. Atmos. Ocean. Technol. 2014, 31, 1902–1921. [Google Scholar] [CrossRef]
- Pamuji Waskita, T.; Harmoko Saputro, A.; Sopaheluwakan, A.; Ryan, M. Machine Learning System for Rainfall Estimates from Single Polarization Radar. In Proceedings of the International Conferences on Information System and Technology (CONRIST 2019), Yogyakarta, Indonesia, 5–6 December 2019; pp. 41–48. [Google Scholar] [CrossRef]
- Balas, V.E.; Mastorakis, N.E.; Popescu, M.-C.; Balas, V.E. Multilayer Perceptron and Neural Networks. WSEAS Trans. Circuits Syst. 2009, 8, 579–588. [Google Scholar]
- Kumar Biswas, S.; Siddique, A.; Mahmudul, M.; Mia, A.; Biswas, K.; Urmi, M.C. An Algorithm for Training Multilayer Perceptron (MLP) for Image Reconstruction Using Neural Network without Overfitting. Artic. Int. J. Sci. Technol. Res. 2015, 4, 2. [Google Scholar]
- Kolluri, J.; Kotte, V.K.; Phridviraj, M.S.B.; Razia, S. Reducing Overfitting Problem in Machine Learning Using Novel L1/4 Regularization Method. In Proceedings of the 4th International Conference on Trends in Electronics and Informatics, ICOEI 2020, Tirunelveli, India, 15–17 June 2020; pp. 934–938. [Google Scholar] [CrossRef]
- Osowski, S.; Siwek, K.; Markiewicz, T. MLP and SVM Networks-a Comparative Study. In Proceedings of the 6th Nordic Signal Processing Symposium, Espoo, Finland, 11 June 2004. [Google Scholar]
- Çolakoğlu, N.; Akkaya, B. Comparison of Multi-class Classification Algorithms on Early Diagnosis of Heart Diseases. In Proceedings of the Recent Advance in Data Science and Business Analytics, Istanbul, Turkey, 25–28 September 2019; pp. 162–172. [Google Scholar]
- Putra, M.; Rosid, M.S.; Handoko, D. Rainfall Estimation Using Machine Learning Approaches with Raingauge, Radar, and Satellite Data. In Proceedings of the International Conferernce on Electrical Engineering and Informatics (ICELTICs), Banda Aceh, Indonesia, 27–28 September 2022. [Google Scholar]
- Darmastowo, F.R.; Rosid, M.S.; Handoko, D. Rainfall Estimation in Equatorial Region Using Weather Radar-Based Machine Learning. In Proceedings of the International Seminar on Application for Technology of Information and Communication, Semarang, Indonesia, 16–17 September 2023. [Google Scholar]
- Nareswari, B.N.A.; Putra, M.; Handoko, D. Convective Rainfall Estimation From Radar Measurement using Tree-Based Machine Learning. In Proceedings of the 18th IMT-GT International Conference on Mathematics, Statistics and their Applications, Agra, India, 24–26 March 2023; pp. 34–38. [Google Scholar] [CrossRef]
- Anggraini, N.; Jumarang, M.I. Curah Hujan bulanan di Kota Pontianak Berdasarkan Metode Quadratic-Hill Climbing. PRISMA FISIKA 2014, 2, 15–18. [Google Scholar]
- Modarres, Z.G.; Shabankhah, M.; Kamandi, A. Making AdaBoost Less Prone to Overfitting on Noisy Datasets. In Proceedings of the 6th International Conference on Web Research (ICWR), Tehran, Iran, 22–23 April 2020; pp. 251–259. [Google Scholar]
- Rokach, L.; Maimon, O. Decision Trees. In Data Mining and Knowledge Discovery Handbook; Springer: Berlin/Heidelberg, Germany, 2006; pp. 165–192. [Google Scholar] [CrossRef]
- Leiva, R.G.; Anta, A.F.; Mancuso, V.; Casari, P. A novel hyperparameter-free approach to decision tree construction that avoids overfitting by design. IEEE Access 2019, 7, 99978–99987. [Google Scholar] [CrossRef]
- Breiman, L. Random Forests. Mach. Learn. 2001, 45, 5–32. [Google Scholar] [CrossRef]
- Aziz, N.; Akhir, E.A.P.; Aziz, I.A.; Jaafar, J.; Hasan, M.H.; Abas, A.N.C. A Study on Gradient Boosting Algorithms for Development of AI Monitoring and Prediction Systems. In Proceedings of the International Conference on Computational Intelligence (ICCI), Bandar Seri Iskandar, Malaysia, 8–9 October 2020; pp. 11–16. [Google Scholar]
- Tufail, S.; Riggs, H.; Tariq, M.; Sarwat, A.I. Advancements and Challenges in Machine Learning: A Comprehensive Review of Models, Libraries, Applications, and Algorithms. Electronics 2023, 12, 1789. [Google Scholar] [CrossRef]
- Talekar, B. A Detailed Review on Decision Tree and Random Forest. Biosci. Biotechnol. Res. Commun. 2020, 13, 245–248. [Google Scholar] [CrossRef]
- Friedman, J.H. Greedy Function Approximation: A Gradient Boosting Machine. Ann. Stat. 2001, 29, 1189–1232. [Google Scholar] [CrossRef]
- Hosen, S.; Amin, R. Significant of Gradient Boosting Algorithm in Data Management System. Eng. Int. 2021, 9, 85–100. [Google Scholar] [CrossRef]
- Ma, L.; Zhang, G.; Lu, E. Using the gradient boosting decision tree to improve the delineation of hourly rain areas during the summer from advanced Himawari imager data. J. Hydrometeorol. 2018, 19, 761–776. [Google Scholar] [CrossRef]
- Mienye, I.D.; Sun, Y. A Survey of Ensemble Learning: Concepts, Algorithms, Applications, and Prospects. IEEE Access 2022, 10, 99129–99149. [Google Scholar] [CrossRef]
- Tran, N.T.; Tran, T.T.G.; Nguyen, T.A.; Lam, M.B. A new grid search algorithm based on XGBoost model for load forecasting. Bull. Electr. Eng. Inform. 2023, 12, 1857–1866. [Google Scholar] [CrossRef]
- Fan, M.; Xiao, K.; Sun, L.; Zhang, S.; Xu, Y. Automated Hyperparameter Optimization of Gradient Boosting Decision Tree Approach for Gold Mineral Prospectivity Mapping in the Xiong’ershan Area. Minerals 2022, 12, 1621. [Google Scholar] [CrossRef]
- Chen, T.; Guestrin, C. XGBoost: A Scalable Tree Boosting System. In Proceedings of the KDD’16: 22nd ACM SIGKDD International Conference on Knowledge Discovery and Data Mining, San Francisco, CA, USA, 13–17 August 2016; Association for Computing Machinery: New York, NY, USA, 2016. [Google Scholar] [CrossRef]
- Yasper, A.; Handoko, D.; Putra, M.; Aliwarga, H.K.; Rosid, M.S.R. Hyperparameters Optimization in XGBoost Model for Rainfall Estimation: A Case Study in Pontianak City. J. Penelit. Pendidik. IPA 2023, 9, 7113–7121. [Google Scholar] [CrossRef]
- Nikolopoulos, E.I.; Crema, S.; Marchi, L.; Marra, F.; Guzzetti, F.; Borga, M. Impact of uncertainty in rainfall estimation on the identification of rainfall thresholds for debris flow occurrence. Geomorphology 2014, 221, 286–297. [Google Scholar] [CrossRef]
- Fernando, K.; Wickramasuriya, S.S.; Fernando, W.C.D.K. Investigation of Probable Maximum Precipitation for Disaster Risk Reduction in Sri Lanka. 2016. Available online: https://www.researchgate.net/publication/303910137 (accessed on 31 May 2024).
- Lanza, L.G.; Stagi, L. Certified Accuracy of Rainfall Data as a Standard Requirement in Scientific Investigations. Adv. Geosci. 2008, 16, 43–48. [Google Scholar] [CrossRef]
- Habib, E.; Krajewski, W.F.; Kruger, A. Sampling errors of tipping-bucket rain gauge measurements. J. Hydrol. Eng. 2001, 6, 159–166. [Google Scholar] [CrossRef]
- Wang, J.; Fisher, B.L.; Wolff, D.B. Estimating rain rates from tipping-bucket rain gauge measurements. J. Atmos. Ocean. Technol. 2008, 25, 43–56. [Google Scholar] [CrossRef]
- Hosseini, S.H.; Hashemi, H.; Berndtsson, R.; South, N.; Aspegren, H.; Larsson, R.; Olsson, J.; Persson, A.; Olsson, L. Evaluation of a new X-band weather radar for operational use in south Sweden. Water Sci. Technol. 2020, 81, 1623–1635. [Google Scholar] [CrossRef] [PubMed]
- Nugraha Jonathan, H.; Fahdiran, R. Penentuan lokasi terbaik untuk estimasi curah hujan berdasarkan efek paralaks dan suhu puncak awan menggunakan data satelit himawari-8 (studi kasus di wilayah Indonesia bagian tengah). Pros. Semin. Nas. Fis. E-J. 2024, 12, FA-43. [Google Scholar] [CrossRef]
- Bahtiar, R.; Wijayanto, Y.; Budiman, S.A.; Saputra, T.W. Perbedaan Karakteristik Sebaran Spasial Hujan di Kabupaten Jember Menggunakan Metode Inverse Distance Weighted (IDW) dan Poligon Thiessen. Differences in the Spatial Distribution Characteristics of Rainfall in Jember Regency Using the Inverse Distance Weighted (IDW) and Thiessen Polygon Methods. Berk. Ilm. Pertan. 2022, 5, 1–5. [Google Scholar]
- Hu, Q.; Li, Z.; Wang, L.; Huang, Y.; Wang, Y.; Li, L. Rainfall spatial estimations: A review from spatial interpolation to multi-source data merging. Water 2019, 11, 579. [Google Scholar] [CrossRef]
- Inlaung, K.; Nakapan, S. Study of radar rainfall estimation using geographic information systems over Chiang Mai province. J. Phys. Conf. Ser. 2018, 1144, 012089. [Google Scholar] [CrossRef]
- Ardiyanto, L.; Hanif, A.M.; Alfaridzi, M.; Ariwibowo, S.; Wardoyo, E.; Redha Nugraheni, I. Estimasi Curah Hujan Radar Cuaca dengan Hubungan Z-R Berbeda pada Tipe Awan Hujan Konvektif dan Stratiform di Lampung. Pros. SNFA (Semin. Nas. Fis. Apl.) 2019, 4, 51–60. [Google Scholar] [CrossRef]
- Guarascio, M.; Folino, G.; Chiaravalloti, F.; Gabriele, S.; Procopio, A.; Sabatino, P. A Machine Learning Approach for Rainfall Estimation Integrating Heterogeneous Data Sources. IEEE Trans. Geosci. Remote Sens. 2022, 60, 4200111. [Google Scholar] [CrossRef]
- Hassan, D.; Isaac, G.A.; Taylor, P.A.; Michelson, D. Optimizing Radar-Based Rainfall Estimation Using Machine Learning Models. Remote Sens. 2022, 14, 5188. [Google Scholar] [CrossRef]
- Chandrasekar, V.; Tan, H.; Chen, H. A Machine Learning System for Rainfall Estimation from Spaceborne and Ground Radars. In Proceedings of the 2017 32nd General Assembly and Scientific Symposium of the International Union of Radio Science, URSI GASS 2017, Montreal, QC, Canada, 19–26 August 2017; Institute of Electrical and Electronics Engineers Inc.: Piscataway, NJ, USA, 2017; pp. 1–2. [Google Scholar] [CrossRef]
- You, H.; Wang, J.; Wong, R.K.W.; Schumacher, C.; Saravanan, R.; Jun, M. Prediction of Tropical Pacific Rain Rates with Over-parameterized Neural Networks. Artif. Intell. Earth Syst. 2024, 3. [Google Scholar] [CrossRef]
- Allawi, M.F.; Abdulhameed, U.H.; Adham, A.; Sayl, K.N.; Sulaiman, S.O.; Ramal, M.M.; Sherif, M.; El-Shafie, A. Monthly rainfall forecasting modelling based on advanced machine learning methods: Tropical region as case study. Eng. Appl. Comput. Fluid Mech. 2023, 17, 2243090. [Google Scholar] [CrossRef]
- Xu, R.; Zhang, T. Combining Cloud and Mobile Computing for Machine Learning. arXiv 2024, arXiv:2402.04880. [Google Scholar]
- Grzesik, P.; Mrozek, D. Combining Machine Learning and Edge Computing: Opportunities, Challenges, Platforms, Frameworks, and Use Cases. Electronics 2024, 13, 640. [Google Scholar] [CrossRef]

| Rain Gauge Interpolation Method | Description, Advantages, and Disadvantages | Implementation in Indonesia |
|---|---|---|
| Thiessen polygon | This method divides the area into polygons, each containing one rain gauge, and each point in the polygon is represented by data from the rain gauge. If the rain gauge distribution is tight, this method can provide a fairly good estimate because each polygon covers a specific area. However, this method does not consider topographic variations [92]. Relatively flat areas with a dense rain gauge distribution will be suitable for this method. | Applied in Pontianak City by dividing the area into polygons based on the location of the rain stations. The rainfall classification is only divided into two classes, and this area is classified as having high rainfall [94]. Unfortunately, there is no explicit mention of statistical metrics and validation results. |
| Inverse Distance Weighting | This method gives greater weight to closer points [99]. Even though it produces smoother interpolations, IDW is still susceptible to bias if the rain gauge is uneven, especially in complex mountainous areas, where rainfall variations can be high. This method is more appropriate to use in locations with dense and even rain gauge points. | Successfully applied in East Java Province for interpolation of monthly rainfall with dense points [100], with an RMSE value of 100.435 mm |
| Spline | Using mathematical functions to minimize surface curvature, it forms a spline to estimate areal rainfall. It can produce a continuous interpolation function, but is very dependent on the distribution and density of data points [94], and therefore it is not suitable for application in areas with significant topographic diversity. | Produced smooth and continuous rainfall maps in Pontianak City. However, it is less effective if there is a significant value difference at a very short distance between measurement points [94]. Unfortunately, there is no explicit mention of statistical metrics or validation results. |
| Kriging | Geostatistical interpolation considers the distance and degree of variation between known data points when estimating values in an unknown area [101]. Suitable for areas with uneven distribution of rain gauge stations. | Applied in the Bali Region. With a daily time scale, the results help understand the spatial pattern of rainfall in the study area [102]. The RMSE value varies, mostly below 20 mm·day−1 |
| Discussion Area | Current Conditions | Recommendations and Potential Improvements | |
|---|---|---|---|
| Rainfall Data Source | Rain gauge | The distribution of rain gauge points is unevenly distributed. | Manage the ideal rain gauge distribution; place weather radar according to technical and non-technical characteristics; implement bias correction according to regional conditions. And combine existing data sources in Indonesia. |
| Weather radar | Not all weather radar placements are compatible with instrument and topographic characteristics. | ||
| Weather Satellite | Bias correction has been implemented but needs to be adjusted to the conditions of each region. | ||
| Rainfall Estimation Methods and Techniques | Statistical Application | It has been widely applied but is less adaptive to regional conditions. | Developing the application of machine learning for rainfall estimation in Indonesia |
| Machine Learning Approaches | Its implementation still needs to be more common. | ||
Disclaimer/Publisher’s Note: The statements, opinions and data contained in all publications are solely those of the individual author(s) and contributor(s) and not of MDPI and/or the editor(s). MDPI and/or the editor(s) disclaim responsibility for any injury to people or property resulting from any ideas, methods, instructions or products referred to in the content. |
© 2024 by the authors. Licensee MDPI, Basel, Switzerland. This article is an open access article distributed under the terms and conditions of the Creative Commons Attribution (CC BY) license (https://creativecommons.org/licenses/by/4.0/).
Share and Cite
Putra, M.; Rosid, M.S.; Handoko, D. A Review of Rainfall Estimation in Indonesia: Data Sources, Techniques, and Methods. Signals 2024, 5, 542-561. https://doi.org/10.3390/signals5030030
Putra M, Rosid MS, Handoko D. A Review of Rainfall Estimation in Indonesia: Data Sources, Techniques, and Methods. Signals. 2024; 5(3):542-561. https://doi.org/10.3390/signals5030030
Chicago/Turabian StylePutra, Maulana, Mohammad Syamsu Rosid, and Djati Handoko. 2024. "A Review of Rainfall Estimation in Indonesia: Data Sources, Techniques, and Methods" Signals 5, no. 3: 542-561. https://doi.org/10.3390/signals5030030