
Cataloging and Testing Flood Risk Management Measures to Increase the Resilience of Critical Infrastructure Networks


Abstract
Highlights
- Flood Mitigation Measures need to be collected systematically to utilize the benefits of critical infrastructure network models for flood risk management.
- Enhanced Decision-Making and Coordination: Systematically collecting flood mitigation measures enables more informed decision-making and fosters intersectoral coordination, ensuring effective and context-appropriate flood risk management strategies across various CI sectors.
- Improved Resilience and Resource Optimization: This approach enhances the resilience of CI networks to flooding events and optimizes resource allocation by identifying the most cost-effective and efficient mitigation measures, supporting robust policy development and implementation.
Abstract
1. Introduction
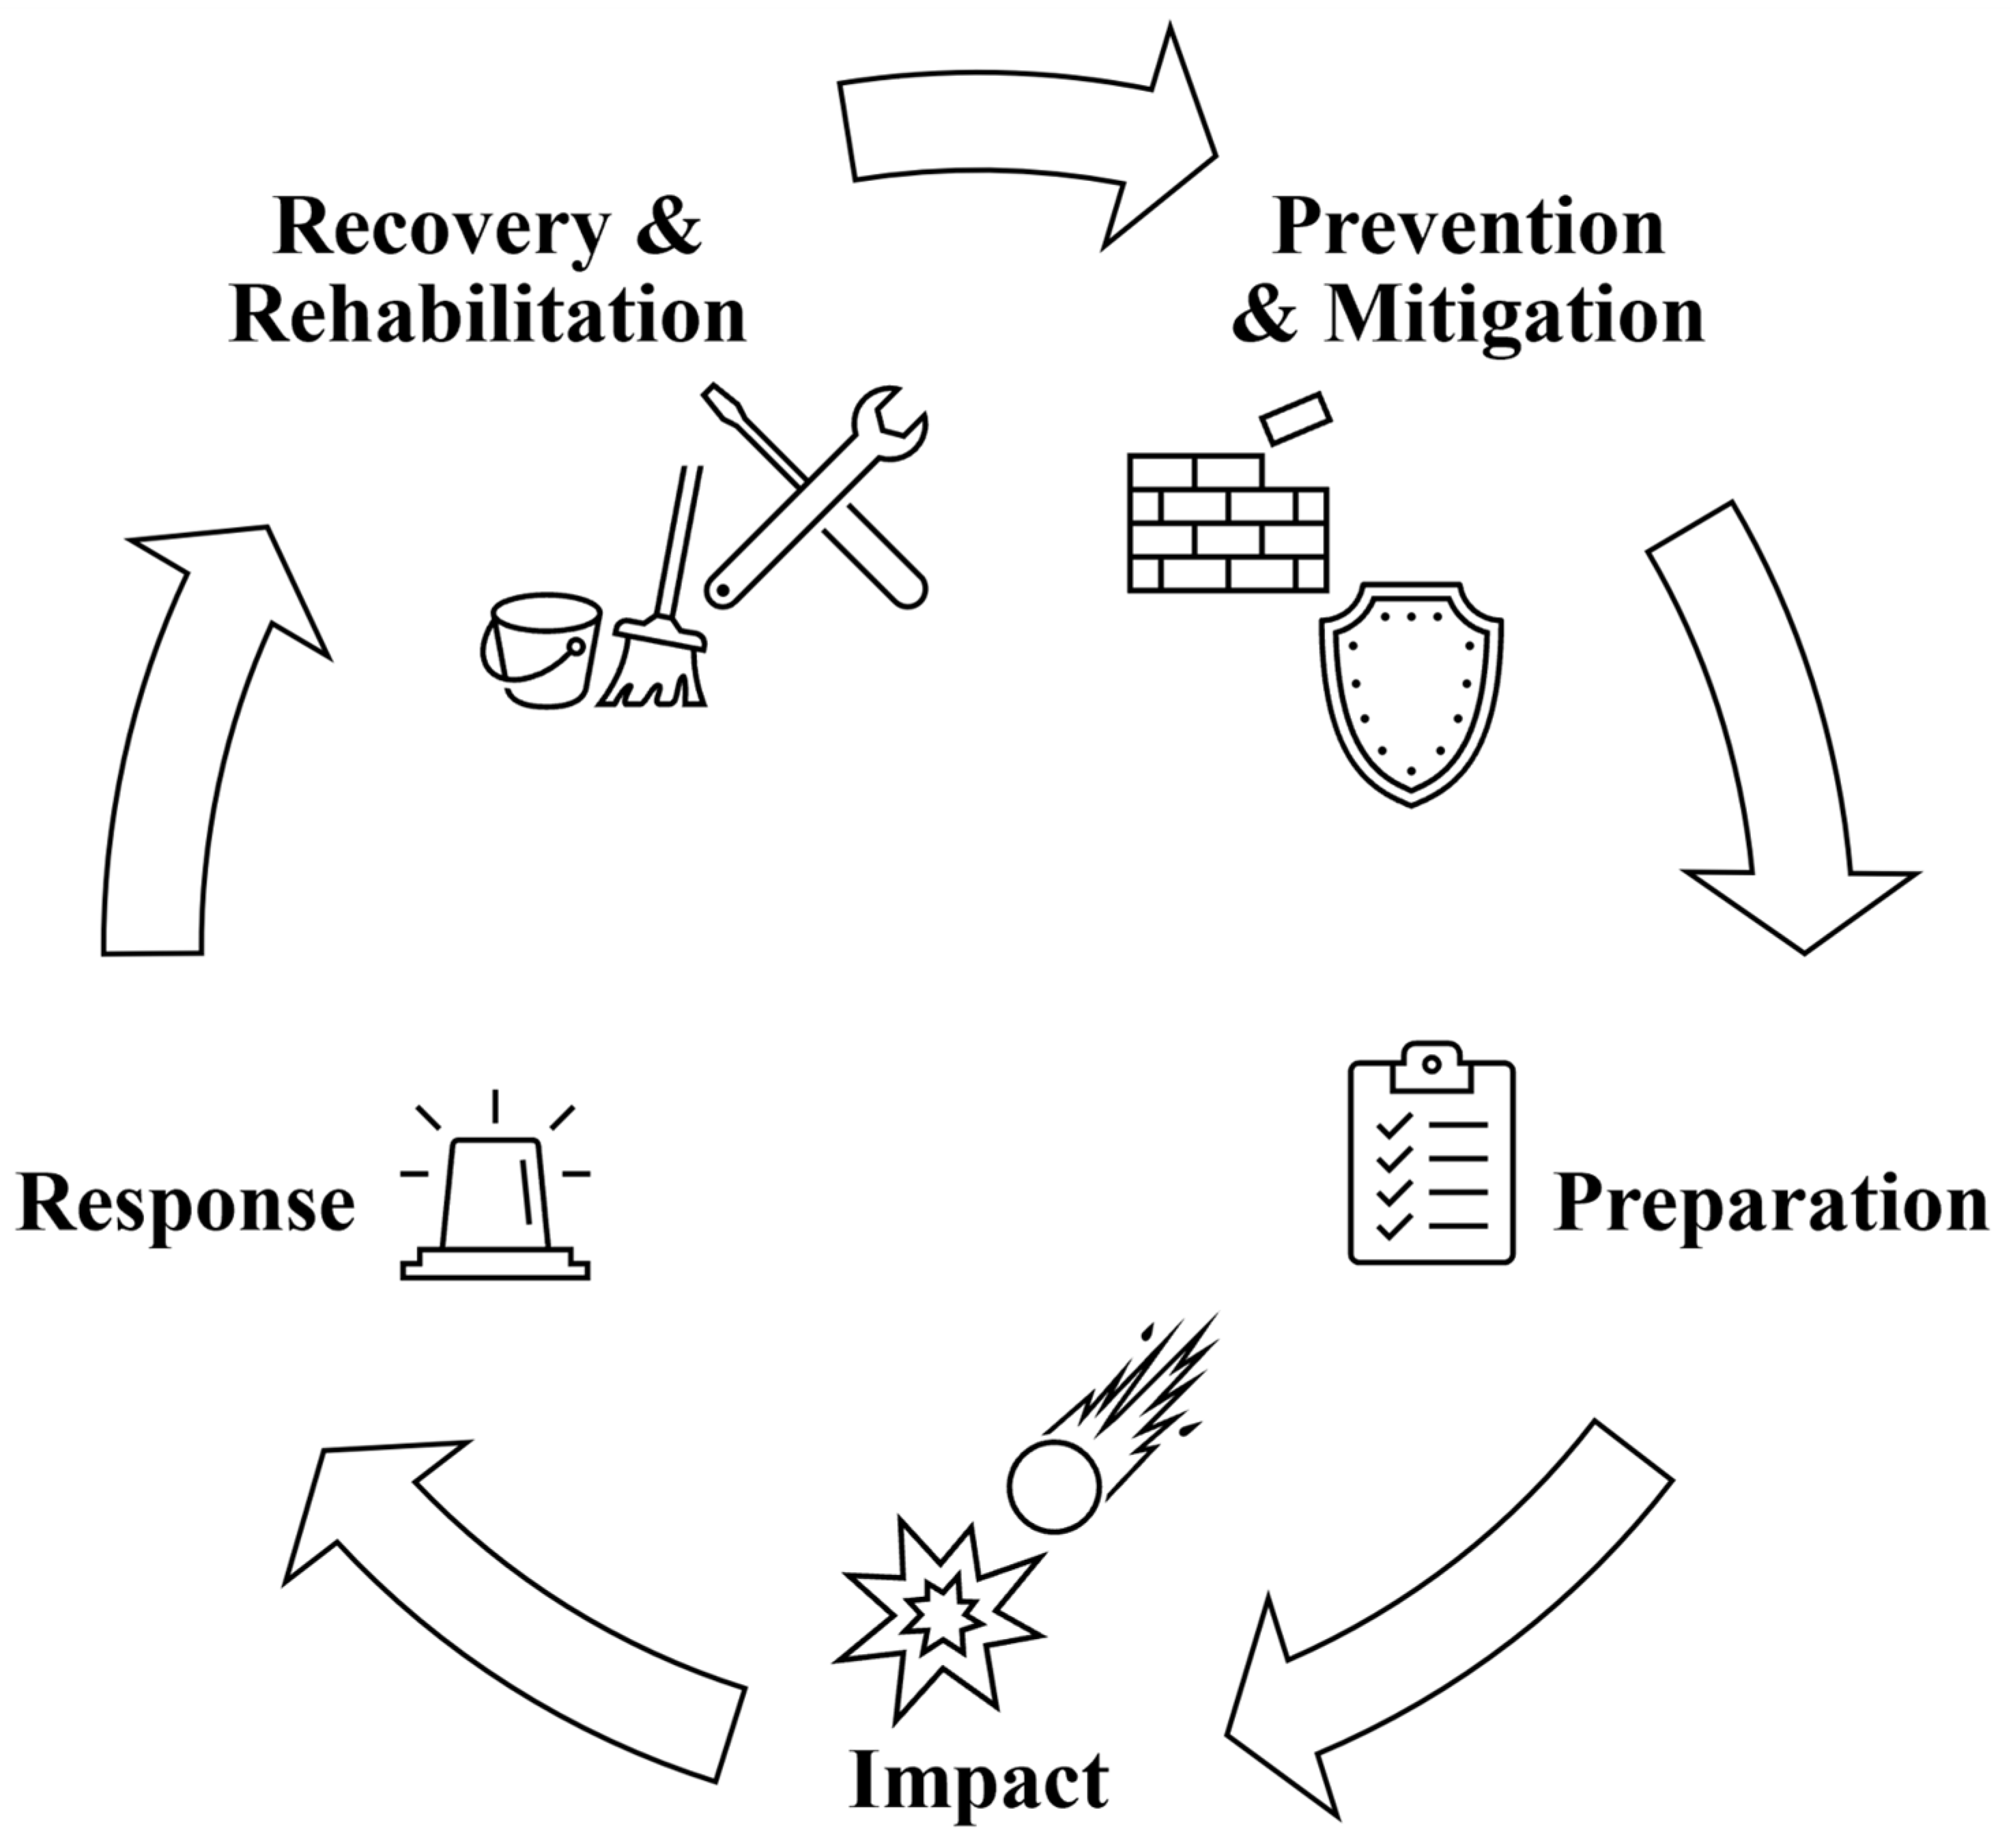
2. Flood Measures for Critical Infrastructure Networks
2.1. Methodology for the Derivation of a Measure Catalog
2.2. Generalized Measures
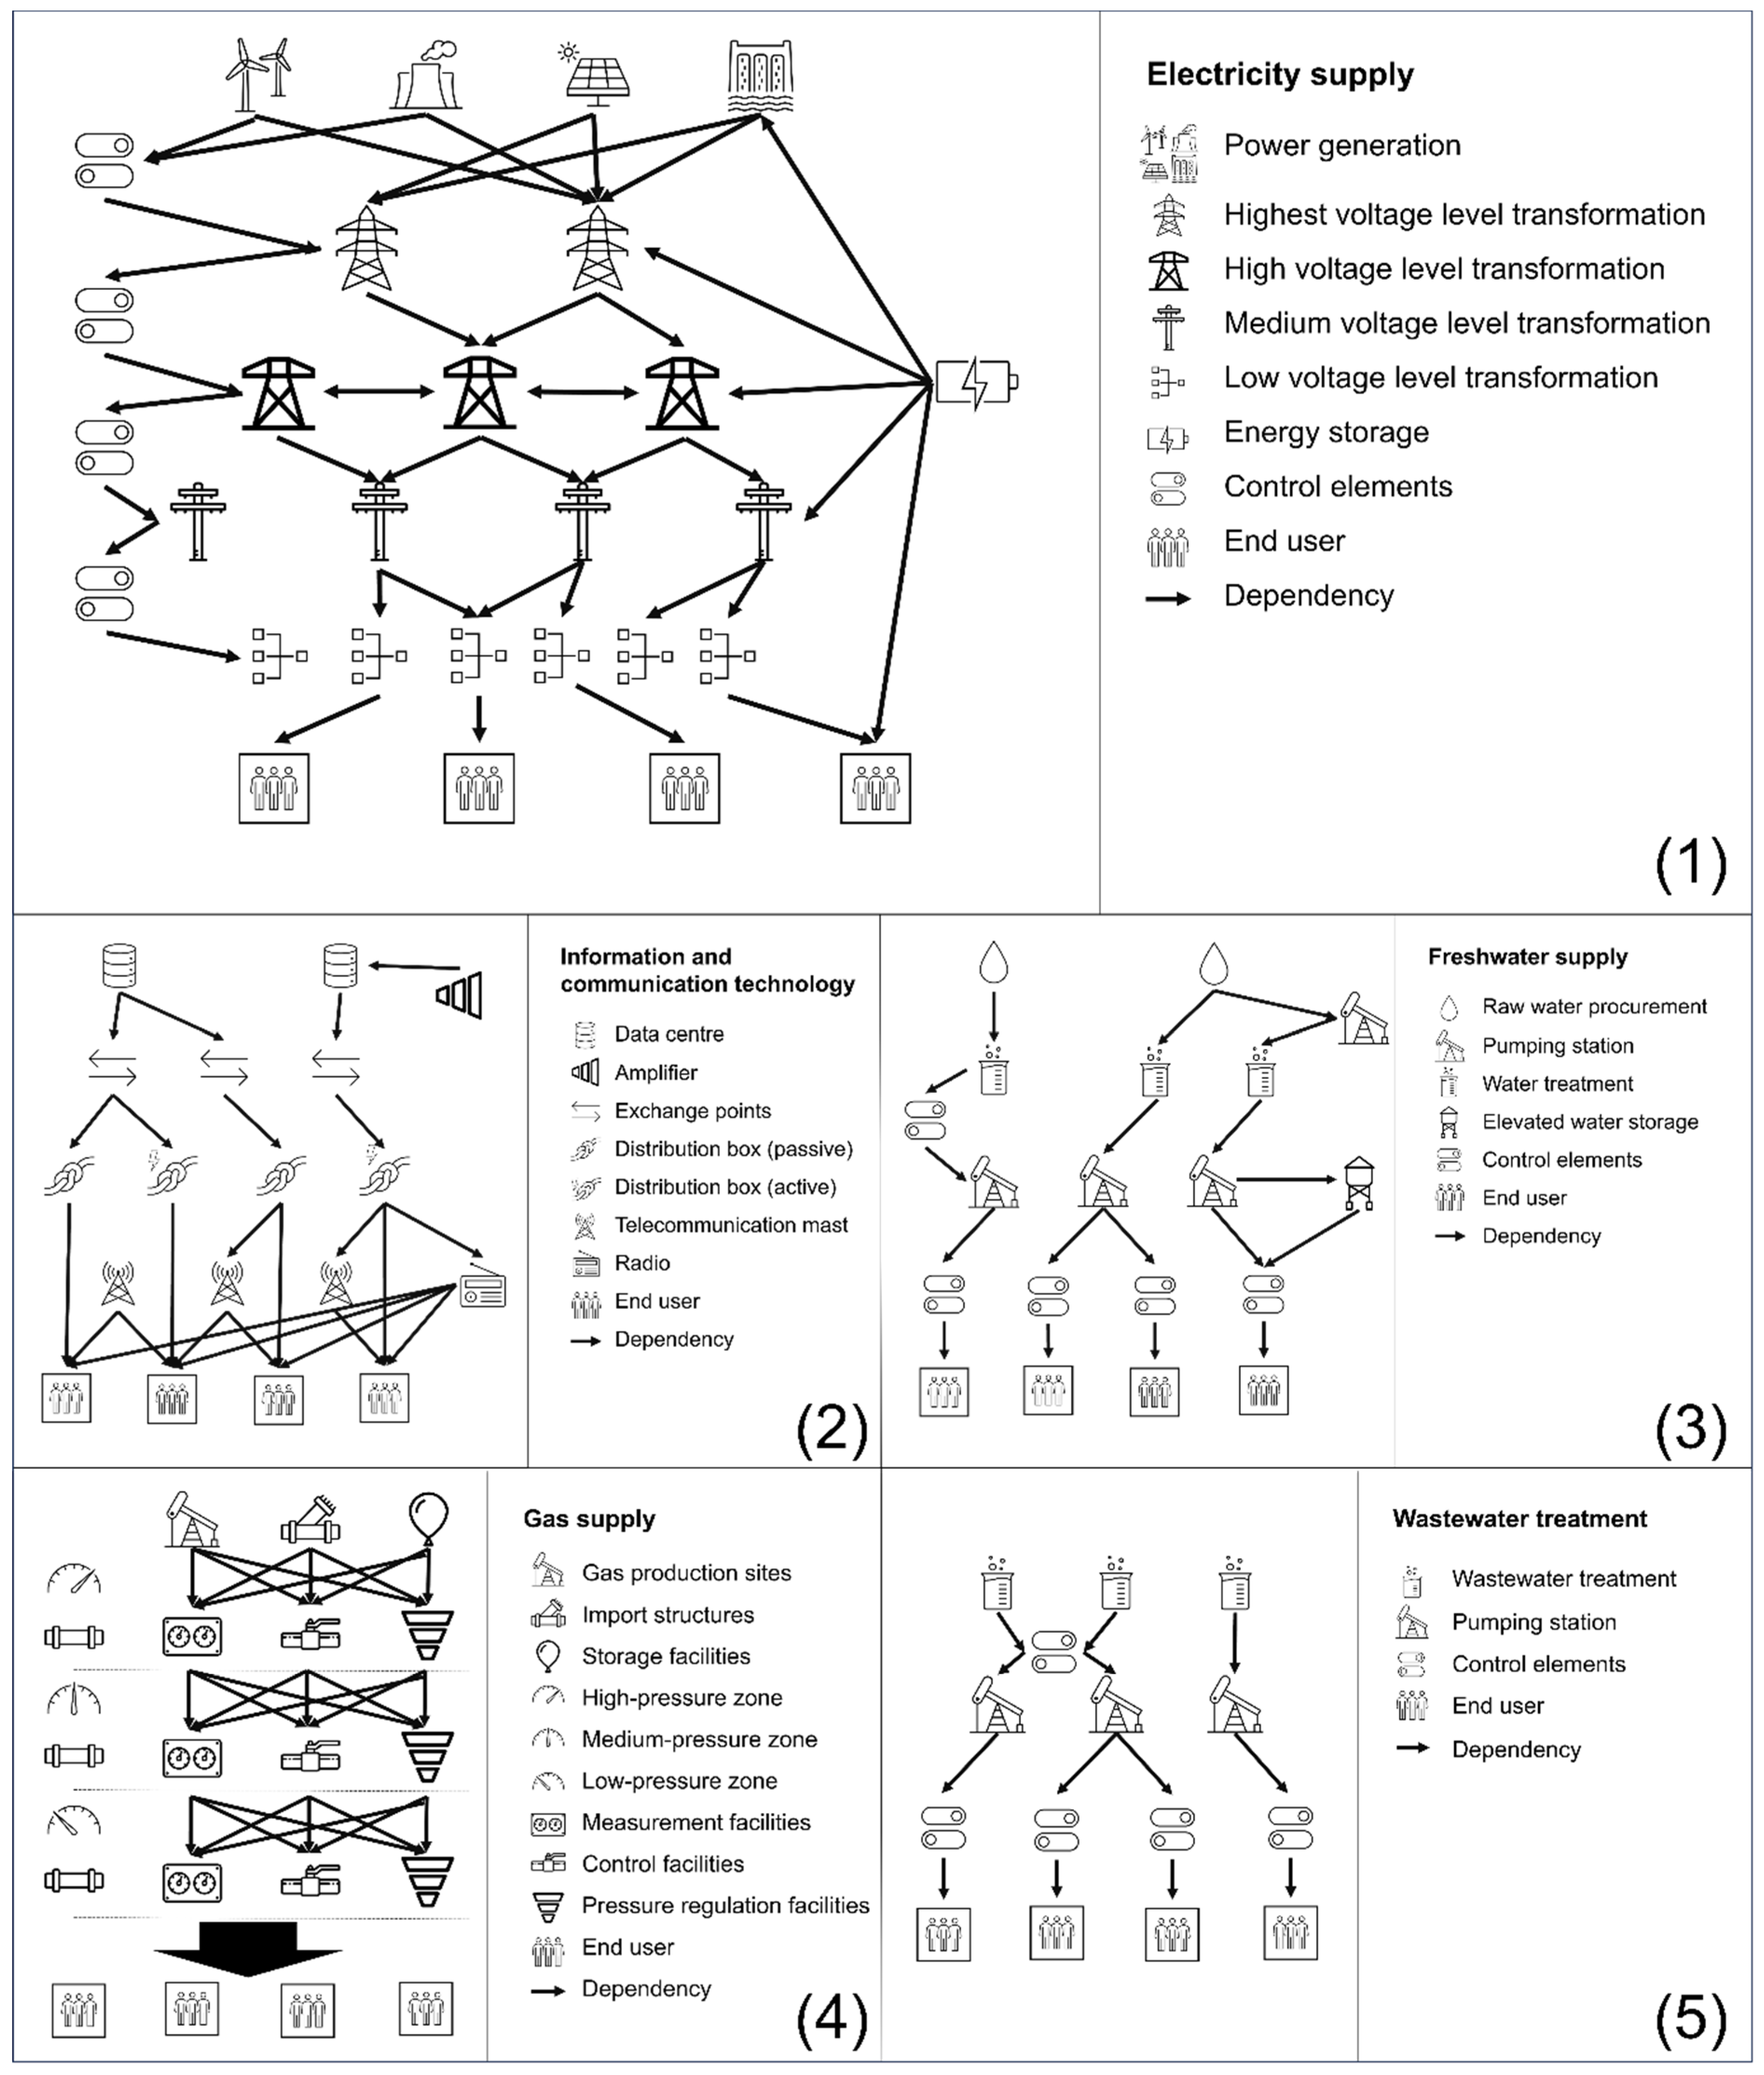
2.3. Hierarchical Structures, Flood Impacts, and Exemplary Measures of Critical Infrastructure Sectors
2.3.1. Electricity Sector
2.3.2. Information and Communication Technology Sector
2.3.3. Freshwater Supply
2.3.4. Wastewater Treatment
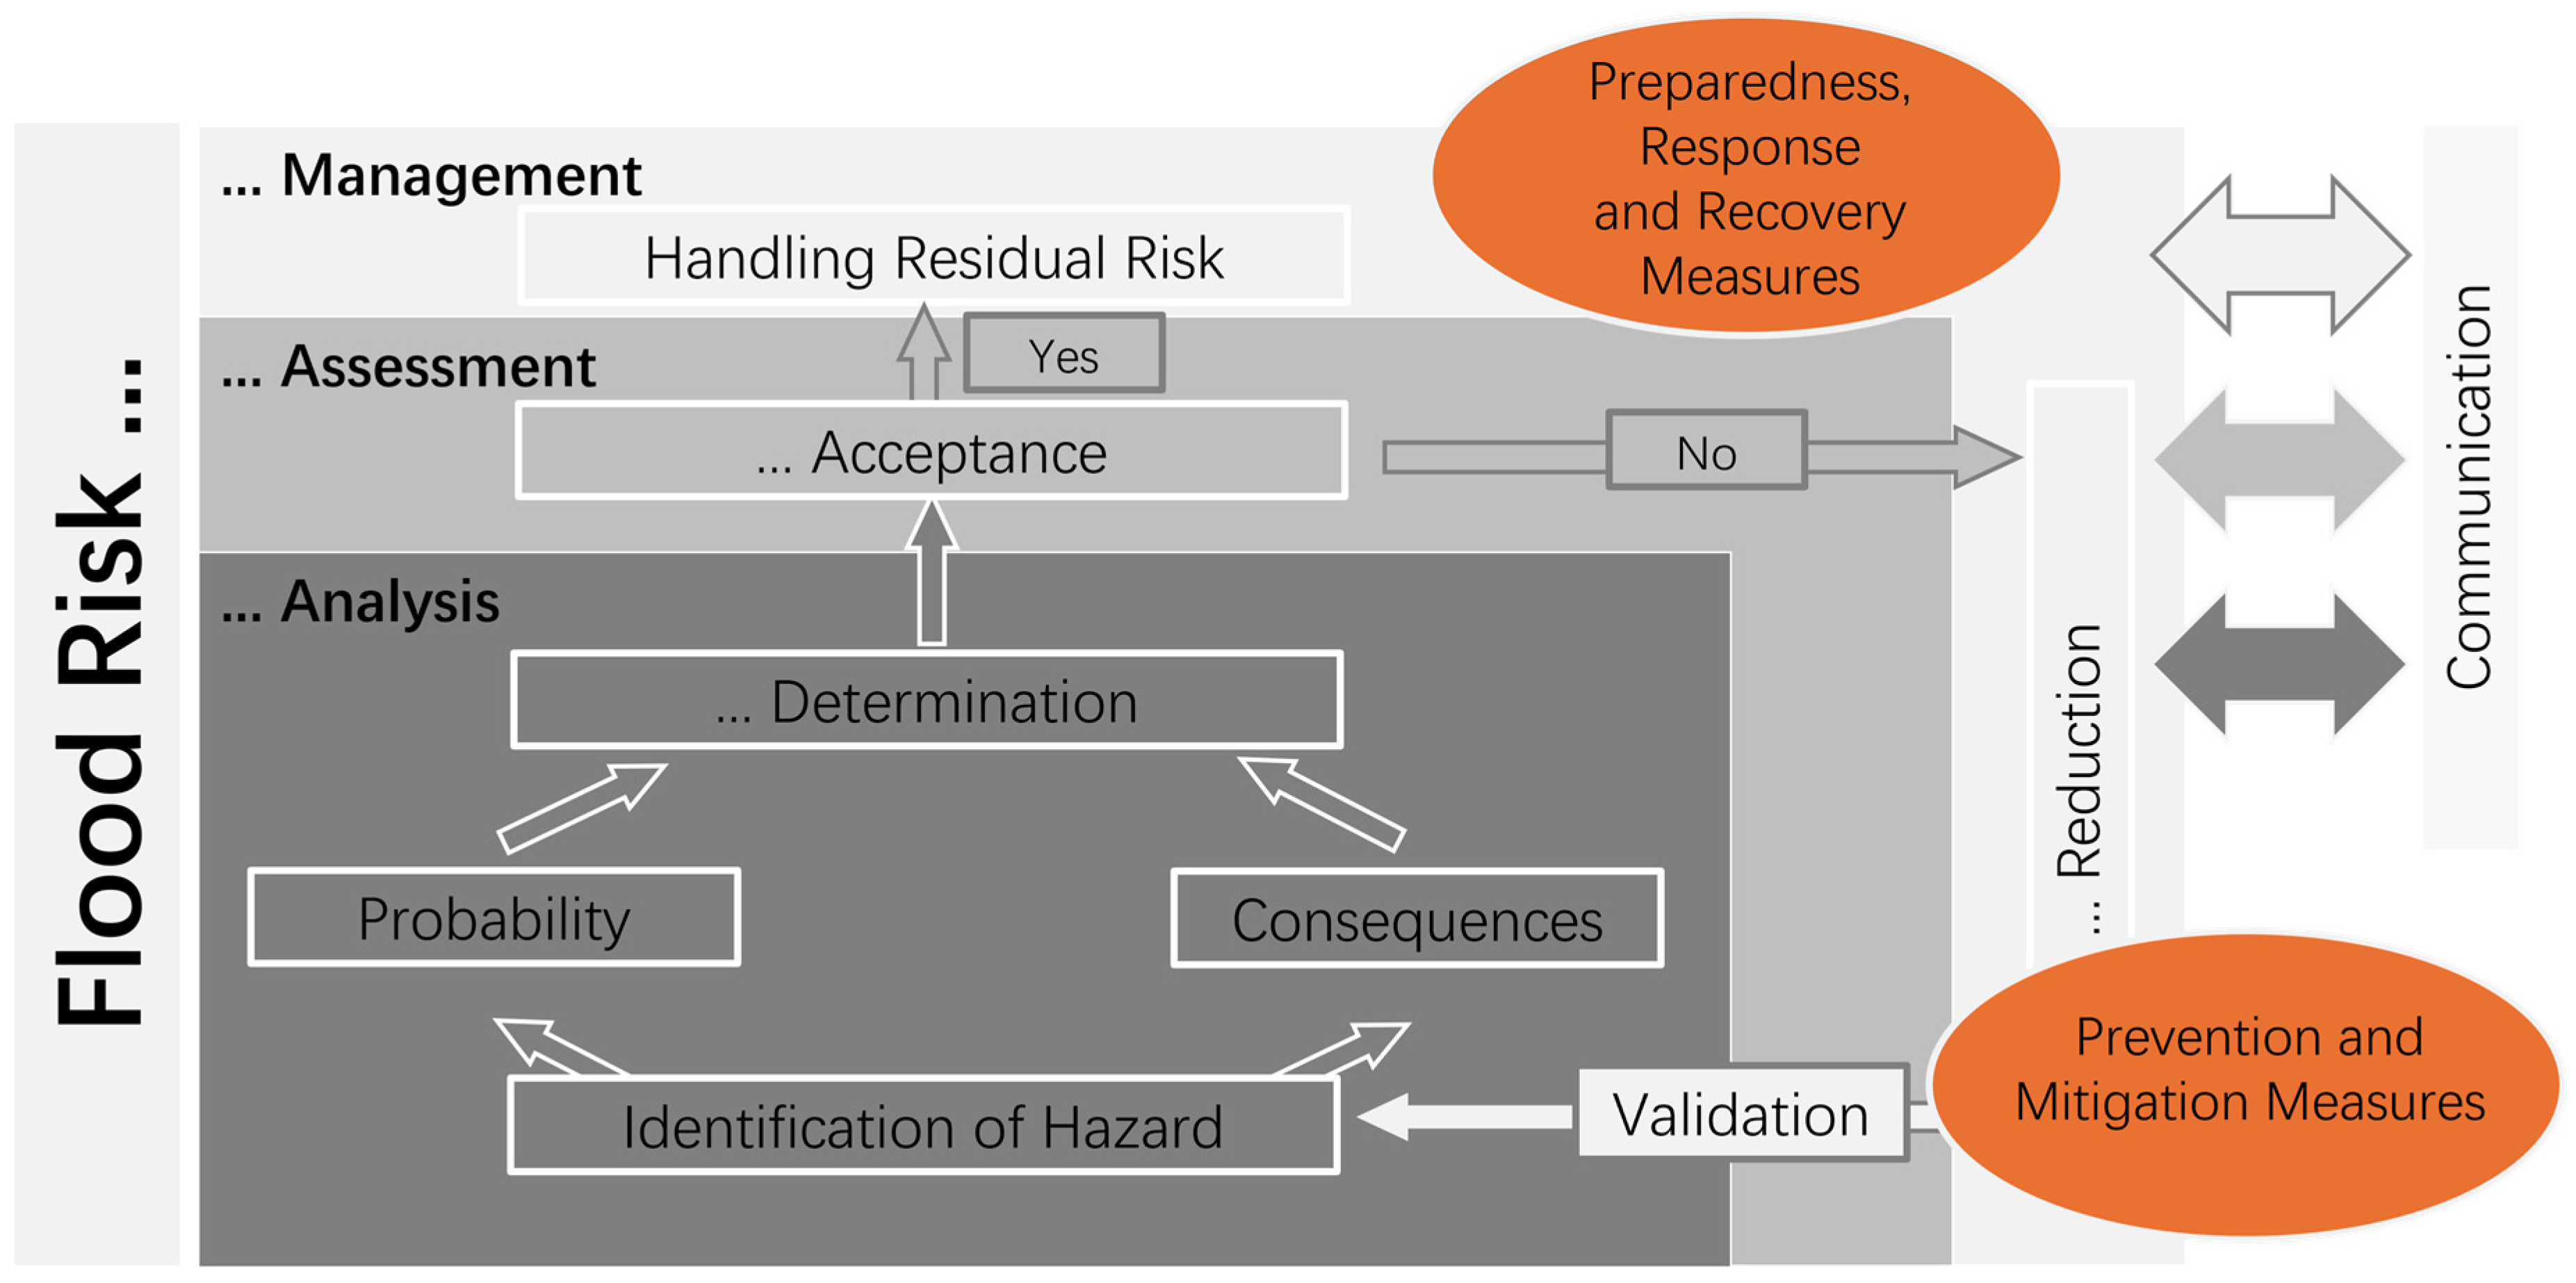
3. Risk-Based Evaluation of Flood Measures for Critical Infrastructures
3.1. Consideration of Flood Measures in Flood Risk Management
3.2. Model-Based Evaluation of Flood Measures for Critical Infrastructures
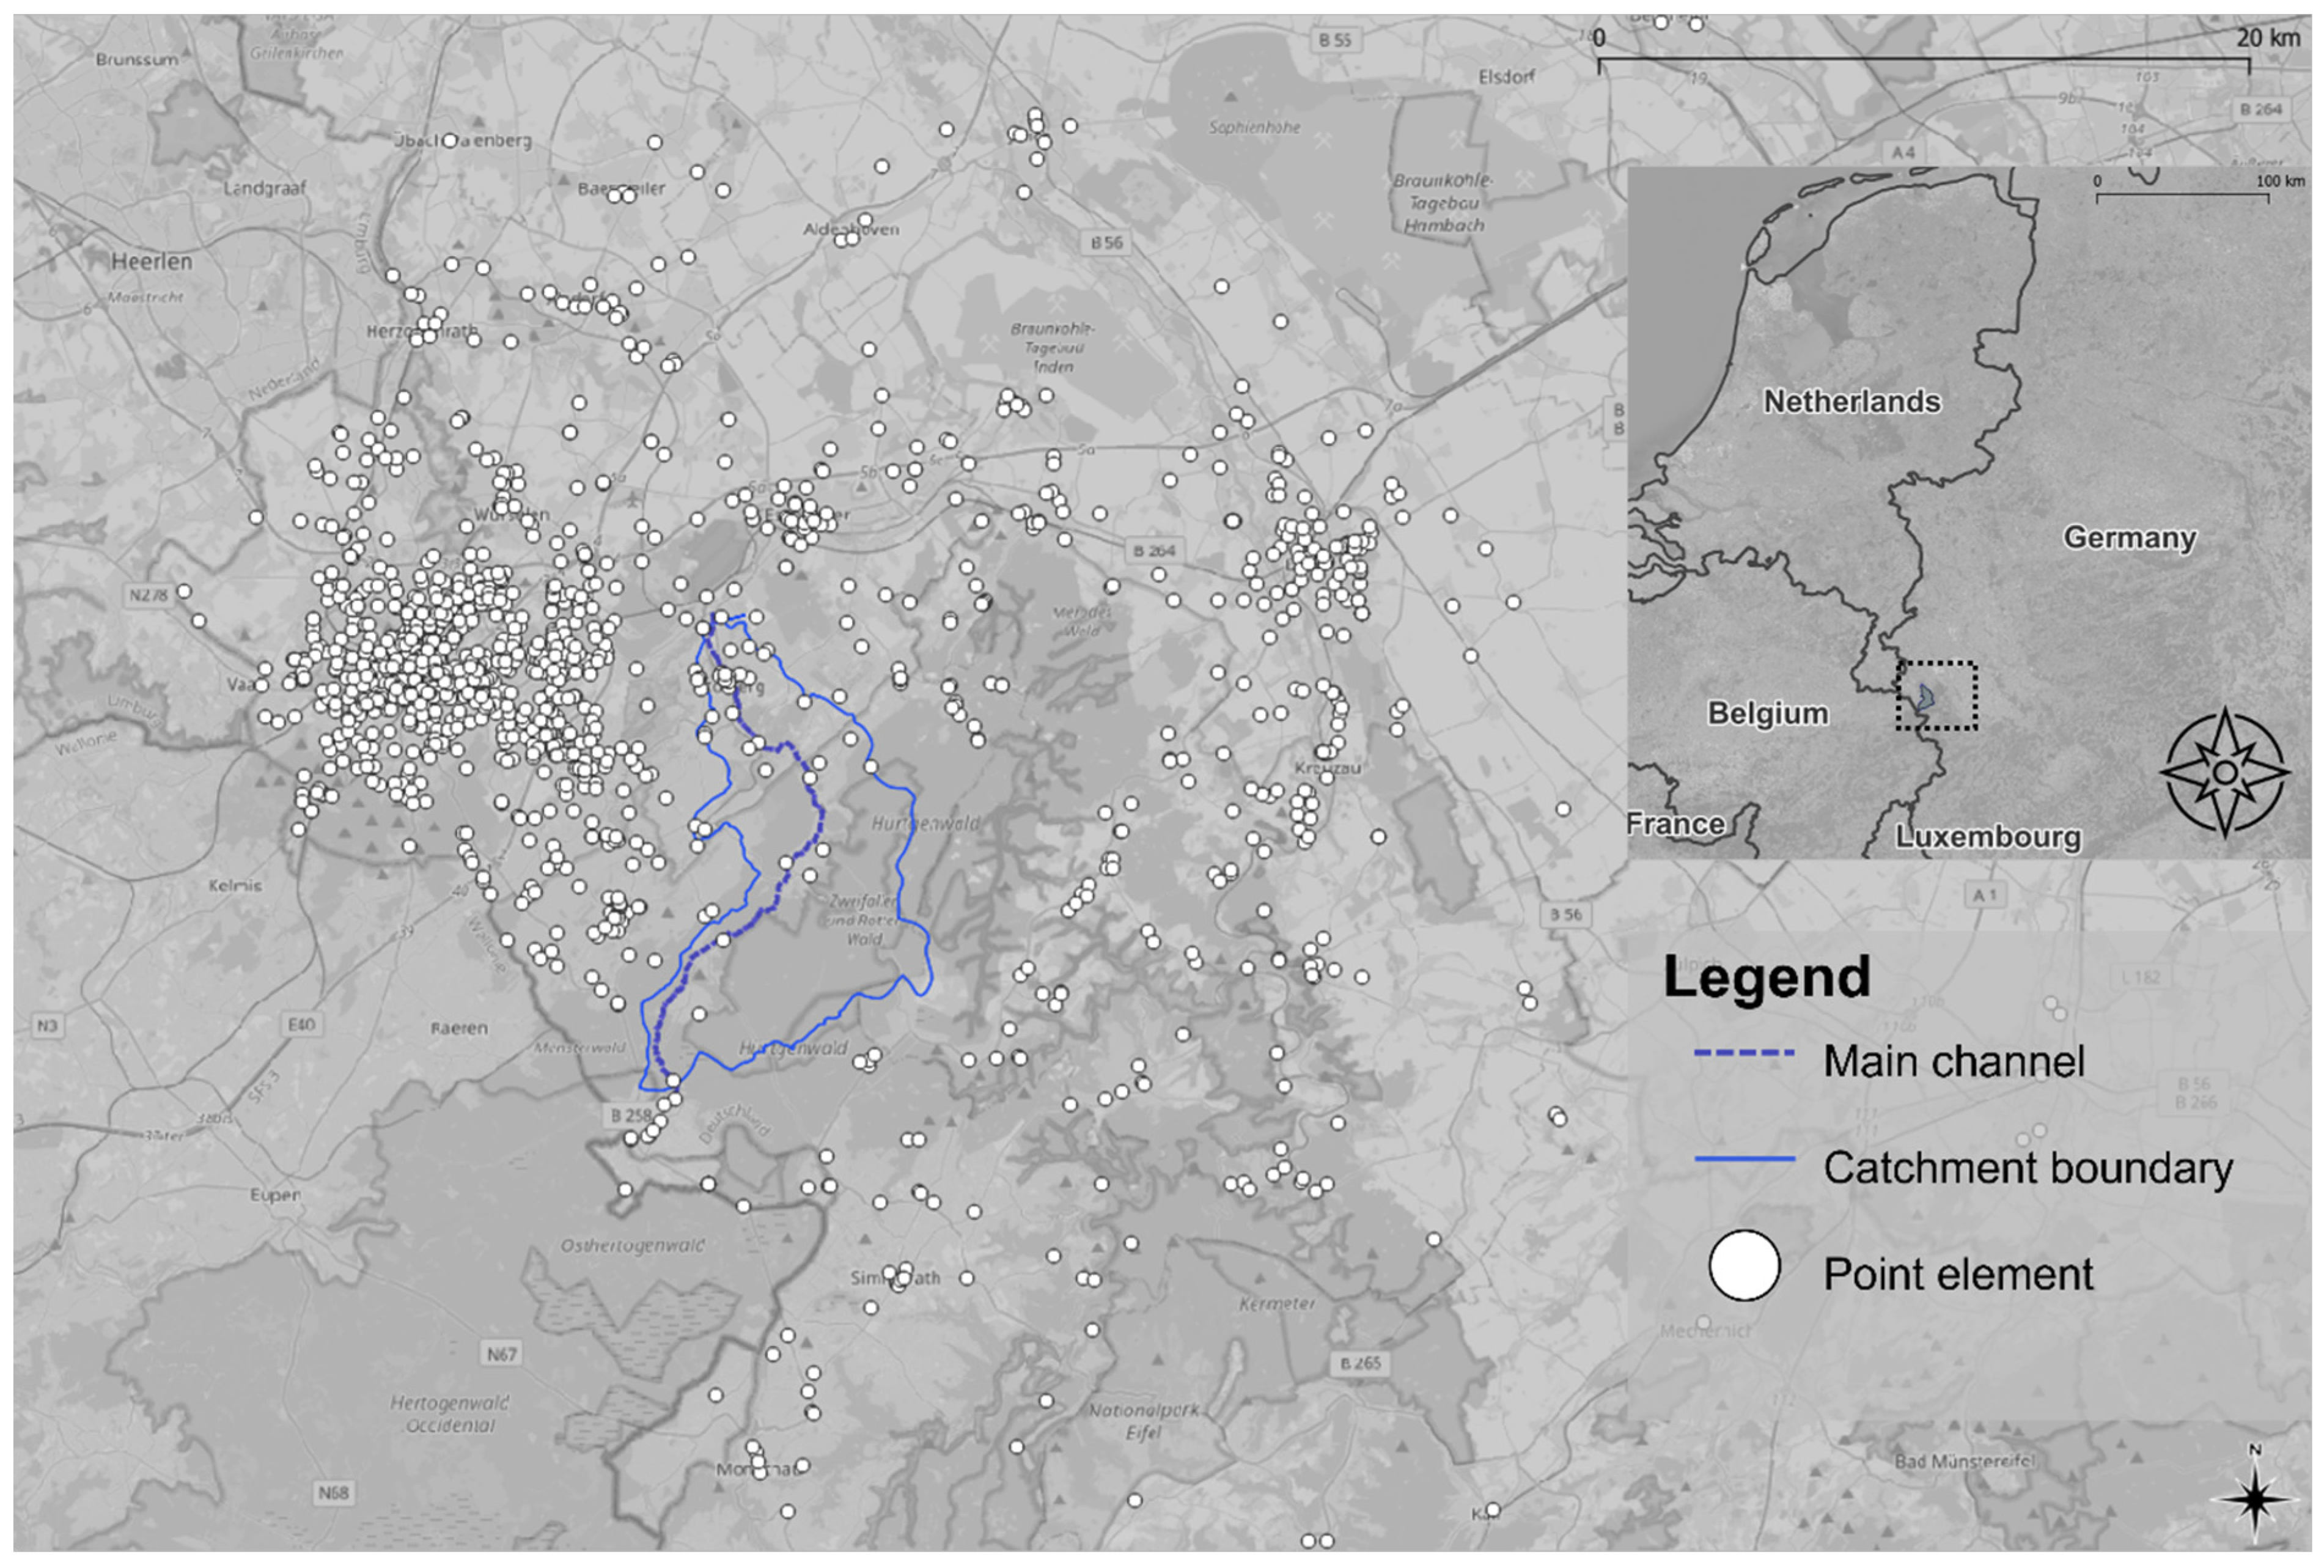
4. Case Study—Potential of Flood Measures in the Vicht Catchment
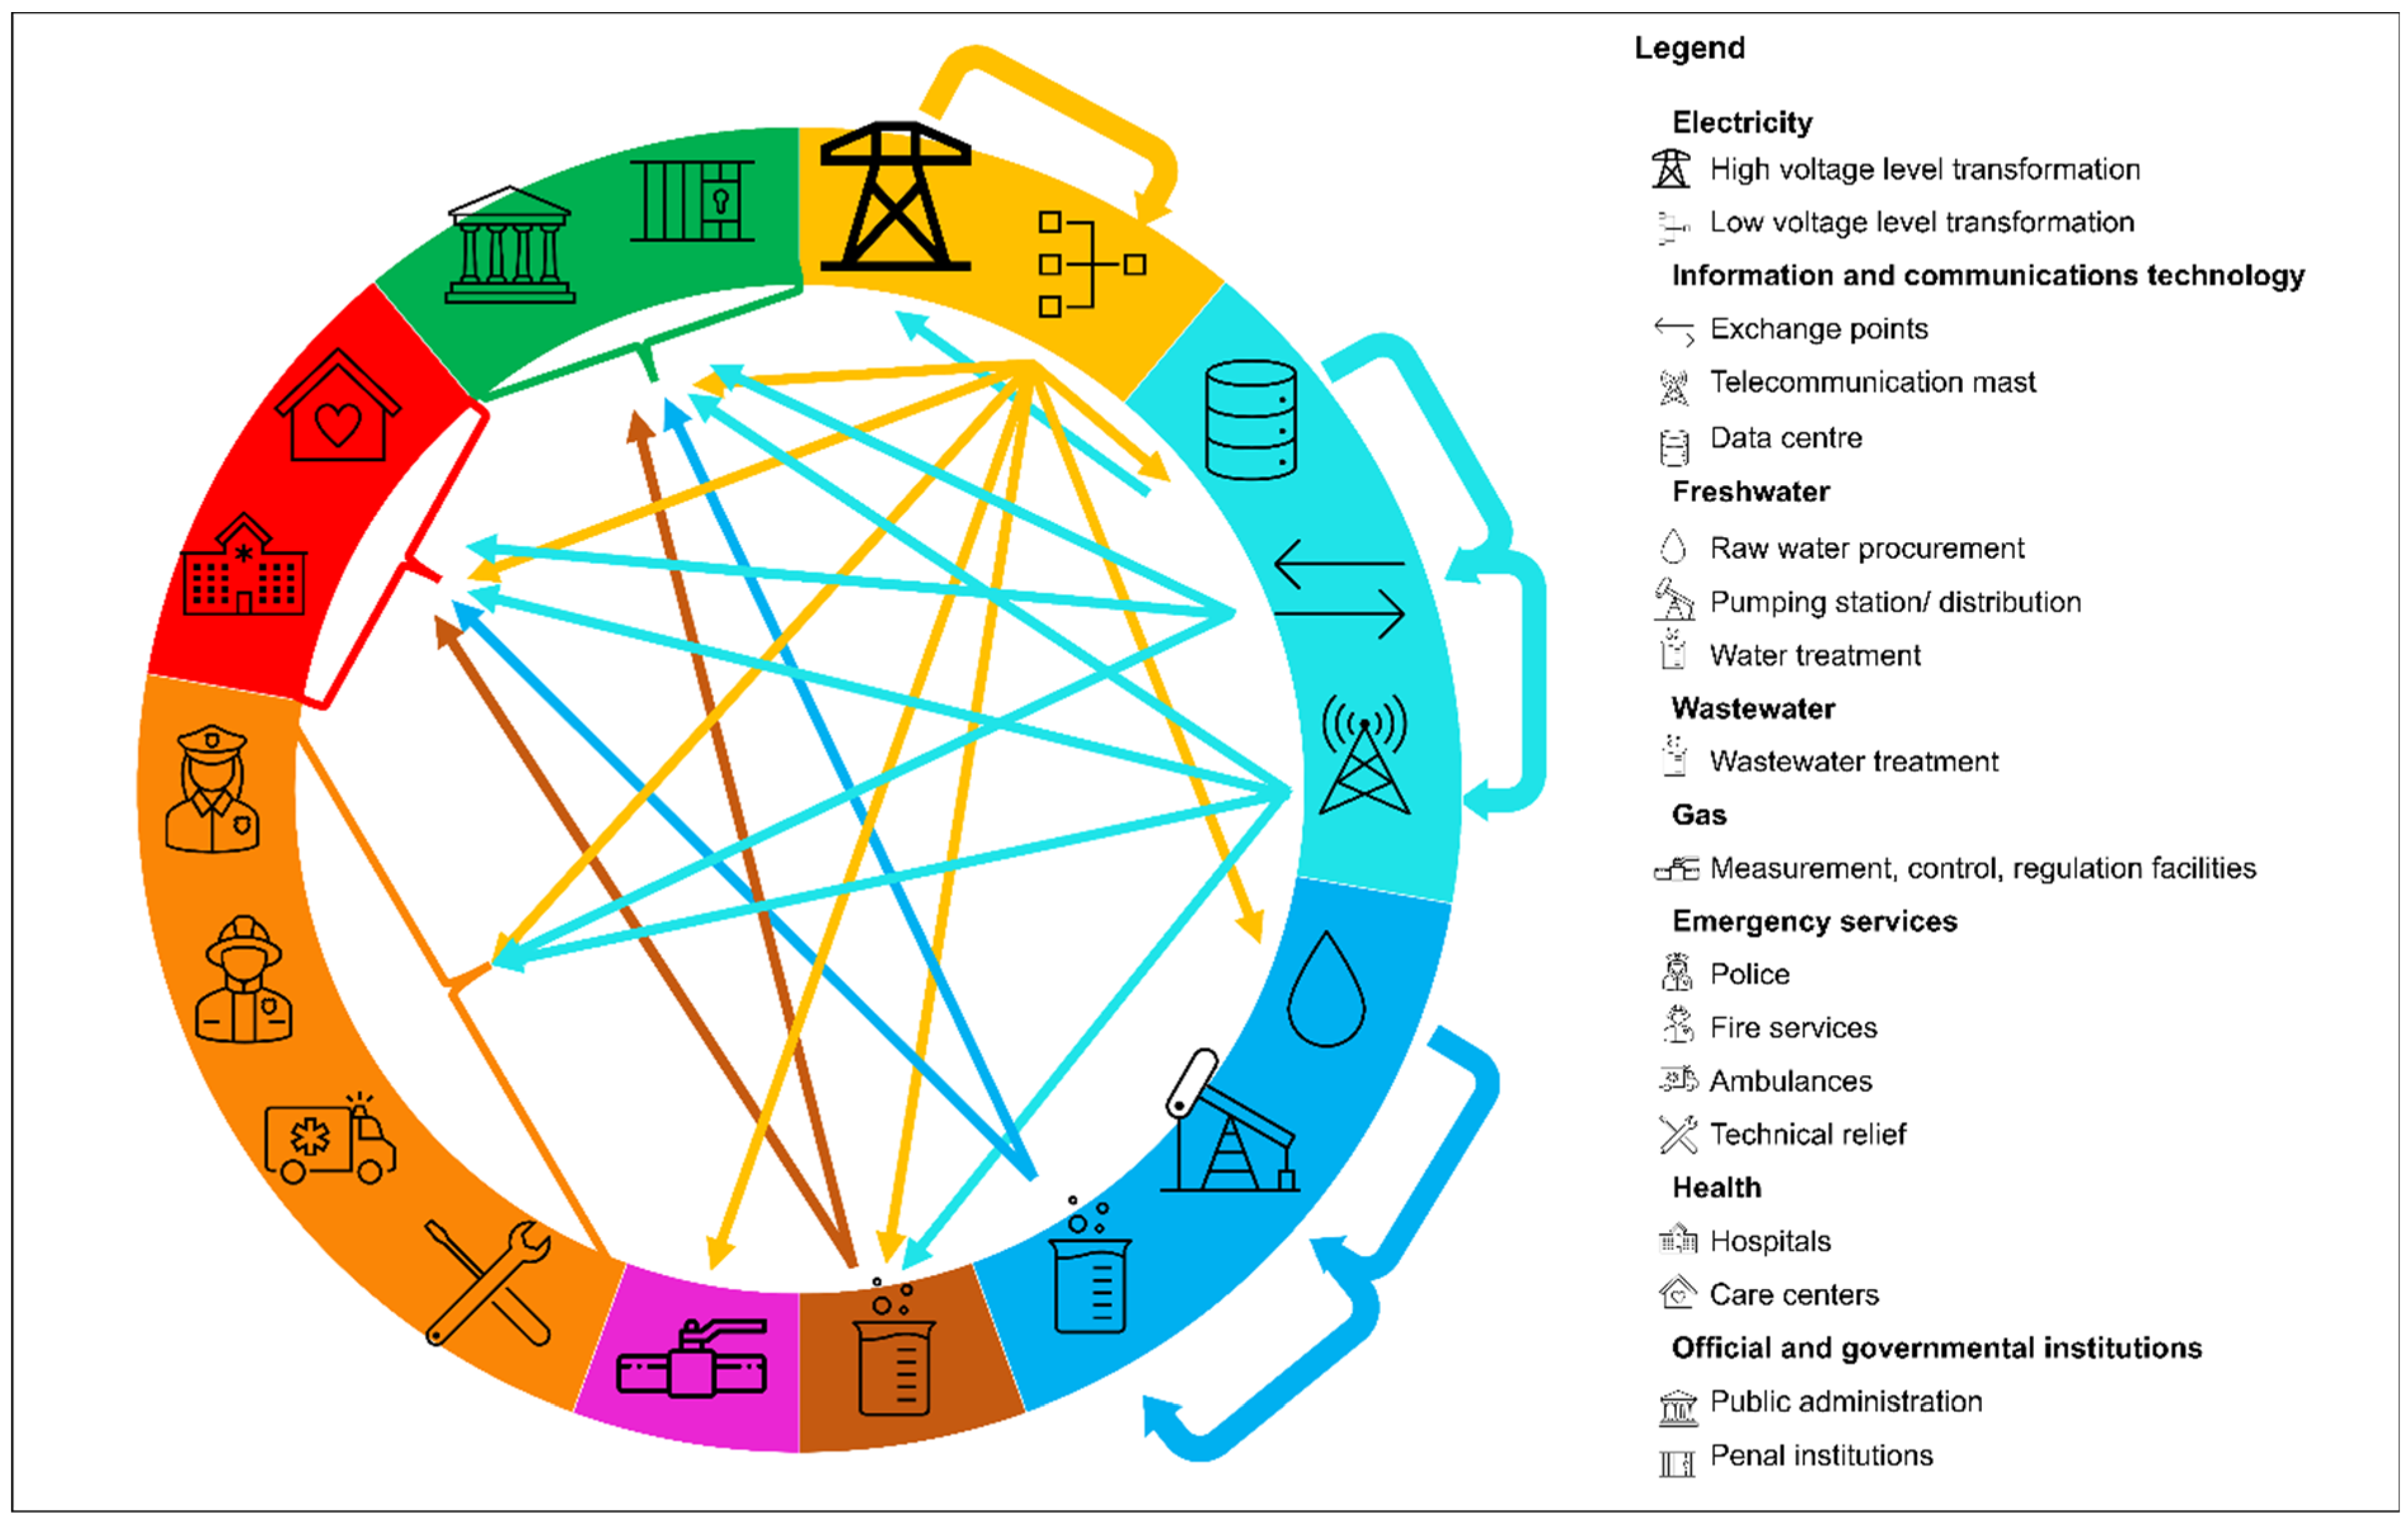
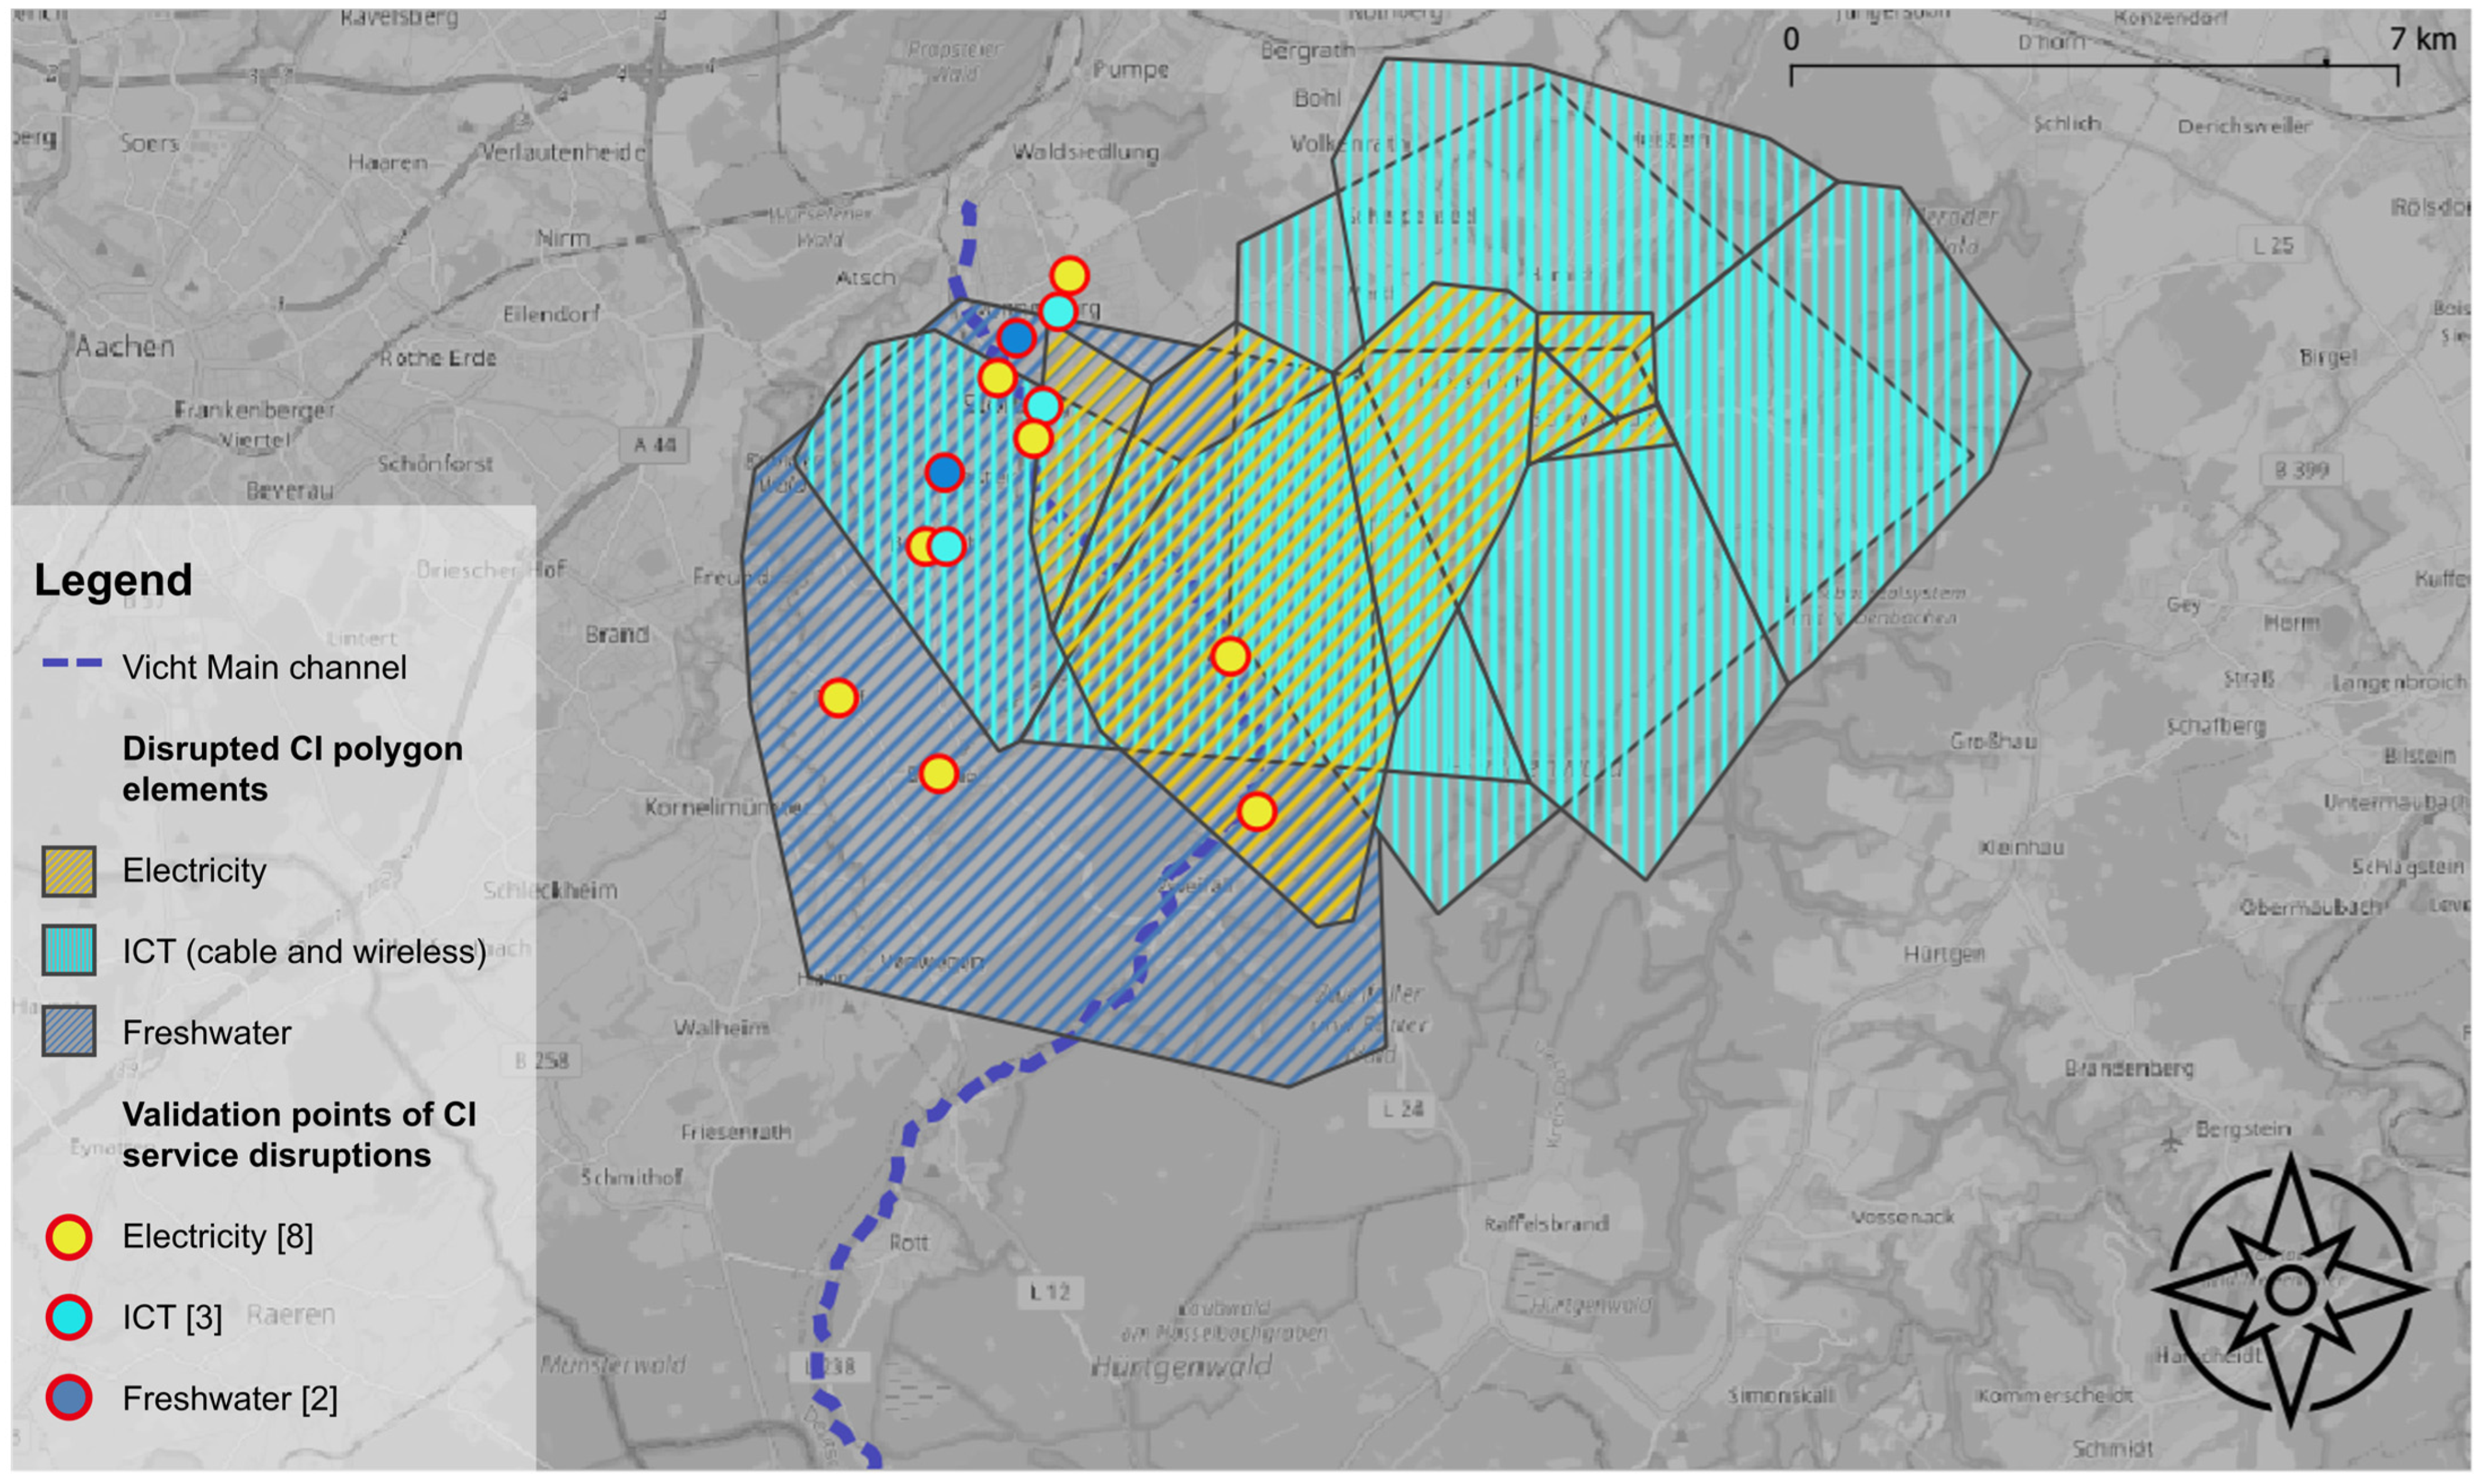
4.1. Critical Infrastructure Network Model
4.2. Hydraulic Model: Input and Output
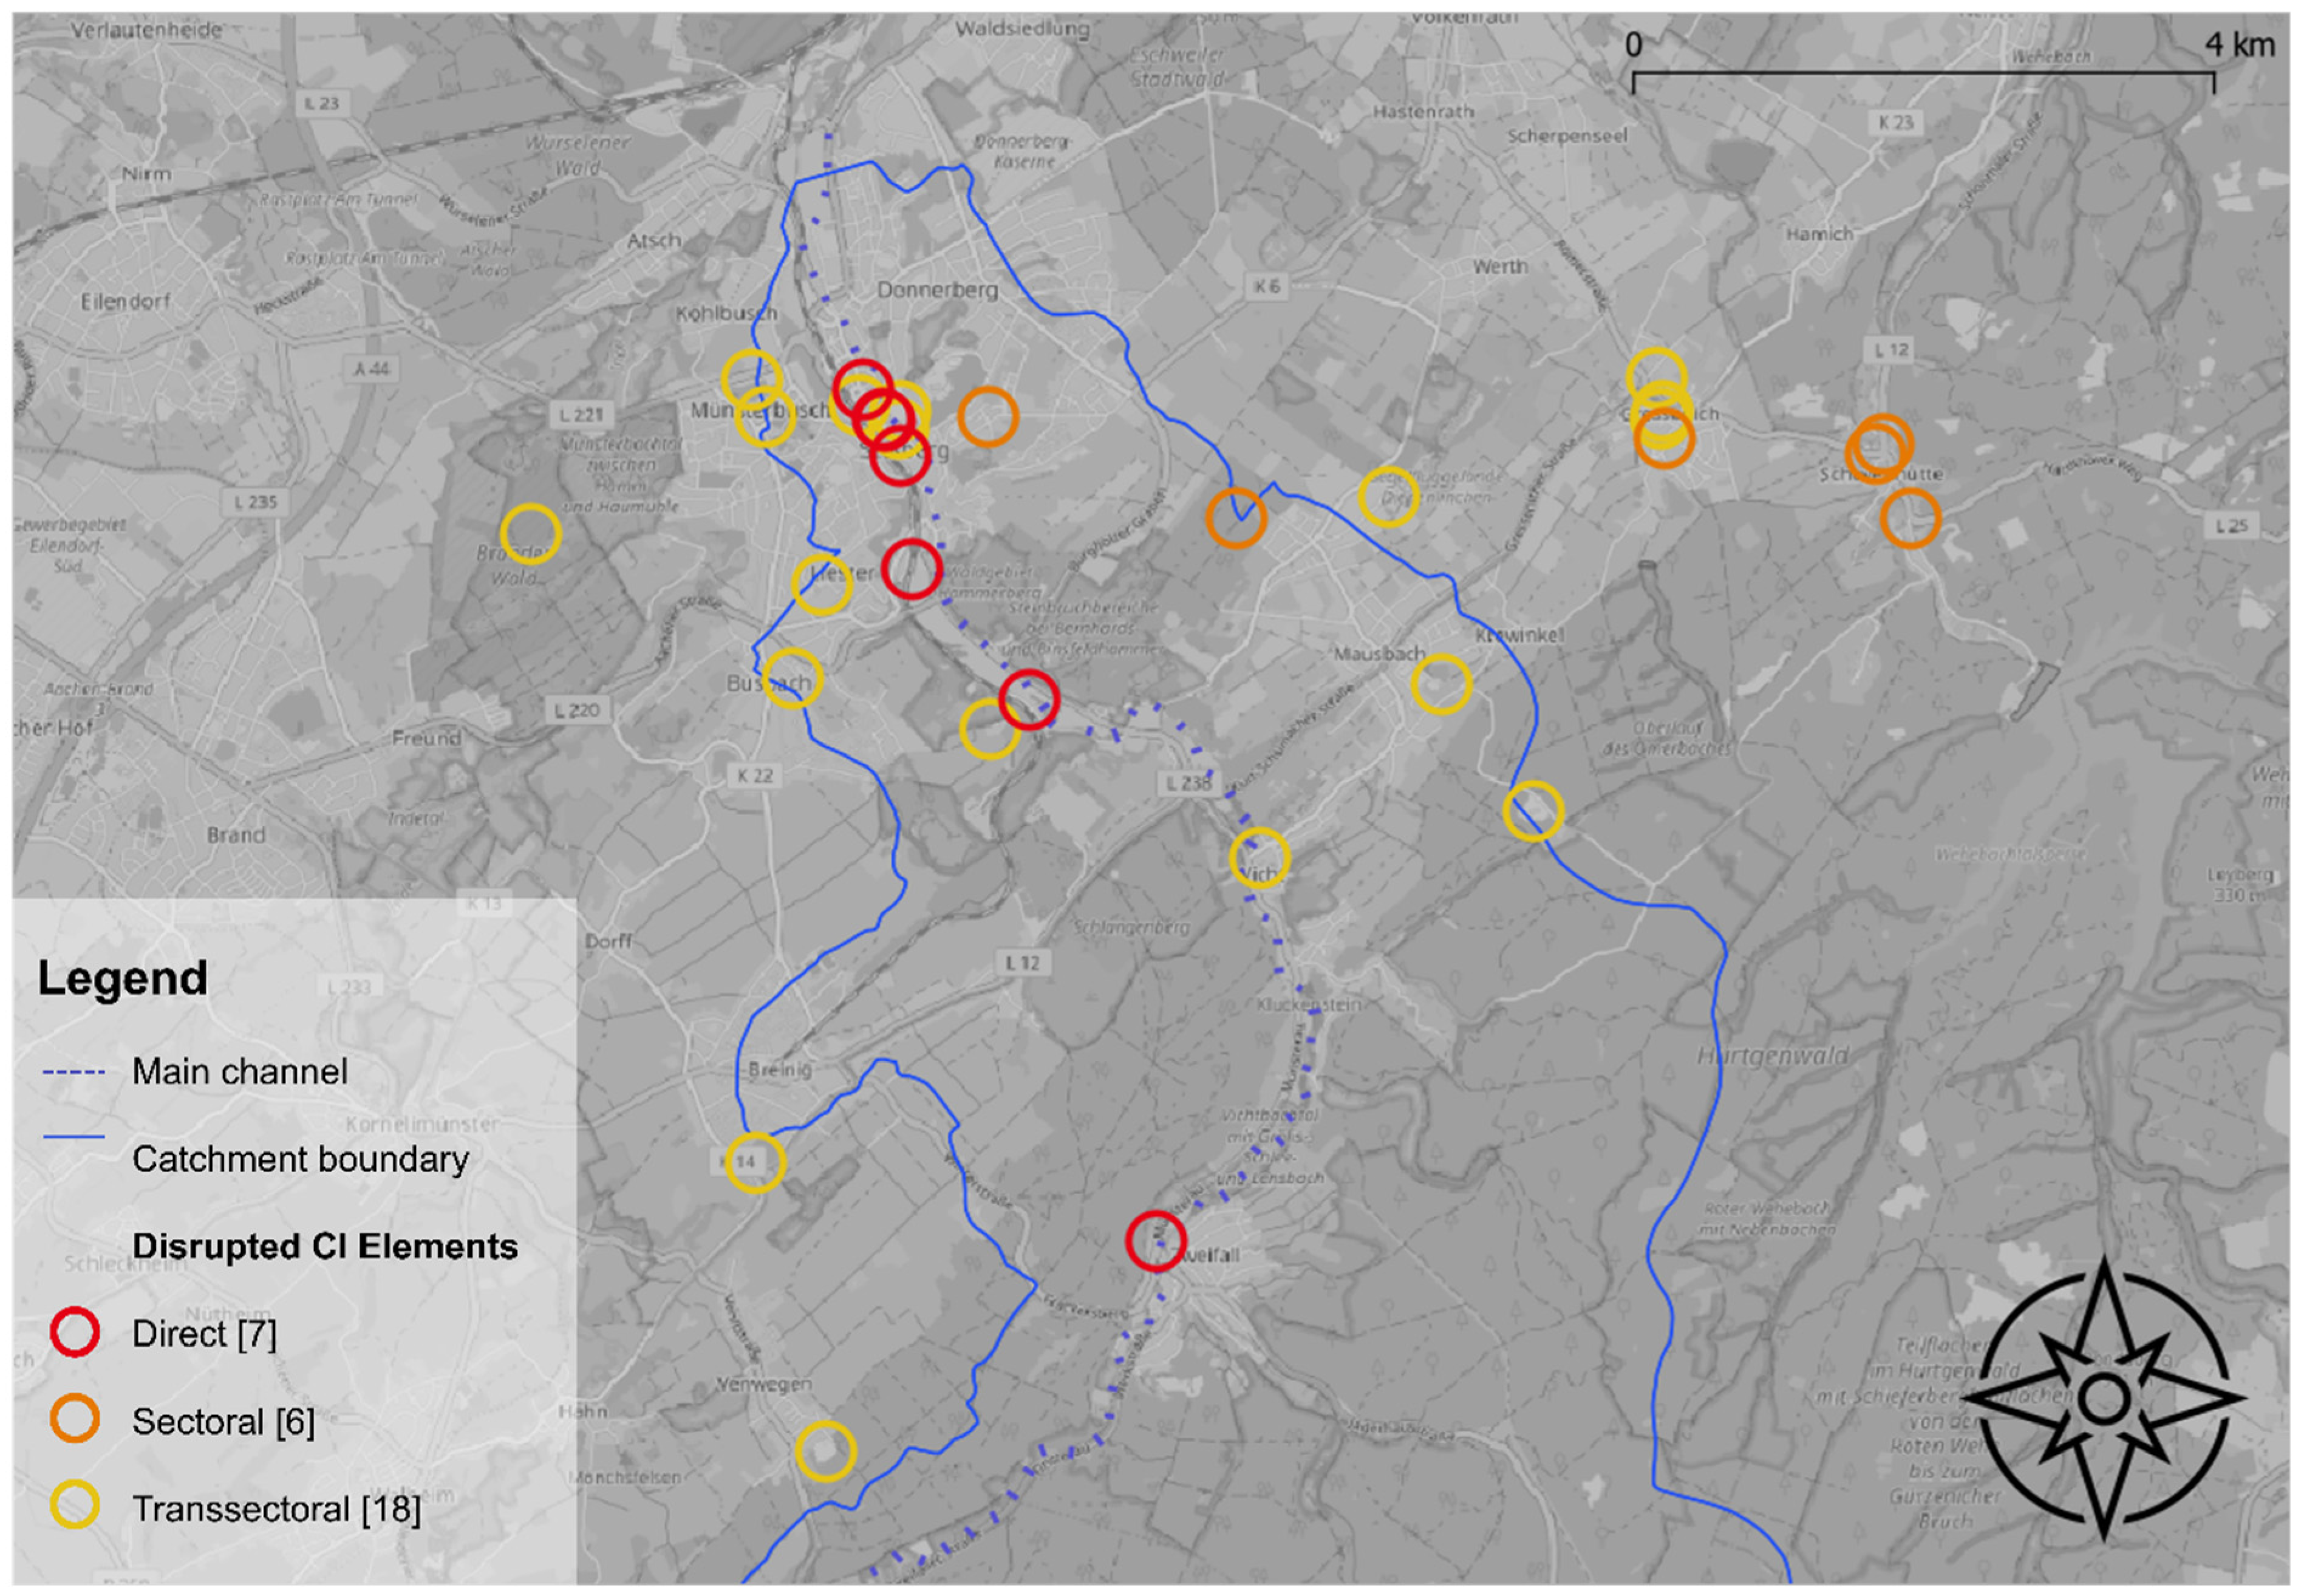
4.3. Current Risk
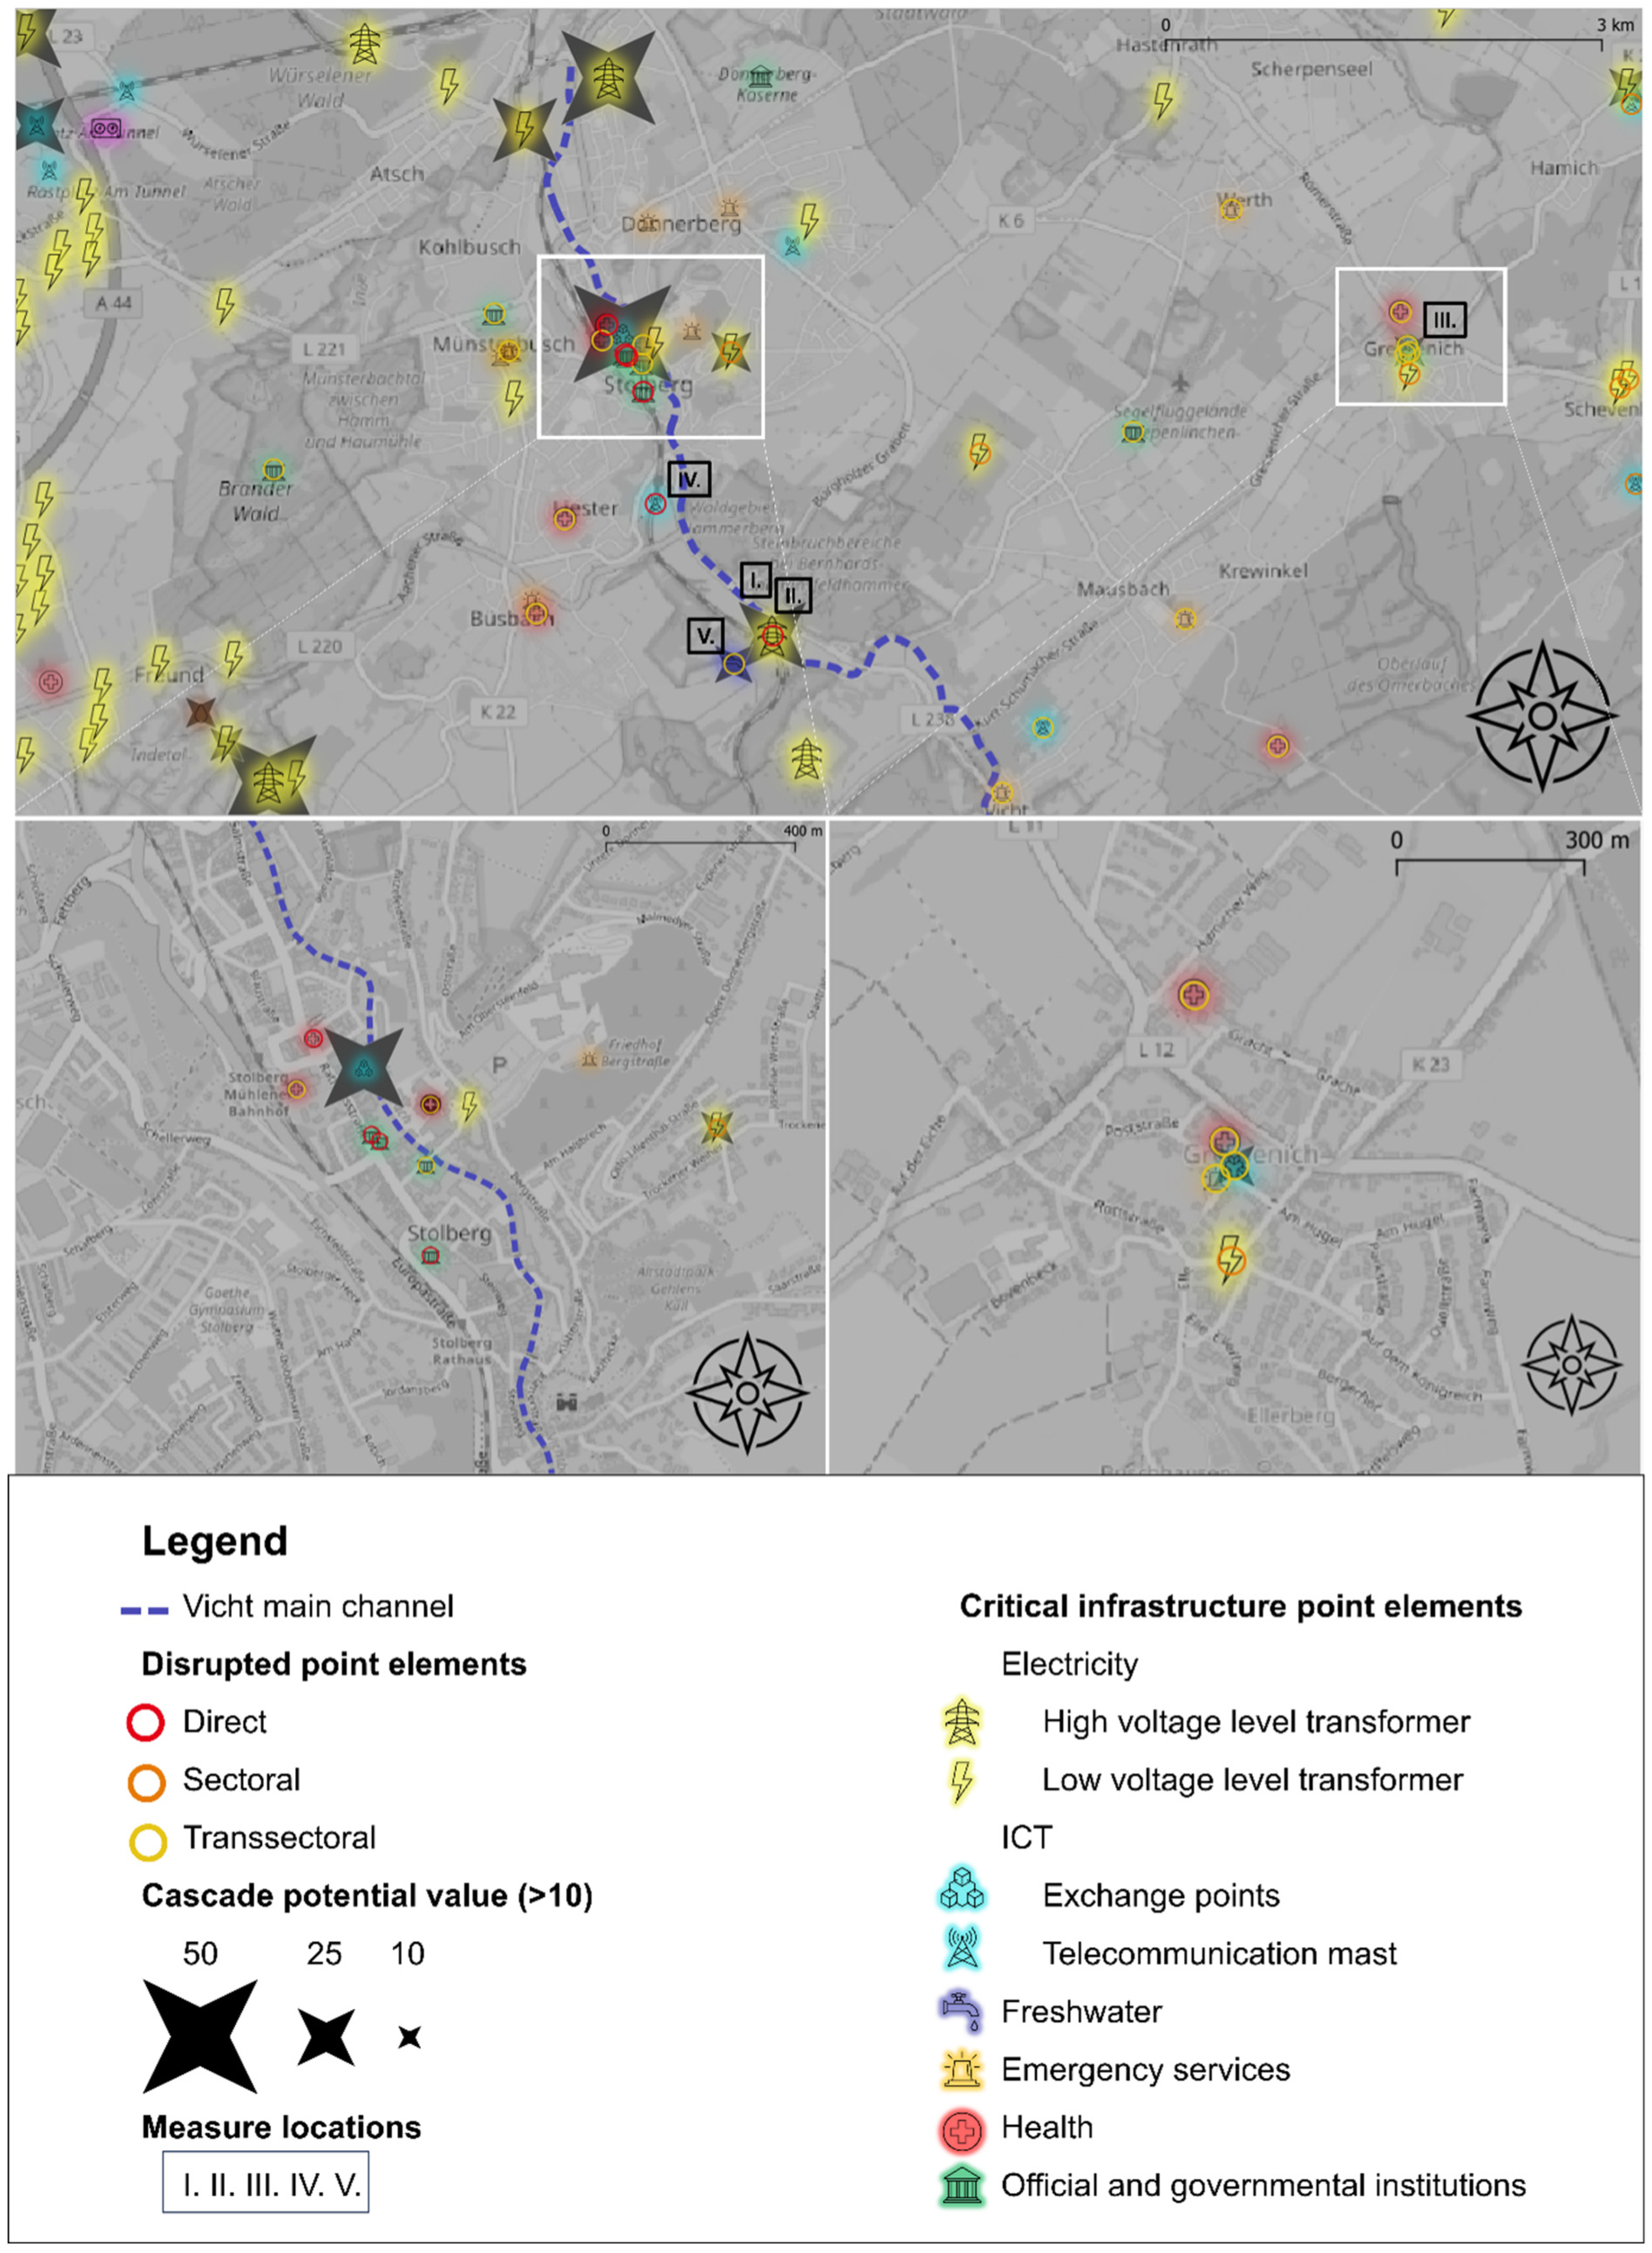
4.4. Testing Measure for Effectiveness
5. Discussion & Outlook
6. Conclusions
Author Contributions
Funding
Data Availability Statement
Acknowledgments
Conflicts of Interest
References
- UNDRR. Addressing the Infrastructure Failure Data Gap: A Governance Challeng. Available online: https://www.undrr.org/publication/addressing-infrastructure-failure-data-gap-governance-challenge (accessed on 9 May 2023).
- Rinaldi, S.; Peerenboom, J.; Kelly, T. Identifying, understanding, and analyzing critical infrastructure interdependencies. IEEE Control. Syst. 2001, 21, 11–25. [Google Scholar] [CrossRef]
- Fekete, A. Critical infrastructure and flood resilience: Cascading effects beyond water. WIREs Water 2019, 6, e1370. [Google Scholar] [CrossRef]
- Schotten, R.; Bachmann, D. Integrating Critical Infrastructure Networks into Flood Risk Management. Sustainability 2023, 15, 5475. [Google Scholar] [CrossRef]
- Klijn, F.; Kreibich, H.; de Moel, H.; Penning-Rowsell, E. Adaptive flood risk management planning based on a comprehensive flood risk conceptualisation. Mitig. Adapt. Strat. Glob. Chang. 2015, 20, 845–864. [Google Scholar] [CrossRef]
- Pant, R.; Thacker, S.; Hall, J.; Alderson, D.; Barr, S. Critical infrastructure impact assessment due to flood exposure. J. Flood Risk Manag. 2018, 11, 22–33. [Google Scholar] [CrossRef]
- Mühlhofer, E.; Koks, E.E.; Kropf, C.M.; Sansavini, G.; Bresch, D.N. A generalized natural hazard risk modelling framework for infrastructure failure cascades. Reliab. Eng. Syst. Saf. 2023, 234, 109194. [Google Scholar] [CrossRef]
- He, X.; Cha, E.J. Modeling the damage and recovery of interdependent civil infrastructure network using Dynamic Integrated Network model. Sustain. Resilient Infrastruct. 2018, 5, 152–167. [Google Scholar] [CrossRef]
- Murdock, H.J.; De Bruijn, K.M.; Gersonius, B. Assessment of Critical Infrastructure Resilience to Flooding Using a Response Curve Approach. Sustainability 2018, 10, 3470. [Google Scholar] [CrossRef]
- Schotten, R.; Bachmann, D. Critical infrastructure network modelling for flood risk analyses: Approach and proof of concept in Accra, Ghana. J. Flood Risk Manag. 2023, 16, e12913. [Google Scholar] [CrossRef]
- Bachmann, D. Contribution to the Development of a Decision Support System for the Assessment and Planning of Flood Protection Measures (Beitrag zur Entwicklung eines Entscheidungsunterstützungssystems zur Bewertung und Planung von Hochwasserschutzmaßnahmen). Ph.D. Thesis, RWTH Aachen, Aachen, Germany, 2012. [Google Scholar]
- Ani, U.D.; Watson, J.D.M.; Nurse, J.R.C.; Cook, A.; Maples, C. A review of critical infrastructure protection approaches: Improving security through responsiveness to the dynamic modelling landscape. In Proceedings of the Living Internet Things IoT 2019, London, UK, 1–2 May 2019; p. 15. [Google Scholar] [CrossRef]
- Ramachandran, V.; Long, S.; Shoberg, T.; Corns, S.; Carlo, H. Post-Disaster Supply Chain Interdependent Critical Infrastructure System Restoration: A Review of Data Necessary and Available for Modeling. Data Sci. J. 2016, 15, 1. [Google Scholar] [CrossRef]
- Schotten, R.; Mühlhofer, E.; Chatzistefanou, G.-A.; Bachmann, D.; Chen, A.S.; Koks, E.E. Data for critical infrastructure network modelling of natural hazard impacts: Needs and influence on model characteristics. Resilient Cities Struct. 2024, 3, 55–65. [Google Scholar] [CrossRef]
- German Federal Office of Civil Protection and Disaster Assistance (BBK). Definition of CI Hazards—KRITIS-Gefahren , BBK. Available online: https://www.bbk.bund.de/DE/Themen/Kritische-Infrastrukturen/KRITIS-Gefahrenlagen/kritis-gefahrenlagen_node.html (accessed on 30 May 2023).
- Petit, F.D.; Bassett, G.W.; Black, R.; Buehring, W.A.; Collins, M.J.; Dickinson, D.C.; Fisher, R.E.; Haffenden, R.A.; Huttenga, A.A.; Klett, M.S.; et al. Resilience Measurement Index: An Indicator of Critical Infrastructure Resilience; Argonne National Laboratory: Argonne, IL, USA, 2013. [Google Scholar]
- St-Laurent, G.P.; Oakes, L.E.; Cross, M.; Hagerman, S. R–R–T (resistance–resilience–transformation) typology reveals differential conservation approaches across ecosystems and time. Commun. Biol. 2021, 4, 1–9. [Google Scholar] [CrossRef]
- Gourbesville, P.; Batica, J. Flood Resilience Index—Methodology And Application. In International Conference on Hydroinformatics; CUNY Academic Works: New York, NY, USA, 2014. [Google Scholar]
- United Nations. Sendai Framework for Disaster Risk Reduction 2015–2030. 2015. Available online: https://www.undrr.org/publication/sendai-framework-disaster-risk-reduction-2015-2030 (accessed on 16 May 2023).
- Attems, M.; Thaler, T.; Genovese, E.; Fuchs, S. Implementation of property-level flood risk adaptation (PLFRA) measures: Choices and decisions. WIREs Water 2020, 7, e1404. [Google Scholar] [CrossRef]
- Meyer, H.; Hartmann, T. The FLOODLABEL as a social innovation in flood risk management to increase homeowners’ resilience. J. Flood Risk Manag. 2023, e12962. [Google Scholar] [CrossRef]
- de Bruijn, K.M.; Maran, C.; Zygnerski, M.; Jurado, J.; Burzel, A.; Jeuken, C.; Obeysekera, J. Flood Resilience of Critical Infrastructure: Approach and Method Applied to Fort Lauderdale, Florida. Water 2019, 11, 517. [Google Scholar] [CrossRef]
- de Almeida, B.A.; Mostafavi, A. Resilience of Infrastructure Systems to Sea-Level Rise in Coastal Areas: Impacts, Adaptation Measures, and Implementation Challenges. Sustainability 2016, 8, 1115. [Google Scholar] [CrossRef]
- Vamvakeridou-Lyroudia, L.; Chen, A.; Khoury, M.; Gibson, M.; Kostaridis, A.; Stewart, D.; Wood, M.; Djordjevic, S.; Savic, D. Assessing and visualising hazard impacts to enhance the resilience of Critical Infrastructures to urban flooding. Sci. Total. Environ. 2020, 707, 136078. [Google Scholar] [CrossRef]
- Lendering, K.; Jonkman, S.; Kok, M. Effectiveness of emergency measures for flood prevention. J. Flood Risk Manag. 2015, 9, 320–334. [Google Scholar] [CrossRef]
- Kreibich, H.; Bubeck, P.; Van Vliet, M.; De Moel, H. A review of damage-reducing measures to manage fluvial flood risks in a changing climate. Mitig. Adapt. Strat. Glob. Chang. 2015, 20, 967–989. [Google Scholar] [CrossRef]
- Anakhov, P.; Zhebka, V.; Grynkevych, G.; Makarenko, A. Protection of telecommunication network from natural hazards of global warming. East. Eur. J. Enterp. Technol. 2020, 3, 26–37. [Google Scholar] [CrossRef]
- Fröbel, J. Documentation of Typical Damages and Impairments Caused by Flood Events in Gas Supply, Derivation of Preventive and Acute Action Recommendations—Dokumentation von Typischen Schäden und Beeinträchtigungen durch Hochwasserereignisse in der Gasversorgung, Ableitung von vorbeugenden und akuten Handlugnsempfehlungen; DBI Gasund Umwelttechnik GmbH: Leipzig, Germany, 2003; Available online: https://www.dvgw.de/medien/dvgw/gas/sicherheit/hochwasser-dbi.pdf (accessed on 26 February 2024).
- Wricke, B.; Tränckner, J.; Böhler, E. Documentation of Typical Damages and Impairments of Water Supply Due to Flood Events, Derivation of Action Recommendations; German Association for Gas and Water—DVGW: Dresden, Germany, 2003; Available online: https://www.dvgw.de/medien/dvgw/gas/sicherheit/hochwasser-tzw.pdf (accessed on 26 February 2024).
- Kong, J.; Zhang, C.; Simonovic, S.P. Optimizing the resilience of interdependent infrastructures to regional natural hazards with combined improvement measures. Reliab. Eng. Syst. Saf. 2021, 210, 107538. [Google Scholar] [CrossRef]
- Kühne, L.M. Catalog of Measures for the Protection of Critical Infrastructure in the Event of a Flood—Maßnahmenkatalog Für den Schutz kritischer Infrastrukturen im Hochwasserfall. BSc. Thesis, University of Applied Sciences Magdeburg-Stendal, Magdeburg, Germany, 2022. [Google Scholar]
- German Federal Ministry of the Interior (BMI). Protection of Critical Infrastructures—Risk and Crisis Management—Guide for Companies and Authorities—Schutz Kritischer Infrastrukturen—Risiko—Und Krisenmanagement. In Leitfaden für Unternehmen und Behörden; Bundesministerium des Innern: Berlin, Germany, 2011; Available online: https://www.bbk.bund.de/SharedDocs/Downloads/DE/Mediathek/Publikationen/KRITIS/bmi-schutz-kritis-risiko-und-krisenmanagement.pdf?__blob=publicationFile&v=9 (accessed on 26 February 2024).
- German Federal Office for Civil Protection and Disaster Assistance (BBK). Stromausfall—Grundlagen und Methoden zur Reduzierung des Ausfallrisikos der Stromversorgung. 2019. Available online: https://www.bbk.bund.de/SharedDocs/Downloads/DE/Mediathek/Publikationen/WF/WF-12-stromausfall.pdf?__blob=publicationFile&v=6 (accessed on 26 February 2024).
- German Federal Ministry for Housing, Urban Development, and Building (BMWSB). Flood Protection Primer—Object Protection and Structural Precautions—Hochwasserschutzfibel—Objektschutz und bauliche Vorsorge. February 2022. Available online: https://www.fib-bund.de/Inhalt/Themen/Hochwasser/2022-02_Hochwasserschutzfibel_9.Auflage.pdf (accessed on 26 February 2024).
- Gläser, J.; Laudel, G. Expert interviews and Qualitative Content Analysis—Experteninterviews und Qualitative Inhaltsanalyse; VS Verlag: Zurich, Switzerland, 2010. [Google Scholar]
- Folkens, L.; Bachmann, D.; Schneider, P. Driving Forces and Socio-Economic Impacts of Low-Flow Events in Central Europe: A Literature Review Using DPSIR Criteria. Sustainability 2023, 15, 10692. [Google Scholar] [CrossRef]
- German Association for Water, Wastewater and Waste (DWA). Guideline DWA-M 103—Flood Protection for Sewage Systems—Merkblatt DWA-M 103—Hochwasserschutz für Abwasseranlagen. October 2013. Available online: https://shop.dwa.de/DWA-M-103-Hochwasserschutz-Abwasser-10-2013/M-103-PDF-13 (accessed on 21 February 2024).
- German Technical and Scientific Association for Gas and Water (DVGW). Technical Note—Guideline DVGW G 479 (M) Planning, Construction, and Operation of Gas Installations in Flood-Prone Areas—Technischer Hinweis—Merkblatt DVGW G 479 (M) Planung, Errichtung und Betrieb von Gasanlagen in Hochwassergefährdungsbereichen. February 2017. Available online: https://shop.wvgw.de/G-479-Merkblatt-02-2017/309853 (accessed on 5 May 2023).
- Assmann, A.; Beck, R.; Buschlinger, M.; Dörr, A.; Fuchs, L.; Göppert, H.; Göttlicher, J.; van Riesenbeck, G.G.; Hille, H.; Illgen, M.; et al. Heavy Rainfall and Urban Flash Floods—Practical Guide for Flood Protection—Starkregen und urbane Sturzfluten—Praxisleitfaden zur Überflutungsvorsorge; DWA: Heidelberg, Germany, 2013. [Google Scholar]
- Asaridis, P.; Molinari, D. A conceptual model for the estimation of flood damage to power grids. Adv. Geosci. 2023, 61, 1–21. [Google Scholar] [CrossRef]
- De Bruijn, K.; Hurk, B.V.D.; Slager, K.; Rongen, G.; Hegnauer, M.; Van Heeringen, K.J. Storylines of the impacts in the Netherlands of alternative realizations of the Western Europe July 2021 floods. J. Coast. Riverine Flood Risk 2023, 2. [Google Scholar] [CrossRef]
- OpenStreetMap Contributors. Planet Dump Retrieved from Planet OSM. 2017. Available online: https://www.openstreetmap.org/ (accessed on 16 May 2023).
- Bachmann, D. ProMaIDes—Knowledge Base & User Documentation. Available online: https://promaides.myjetbrains.com/youtrack/articles/PMID-A-7/General (accessed on 23 August 2023).
- Poirier, L.; Knox, P.; Murphy, E.; Provan, M. Flood Damage to Critical Infrastructure; National Research Council Canada: Ottawa, ON, Canada, 2022. [Google Scholar] [CrossRef]
- Koks, E.E.; van Ginkel, K.C.H.; van Marle, M.J.E.; Lemnitzer, A. Brief communication: Critical infrastructure impacts of the 2021 mid-July western European flood event. Nat. Hazards Earth Syst. Sci. 2022, 22, 3831–3838. [Google Scholar] [CrossRef]
- Meta—Data for Good. High Resolution Population Density Maps. Available online: https://dataforgood.facebook.com/dfg/docs/methodology-high-resolution-population-density-maps (accessed on 18 December 2023).
- Facebook. Stolberg (Rhld.)—Our City, Our Home—Unsere Stadt, Unsere Heimat Facebook. Available online: https://www.facebook.com/groups/659421950813305 (accessed on 1 August 2021).
- Sathurshan, M.; Saja, A.; Thamboo, J.; Haraguchi, M.; Navaratnam, S. Resilience of Critical Infrastructure Systems: A Systematic Literature Review of Measurement Frameworks. Infrastructures 2022, 7, 67. [Google Scholar] [CrossRef]
- Böhm, R. Chronicle detailing the progression of the floods of the Weißeritz and Elbe rivers in August 2002 within the territory of the state capital Dresden as observed by the municipal enterprise “Stadtentwässerung Dresden”—Chronik zum Verlauf des Hochwassers von Weißeritz und Elbe im August 2002 auf dem Territorium der Landeshauptstadt Dresden aus Sicht des Eigenbetriebes “Stadtentwässerung Dresden”. In State capital—Landeshauptstadt Dresden; Urban drainage—Stadtentwässerung Dresden: Dresden, Germany, 2003. [Google Scholar]
- World Bank and Asia Pacific Economic Cooperation. Financial Protection of Critical Infrastructure Services PreventionWeb. Washington, March 2021. Available online: https://www.preventionweb.net/publication/financial-protection-critical-infrastructure-services (accessed on 25 April 2024).
- Calcutt, E.; Ranger, N. Five Reasons You Should Be Thinking About Compounding Risks Now. Financial Protection Forum. Available online: https://www.financialprotectionforum.org/blog/five-reasons-you-should-be-thinking-about-compounding-risks-now (accessed on 25 April 2024).
- Emanuelsson, M.; McIntyre, N.; Hunt, C.; Mawle, R.; Kitson, J.; Voulvoulis, N. Flood risk assessment for infrastructure networks. J. Flood Risk Manag. 2014, 7, 31–41. [Google Scholar] [CrossRef]


| Interviewee’s Occupation | Sector of Expertise | ||||||
|---|---|---|---|---|---|---|---|
| Electricity | ICT | Freshwater | Wastewater | Gas | Other | ||
| 1 * | Technical director of a regional drinking water supply company | X | |||||
| 2 * | Managing director of the municipal utilities | X | X | X | |||
| 3 * | Managing director of the municipal utilities | X | X | X | |||
| 4 | Expert at the state ministry for energy supervision and energy regulation | X | X | X | |||
| 5 | Board member in an association of critical infrastructure operators | X | X | X | X | ||
| 6 | Independent international blackout and crisis preparedness expert | X | X | ||||
| 7 | Professor of electrical engineering with a focus on cable networks | X | |||||
| 8 * | Leader of the disaster management team of a telecommunications provider | X | |||||
| 9 * | Expert in system operations and the crisis Management Framework for a regional electricity, gas, and telecommunications network operator | X | X | X | |||
| 10 * | Team leader for network planning in a wastewater collection and treatment company | X | |||||
| * With experience in flood events | |||||||
| Electricity Generation and Distribution (A) | Information and Communication Technology (B) | Water Supply (C) | Wastewater Treatment (D) | Gas Supply (E) | Not-sector-specific, Overarching Measures(F) | |
|---|---|---|---|---|---|---|
| Impact (1) | Electricity and water are incompatible due to the high conductivity of water. The presence of water can compromise electrical insulation and increase the risk of electrical accidents. | Network node points on neighborhoodlevel can be active (glas fiber-based) or passive (copper based). The active once are running currents and therefore cause short circuits when flooded. Other components from bigger magnitude can be affected, exchange points, data centers or amplifiers. Telecommunication towers can be affected as well since they usually need a connection to the wired system and are also active–running currents. Satellite communication is not considered in detail Disruptions from mobile communication and landline services are possible. High dependency on functioning electricity supply. | Damaged or disrupted pumping stations cause pressure drop in the supply lines. This subsequently leads to the entry of foreign substances from outside into the pipeline system. Treatment plants are not prepared for additional pollutants that can be introduced by flooding. In case of flooding, well facilities near bodies of water (shore filtrate facilities) are damaged for an indefinite period. | Pumping stations for transferring wastewater fail (directly or due to power failure) - Waste water reservoirs overfill and float in public places Process control system fails due to power failure or internet failure Backwater causes water to penetrate electrical components of the wastewater treatment plant Waste water volume decreases by 50% in affected areas | The gas supply sector has a strong dependency on the availability of information and communication for their operations. Some assets are depending on electricity supply. Piping systems itself are usually not affected during flood events. Other punctual structures are affected by inundation. | Inundation causes disruption to all punctual assets across all sector. The difference is the height that structures and withstand and the vulnerability itself. For the electricity and waste water treatment sector the impact through flooding may lead to immediate health risk in the impacted areas. |
| Response (2) | Printout of network plans as a back-up option Prioritisation of response measures in specific areas and for assets of prioritized customers. In the event of faults, maintenance personal has to automatically show up at the control centre. Establish possibility to connect emergency power systems for priori-tised consumers. Release or disconnection (Freischaltung) of transmission facilities …to prevent uncontrolled situations. …to avoid fault current in installations that can be passed on to actually unaffected installations by parallel network routing. | In Germany telecommunication provider aim at measures to continue service for 48h after a disruption from electricity supply Wireless linking of masts, antennas etc to connect otherwise disrupted masts and antennas (Expensive and needs preparation to reserve frequencies). Bring in mobile wireless base stations which usually don’t have a power generation unit. X + 4-h rule is established to set the goal that 4 h after an incident is reported a providers has to restore functionality. It is considered the threshold, depending on specific incident characteristics. | Coordinated emergency meeting points and procedures in case of disturbance scenarios. Definition of a priority list for protection and replacement facilities. Mobile and stationary emergency power supply systems can restore either electricity or water supply in emergencies (generators, pumps, combined pump-power systems). | Backup emergency systems Mobile deployment and activation of power generators and waster water pumps. Utilization of fuel reserves. Dispatching of flush-suction vehicles. Shifting communication to dedicated frequency networks. Creation of blackout plans, flood scenario checklists, and plan lists. | Timely activation of important service providers for the gas operators. Sending out prewritten texts or information to end users and network partners Demanding the electricity shut-off for endangered or impacted assets from electricity supplier. The gas pipelines function as their own storage. Disruptions in the supply structure can be compensated for a while through the remaining gas pressure in the system. | Possibility to easily connect network replacement components to assets. Availability and staff for the installation of network replacement units (Generators, pumps, ICT systems). Technical maintenance staff gathers in predefined meeting points during disruptive events. Priority lists for response measures. |
| Recovery and Rehabilitation (3) | Prioritisation of recovery measures in specific areas and for specific vulnerable infrastructures: Administration buildings, clinics, hospitals and old people’s homes (possibly police). Provision of reserve capacities | Active cable nodes have to be repaired with sufficient personal and material. Passive cable nodes only need to be cleaned and dried. From response measures to reconstruction–dismantling of backup power systems. Using post-event analysis of hazard situations to improve reporting channels and documentation procedures. | Ventilation and de-aeration at hydrants. Opening of closing sluises | Prioritised draining of treatment plan areas and pump stations within the catchment area of treatment plant. Set-up of internal communication network and connection of process control room to landline. Restoration of electricity supply. Demand assessment and procurement of emergency power generators and pumps. Obtaining external capacities for the drying of electric motors for pumping stations. Opening manual flood barries. Overhauling of dirty pumps, electric motors, and control cabinets. Maintaining the operation of the pumping stations within the urban area until flooding or evacuation of the site/catchment area. Minimizing damages for the quickest possible resumption of operations. | Drainage of affected pipeline sections at the lowest points using suction pumps, so called pipeline pigs or the inlet of gas under sufficient pressure. Inspection and control of special structures (e.g., ducts), measurement and control technology in all pressure zones Ventilation of affected network components. | Priority lists for recovery measures. |
| Prevention and Mitigation (4) | Culverting of supply lines instead of routing them underneath bridges Flood adapted components: Pressurised water-tight cable entries, Oil-immersed transformer cooling systems which are usually waterproof. HQ100 as a boundary for construction of equipment Or otherwise increase of facilities to HQ100 height + x Strategically placed mobile flood protection systems: flood defence walls, flood barrier systems such as the beaver system. Purchase and regularly check and operate standby power systems. Overlapping of service areas to decrease Communication Back-Ups: Setting up a company radio system in the area of influence of grid operator Regular training and use of the company radio system by employees Acquisition of satellite radio to enable communication between different supply levels of the power supply network | Elevating node junctions (KVz) or Multifunctional casing (MFG). Rerouting of physical network. Protection through flood barriers of masts and antennas for which a repositioning is not possible Including batteries in mast systems which can operate 8–12 h with battery usage, though it is not possible for many masts since the energy demand of mast operations currently exceeds the battery capacities. Insurance risk maps are used to identify facilities that require additional protective measures or the rerouting of cables (reinsurance) with cost vs. Damage functions. | Locating water supply facilities out of areas likely to be impacted by flooding. Ensure possibility to connect emergency power generators for pressure boosting systems. Elevation of facilities and replacement facilities. Detachment from indispensable ICT dependency and training of the team for the handling of manual control measures. Digital infrastructure is only optional. Monitoring and remote control are connected to the internet but are not necessary for functionality. Redundancy can be strengthened by establishing connections between different supply networks that compensate for the disruption of procurement or treatment facilities. | Installation of backflow preventers. Positioning of fixed backup pumps in designated areas. Additional protective measures for facility buildings: Waterproofing, protective dikes, installation of barriers. Expansion and elevation of the medium-voltage system. Increasing availability of maintenance and repair staff by sensitisation for individual prevention and mitigation measures on individual level. | Routing of pipelines not parallel to river flow directions. Placement of water construction elements and gabions to prevent scouring due to increased flow velocities. Segmentation of local networks through the regular installation of shutdown and control systems to minimize the impact of outages in a small area. Sufficient elevation or enclosurement of network assets. No or cautious placement of structures within flood prone areas. | Rerouting of linear structures to prevente routing along the river body or replacing punctual CI assets in flood risk areas. Elevating or protecting critical components of CI assets vulnerable to inundation. Placement of water construction elements and gabions to prevent scouring due to increased flow velocities. Increasing the number of connections to other network islands to better compensate service disruptions caused by high level impacts. |
| Preparedness (5) | Layperson-operable emergency equipment Storing of spare transformators for each transformation level from highest voltage level, high voltage level and medium voltage level to the low voltage level. This can significantly reduce the recovery time after an event, but also leads to buying of peak in case of a large scale event. On the other side this leads to higher costs which are in case of no event not compensated and normal ongoing maintenance works are prevented monetarily. Sensitisation for decreasing availability–adaptation measure for potentially affected populations Sandbags Storage of sandbags Identification of particularly suitable properties for storage with sandbags Preparation of information to share with public if needed Prepare crisis management committee and personel Define a permanently staffed disaster response team including… the provision of two rooms (communication & consultation/organisation) the provision of food or the activation of such Frequent Preparation and training courses Training on documentation communication and assembly protocols for legal responsibility Printout of network plans as a back-up option Stockpiling of mobile switchgear and emergency power systems | Inform public to charge mobile phones and have a battery radio available. Encouraging a bigger pool of network replacement units (telecommunication and electricity), spare parts warehouses and stockpiling. Close collaboration with meteorological services, regular checks of the ELVIS flood portal are carried out by employees. Mobile response units conduct patrol services capable of installing sandbags. | Emergency management teams should be staffed with CI operators. Preparation of communication channels as backups. (satellite phones, internal communication networks, radio) Definition of measuring points for flood water depths or other factors important for the operator in advance. Stocking of sand, sandbags and the communication about their availability. Arrangement of object protection contractors for facilities. Clarification of access authorization for vehicles before a flood event. | Activation of manual backflow preventers. | Preparation of scenario cases to train staff on services disruptions Storage of flood inundations maps which should be validated in adapted based on new events Obtaining special rights for operational response teams and their vehicles. Inclusion of gas supply sector in crisis management committees. | Including CI operators in crisis management comitees. Organising the availability, operability of mobile flood defenses or sandbags. Previous communication with service providers withrelevant during crisis response and recovery (security firms, technical contractors, administration of permits for maintenance vehicles e.g.) regarding capacities and access permissions. Regional networking of critical infrastructure operators to enhance readiness with backup systems and fuel reserves. |
| Sector | Sector Level Assets | Number of Elements | Element Attributes | |||
|---|---|---|---|---|---|---|
| Point | Polygon | Connector | Threshold [m] | Repair Time [d] | ||
| Electricity | High voltage level transformation | 35 | 0 | 2034 | 0.5 | 365 |
| Low voltage level transformation | 735 | 735 | 0.2 | 30 | ||
| Information and communications technology | Exchange points | 45 | 45 | 1141 | 0.1 | 100 |
| Telecommunication mast | 138 | 138 | 0.1 | 100 | ||
| Data centre | 3 | 0 | 0.1 | 100 | ||
| Freshwater | Procurement, treatment, distribution facilities | 22 | 22 | 235 | 0.1 | 100 |
| Wastewater | Wastewater treatment | 29 | 29 | 242 | 0.1 | 180 |
| Gas supply | Measurement, control and regulation facilities | 11 | 11 | 48 | 0.3 | 75 |
| Emergency services | Police | 12 | 12 | 115 | 0.2 | 365 |
| Fire services | 68 | 68 | 0.2 | 365 | ||
| Ambulances | 12 | 12 | 0.2 | 365 | ||
| Technical relief | 23 | 23 | 0.2 | 365 | ||
| Health | Hospitals | 35 | 35 | 159 | 0.2 | 365 |
| Care centers | 124 | 124 | 0.2 | 365 | ||
| Governmental institutions | Public administration/penal institutions | 55 | 55 | 55 | 0.1 | 365 |
| Total/Average | - | 1347 | 1309 | 4029 | 0.19 | 240 |
| Return Period T | Unit | T100 | T1000 | T10,000 |
|---|---|---|---|---|
| Probability of Occurence phyd | [1/a] | 1.45% | 0.495% | 0.055% |
| Tributary 1 | [m3/s] | 67.66 | 97.05 | 125.72 |
| Tributary 2 | [m3/s] | 18.20 | 26.10 | 33.82 |
| Tributary 3 | [m3/s] | 43.49 | 62.38 | 80.81 |
| Tributary 4 | [m3/s] | 16.14 | 23.16 | 30.00 |
| Tributary 5 | [m3/s] | 14.50 | 20.79 | 26.94 |
| Return Period | Failure Type (Electricity/ICT/Freshwater/Other) | |||
|---|---|---|---|---|
| Direct | Sectoral | Transsectoral | Total | |
| T100 | 3 | 0 | 0 | 3 |
| (0/0/0/3) | (0/0/0/0) | (0/0/0/0) | (0/0/0/3) | |
| T1000 | 6 | 9 | 21 | 36 |
| (1/1/0/4) | (6/3/0/0) | (0/2/1/18) | (7/6/1/22) | |
| T10,000 | 7 | 9 | 21 | 37 |
| (1/1/0/4) | (6/3/0/0) | (0/2/1/18) | (0/2/1/18) | |
| Number | Sector | Disrupted Point Element | Measure Description | Model Implementation | Reference to Cells in Table 2 |
|---|---|---|---|---|---|
| I. | Electricity | Substation | Storing of spare parts such as transformers for shorter duration of repair work | Decreased recovery time = 30 d | A5/F5 |
| II. | Electricity | Substation | Elevation of substation including pressurized water-tight cable entries | Increased threshold = 1 m | A4/F4 |
| III. | ICT | Exchange point | Redundant power supply from unaffected area | Redundant power supply from low transformation area in unaffected area | B4/F4 |
| IV. | ICT | Telecommunication mast | Water-proof cable inlets and elevated | Increased threshold = 0.5 m | B4/F4 |
| V. | Freshwater | Freshwater treat- ment facility | Network replacement unit to decrease disruption time from power cut (fuel storage 48 h) | Decreased recovery time = X − 2 d | C2/F2 |
| Measure/Scenario | Electricity | Difference | ICT | Difference | Freshwater | Difference | Health | Difference | Social | Difference | Total | Difference |
|---|---|---|---|---|---|---|---|---|---|---|---|---|
| Risk—Disrupted Population RCI [people × days/a] | ||||||||||||
| Current situation | 37,099 | - | 81,404 | - | 83,897 | - | 570,418 | - | 110,429 | - | 883,248 | - |
| Measure I. | 3049 | 34,050 | 14,113 | 67,292 | 6896 | 77,001 | 289,602 | 280,816 | 42,043 | 68,386 | 355,703 | 527,545 |
| Measure II. | 0 | 37,099 | 8086 | 73,318 | 0 | 83,897 | 264,455 | 305,963 | 35,919 | 74,510 | 308,460 | 574,787 |
| Measure III. | 37,099 | 0 | 29,694 | 51,711 | 83,897 | 0 | 566,244 | 4174 | 110,429 | 0 | 827,363 | 55,885 |
| Measure IV. | 37,099 | 0 | 73,318 | 8087 | 83,897 | 0 | 570,418 | 0 | 110,429 | 0 | 875,161 | 8087 |
| Measure V. | 37,099 | 0 | 81,404 | 0 | 83,438 | 459 | 570,418 | 0 | 110,429 | 0 | 882,789 | 459 |
| Risk—Disrupted Population Time RCI,Pop [people/a] | ||||||||||||
| Current situation | 102 | - | 282 | - | 230 | - | 1563 | - | 303 | - | 2479 | - |
| Measure I. | 102 | 0 | 282 | 0 | 230 | 0 | 1563 | 0 | 303 | 0 | 2479 | 0 |
| Measure II. | 0 | 102 | 81 | 201 | 0 | 230 | 725 | 838 | 98 | 204 | 904 | 1575 |
| Measure III. | 102 | 0 | 140 | 142 | 230 | 0 | 1551 | 11 | 303 | 0 | 2325 | 153 |
| Measure IV. | 102 | 0 | 201 | 81 | 230 | 0 | 1563 | 0 | 303 | 0 | 2398 | 81 |
| Measure V. | 102 | 0 | 282 | 0 | 230 | 0 | 1563 | 0 | 303 | 0 | 2479 | 0 |
Disclaimer/Publisher’s Note: The statements, opinions and data contained in all publications are solely those of the individual author(s) and contributor(s) and not of MDPI and/or the editor(s). MDPI and/or the editor(s) disclaim responsibility for any injury to people or property resulting from any ideas, methods, instructions or products referred to in the content. |
© 2024 by the authors. Licensee MDPI, Basel, Switzerland. This article is an open access article distributed under the terms and conditions of the Creative Commons Attribution (CC BY) license (https://creativecommons.org/licenses/by/4.0/).
Share and Cite
Schotten, R.; Bachmann, D. Cataloging and Testing Flood Risk Management Measures to Increase the Resilience of Critical Infrastructure Networks. Smart Cities 2024, 7, 2995-3021. https://doi.org/10.3390/smartcities7050117
Schotten R, Bachmann D. Cataloging and Testing Flood Risk Management Measures to Increase the Resilience of Critical Infrastructure Networks. Smart Cities. 2024; 7(5):2995-3021. https://doi.org/10.3390/smartcities7050117
Chicago/Turabian StyleSchotten, Roman, and Daniel Bachmann. 2024. "Cataloging and Testing Flood Risk Management Measures to Increase the Resilience of Critical Infrastructure Networks" Smart Cities 7, no. 5: 2995-3021. https://doi.org/10.3390/smartcities7050117
APA StyleSchotten, R., & Bachmann, D. (2024). Cataloging and Testing Flood Risk Management Measures to Increase the Resilience of Critical Infrastructure Networks. Smart Cities, 7(5), 2995-3021. https://doi.org/10.3390/smartcities7050117