Article

Effects of Biochar Type on the Growth and Harvest Index of Onion (Allium cepa L.)

1
Carrera de Ingeniería Agrícola, Escuela Superior Politécnica Agropecuaria de Manabí Manuel Félix López, Calceta 130601, Ecuador
2
Área de Ecología, Facultad de Ciencias, Campus de Rabanales, Universidad de Córdoba, 14071 Córdoba, Spain
*
Author to whom correspondence should be addressed.
AgriEngineering 2024, 6(2), 1568-1580; https://doi.org/10.3390/agriengineering6020089
Submission received: 12 April 2024 / Revised: 14 May 2024 / Accepted: 16 May 2024 / Published: 30 May 2024

Abstract

:
This study examined using peanut shells, rice husks, and cocoa husks as soil conditioners to boost yields in Allium cepa var. Alvara onions. Three types of biochar and four application rates (1%, 1.5%, 3%, and 5%) were compared to a control with no biochar. The biochars had different nutrient makeups, with cocoa husk biochar (CHB) containing the most essential elements. While overall plant growth (height, leaves, and roots) was not significantly affected (p > 0.05) by any biochar type compared to the control, some plant parts responded differently. CHB (5%) and peanut husk biochar (PHB) (1%) yielded the tallest onion plants (71 and 65 cm), while 1% rice and cocoa biochar resulted in the shortest (below 42 cm). PHB (3% and 5%) produced the longest roots (9 cm), while 1.5% rice husk biochar (RHB) had the shortest. Biochar application had no significant effect on leaf count. However, specific application rates of RHB and PHB increased the harvest index (HI), indicating more efficient yield allocation. HI values > 0.85 were obtained with specific biochar rates (e.g., 1.0–1.5% PHB, 1.5–5% RHB, or 5.0% CHB).

1. Introduction

The onion (Allium cepa L.) is a globally significant vegetable crop with high economic value. It can be grown under a wide range of climates, from temperate to tropical, and has a worldwide production of 46.7 million tons of bulbs from 2.7 million hectares [1]. Onions are notable for their nutrient density, low-calorie content, and good source of essential bioactive components such as polyphenols, flavonoids, organosulfurs, ascorbic acid, and carbohydrate prebiotics [2,3]. While ideal onion yields require precise watering, water scarcity due to climate change can significantly reduce onion size, leaf growth, and overall yield (19–28%) by limiting photosynthesis, stomatal conductance, and plant productivity, especially in arid and semi-arid regions [4,5]. Farmers globally are noticing increased crop vulnerabilities due to the effects of climate change, such as rising temperatures and decreased rainfall [6]. Water scarcity, poor irrigation water quality, high temperatures, and evaporation in arid regions are causing rising soil salinity in irrigated lands, demanding innovative methods to manage water stress, salinity, and improve crop growth [7,8]. Biochar, as a promising soil amendment, can improve moisture retention, fertility, and plant properties, potentially mitigating the negative effects of water stress and salinity on crop growth and yield [4,9].
Made from organic waste through pyrolysis, biochar offers a circular economy approach to food security and environmental issues by enriching soil, reducing waste, mitigating climate change, and even generating energy [9,10,11,12,13,14]. By improving nutrient holding, soil structure, and microbial activity, incorporating biochar into soil offers a promising solution for boosting plant growth and yield. Biochar, consisting of C, H, O, Mg, and crucial macronutrients such as N, P, and K, serves as a valuable addition to enhance crop production due to its high charge density [15,16,17,18]. The influence of biochar applications on soil properties and crop responses varies depending on factors such as feedstock source, application rates, and pyrolysis temperature. Specifically, biochar produced at 400–500 °C enhances crop productivity, while biochar produced at temperatures exceeding 600 °C results in decreased crop productivity [19]. Biochar can be produced from a wide range of organic materials, including poultry litter, rice husk, and even wastewater solids [20,21,22]. Biochar application in research varies considerably, ranging from low rates of 5–15 t ha−1 (around 0.5% of soil weight) to much higher amounts of 300–600 t ha−1 (2–10% of soil weight), with 15 t ha−1 (5% of soil weight) being the most frequently used rate [23,24]. Studies in northern Laos showed that combining biochar from wood residues (4–8 t ha−1) with nitrogen fertilizer significantly enhanced upland rice yield compared to fertilizer alone [25]. Examining the impact of combining inorganic fertilizers and biochar showed that, within the short-term (1 year) and with biochar applications ≤ 20 t ha−1, the combination with inorganic fertilizer resulted in an average yield increase of ≥15% compared to the use of fertilizer alone in tropic, subtropic, and temperate zones [26,27]. Biochar reduces soil acidity, enhances soil fertility, decreases the need for fertilizers, and supports root growth and nitrogen utilization [28]. Short-term liming value, particularly in low-pH soils, influences this effect, with additional benefits observed in soils with small cation exchange capacity, organic carbon content, and sandy texture [27,28,29].
The beneficial effects of various biochars on crop production stem from their unique properties. Cocoa shell biochar (CSB) reduces soil acidity, benefiting maize and cayenne pepper growth [16,29]. Additionally, rice husk biochar (RHB) positively influences plant development, reduces cadmium accumulation in wheat, and promotes resistance to Spodoptera exigua in shallots [30,31]. RHB processed at 700 °C effectively raises soil pH by reducing aluminum levels in acidic soils [19]. However, the impact of RHB depends on soil texture. For instance, a 1% RHB application did not affect alkalinity in tropical Alfisols [32]. Biochar, enriched with various nutrients like C, N, Ca, Mg, K, and P depending on its origin, also improves soil properties like cation exchange capacity, fostering better nutrient availability for plants [18]. Peanut shell biochar (PSB), with its porous structure and high surface area, improves several parameters in low-fertility soils, like saline-sodic paddy fields [19,32,33,34,35].
Plant traits, encompassing diverse characteristics like size, shape, and chemical composition, act as a coordinated system, adapting to environmental conditions through trade-offs and influencing vital functions like carbon gain, ultimately shaping ecological strategies and properties [33,34]. Plant allocation patterns can indicate or predict how plants respond to biochar-induced soil changes, with biomass often favoring roots when facing below-ground limitations and shoots [35]. High biochar application rates have been shown to enhance fine root growth, as reflected by increased specific root length, reduced root diameter, and lower root tissue mass density, potentially improving plant fitness and performance regardless of fertilization levels [8,9,35,36,37].
Building on prior research demonstrating biochar’s potential to enhance plant growth and reduce disease [38], this study addresses a key knowledge gap: the optimal application rate. Since biochar properties vary significantly, a one-size-fits-all approach is not feasible [39]. Therefore, this investigation explored the interplay between biochar type (rice, cocoa, and peanut husks), application rate, and the functional traits of Alvara onions. The tested hypothesis proposed a positive impact of moderate application on growth and functional traits, while exceeding the optimal level was predicted to have negative consequences. By assessing the impact of these diverse biochars on onion functionality, this study aimed to unlock the full potential of biochar for sustainable onion production.

2. Materials and Methods

2.1. Soil Characteristics

The experiment utilized Fluvisol soil obtained from the top 20 cm of existing onion fields in Ecuador. This clay silt loam soil had a composition of 16.8% sand, 49.6% silt, and 33.6% clay with a bulk density of 1.26 g cm−3. The research was conducted in a greenhouse under semi-controlled conditions at the Escuela Superior Politécnica Agropecuaria de Manabí Félix López (ESPAM MFL) in Calceta, Ecuador, using Allium cepa variety ‘Alvara’ onions.

2.2. Biochar Production

Three types of biochar were produced from cocoa (Theobroma cacao L.), rice (Oryza sativa L.), and peanut (Arachis hypogaea L.) husks using a custom-built pyrolysis apparatus based on the design of an Anila stove. The pyrolysis process reached a maximum temperature of 550 °C for two hours. All the raw materials were ground to a powder with a mesh size smaller than 2 mm using a stainless-steel mill (model SK100, Retsch, Haan, Germany) before being used in the experiment. A total of 3780 g of each material was used.
Biochar characterization was performed according to standard AOAC methods using atomic absorption, titration, gravimetry, and spectrophotometry [40]. To prepare the biochar samples for nutrient analysis, they were dried to 0% moisture and then crushed to obtain a 40 mesh size. Subsequently, the samples were incinerated at 700 °C and diluted in a 3:1 mixture of hydrochloric acid and nitric acid [41].

2.3. Pot Experiment

The experiment utilized 5 kg capacity, unperforated pots (6 L volume, 25 cm height, 18.5 cm diameter) filled with field soil from local onion production areas (16.8% sand, 49.6% silt, 33.6% clay). To improve germination, three ‘Alvara’ onion seeds were initially planted per pot, with later thinning to one healthy plant per pot. The greenhouse maintained an average temperature of 25.7 °C with a standard deviation of 4.3 °C and a relative humidity of 80.2% ± 1.2%. Biochar was thoroughly mixed with the soil to achieve a final weight of 4 kg per pot. Irrigation was applied every 2–3 days to maintain optimal soil moisture for onion growth, avoiding overwatering.
The experiment investigated the effects of three biochar types (factor A) applied at four rates (factor B): 1.0, 1.5, 3.0, and 5.0% of the soil volume. A control group received no biochar amendment. After 90 days, plant height was measured, and the above-ground parts were separated into roots, leaves, and pseudo-stems for analysis.

2.4. Data Collection

Plant growth and harvest parameters were assessed to evaluate the effects of the treatments. Physiological maturity, defined as the time taken for 70% of plants in each pot to exhibit a fallen neck, was recorded [42,43]. Additionally, plant height (measured from soil surface to the tip of the most mature leaf) and root length were determined 90 days after transplanting using calipers [4,43,44]. The average number of leaves per plant was also recorded at 90 days.
The dry weight of the plant organs, including pseudo-shoots (DPW), roots (DRW), and bulbs (TBW), was determined by separating the organs, washing them with tap water to remove soil particles, air-drying them for 3 h, and then oven-drying them at 70 °C for 48 h [45]. Harvest index (HI), a measure of the proportion of biomass allocated to the harvested organs (yield, Y) compared to the total biomass (B) produced by the plant, was also calculated. In this study, HI was specifically calculated as the ratio of bulb dry weight (TBW) to the total dry plant biomass (TDP) [4,43,46].

2.5. Data Analysis

The study employed statistical analysis to evaluate the impact of the different treatments. Descriptive statistics, including means and standard deviations, were used to understand the behavior of the variables. Following verification of assumptions, a one-way analysis of variance (ANOVA) was conducted at a 5% significance level to compare the treatments. Additionally, a two-way ANOVA at the 5% level was performed to analyze interactions between factors. Tukey’s test was used to identify significant differences between treatments, factors, and their interactions. Additionally, contrasts were employed to compare the factors with the control group.

3. Results

3.1. Biochar Characteristics

Table 1 details the properties of the biochar produced from CHB, RHB, and PHB. The feedstock variation significantly impacts biochar composition. For instance, CHB exhibits a higher pH and electrical conductivity (EC) compared to RHB and PHB. The chemical analyses of the PHB revealed an organic matter value (74.2%) higher than RHB (51.8%) and CHB (66.8%). In terms of the C/N relationship, the highest value (39) was for rice biochar rather than cocoa (30) and peanut (34). The major content of P, K, Mg, Ca, Zn, and B was for CHB, while PHB had the highest concentrations of Na, Fe, Mn, and Cu.

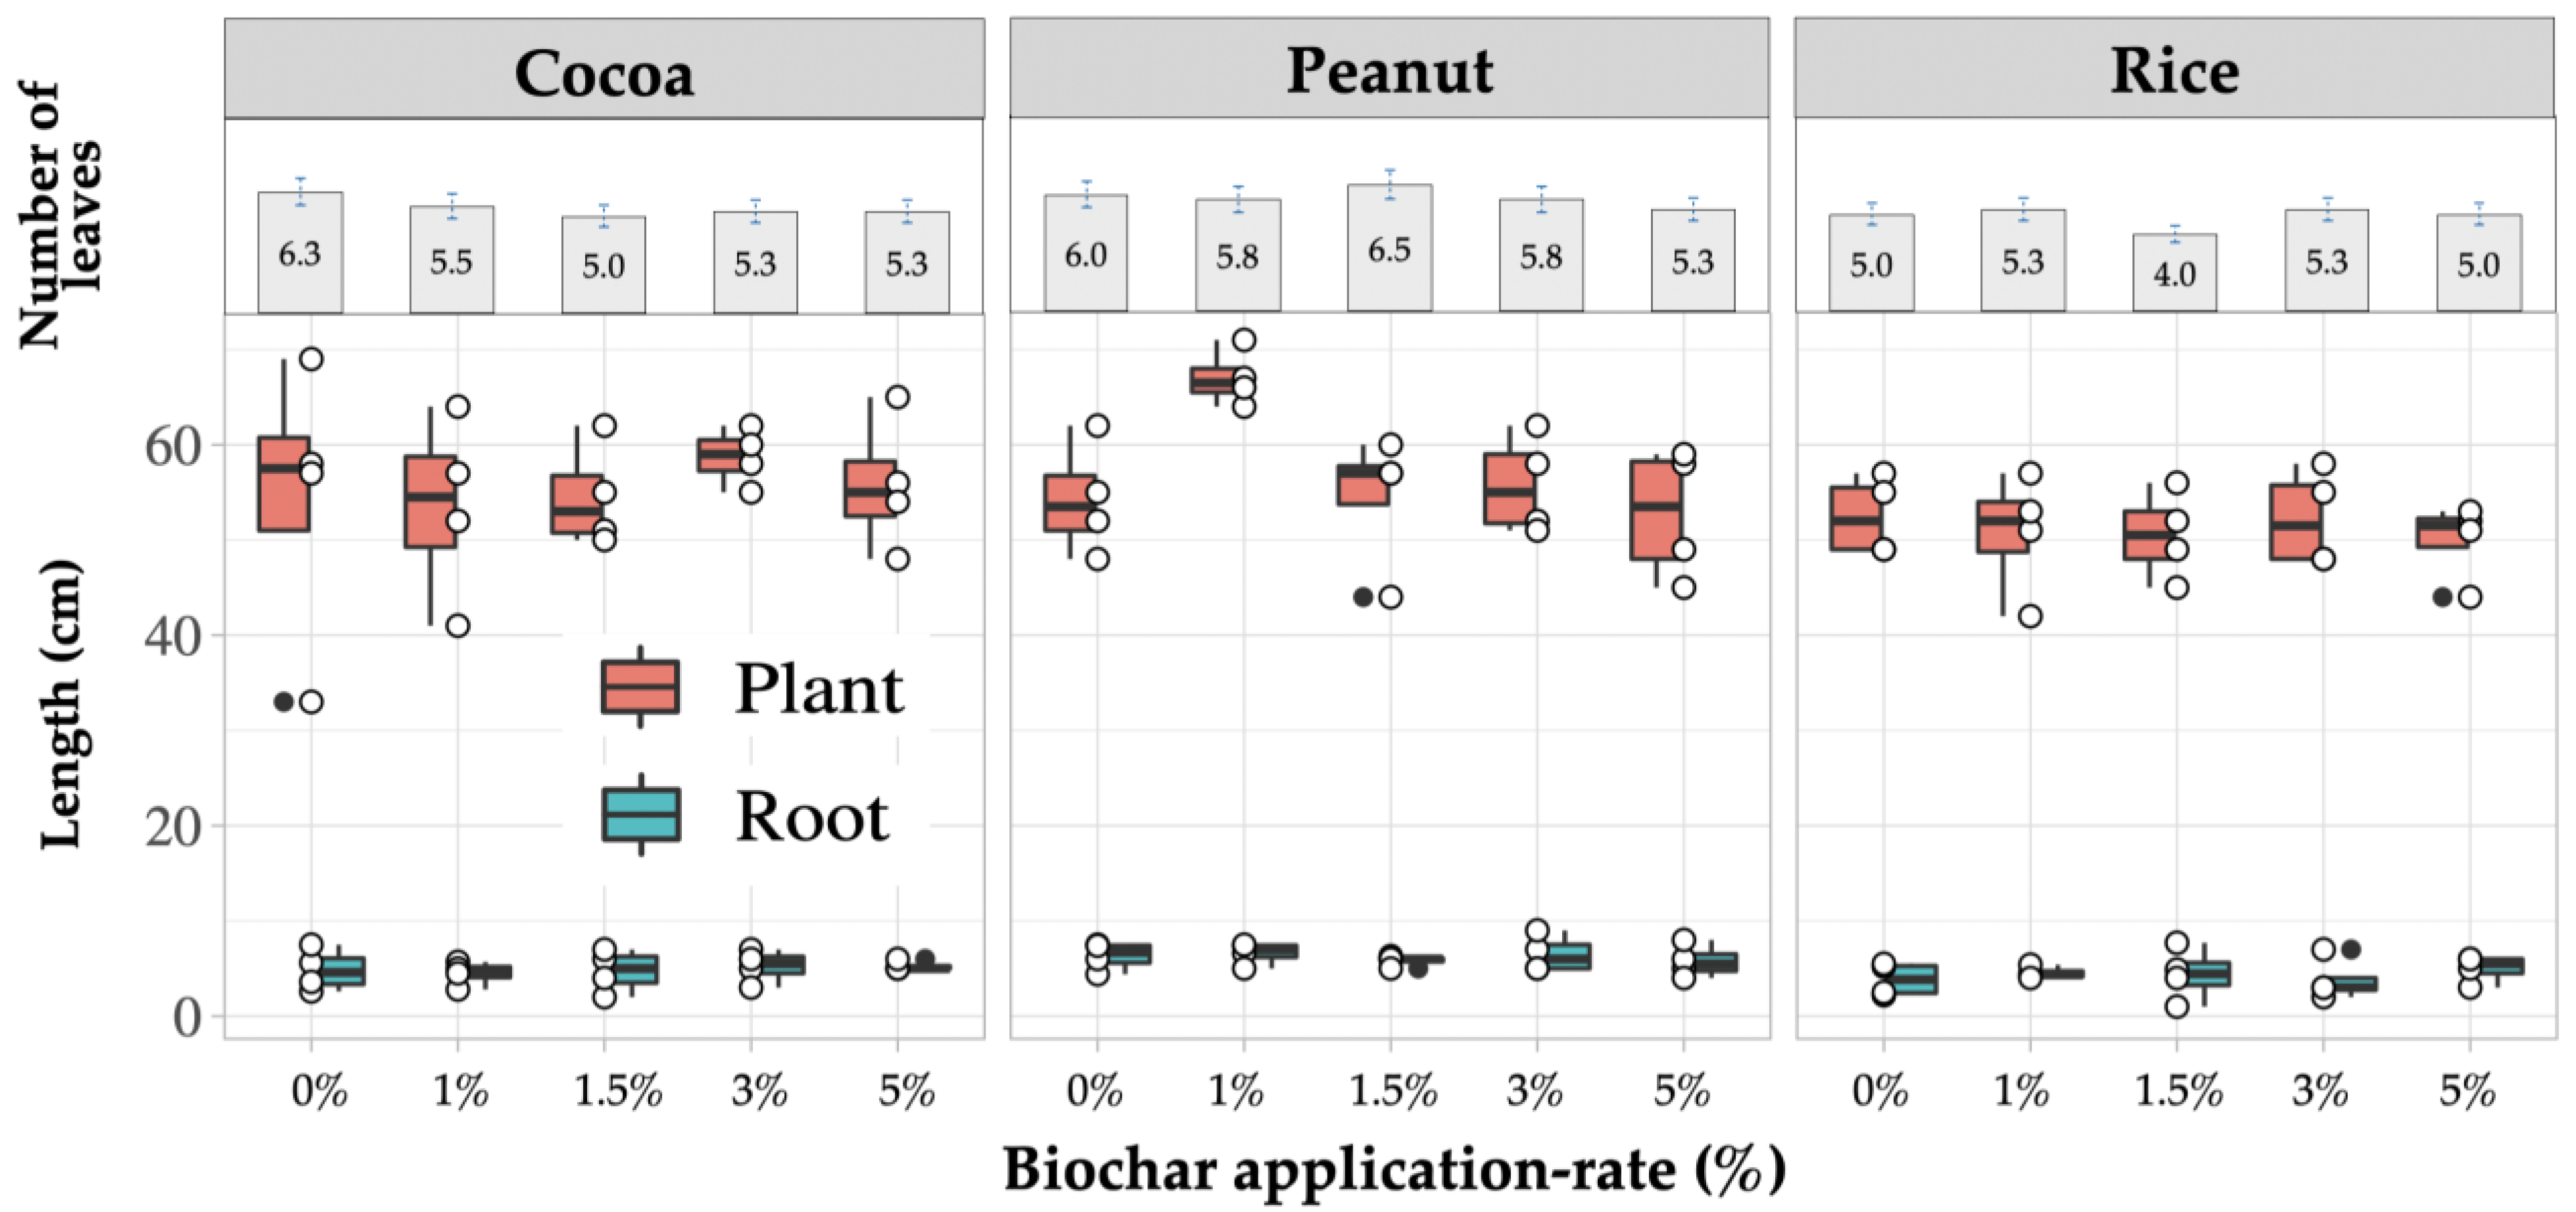
3.2. Biochar Effects on Plant and Root Length

Figure 1 utilizes boxplots to illustrate the distribution of onion plant and root lengths across various biochar treatments (cocoa, peanut, and rice husks) applied at different rates (0% to 5%). Each box displays the middle 50% of the length data, with the center line representing the median value. The whiskers extend outwards, capturing data points within 1.5 times the interquartile range (IQR), which reflects the spread between the upper and lower halves of the data set. Outliers, which are values beyond the whiskers, are shown as individual circles. Additionally, Figure 1 presents the number of leaves per onion plant for each treatment, demonstrating no significant variation across different biochar application rates.
According to Figure 1 and Table 2, different biochar types significantly (p < 0.05) affected plant height and root length, with cocoa and peanut biochars having the most pronounced influence. Plant height reached a maximum of 71 cm with 5% CHB and 65 cm with 1% PHB, while the lowest values (below 42 cm) were observed with 1% RHB and CHB. Root length peaked at 9 cm with 3% and 5% PHB, while 1.5% RHB resulted in the shortest roots. Biochar application, regardless of type or rate, did not significantly (p > 0.05) affect the number of leaves per plant. While each biochar type and application rate differed statistically among themselves, none of the biochar treatments showed significant differences (p > 0.05) compared to the control group in terms of plant height, leaf number, or root length.
Despite statistical differences between biochar types and application rates, none of these treatments significantly affected plant growth parameters (number of leaves, plant height, and root length) when compared to the control group.

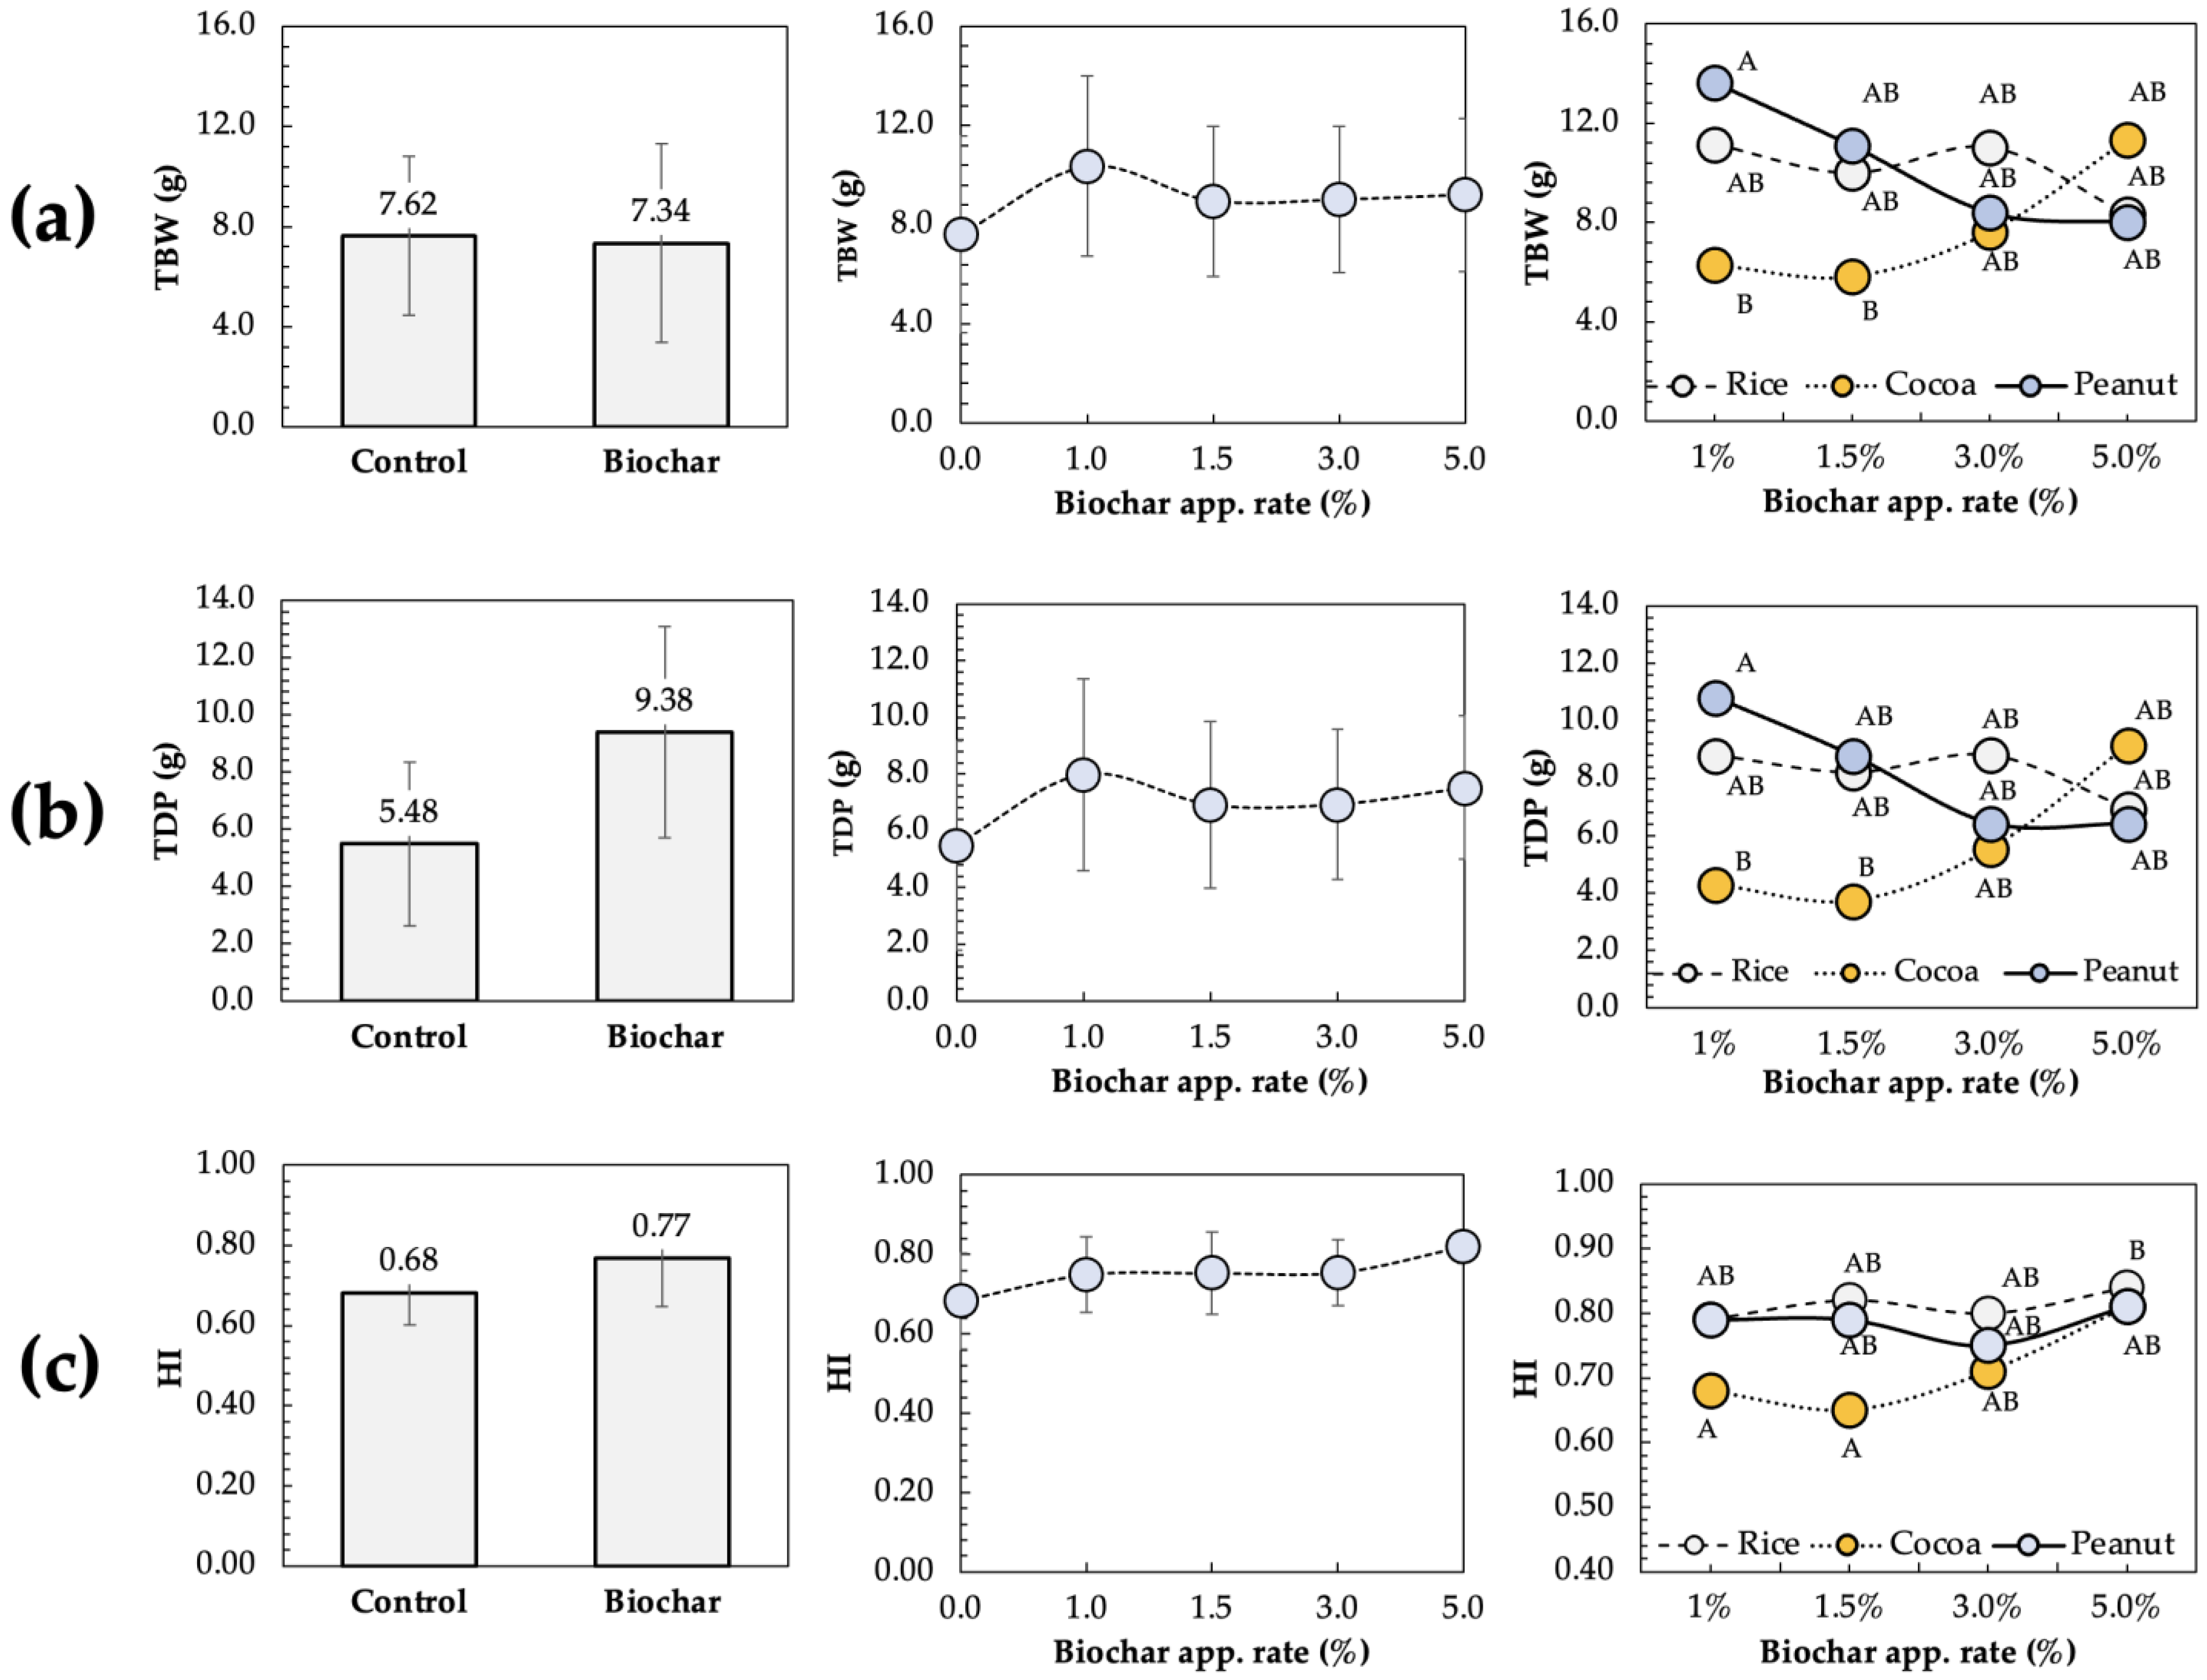
3.3. Biochar Effects on Dry Weight

The study evaluated plant growth by measuring the total dry weight of the entire onion plant, including pseudo-shoots, roots, and bulbs. This data (presented in Table 3 and Figure 2) revealed significant differences in dry weight between control plants and those treated with biochar. Overall, biochar application had a significant impact on the dry weight of most onion organs.
According to Table 3, biochar application significantly impacted the dry weight of pseudo-shoots, bulbs, and total plant biomass (p < 0.05). This finding suggests that biochar addition demonstrably influenced the growth of these plant components when compared to the control group (no biochar). According to the harvest indexes presented in Figure 2, the highest HI values > 0.85 were for the application rate of 1.5% of PHB, and application rates of 1.5 and 5.0% of RHB. CHB application rates between 1.0% and 3.0% resulted in slightly higher average HI values (up to 0.68) compared to the control (0.63). At a 5.0% application rate, HI values significantly increased to 0.84.
According to the results, biochar application increases TBW, TDP, and HI (Figure 2 and Figure 3), compared to the control group (0% biochar application). All three parameters (TBW, TDP, and HI) showed a positive trend with increasing biochar application rates. This suggests that the addition of biochar had a positive impact on onion yield. The effect of biochar application might not be linear as Figure 3 shows varying responses in dry weight and harvest index depending on the biochar application rate.
Figure 2 and Figure 3 reveal that biochar application significantly increased TBW, TDP, and HI compared to the control group (no biochar). There was a positive correlation between all three parameters (TBW, TDP, and HI) and increasing biochar application rates, suggesting a beneficial effect of biochar on onion yield. However, Figure 3 indicates that this relationship might not be perfectly linear, with varying responses in dry weight and harvest index depending on the specific biochar application rate. For example, while TBW shows a steady increase with increasing application rate, TDP seems to peak at the medium application rate (1.5%), and HI shows a slight decrease at the highest application rate (5%). This suggests that there might be an optimal application rate for maximizing these growth parameters. When utilizing CHB, the highest dry weight values were achieved with a 5% application rate.
When comparing the three biochar types, the application rate of 1.5% of PHB and application rates of 1.5 and 5.0% of RHB led to higher values of dry weights in terms of HI (Figure 4). This suggests that PHB and RHB might be more effective in promoting onion growth in this particular study.

4. Discussion

4.1. Biochar Characteristics

This study observed varied pH levels in biochar produced at 550 °C from different feedstocks: RHB (7.5), CHB (10.2), and PHB (8.7). Higher pyrolysis temperatures generally lead to increased biochar pH due to the concentration of alkaline compounds at these temperatures [8]. Previous studies support this trend, with rice husk reaching pH 7.4 at 250–300 °C and 8.4 at 450–500 °C [41], and rice straw reaching 10.2 at 550 °C [47]. Similarly, other studies report alkaline biochar (pH > 7) from wheat straw, pine wood, olive stone, and almond shell up to 507 °C [38,48]. Even at lower temperatures, corn cob biochar produced at 350 °C had a slightly alkaline pH (7.10) [21]. This finding underlines the importance of considering both the type of organic material used (feedstock) and the temperature during the heating process (pyrolysis temperature) when it comes to influencing biochar properties such as pH.
Biochar produced at higher temperatures (600 °C) becomes more resistant to decomposition (high recalcitrant character), while lower temperatures (400 °C) preserve volatile and easily degradable compounds. Lower pyrolysis temperatures yield more biochar, while higher temperatures create biochar with a higher concentration of carbon, a larger surface area, and stronger adsorption properties [9]. High pyrolysis temperatures lead to an increase in aromaticity (nonvolatile, high C, and low O) in the resulting biochar. These biochars are oxidized more slowly, and form surficial, oxygen-containing functional groups. Conversely, biochars formed at lower temperature contain more labile, volatile components of relatively low C and high O content and are relatively aliphatic [8].
The present study observed varying electrical conductivity (EC) values in biochars produced from different feedstocks: rice husk (2.4 mS/cm), cocoa (30.1 mS/cm), and peanut (2.59 mS/cm). These findings align with previous research which reported EC values of 36 mS/m and 48 mS/m for rice husk biochar produced at 250–300 °C and 450–500 °C, respectively [41]. Additionally, other studies reported that pine wood biochar produced at 428 °C exhibited an EC up to 0.61 mS/cm, similar to the value of 2.81 mS/cm reported for wheat straw biochar produced at 368 °C [48]. This variation in EC highlights the influence of feedstock and production temperature. Biochars with higher EC values, like the biochars produced in this study, often contain higher concentrations of soluble salts and minerals, potentially impacting their suitability for various applications.
Peanut husk biochar, despite having the highest organic matter content, has the lowest C/N ratio, while cocoa biochar boasts the most macro and micronutrients, highlighting the diverse nutrient profiles of biochars and suggesting varied plant responses to their addition. The current investigation revealed variations in the C/N ratios of biochars produced from different feedstocks: rice husk (39), cocoa (30), and peanut (34). Generally, biochar C/N ratios can range vastly from 7 to 400, with higher values typically associated with higher pyrolysis temperatures. This is because high temperatures during conversion favor the formation of more aromatic carbon structures in the biochar, making them more resistant to microbial degradation [8]. Wood and sunflower husk biochars, both processed at 750 °C, exhibited C/N ratios of 32.2 and 33.4, respectively [49]. In the context of soils, this ratio serves as an indicator of organic substrates’ capacity to mineralize and release inorganic N upon application. While some studies suggest a C/N ratio above 25–30 might lead to nitrogen immobilization, others indicate a higher risk above 20, where microbes compete with plants for available nitrogen, potentially limiting plant growth [15]. Based on this information, most biochars with their high C/N ratios might induce nitrogen immobilization when applied to soil alone, potentially leading to plant nitrogen deficiencies. Therefore, it is crucial to consider combining biochar with other nitrogen sources or managing its application rates to ensure adequate nitrogen availability for plant growth.
The current findings indicated that the bulk density of biochars varied significantly among different feedstocks, with RHB registering 0.233 g cm−3, CHB at 0.377 g cm−3, and PHB at 0.204 g cm−3. Wheat straw biochar and pine wood biochar exhibited a bulk density range of 0.19–0.25 g cm−3, contrasting with the denser olive stone and almond shell biochars, which recorded densities of 0.66–0.74 g cm−3 [48]. The physical attribute of bulk density holds substantial importance in characterizing biochars, with variations observed in biochars derived from distinct wood types, ranging from 0.3 to 0.43 g cm−3 [15]. Moreover, bulk density values for activated carbons utilized in gas adsorption typically fall between 0.4 and 0.5 g cm−3, while those employed for decolorization exhibit a broader range from 0.25 to 0.75 g cm−3 [15]. The transformation of biochar during production involves the loss of volatile and condensable compounds from the disorganized phase, leading to a relative increase in the organized phase characterized by graphite-like crystallites. The maximum reported density of carbon in biochars typically ranges between 2.0 and 2.1 g cm−3 [15]. This transformation results in an augmented solid density (true density) of biochars when compared to their original feedstocks.

4.2. Functional Traits

According to the present results of dry weight, the impact of biochar application varies depending on the plant organ. While statistically significant, the effect of biochar application on dry weight is not consistent across all plant organs. For instance, the dry weight of roots showed no statistically significant response to biochar application, while pseudo-shoots, bulbs, and total dry plant biomass showed a positive response. The results suggest that a higher application rate might not always be the most effective. For example, bulb dry weight showed a statistically significant increase only at the lower application rate compared to the control group.
In terms of harvest index, the highest HI values > 0.85 were for the application rate of 1.5% of PHB, and application rates of 1.5 and 5.0% of RHB. The positive effect of PHB in comparison with RHB on harvest index might be related to PHB having the highest concentrations of Na, Fe, Mn, and Cu and also having a lower C/N value compared to rice. This increase in the harvest index of onions under the biochar amendments would be the result of increased soil fertility and nutrient retention. As the literature reports, an application of biochar to salt-affected soils could increase solubilized inorganic forms, nutrient availability, and uptake which improve soil quality causing enhancement of soil physiochemical properties which reflect positively on the plant physiological and biochemical characteristics [4]. Other studies reported that applying biochar in 7 t ha−1 doses to the soil significantly increased several growth and yield parameters (bulb number, leaves number, bulb diameter, fresh and dry weight of leaves and roots, plant yield, and biological yield) according to experiments developed at the University of Mosul in Iraq [50]. In addition, spraying amino acid (Steam) gave the highest values of plant height, fresh and dry weight of leaves and roots per plant, and diameter of bulb neck [50]. In an experiment developed in a silt loam soil in Thailand, rice husk and rice straw biochar application increased onion yields by 22% and 35%, respectively, compared with the current farmer practice of using raw rice husk [45]. Field experiments in Egypt determined that deficient irrigation negatively altered the yield of stressed onion including bulb length, bulb diameter, bulb weight, and yield; however, soil amendment using biochar and K-humate foliar application boosted the onion yield up to 53.72 t ha−1 [4]. In Santa Catarina, Brazil, with a humid subtropical oceanic climate, an experiment with eucalyptus wood biochar and mineral fertilizers obtained the highest onion yields up to 53.2 t ha−1 [36]. In a loam soil with organic matter deficiency, it was obtained that mesquite biochar doses of 10 t ha−1 had a significantly greater effect on the length of onion leaf (up to 32.38 cm), bulb weight up to 6.13 kg per plot, and total yield up to 268.55 kg ha−1 than onions which were grown in soils treated with farmyard manure and NPK fertilizers [51].
The expected improvement in allometric and yield-related traits of onion cultivars with wheat straw, cotton sticks, rice husk, maize stalk, and poultry litter biochars can be attributed to differences in the chemical properties of the biochars [4,38]. Biochar application often boosts onion growth and yield through improved soil properties and nutrient access. However, its effectiveness can vary by plant part and application rate. For instance, in this study, root growth showed no significant response to biochar.
According to the results, although CHB, RHB, and PHB types and application rates varied statistically from each other, none significantly impacted onion growth (number of leaves, plant height, and root length) compared to the control group. Based on the findings, it could be interpreted that the onion plants were entering a drying phase, leading to a prioritization of biomass allocation towards bulb development. Nevertheless, studies exploring the effects of different amendments to onion growth show promising results, with biochar significantly increasing plant height compared to control groups. Biochars are variable materials in terms of total nutrient content and availability, and given the very large variability in contents of different nutrients, we would expect varying plant and soil responses from direct nutrient additions of biochars [15]. A maximum height of 58 cm was reported in the Nitisol soil of Ethiopia treated with biochar grass, exceeding the control group’s 20 cm [42]. Similarly, a maximum height of 64.52 cm was observed for the Phulkara cultivar grown with poultry litter biochar in a semi-arid region in Pakistan [38]. While biochar shows promise, traditional fertilizers can also be effective. Beyond biochar, various other organic amendments have been shown to positively impact onion root length. Studies demonstrated that wheat straw, coconut shell, phragmites, sawdust, cotton sticks, and poultry litter biochars all significantly increased root length in tested onion cultivars, with some reaching up to 25.21 cm [38,52,53]. According to the literature, it is suggested that biochar, fertilizers containing sulfur, and various organic amendments can significantly promote onion growth by increasing plant height and root length.
While the current study observed no significant enhancements in both plant height and root length with biochar application, it is noteworthy that these allometric traits (plant height and root length) did not directly translate to increased yield. This finding highlights the complex interplay between various factors influencing onion yield production, including disease resistance [42]. Compared to water-deficient conditions, irrigated plants and those treated with biochar soil amendment (or a combination of both) exhibited greater improvements in plant height and total leaf area [4].
The specific characteristics of the biochar types could influence their impact on plant growth, and additional factors like soil composition, watering regimes, or presence of nutrients could also influence the effects on plant length. The present results suggest that biochar application has the potential to enhance the growth of certain onion organs. However, the optimal application rate and the specific effects might vary depending on the type of biochar, the plant part of interest, and the overall growing conditions.

5. Conclusions

This study examined how CHB, RHB, and PHB influence onion functional traits. In the present case, PHB, though high in organic matter, had a C/N ratio suggesting potential nitrogen competition. Biochars displayed diverse nutrient profiles, with CHB richest in key nutrients. However, overall plant growth (height, leaves, roots) was not significantly (p > 0.05) impacted by any biochar compared to the control. Additionally, some plant organs (like roots) did not respond to the biochar. Notably, specific application rates of RHB and PHB increased the harvest index (HI), a yield allocation measure; nevertheless, the application of CHB yielded slightly higher average HI values compared to the control group. Higher dry weight values were obtained with specific biochar rates (e.g., 1.0–1.5% PHB, 1.5–5% RHB, or 5.0% CHB). Thus, the observed increase in dry weight at specific application rates highlights the potential of biochar in enhancing crop productivity, underscoring the need for tailored research to optimize its utilization across various crop and soil contexts, thereby advancing sustainable agricultural practices.

Author Contributions

Conceptualization, Á.C. and G.C.; methodology, Á.C.; validation, Á.C., G.C. and V.S.; formal analysis, Á.C., V.S., G.C., G.L. and J.M.; investigation, Á.C., V.S., G.C., G.L. and J.M.; resources, Á.C., V.S., G.C., G.L. and J.M.; data curation, Á.C.; writing—original draft preparation, Á.C.; writing—review and editing, Á.C., G.C. and G.L.; visualization, Á.C.; supervision, G.C. All authors have read and agreed to the published version of the manuscript.

Funding

This research received funding from Escuela Superior Politécnica Agropecuaria de Manabí, ESPAM-MFL, Calceta. The authors gratefully acknowledge ESPAM MFL for funding this research under the institutional project CUP 383766, titled “Effects of Biochar on the Physical and Chemical Properties of Soils and Agricultural Productivity in Manabí-Ecuador”. This project was executed from January 2019 to December 2022, and its details are duly documented in the records of the Planning Secretariat of the Ecuadorian State.

Data Availability Statement

The data supporting all figures are publicly available in the Figshare repository, as part of this record: https://doi.org/10.6084/m9.figshare.25557651.

Acknowledgments

We would like to express our gratitude to Myriam Félix Lopez (ESPAM MFL) for her invaluable support.

Conflicts of Interest

The authors declare no conflicts of interest.

References

  1. FAO Onion. Available online: https://www.fao.org/land-water/databases-and-software/crop-information/onion/en/ (accessed on 1 February 2024).
  2. Kumar, M.; Barbhai, M.; Hasan, M.; Punia, S.; Dhumal, S.; Radha; Rais, N.; Chandran, D.; Pandiselvam, R.; Kothakota, A.; et al. Onion (Allium cepa L.) Peels: A Review on Bioactive Compounds and Biomedical Activities. Biomed. Pharmacother. 2022, 146, 112498. [Google Scholar] [CrossRef] [PubMed]
  3. Sagar, N.A.; Pareek, S.; Benkeblia, N.; Xiao, J. Onion (Allium cepa L.) Bioactives: Chemistry, Pharmacotherapeutic Functions, and Industrial Applications. Food Front. 2022, 3, 380–412. [Google Scholar] [CrossRef]
  4. Abdelrasheed, K.G.; Mazrou, Y.; Omara, A.E.-D.; Osman, H.S.; Nehela, Y.; Hafez, E.M.; Rady, A.M.S.; El-Moneim, D.A.; Alowaiesh, B.F.; Gowayed, S.M. Soil Amendment Using Biochar and Application of K-Humate Enhance the Growth, Productivity, and Nutritional Value of Onion (Allium cepa L.) under Deficit Irrigation Conditions. Plants 2021, 10, 2598. [Google Scholar] [CrossRef] [PubMed]
  5. Geries, L.S.M.; El-Shahawy, T.A.; Moursi, E.A. Cut-off Irrigation as an Effective Tool to Increase Water-Use Efficiency, Enhance Productivity, Quality and Storability of Some Onion Cultivars. Agric. Water Manag. 2021, 244, 106589. [Google Scholar] [CrossRef]
  6. Malhi, G.S.; Kaur, M.; Kaushik, P. Impact of Climate Change on Agriculture and Its Mitigation Strategies: A Review. Sustainability 2021, 13, 1318. [Google Scholar] [CrossRef]
  7. Cui, H.; Zhang, L.; Zhang, Q.; Li, X.; Huang, Y.; Peng, Y. Advanced Nitrogen Removal from Low C/N Municipal Wastewater by Combining Partial Nitrification-Anammox and Endogenous Partial Denitrification-Anammox (PN/A-EPD/A) Process in a Single-Stage Reactor. Bioresour. Technol. 2021, 339, 125501. [Google Scholar] [CrossRef] [PubMed]
  8. Diatta, A.A.; Fike, J.H.; Battaglia, M.L.; Galbraith, J.M.; Baig, M.B. Effects of Biochar on Soil Fertility and Crop Productivity in Arid Regions: A Review. Arab. J. Geosci. 2020, 13, 595. [Google Scholar] [CrossRef]
  9. Kapoor, A.; Sharma, R.; Kumar, A.; Sepehya, S. Biochar as a Means to Improve Soil Fertility and Crop Productivity: A Review. J. Plant Nutr. 2022, 45, 2380–2388. [Google Scholar] [CrossRef]
  10. Jatav, H.S.; Rajput, V.D.; Minkina, T.; Singh, S.K.; Chejara, S.; Gorovtsov, A.; Barakhov, A.; Bauer, T.; Sushkova, S.; Mandzhieva, S.; et al. Sustainable Approach and Safe Use of Biochar and Its Possible Consequences. Sustainability 2021, 13, 10362. [Google Scholar] [CrossRef]
  11. Phillips, C.L.; Meyer, K.M.; Garcia-Jaramillo, M.; Weidman, C.S.; Stewart, C.E.; Wanzek, T.; Grusak, M.A.; Watts, D.W.; Novak, J.; Trippe, K.M. Towards Predicting Biochar Impacts on Plant-Available Soil Nitrogen Content. Biochar 2022, 4, 9. [Google Scholar] [CrossRef]
  12. Singh, E.; Mishra, R.; Kumar, A.; Shukla, S.K.; Lo, S.-L.; Kumar, S. Circular Economy-Based Environmental Management Using Biochar: Driving towards Sustainability. Process Saf. Environ. Prot. 2022, 163, 585–600. [Google Scholar] [CrossRef]
  13. Kumar, A.; Bhattacharya, T.; Shaikh, W.A.; Roy, A.; Chakraborty, S.; Vithanage, M.; Biswas, J.K. Multifaceted Applications of Biochar in Environmental Management: A Bibliometric Profile. Biochar 2023, 5, 11. [Google Scholar] [CrossRef]
  14. Guo, M.; Uchimiya, S.M.; He, Z. Agricultural and Environmental Applications of Biochar: Advances and Barriers. Agric. Environ. Appl. Biochar: Adv. Barriers 2016, 63, 495–504. [Google Scholar]
  15. Lehmann, J.; Joseph, S. Biochar for Environmental Management: Science and Technology; Earthscan: London, UK; Sterling, VA, USA, 2009; ISBN 978-1-84407-658-1. [Google Scholar]
  16. Ding, Y.; Liu, Y.; Liu, S.; Li, Z.; Tan, X.; Huang, X.; Zeng, G.; Zhou, L.; Zheng, B. Biochar to Improve Soil Fertility. A Review. Agron. Sustain. Dev. 2016, 36, 36. [Google Scholar] [CrossRef]
  17. Olmo, M.; Villar, R.; Salazar, P.; Alburquerque, J.A. Changes in Soil Nutrient Availability Explain Biochar’s Impact on Wheat Root Development. Plant Soil. 2016, 399, 333–343. [Google Scholar] [CrossRef]
  18. Alkharabsheh, H.M.; Seleiman, M.F.; Battaglia, M.L.; Shami, A.; Jalal, R.S.; Alhammad, B.A.; Almutairi, K.F.; Al-Saif, A.M. Biochar and Its Broad Impacts in Soil Quality and Fertility, Nutrient Leaching and Crop Productivity: A Review. Agronomy 2021, 11, 993. [Google Scholar] [CrossRef]
  19. Singh Karam, D.; Nagabovanalli, P.; Sundara Rajoo, K.; Fauziah Ishak, C.; Abdu, A.; Rosli, Z.; Melissa Muharam, F.; Zulperi, D. An Overview on the Preparation of Rice Husk Biochar, Factors Affecting Its Properties, and Its Agriculture Application. J. Saudi Soc. Agric. Sci. 2022, 21, 149–159. [Google Scholar] [CrossRef]
  20. Jeffery, S.; Verheijen, F.G.A.; Van Der Velde, M.; Bastos, A.C. A Quantitative Review of the Effects of Biochar Application to Soils on Crop Productivity Using Meta-Analysis. Agric. Ecosyst. Environ. 2011, 144, 175–187. [Google Scholar] [CrossRef]
  21. Ali, L.; Xiukang, W.; Naveed, M.; Ashraf, S.; Nadeem, S.M.; Haider, F.U.; Mustafa, A. Impact of Biochar Application on Germination Behavior and Early Growth of Maize Seedlings: Insights from a Growth Room Experiment. Appl. Sci. 2021, 11, 11666. [Google Scholar] [CrossRef]
  22. Cedeño, A.; Olmo, M.; Cedeño, G.; Lucas, M.; Saldarriaga, V.; Villar, R. Effects of Different Biochar Types on the Growth and Functional Traits of Rice (Oryza sativa L.). J. Ecol. Eng. 2024, 25, 282–290. [Google Scholar] [CrossRef]
  23. Sohi, S.P.; Krull, E.; Lopez-Capel, E.; Bol, R. A Review of Biochar and Its Use and Function in Soil. In Advances in Agronomy; Elsevier: Amsterdam, The Netherlands, 2010; Volume 105, pp. 47–82. ISBN 978-0-12-381023-6. [Google Scholar]
  24. Lehmann, J.; Cowie, A.; Masiello, C.A.; Kammann, C.; Woolf, D.; Amonette, J.E.; Cayuela, M.L.; Camps-Arbestain, M.; Whitman, T. Biochar in Climate Change Mitigation. Nat. Geosci. 2021, 14, 883–892. [Google Scholar] [CrossRef]
  25. Asai, H.; Samson, B.K.; Stephan, H.M.; Songyikhangsuthor, K.; Homma, K.; Kiyono, Y.; Inoue, Y.; Shiraiwa, T.; Horie, T. Biochar Amendment Techniques for Upland Rice Production in Northern Laos. Field Crops Res. 2009, 111, 81–84. [Google Scholar] [CrossRef]
  26. Xu, H.; Cai, A.; Wu, D.; Liang, G.; Xiao, J.; Xu, M.; Colinet, G.; Zhang, W. Effects of Biochar Application on Crop Productivity, Soil Carbon Sequestration, and Global Warming Potential Controlled by Biochar C:N Ratio and Soil pH: A Global Meta-Analysis. Soil. Tillage Res. 2021, 213, 105125. [Google Scholar] [CrossRef]
  27. Ye, L.; Camps-Arbestain, M.; Shen, Q.; Lehmann, J.; Singh, B.; Sabir, M. Biochar Effects on Crop Yields with and without Fertilizer: A Meta-analysis of Field Studies Using Separate Controls. Soil. Use Manag. 2020, 36, 2–18. [Google Scholar] [CrossRef]
  28. Hussain, R.; Ravi, K. Investigating Soil Properties and Vegetation Parameters in Different Biochar-Amended Vegetated Soil at Large Suction for Application in Bioengineered Structures. Sci. Rep. 2022, 12, 21261. [Google Scholar] [CrossRef]
  29. Wu, M.; Feng, Q.; Sun, X.; Wang, H.; Gielen, G.; Wu, W. Rice (Oryza sativa L.) Plantation Affects the Stability of Biochar in Paddy Soil. Sci. Rep. 2015, 5, 10001. [Google Scholar] [CrossRef] [PubMed]
  30. Niu, Z.; Ma, J.; Fang, X.; Xue, Z.; Ye, Z. Effects of Application of Rice Husk Biochar and Limestone on Cadmium Accumulation in Wheat under Glasshouse and Field Conditions. Sci. Rep. 2022, 12, 21929. [Google Scholar] [CrossRef] [PubMed]
  31. Wijaya, P.; Syam’un, E.; Syaiful, S.A. Interaction between Rice Husk Biochar and Three Species of Fungus on Growth and Yield of Shallot (Allium ascalonicum L.). Int. J. Life Sci. Agric. Res. 2023, 2, 71–79. [Google Scholar] [CrossRef]
  32. Gamage, D.N.V.; Mapa, R.B.; Dharmakeerthi, R.S.; Biswas, A. Effect of Rice-Husk Biochar on Selected Soil Properties in Tropical Alfisols. Soil. Res. 2016, 54, 302. [Google Scholar] [CrossRef]
  33. Kleyer, M.; Trinogga, J.; Cebrián-Piqueras, M.A.; Trenkamp, A.; Fløjgaard, C.; Ejrnaes, R.; Bouma, T.J.; Minden, V.; Maier, M.; Mantilla-Contreras, J.; et al. Trait Correlation Network Analysis Identifies Biomass Allocation Traits and Stem Specific Length as Hub Traits in Herbaceous Perennial Plants. J. Ecol. 2019, 107, 829–842. [Google Scholar] [CrossRef]
  34. Xiang, Y.; Deng, Q.; Duan, H.; Guo, Y. Effects of Biochar Application on Root Traits: A Meta-Analysis. GCB Bioenergy 2017, 9, 1563–1572. [Google Scholar] [CrossRef]
  35. Pérez-Harguindeguy, N.; Díaz, S.; Garnier, E.; Lavorel, S.; Poorter, H.; Jaureguiberry, P.; Bret-Harte, M.S.; Cornwell, W.K.; Craine, J.M.; Gurvich, D.E.; et al. New Handbook for Standardised Measurement of Plant Functional Traits Worldwide. Aust. J. Bot. 2013, 61, 167. [Google Scholar] [CrossRef]
  36. Higashikawa, F.S.; Silva, C.A.; Carducci, C.E.; Jindo, K.; Kurtz, C.; De Araújo, E.R.; Sousa Resende, R.; Alves, D.P. Effects of the Application of Biochar on Soil Fertility Status, and Nutrition and Yield of Onion Grown in a No-Tillage System. Arch. Agron. Soil. Sci. 2023, 69, 212–227. [Google Scholar] [CrossRef]
  37. Xiong, D.; Wang, D.; Liu, X.; Peng, S.; Huang, J.; Li, Y. Leaf Density Explains Variation in Leaf Mass per Area in Rice between Cultivars and Nitrogen Treatments. Ann. Bot. 2016, 117, 963–971. [Google Scholar] [CrossRef] [PubMed]
  38. Arif, M.; Fawaz, M.S.; Zuan, A.T.K.; Shah, R.U.; Ullah, R.; Elshehawi, A.M.; Al-Sadi, A.M.; Ihsan Ullah, M.; Güldür, M.E.; Alotaibi, S.S.; et al. The Impact of Different Biochars on Stemphylium Leaf Blight (SLB) Suppression and Productivity of Onion (Allium cepa L.). J. King Saud. Univ.-Sci. 2021, 33, 101575. [Google Scholar] [CrossRef]
  39. Lehmann, J.; Rillig, M.C.; Thies, J.; Masiello, C.A.; Hockaday, W.C.; Crowley, D. Biochar Effects on Soil Biota–A Review. Soil. Biol. Biochem. 2011, 43, 1812–1836. [Google Scholar] [CrossRef]
  40. Latimer, G.W., Jr. Official Methods of Analysis of AOAC International, 22nd ed.; Oxford University Press: Oxford, UK, 2023; ISBN 978-0-19-761013-8. [Google Scholar]
  41. Abrishamkesh, S.; Gorji, M.; Asadi, H.; Bagheri-Marandi, G.H.; Pourbabaee, A.A. Effects of Rice Husk Biochar Application on the Properties of Alkaline Soil and Lentil Growth. Plant Soil. Environ. 2015, 61, 475–482. [Google Scholar] [CrossRef]
  42. Aneseyee, A.B.; Wolde, T. Effect of Biochar and Inorganic Fertilizer on the Soil Properties and Growth and Yield of Onion (Allium cepa) in Tropical Ethiopia. Sci. World J. 2021, 2021, 5582697. [Google Scholar] [CrossRef] [PubMed]
  43. Shura, G.; Beshir, H.M.; Haile, A. Improving Onion Productivity through Optimum and Economical Use of Soil Macronutrients in Central Rift Valley of Ethiopia. J. Agric. Food Res. 2022, 9, 100321. [Google Scholar] [CrossRef]
  44. Sarkar, M.d.D.; Solaiman, A.H.M.; Jahan, M.S.; Rojoni, R.N.; Kabir, K.; Hasanuzzaman, M. Soil Parameters, Onion Growth, Physiology, Biochemical and Mineral Nutrient Composition in Response to Colored Polythene Film Mulches. Ann. Agric. Sci. 2019, 64, 63–70. [Google Scholar] [CrossRef]
  45. Hemowng, S.; Sangrit, C.; Phunthupan, P.; Butnan, S.; Vityakon, P. Rice-Derived Biochar Enhance the Yield of Spring Onion (Allium cepa L. Var. Aggregatum), While Reducing Pesticide Contamination in Soil and Plant. Appl. Ecol. Env. Res. 2021, 19, 349–358. [Google Scholar] [CrossRef]
  46. Steduto, P.; Hsiao, T.C.; Raes, D.; Fereres, E. AquaCrop—The FAO Crop Model to Simulate Yield Response to Water: I. Concepts and Underlying Principles. Agron. J. 2009, 101, 426–437. [Google Scholar] [CrossRef]
  47. Liu, Y.; Lu, H.; Yang, S.; Wang, Y. Impacts of Biochar Addition on Rice Yield and Soil Properties in a Cold Waterlogged Paddy for Two Crop Seasons. Field Crops Res. 2016, 191, 161–167. [Google Scholar] [CrossRef]
  48. Alburquerque, J.A.; Calero, J.M.; Barrón, V.; Torrent, J.; del Campillo, M.C.; Gallardo, A.; Villar, R. Effects of Biochars Produced from Different Feedstocks on Soil Properties and Sunflower Growth. Z. Pflanzenernähr. Bodenk. 2014, 177, 16–25. [Google Scholar] [CrossRef]
  49. Burachevskaya, M.; Minkina, T.; Bauer, T.; Lobzenko, I.; Fedorenko, A.; Mazarji, M.; Sushkova, S.; Mandzhieva, S.; Nazarenko, A.; Butova, V.; et al. Fabrication of Biochar Derived from Different Types of Feedstocks as an Efficient Adsorbent for Soil Heavy Metal Removal. Sci. Rep. 2023, 13, 2020. [Google Scholar] [CrossRef]
  50. Alsultan, R.M.H.; Al-Shamary, W.F.A.; Ibrahim, M.A.; Kahlel, A.S. Effect of Bio Char and Amino Acid (Steam) on Growth and Green Yield of Onion (Allium cepa L.) Variety (Karbala). IOP Conf. Ser. Earth Environ. Sci. 2023, 1259, 012047. [Google Scholar] [CrossRef]
  51. Khan, M.; Fatima, K.; Ahmad, R.; Younas, R.; Rizwan, M.; Azam, M.; Abadin, Z.U.; Ali, S. Comparative Effect of Mesquite Biochar, Farmyard Manure, and Chemical Fertilizers on Soil Fertility and Growth of Onion (Allium cepa L.). Arab. J. Geosci. 2019, 12, 563. [Google Scholar] [CrossRef]
  52. Permana, E.; Aulia, K.; Aziz, H.; Murti, S.D.S. Synthesis of Slow-Release Fertilizer with Coconut Shell Biochar and Activated Natural Zeolite for Red Onion (Allium ascalonium). J. Degrade. Min. Land. Manag. 2023, 11, 5037. [Google Scholar] [CrossRef]
  53. Rafique, M.; Ortas, I.; Ahmed, I.A.M.; Rizwan, M.; Afridi, M.S.; Sultan, T.; Chaudhary, H.J. Potential Impact of Biochar Types and Microbial Inoculants on Growth of Onion Plant in Differently Textured and Phosphorus Limited Soils. J. Environ. Manag. 2019, 247, 672–680. [Google Scholar] [CrossRef]
Figure 1. Boxplot and barplot of cocoa, peanut, and rice biochar treatments on plant and root length (cm) and number of onion leaves. Black dots represent outliers, while white dots represent measurements.
Agriengineering 06 00089 g001
Figure 2. Scatterplot of the effect of (a) CHB, (b) PHB, and (c) RHB on TBW and TDP, and (d) HI.
Agriengineering 06 00089 g002
Figure 3. Effect of CHB, PHB, and RHB treatments on the average data of (a) TBW, (b) TDP, and (c) HI.
Agriengineering 06 00089 g003
Figure 4. Onion images of (a) PHB, (b) CHB, and (c) RHB treatments.
Agriengineering 06 00089 g004
Table 1. Composition and characterization of biochar.
ParametersRiceCocoaPeanut
pH7.510.28.7
Electrical conductivity (mS/cm)2.430.12.59
Organic matter (%)51.866.874.2
Dry matter (%)93.484.891.3
Moisture (%)6.615.28.7
Density (g/cm3)0.2330.3770.204
Apparent density (g/L)218320186
C (%)30.138.843.1
N (%)0.781.311.28
C/N393034
P (%)0.160.610.1
K (%)0.4412.11.47
Mg (%)0.070.840.37
Ca (%)0.121.271.01
Na (%)0.010.060.09
Fe (ppm)12110344589
Mn (ppm)69.66577
Cu (ppm)1.715.220.2
Zn (ppm)141248182
B (ppm)22.287.652
Table 2. Treatment effects of biochar type and application rate on plant height, number of leaves per plant, and root length.
Variables% VCBiochar TypeApp. RateBiochar App. RateControl vs. Treat.
Plant height (cm)10.820.0093 **0.2567 ns0.0871 ns0.1613 ns
Number of leaves per plant22.020.0879 ns0.8545 ns0.5492 ns0.4188 ns
Root length (cm)31.920.0145 *0.9659 ns0.8725 ns0.3385 ns
% VC = Percent of variation coefficient. Significance codes: 0 (***), 0.001 (**), 0.01 (*), 0.05 (.), 0.1 (-), no significance (ns).
Table 3. Treatment effects of biochar type and application rate on the dry weight, total dry plant biomass (TDP), and harvest index (HI) of pseudo-shoots (DPW), roots (DRW), and bulbs (TBW).
Variables% VCBiochar TypeApplication RateBiochar Application RateControl vs. Treatments
DPW (g)33.660.7369 ns0.1207 ns0.3662 ns0.4236 ns
DRW (g)48.490.044 *0.1095 ns0.6705 ns0.2424 ns
TBW (g)30.180.0034 **0.5947 ns0.0024 **0.0089 **
TDP (g)26.490.0113 *0.4837 ns0.0021 **0.0163 *
HI9.450.0012 **0.0642 ns0.3565 ns0.0042 **
% VC = Percent of variation coefficient. Significance codes: 0 (***), 0.001 (**), 0.01 (*), 0.05 (.), 0.1 (-), no significance (ns).
Disclaimer/Publisher’s Note: The statements, opinions and data contained in all publications are solely those of the individual author(s) and contributor(s) and not of MDPI and/or the editor(s). MDPI and/or the editor(s) disclaim responsibility for any injury to people or property resulting from any ideas, methods, instructions or products referred to in the content.

