
Finite Element Modeling and Analysis of RC Shear Walls with Cutting-Out Openings

 ,
,  ,
,  and
and
Abstract
:1. Introduction
2. Finite Element Modeling
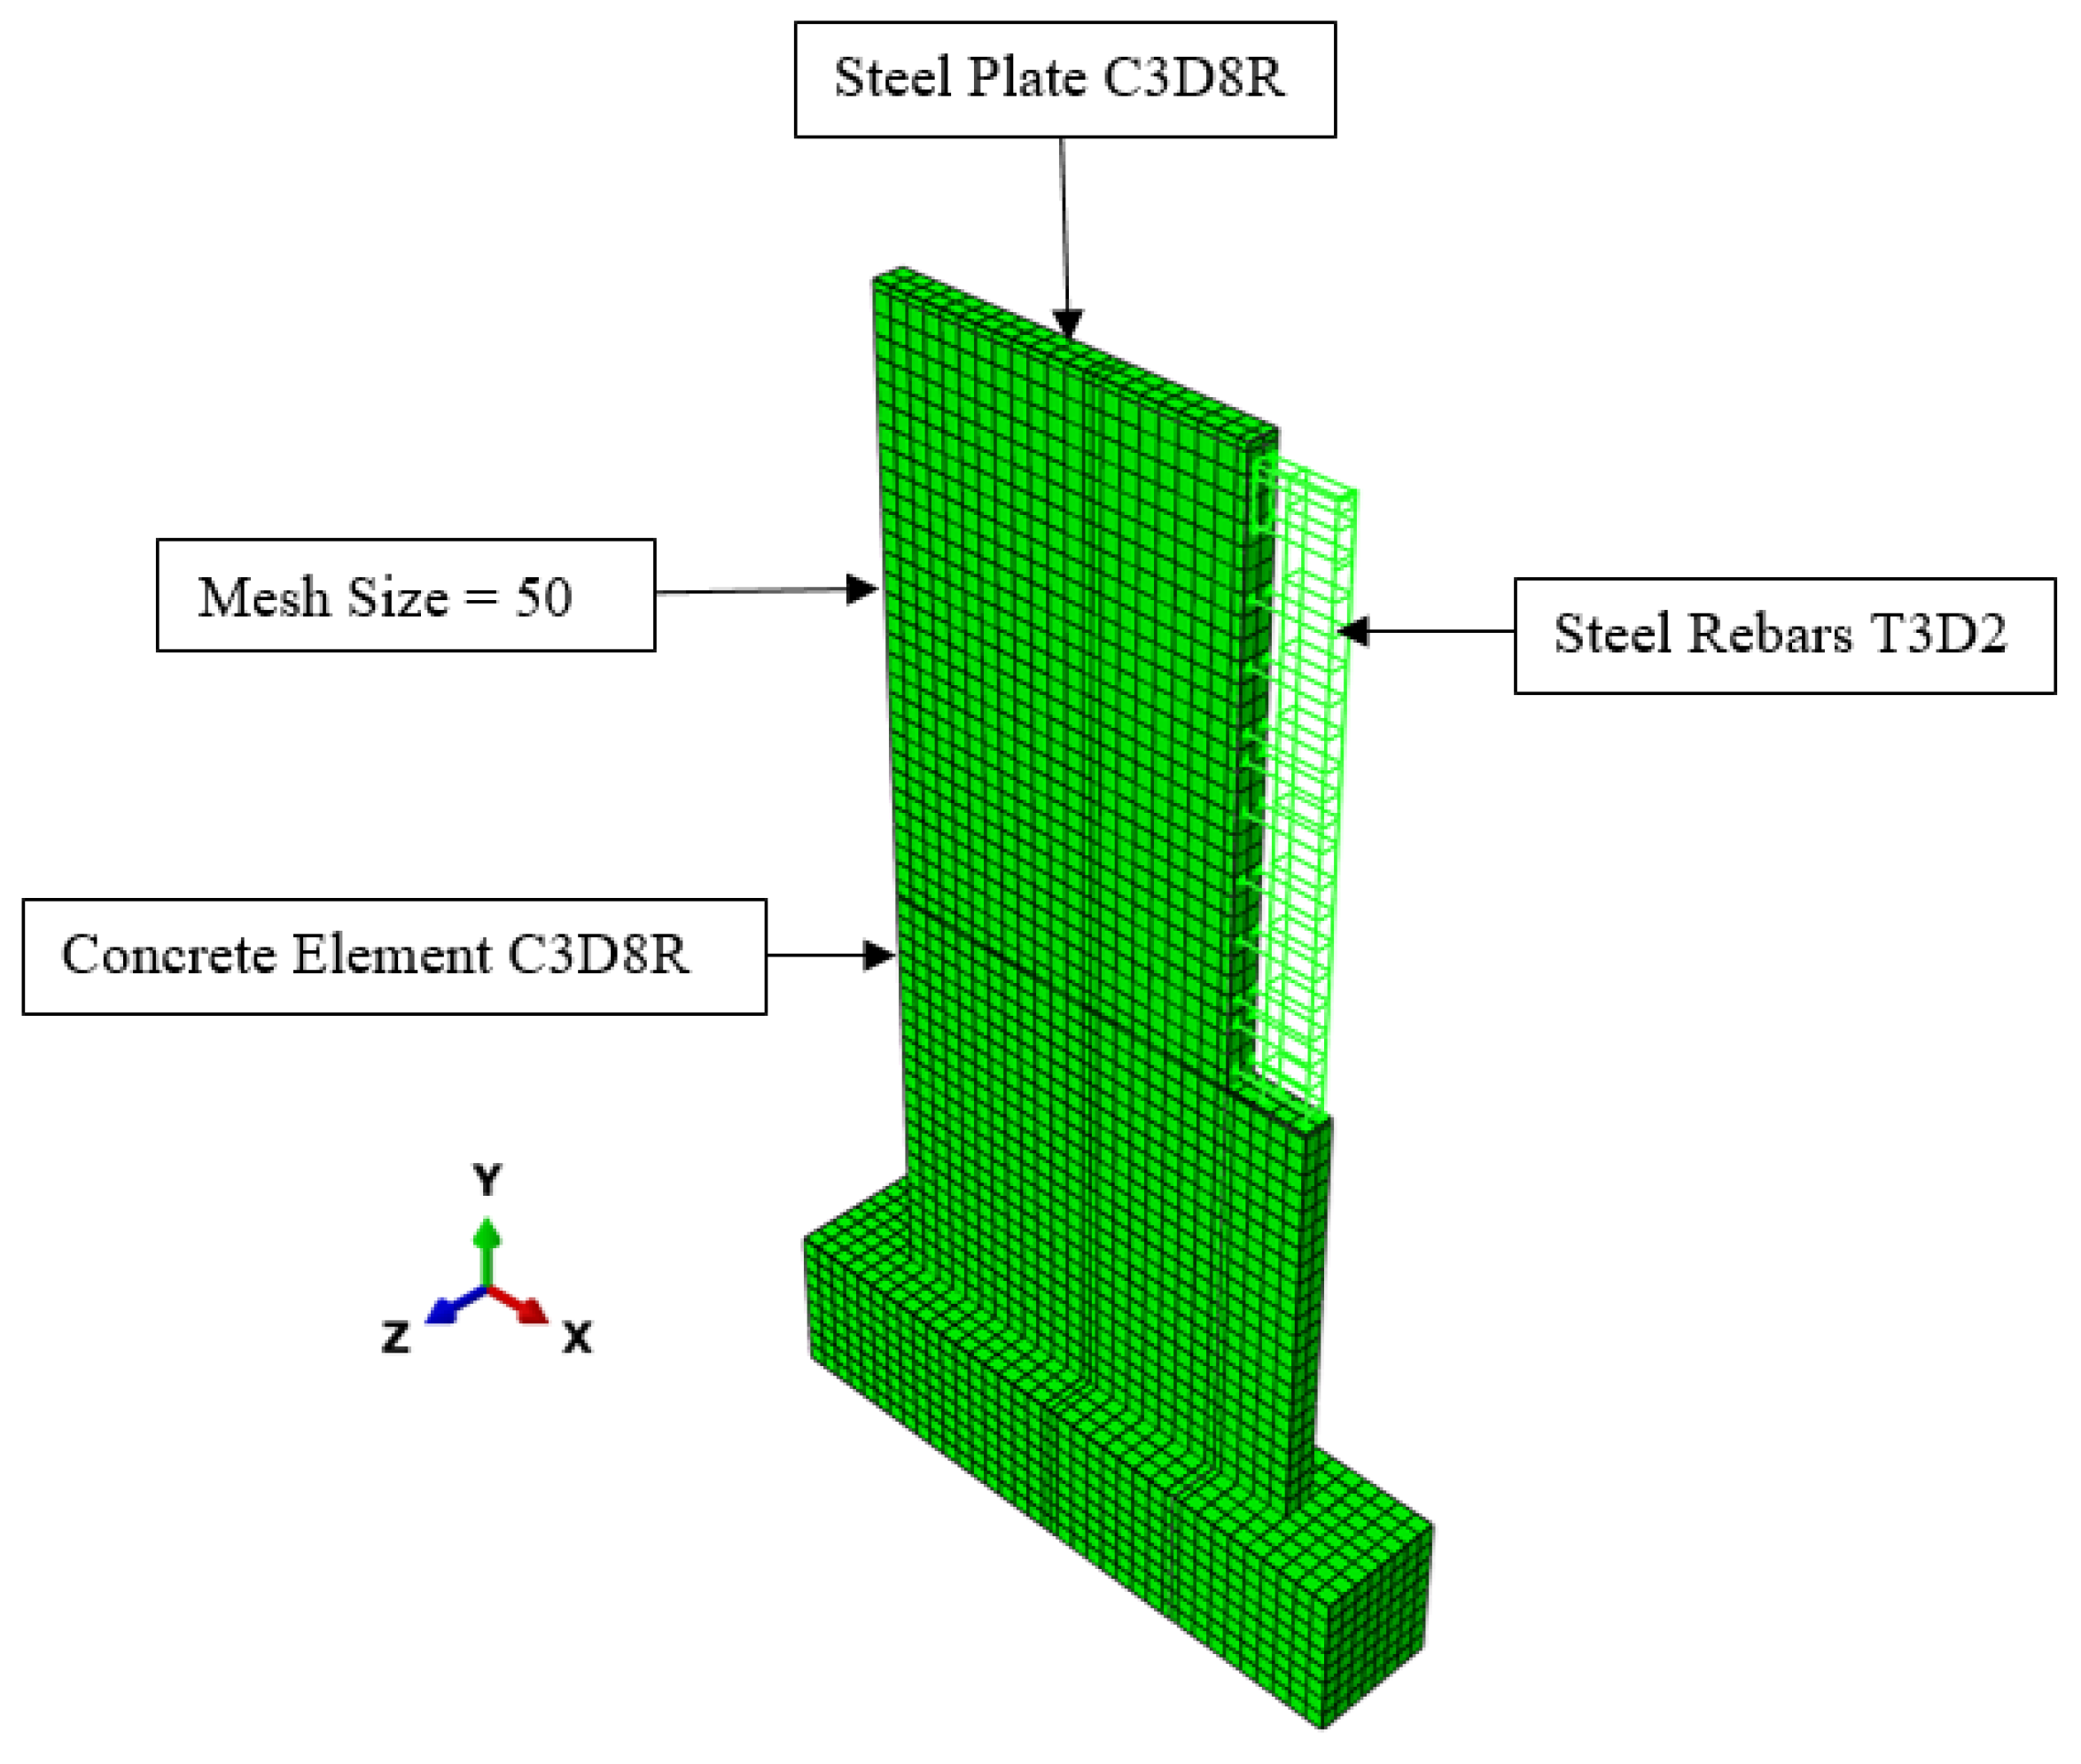
2.1. Element Types and Meshing
2.2. Material Constitutive Modeling
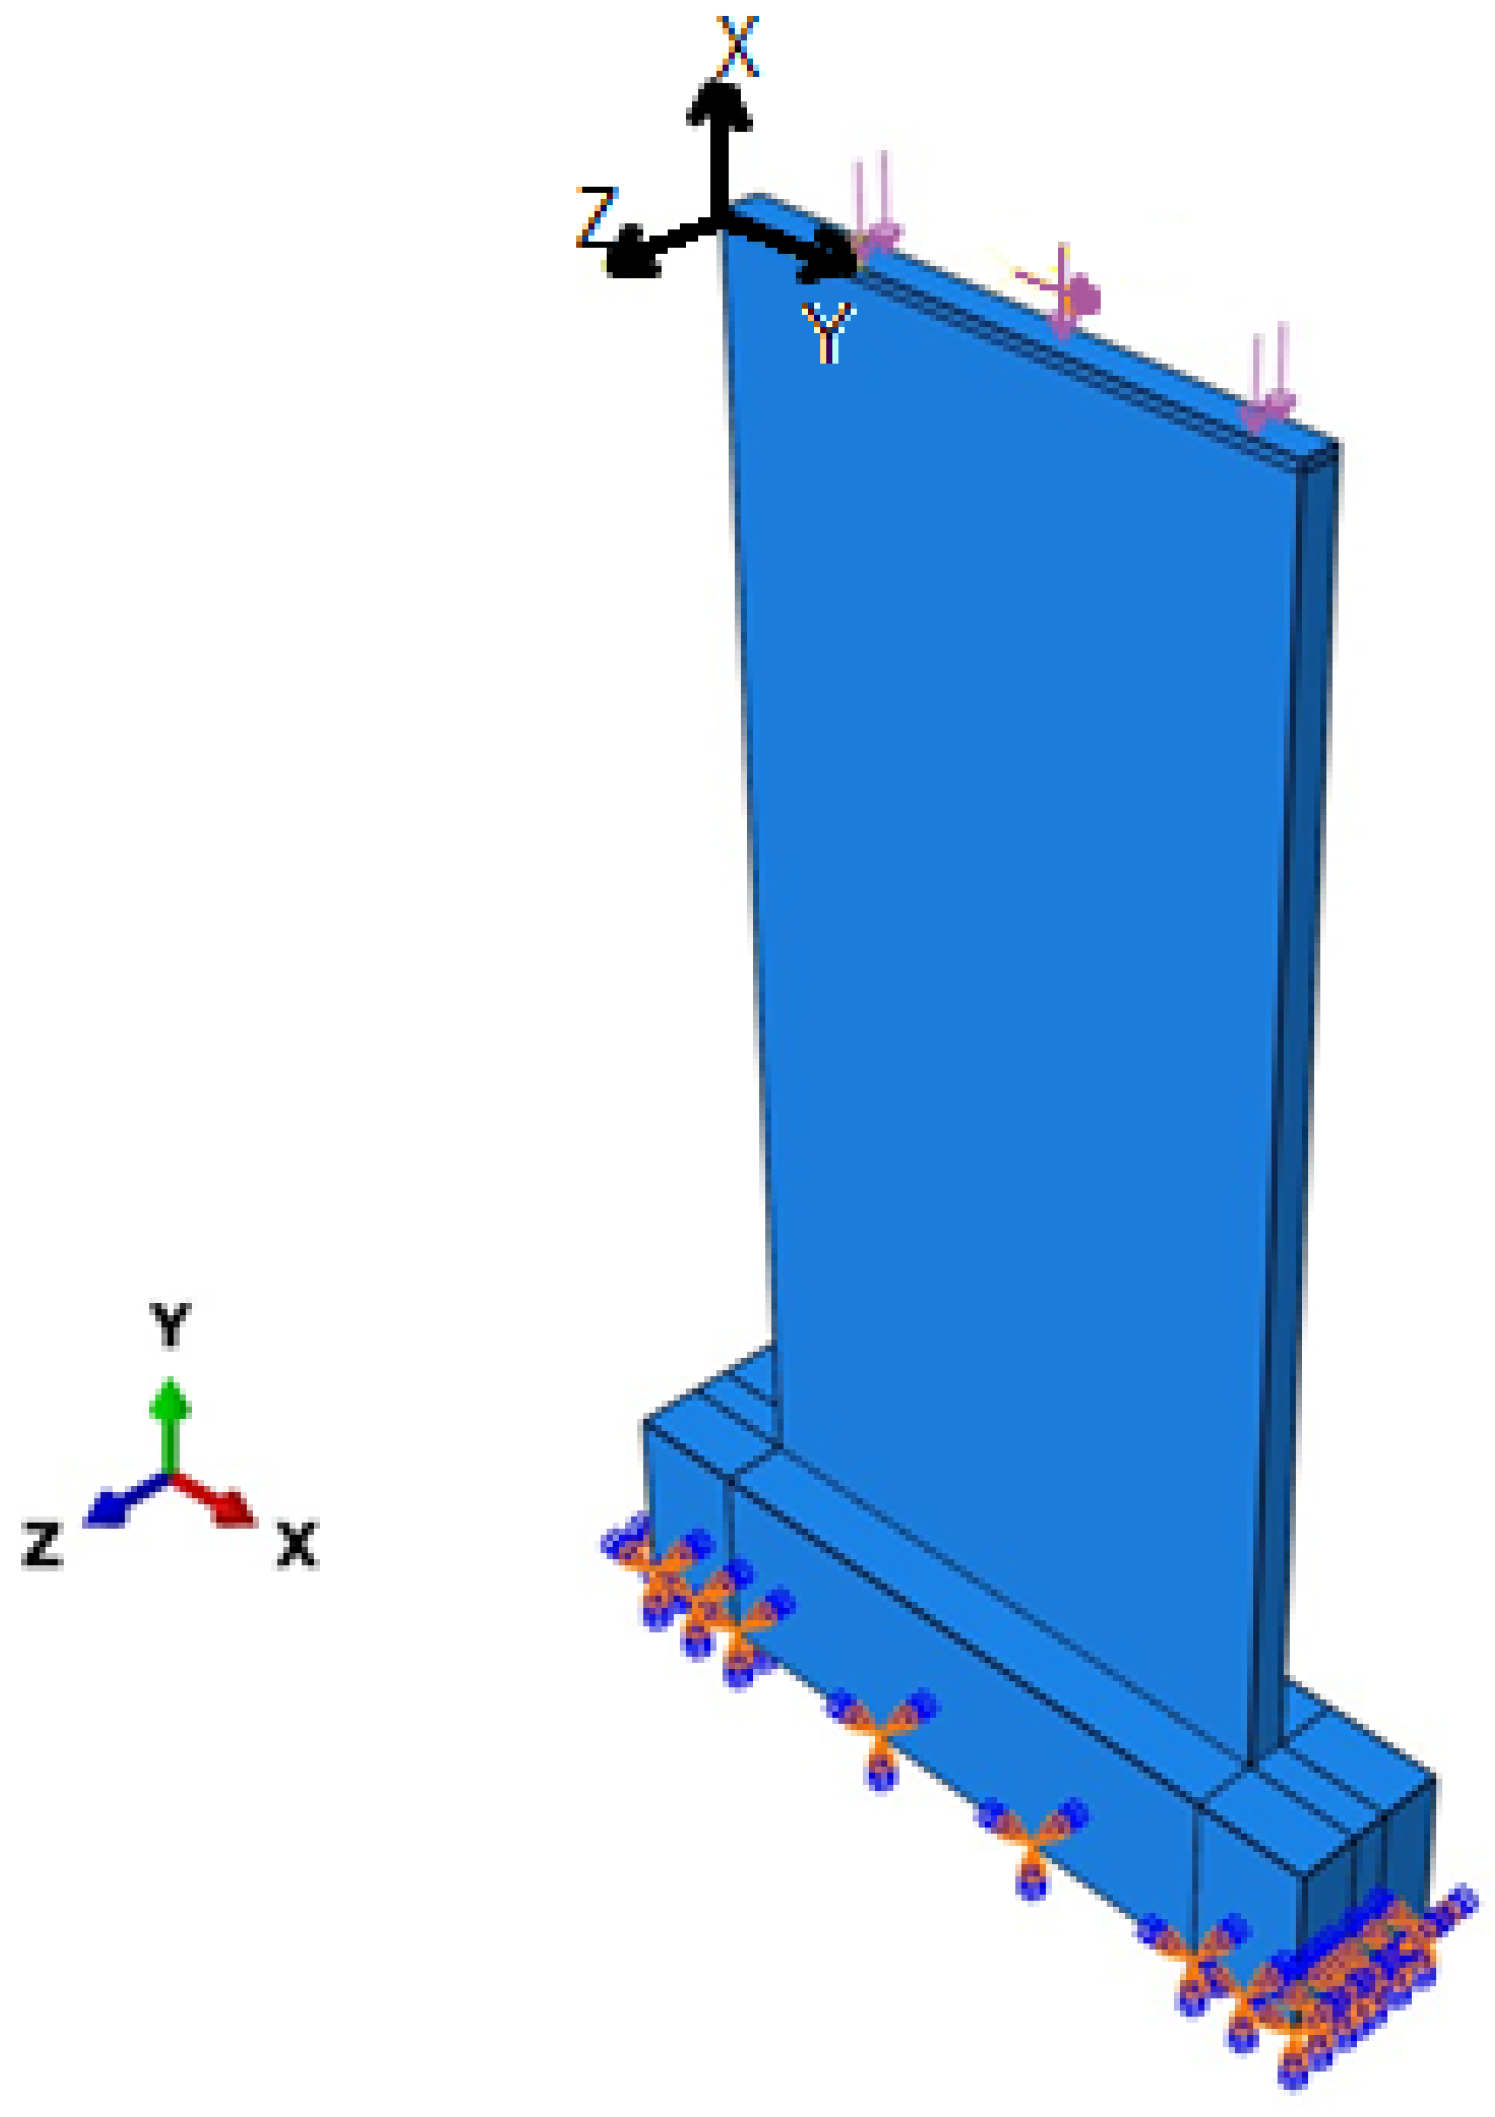
2.3. Boundary Conditions and Interaction Properties
3. Model Verification
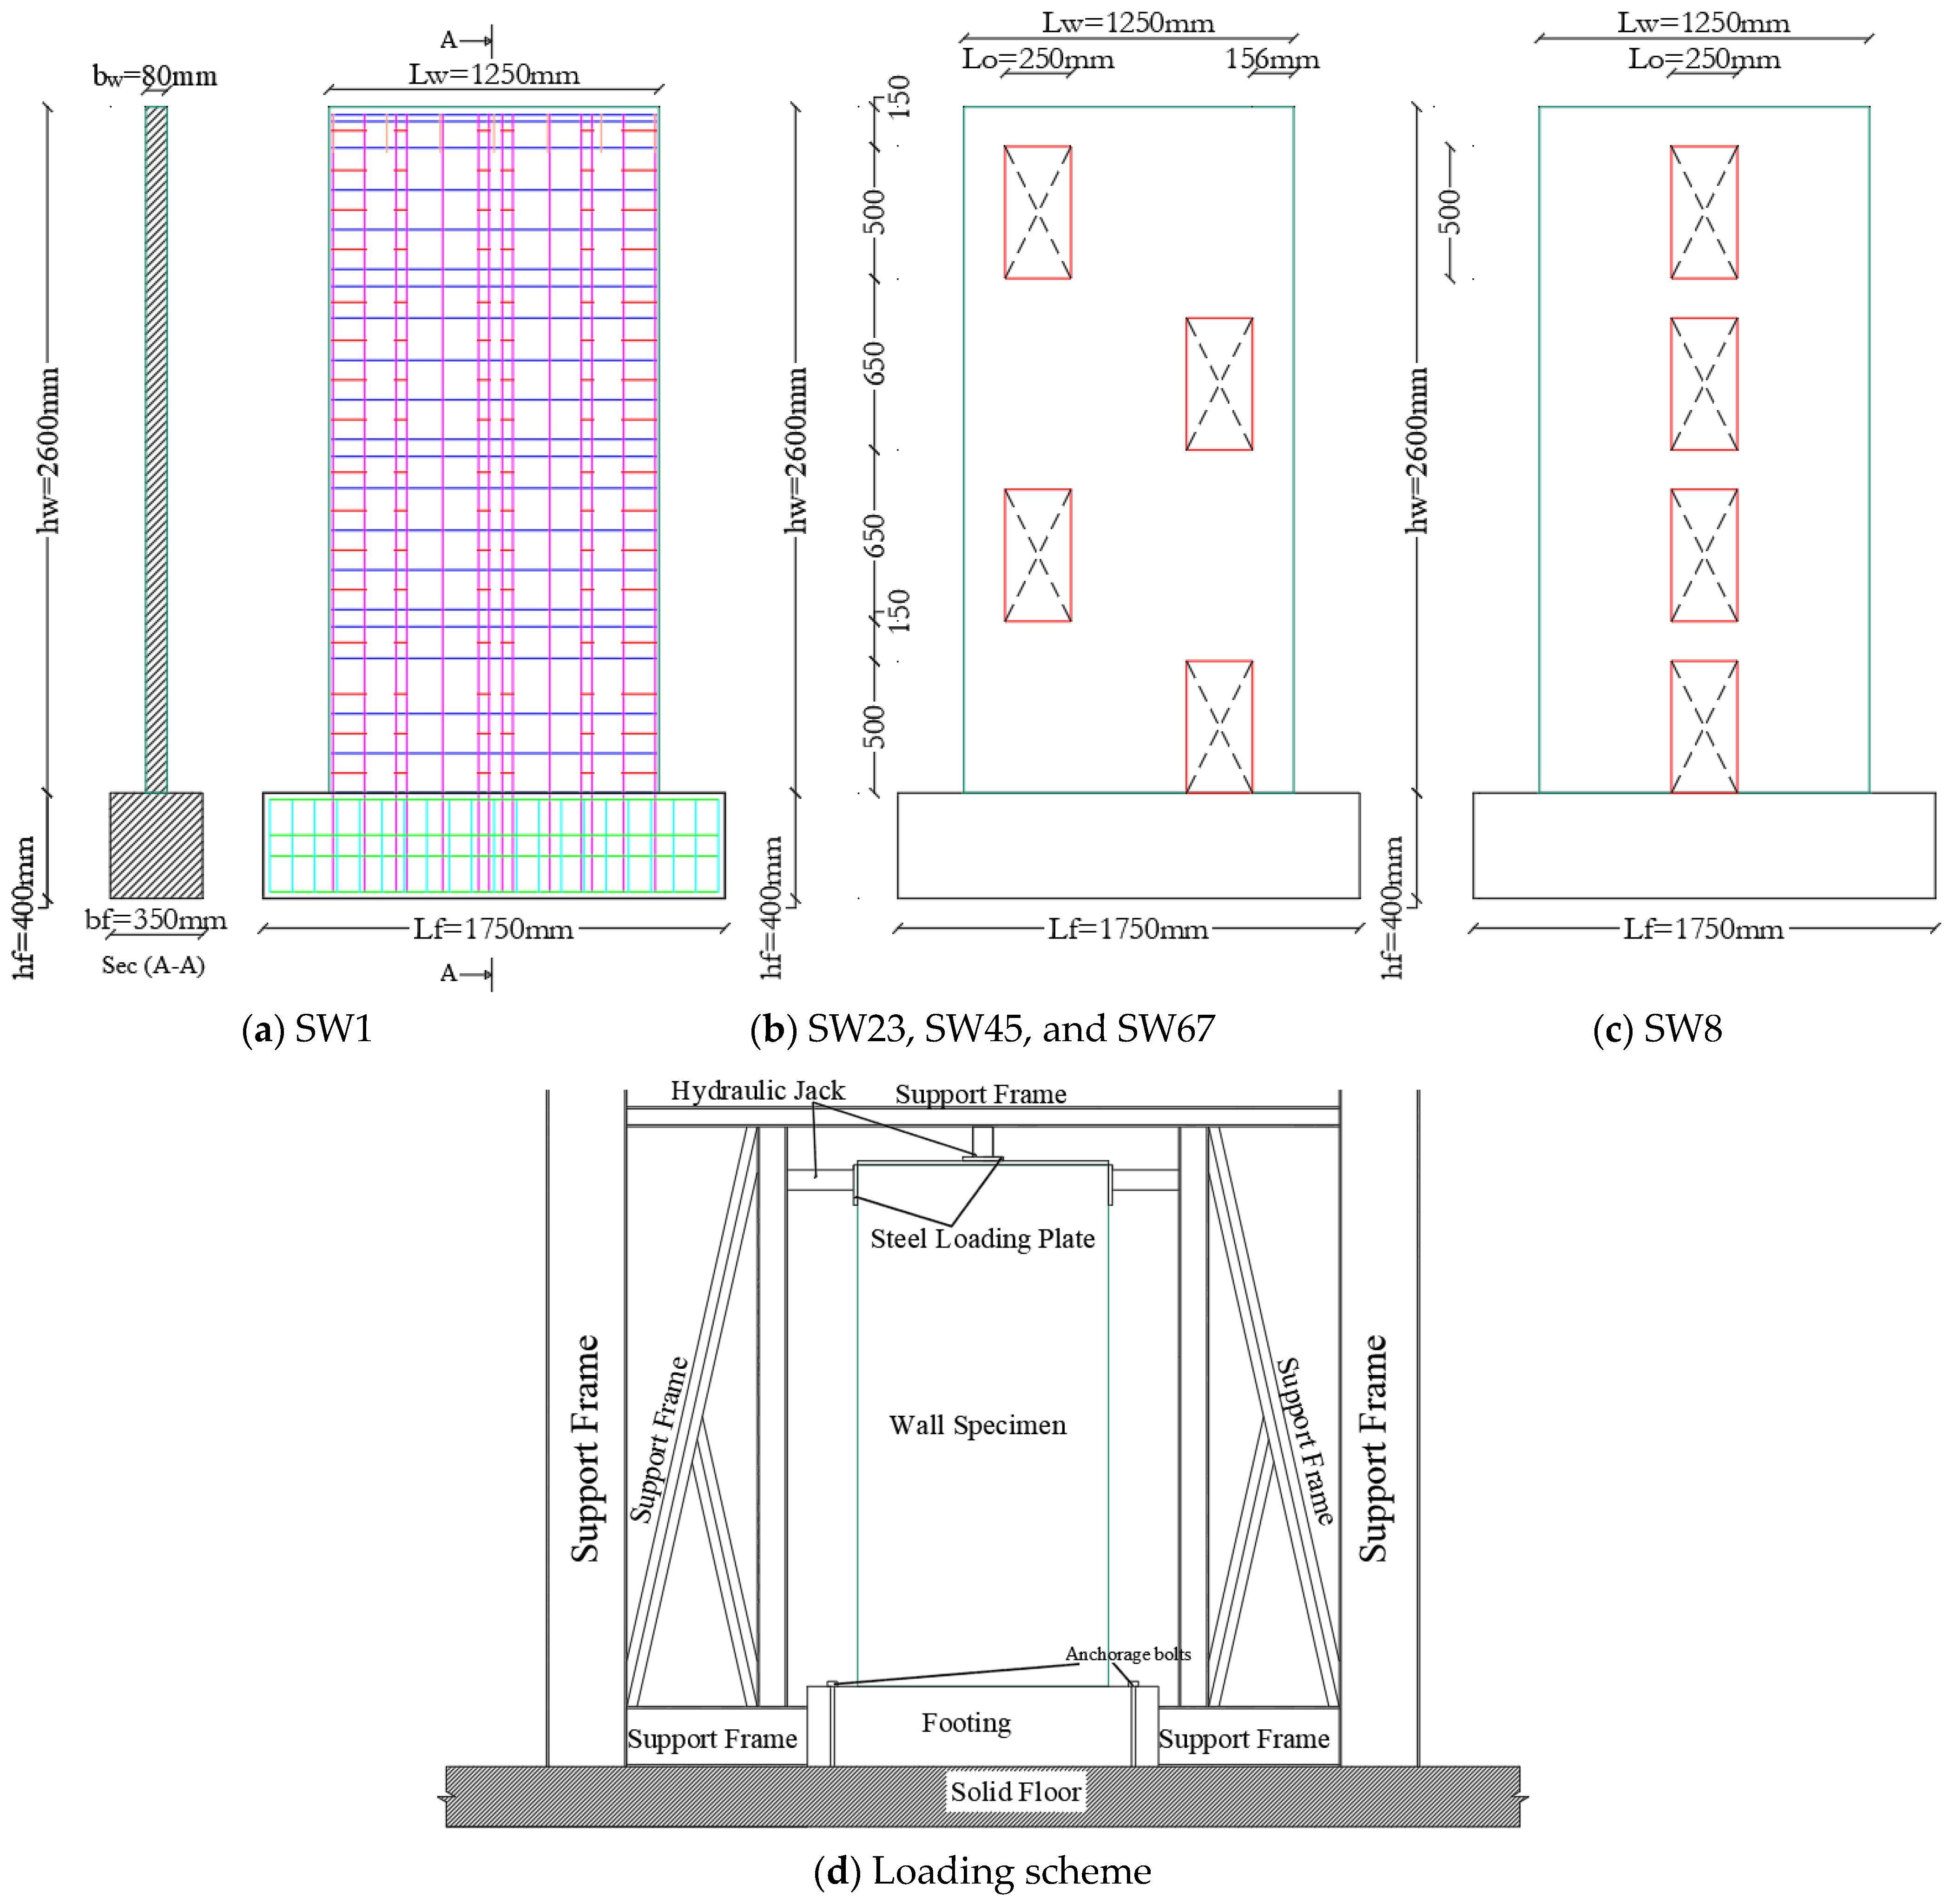
3.1. Previous Experimental Work
3.2. Verification of the FE Results
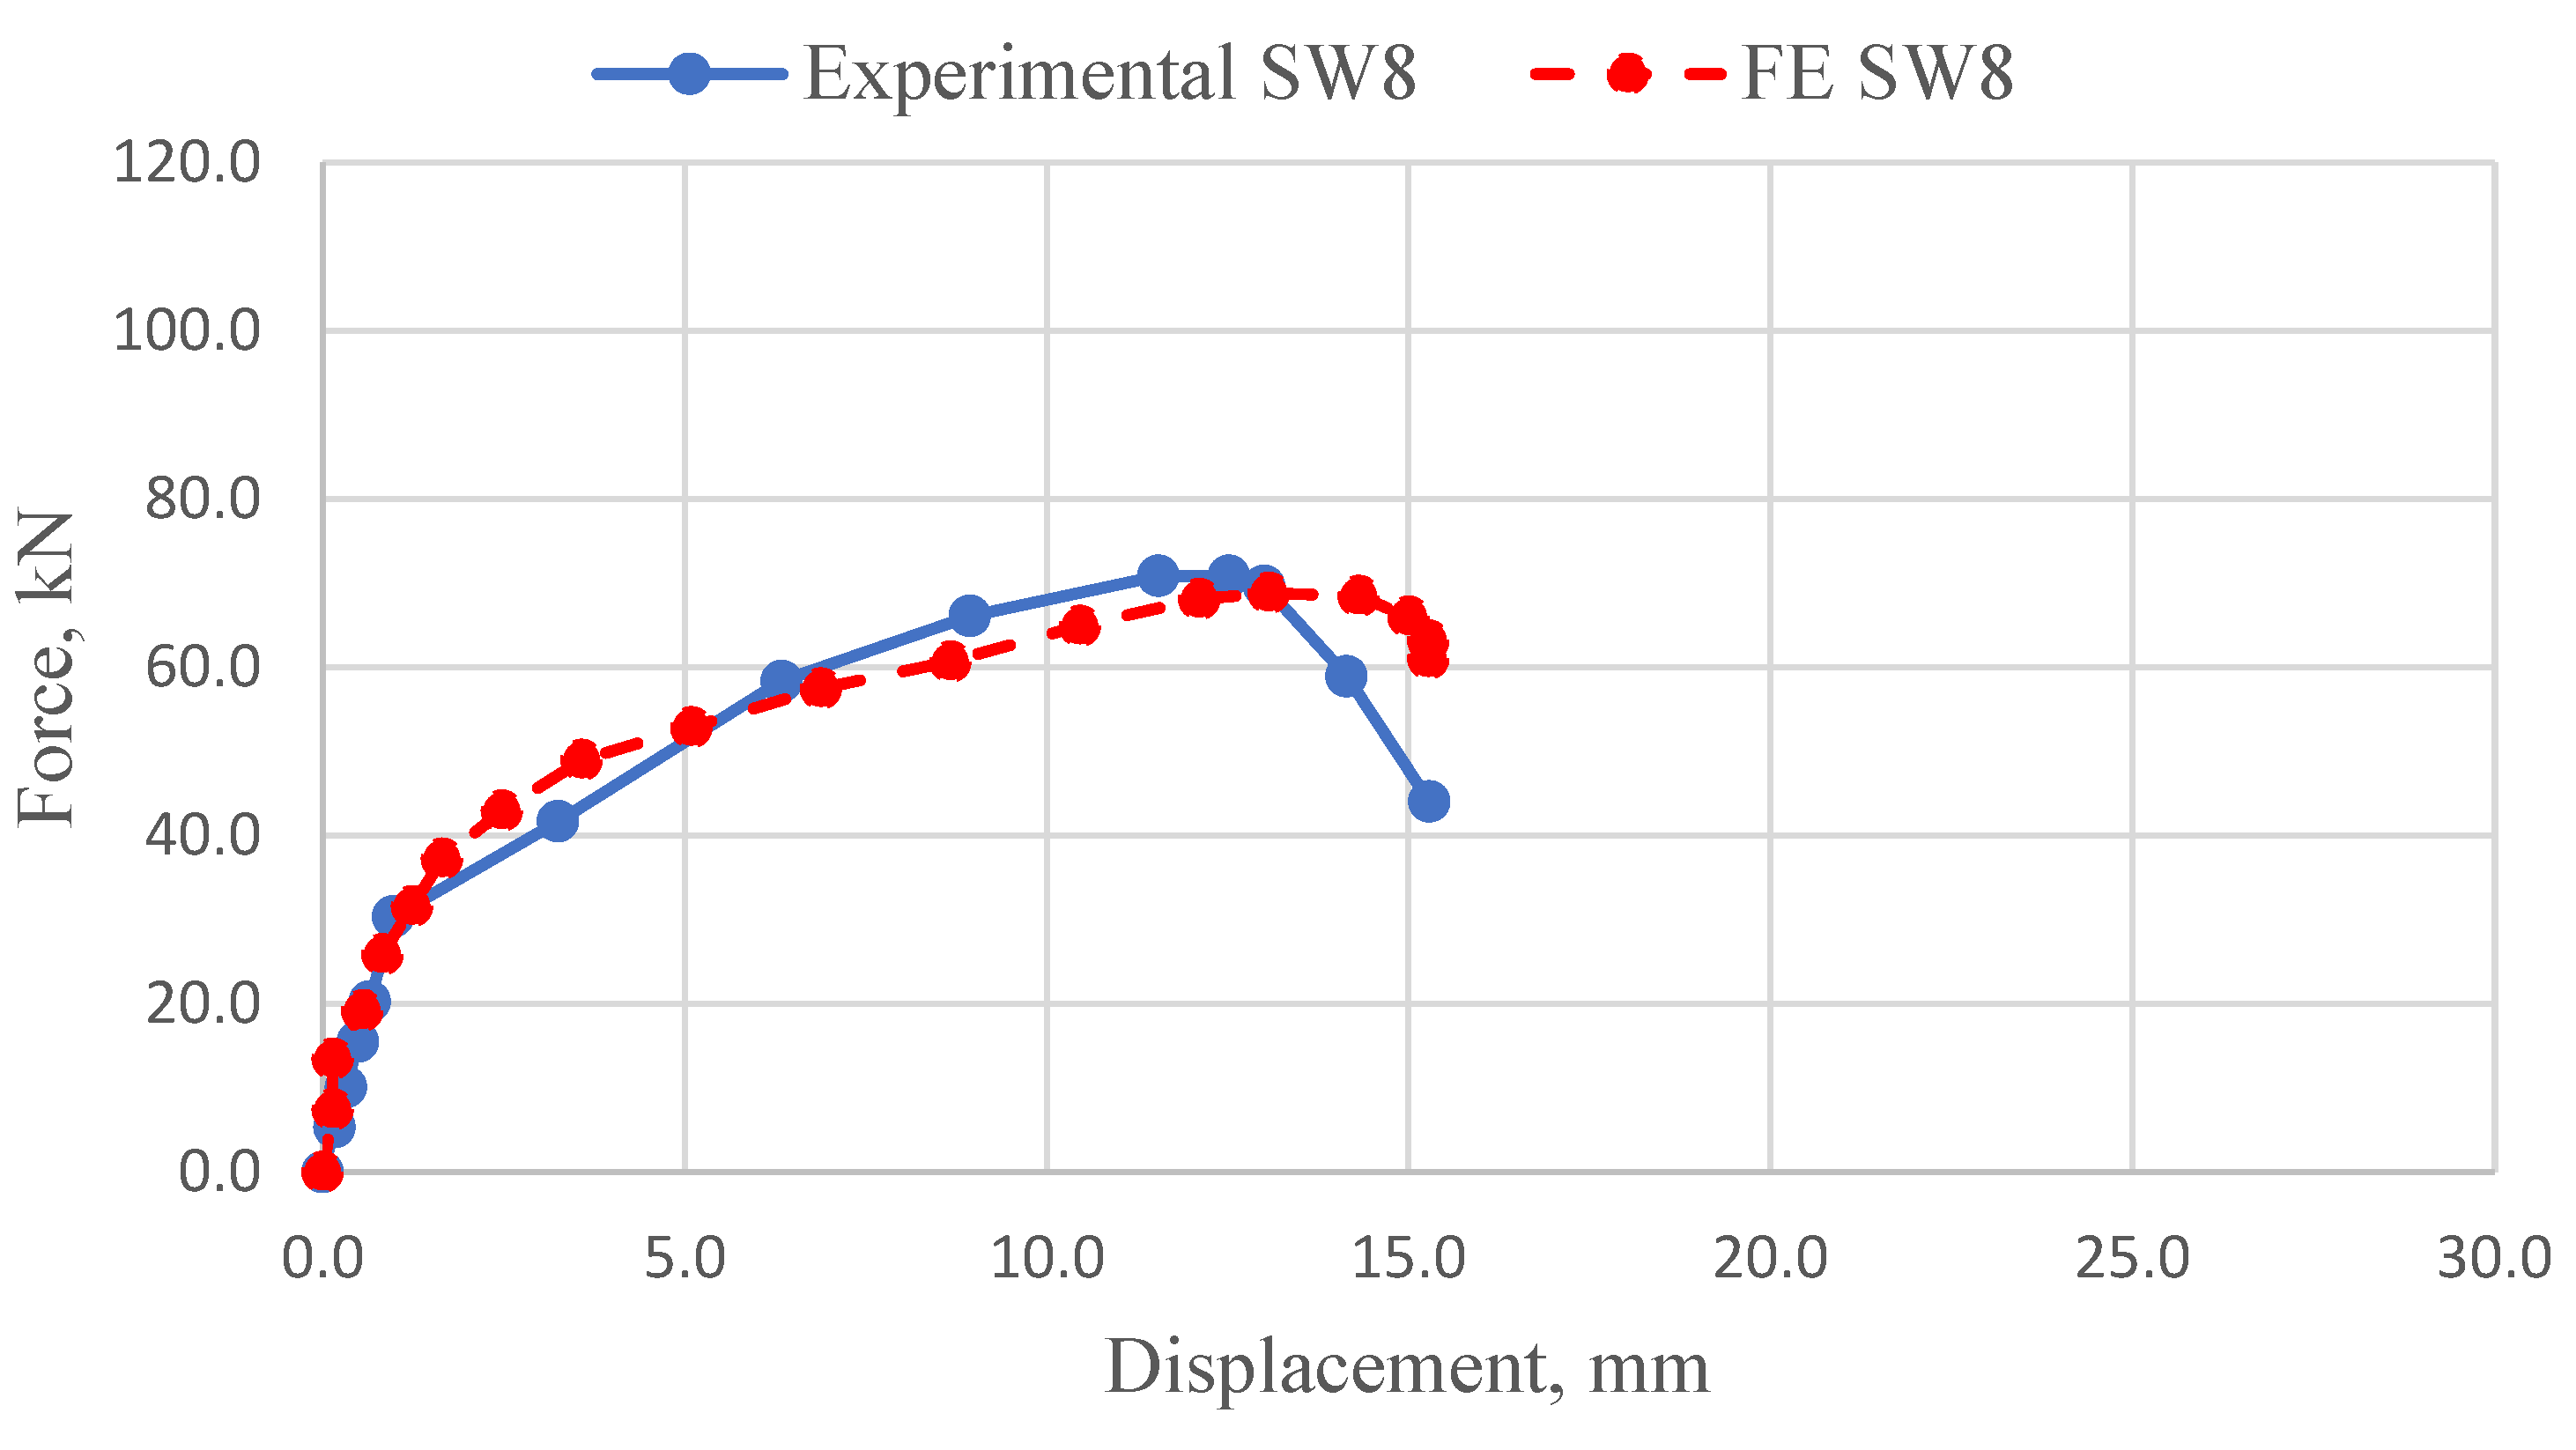
3.2.1. Load–Displacement Response
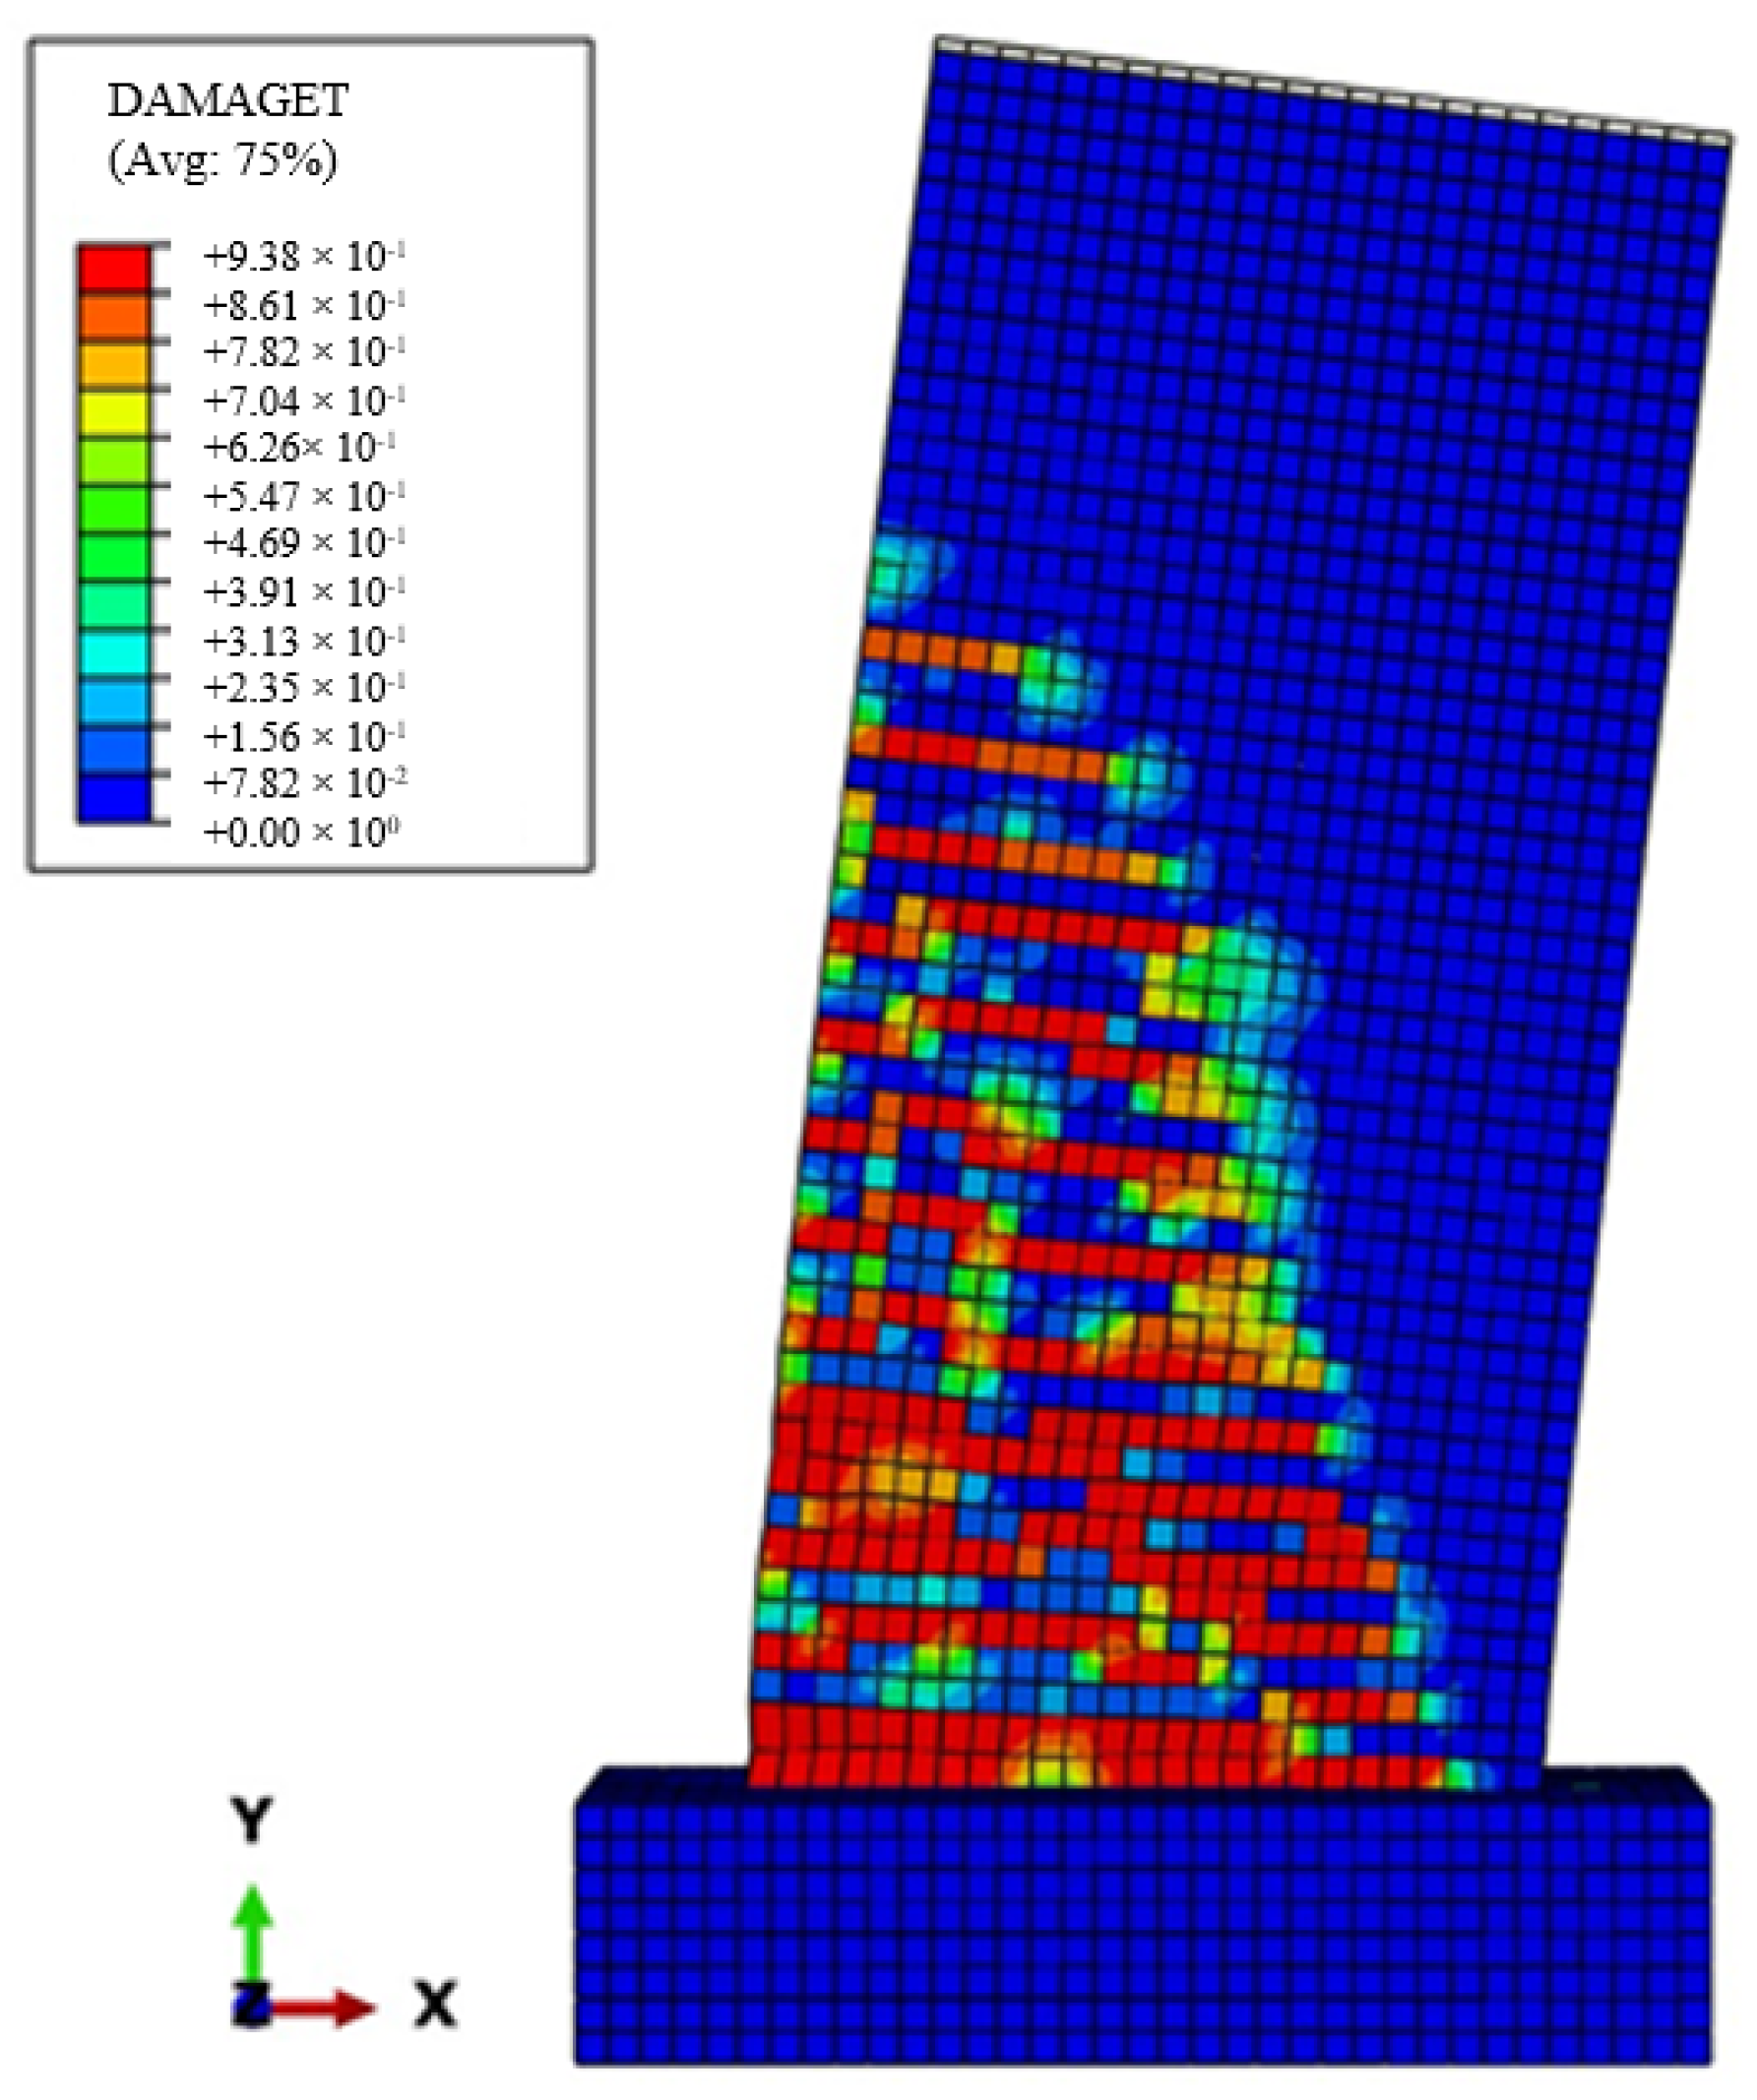
3.2.2. Crack Patterns and Failure Modes
4. Parametric Study
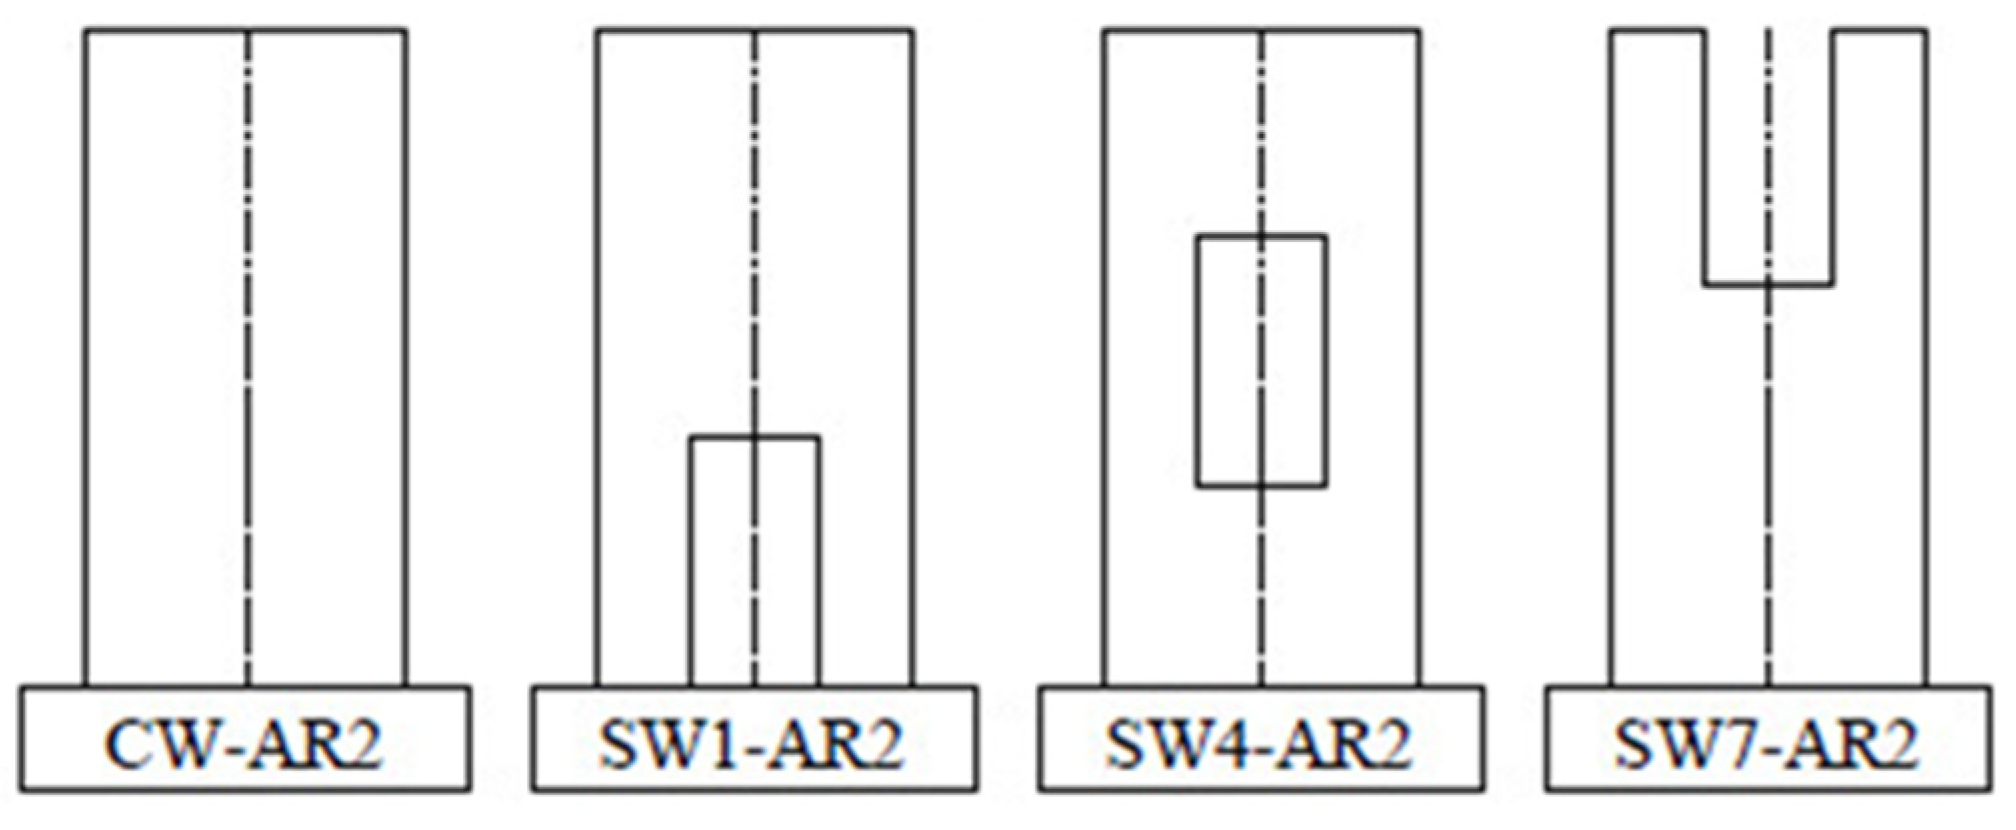
4.1. Methodology of Changing Cutting-Out Opening Locations in the Shear Wall
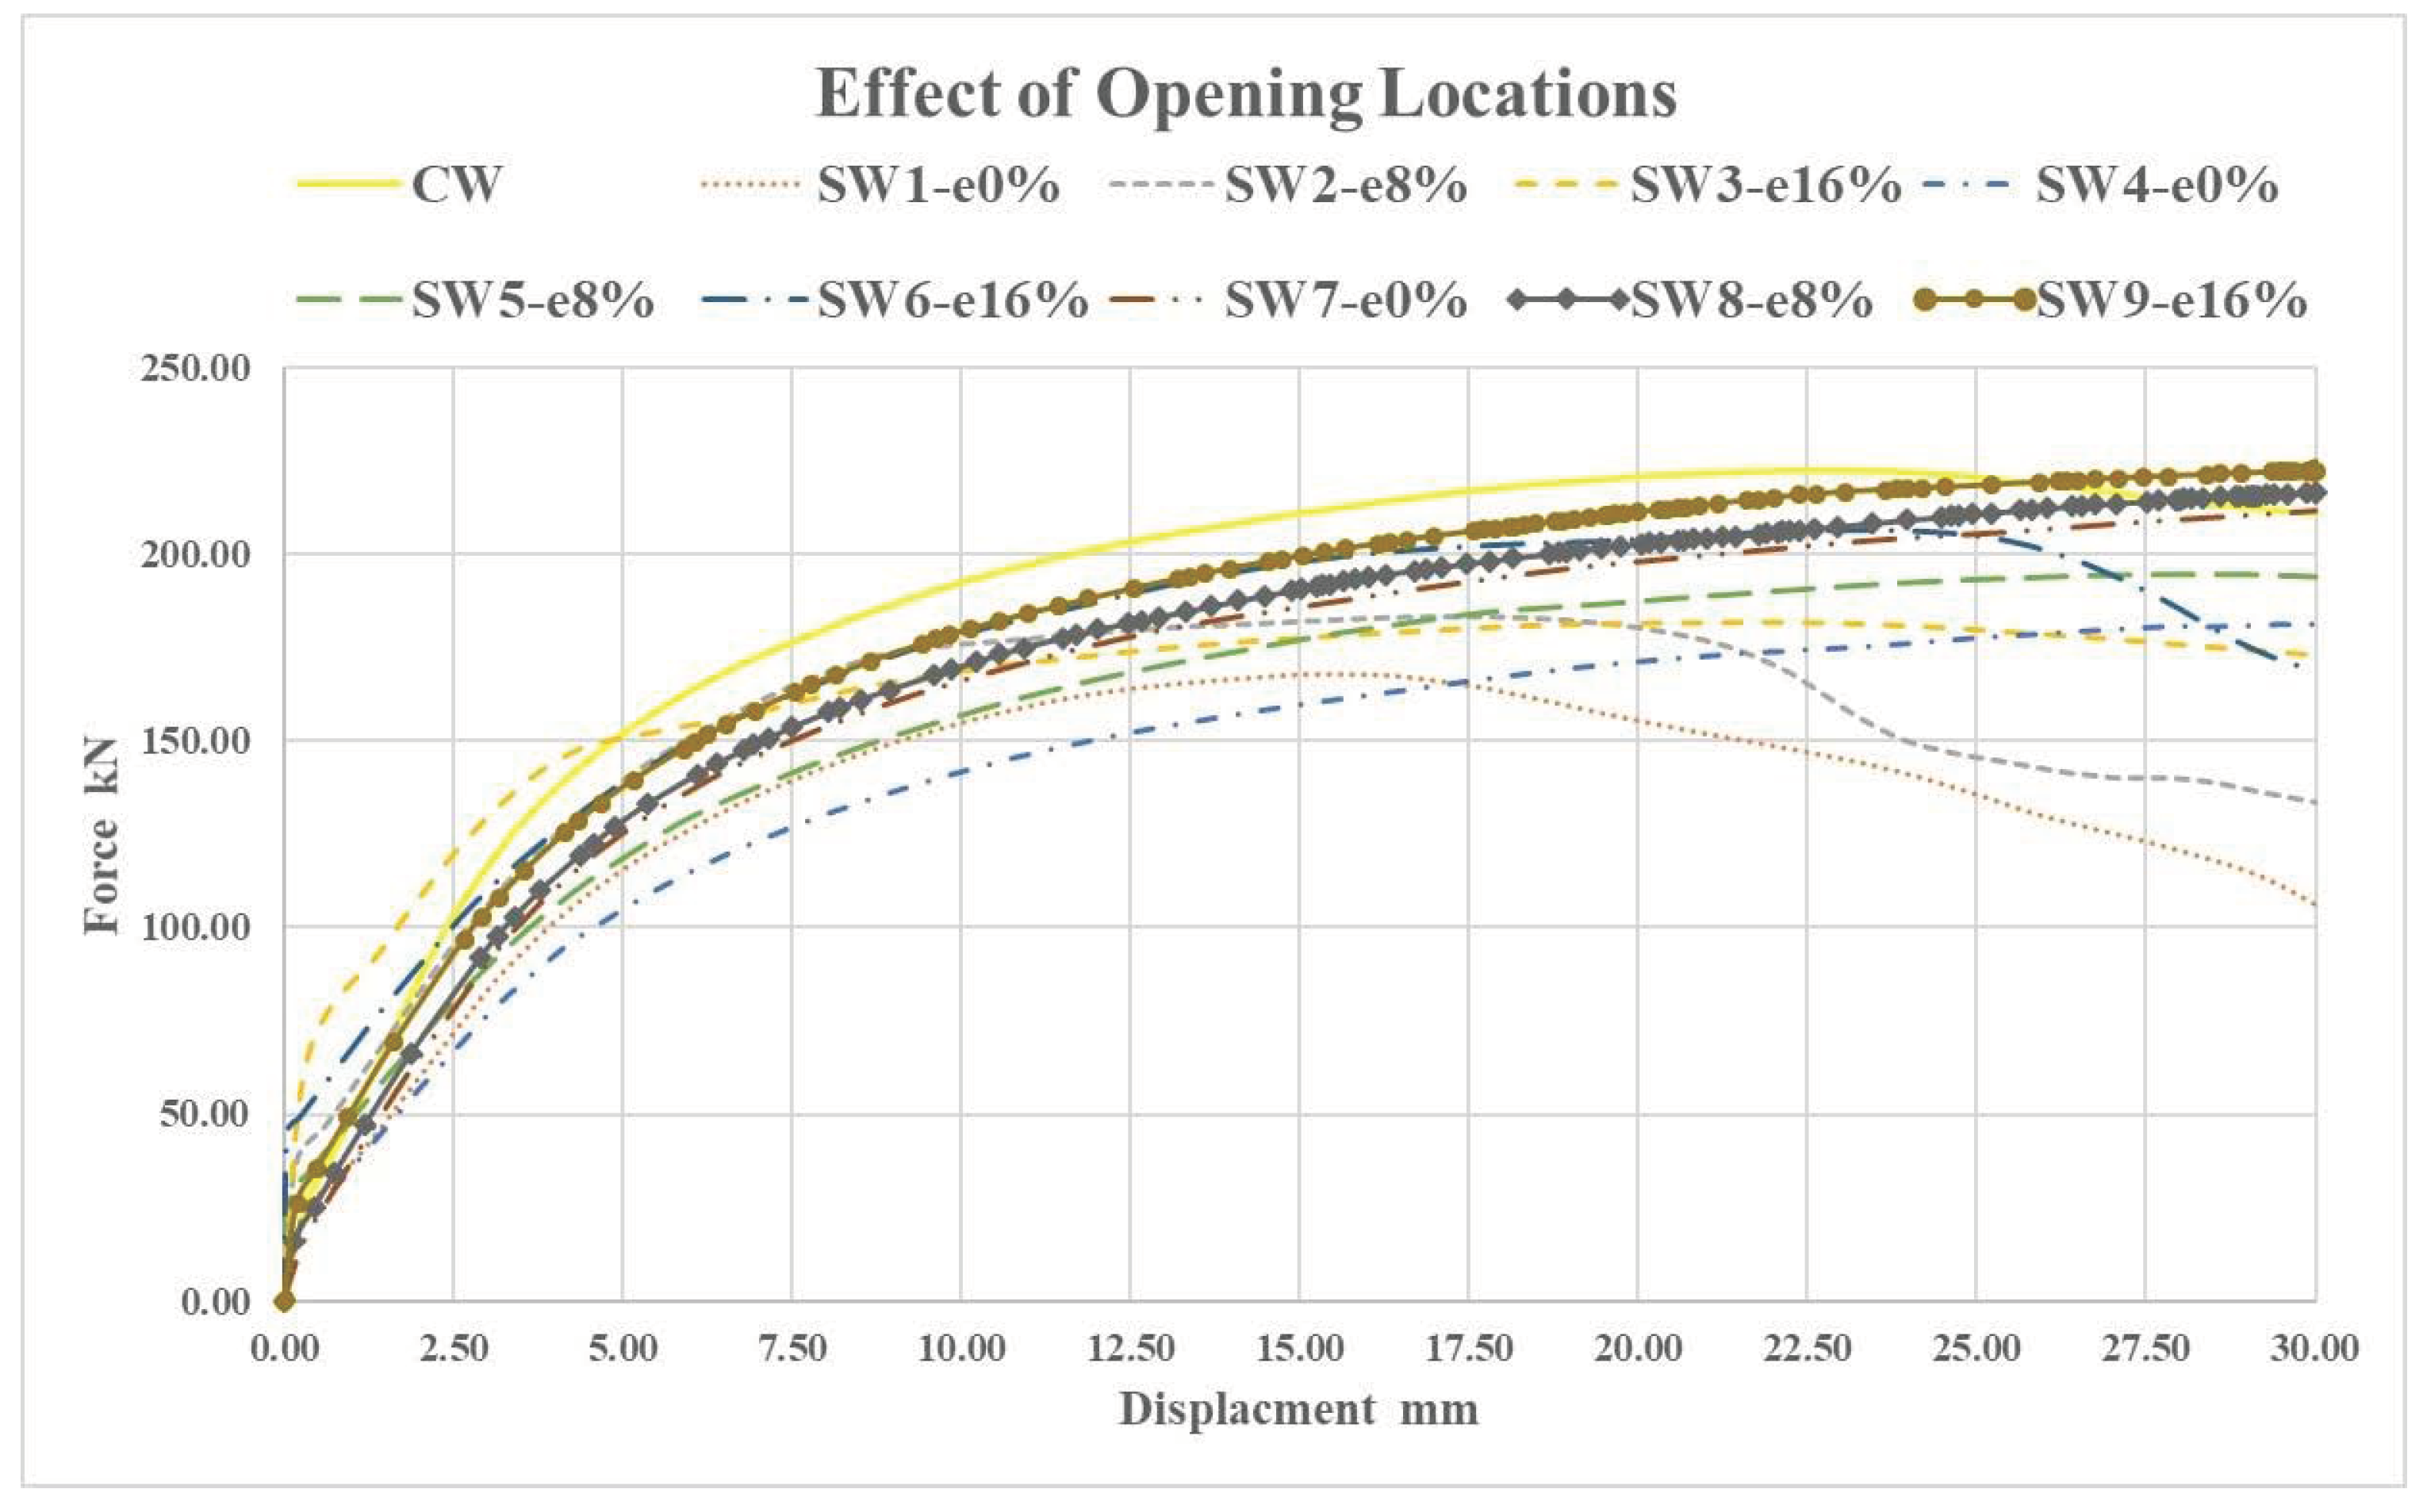
4.2. Effect of Changing the Cutting-Out Opening Locations
4.3. Effect of Changing the Opening Size
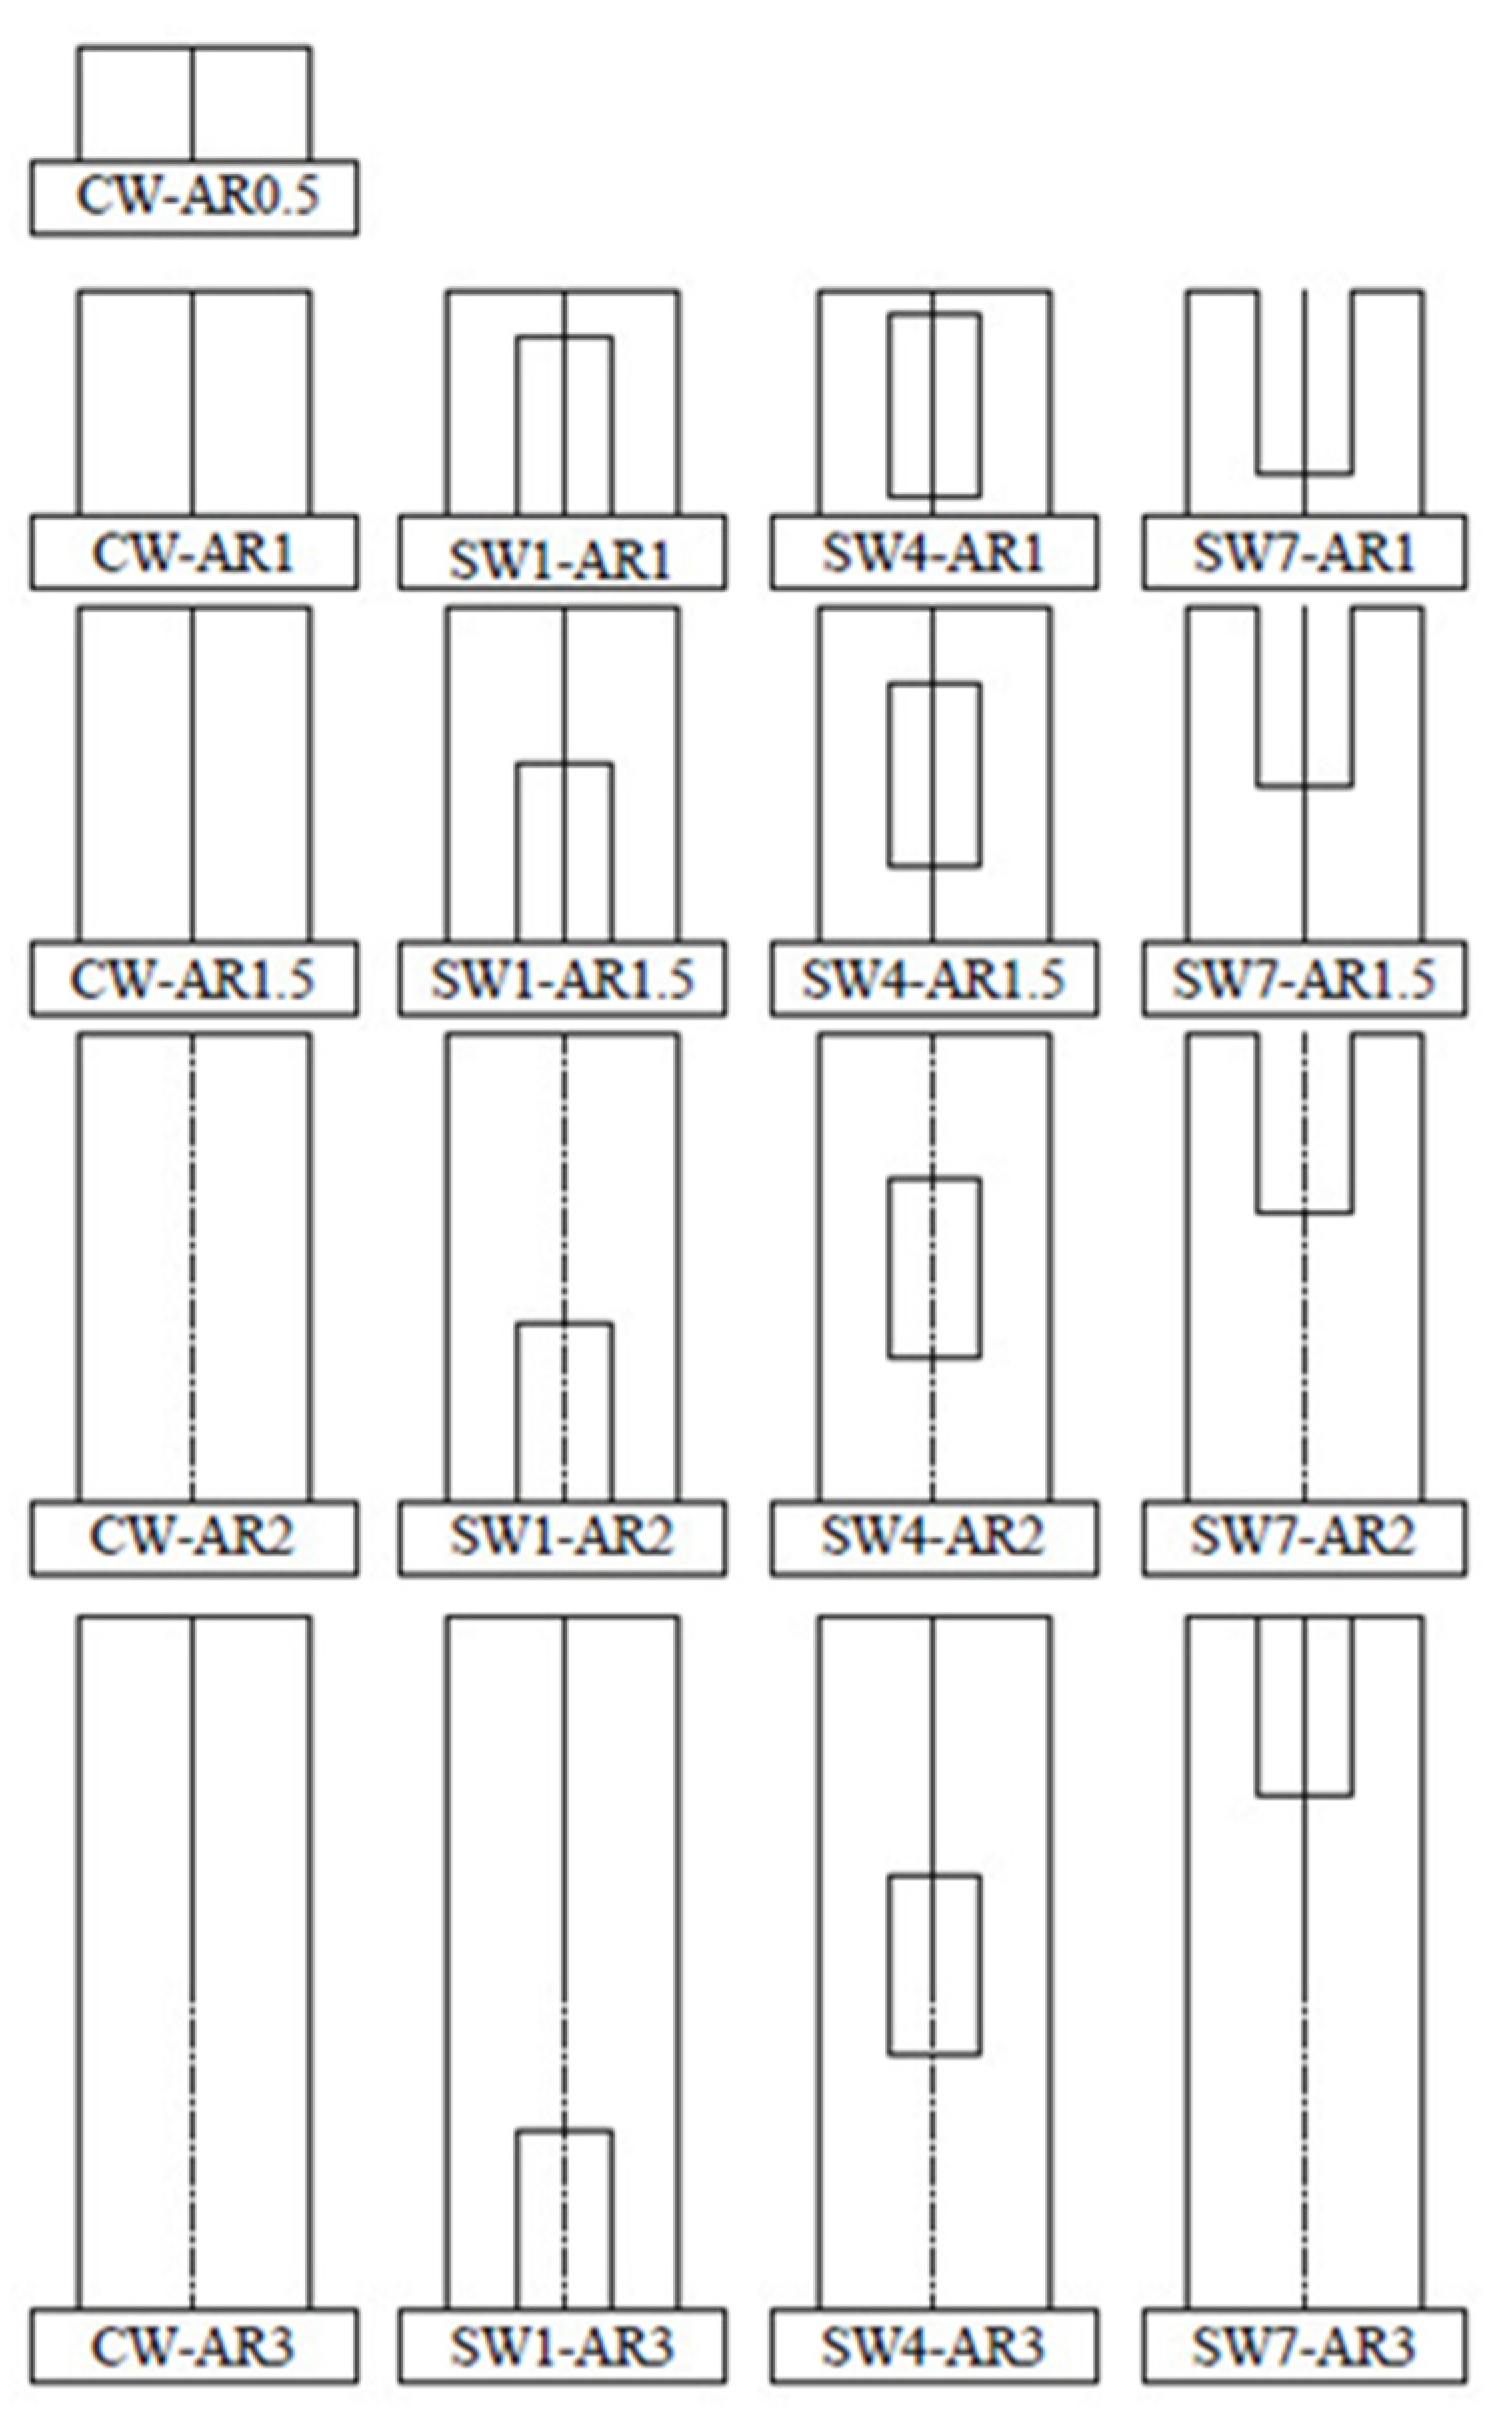
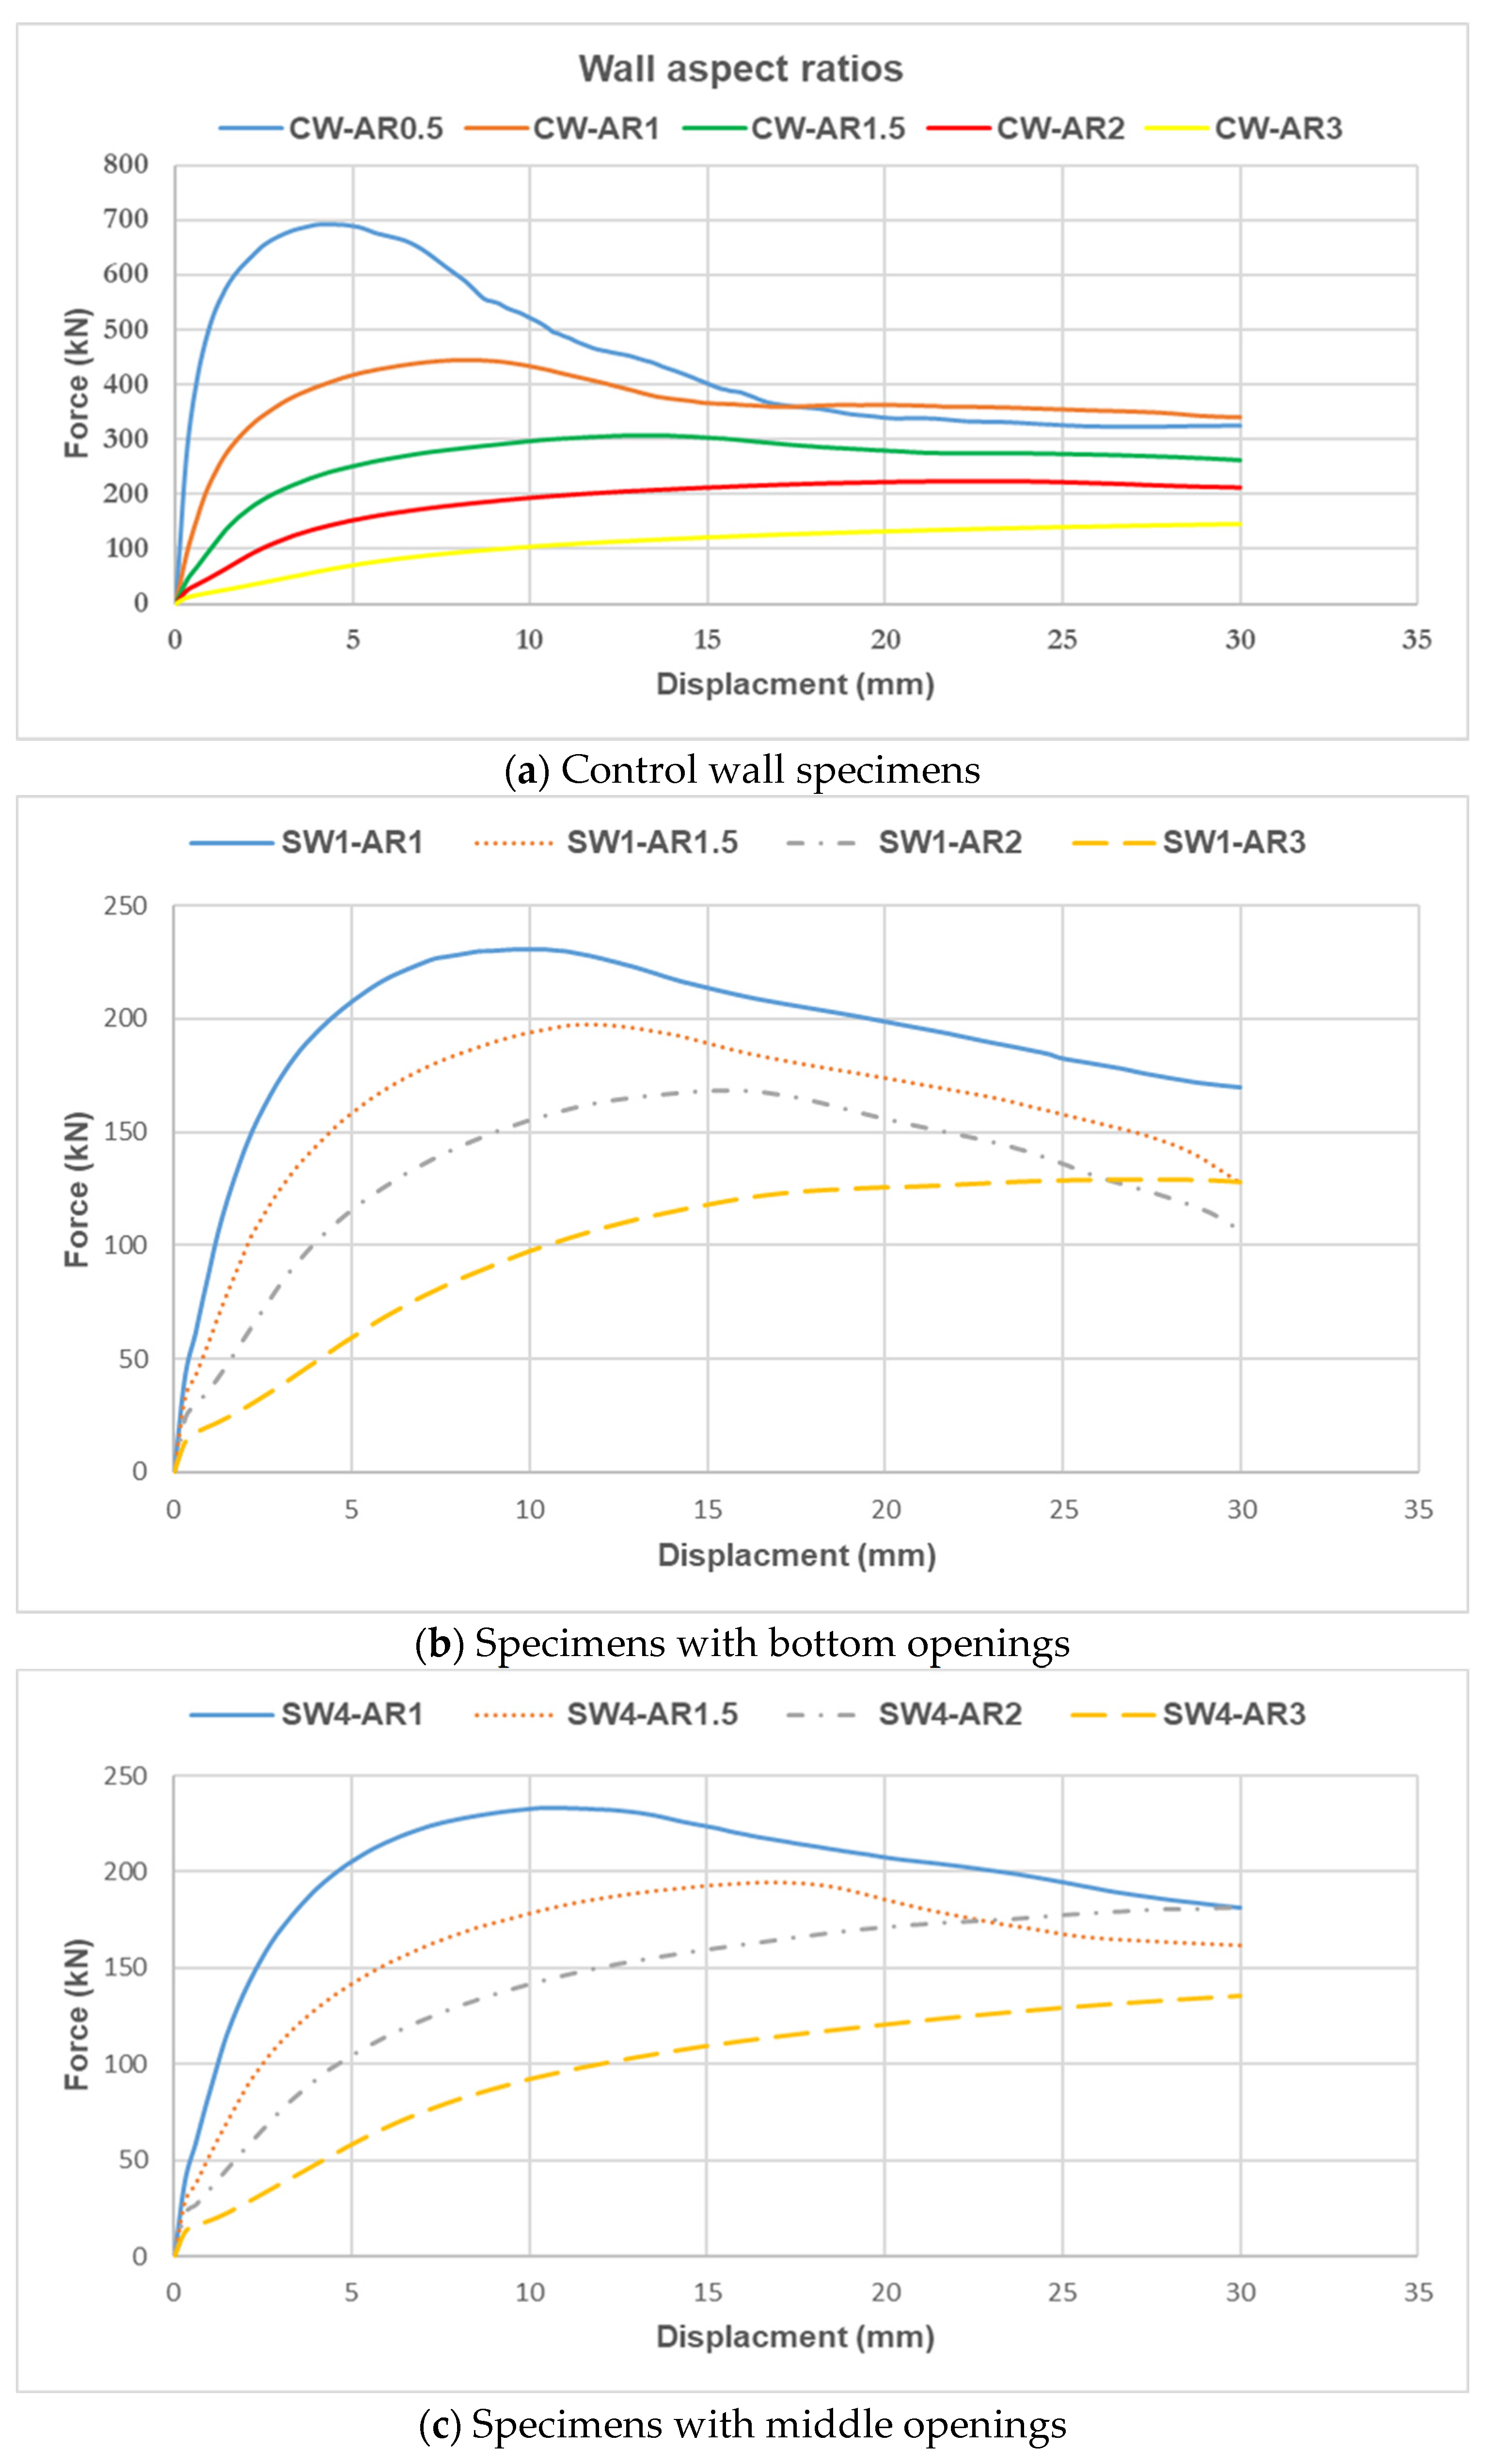
4.4. Effect of Changing Aspect Ratios of Shear Walls
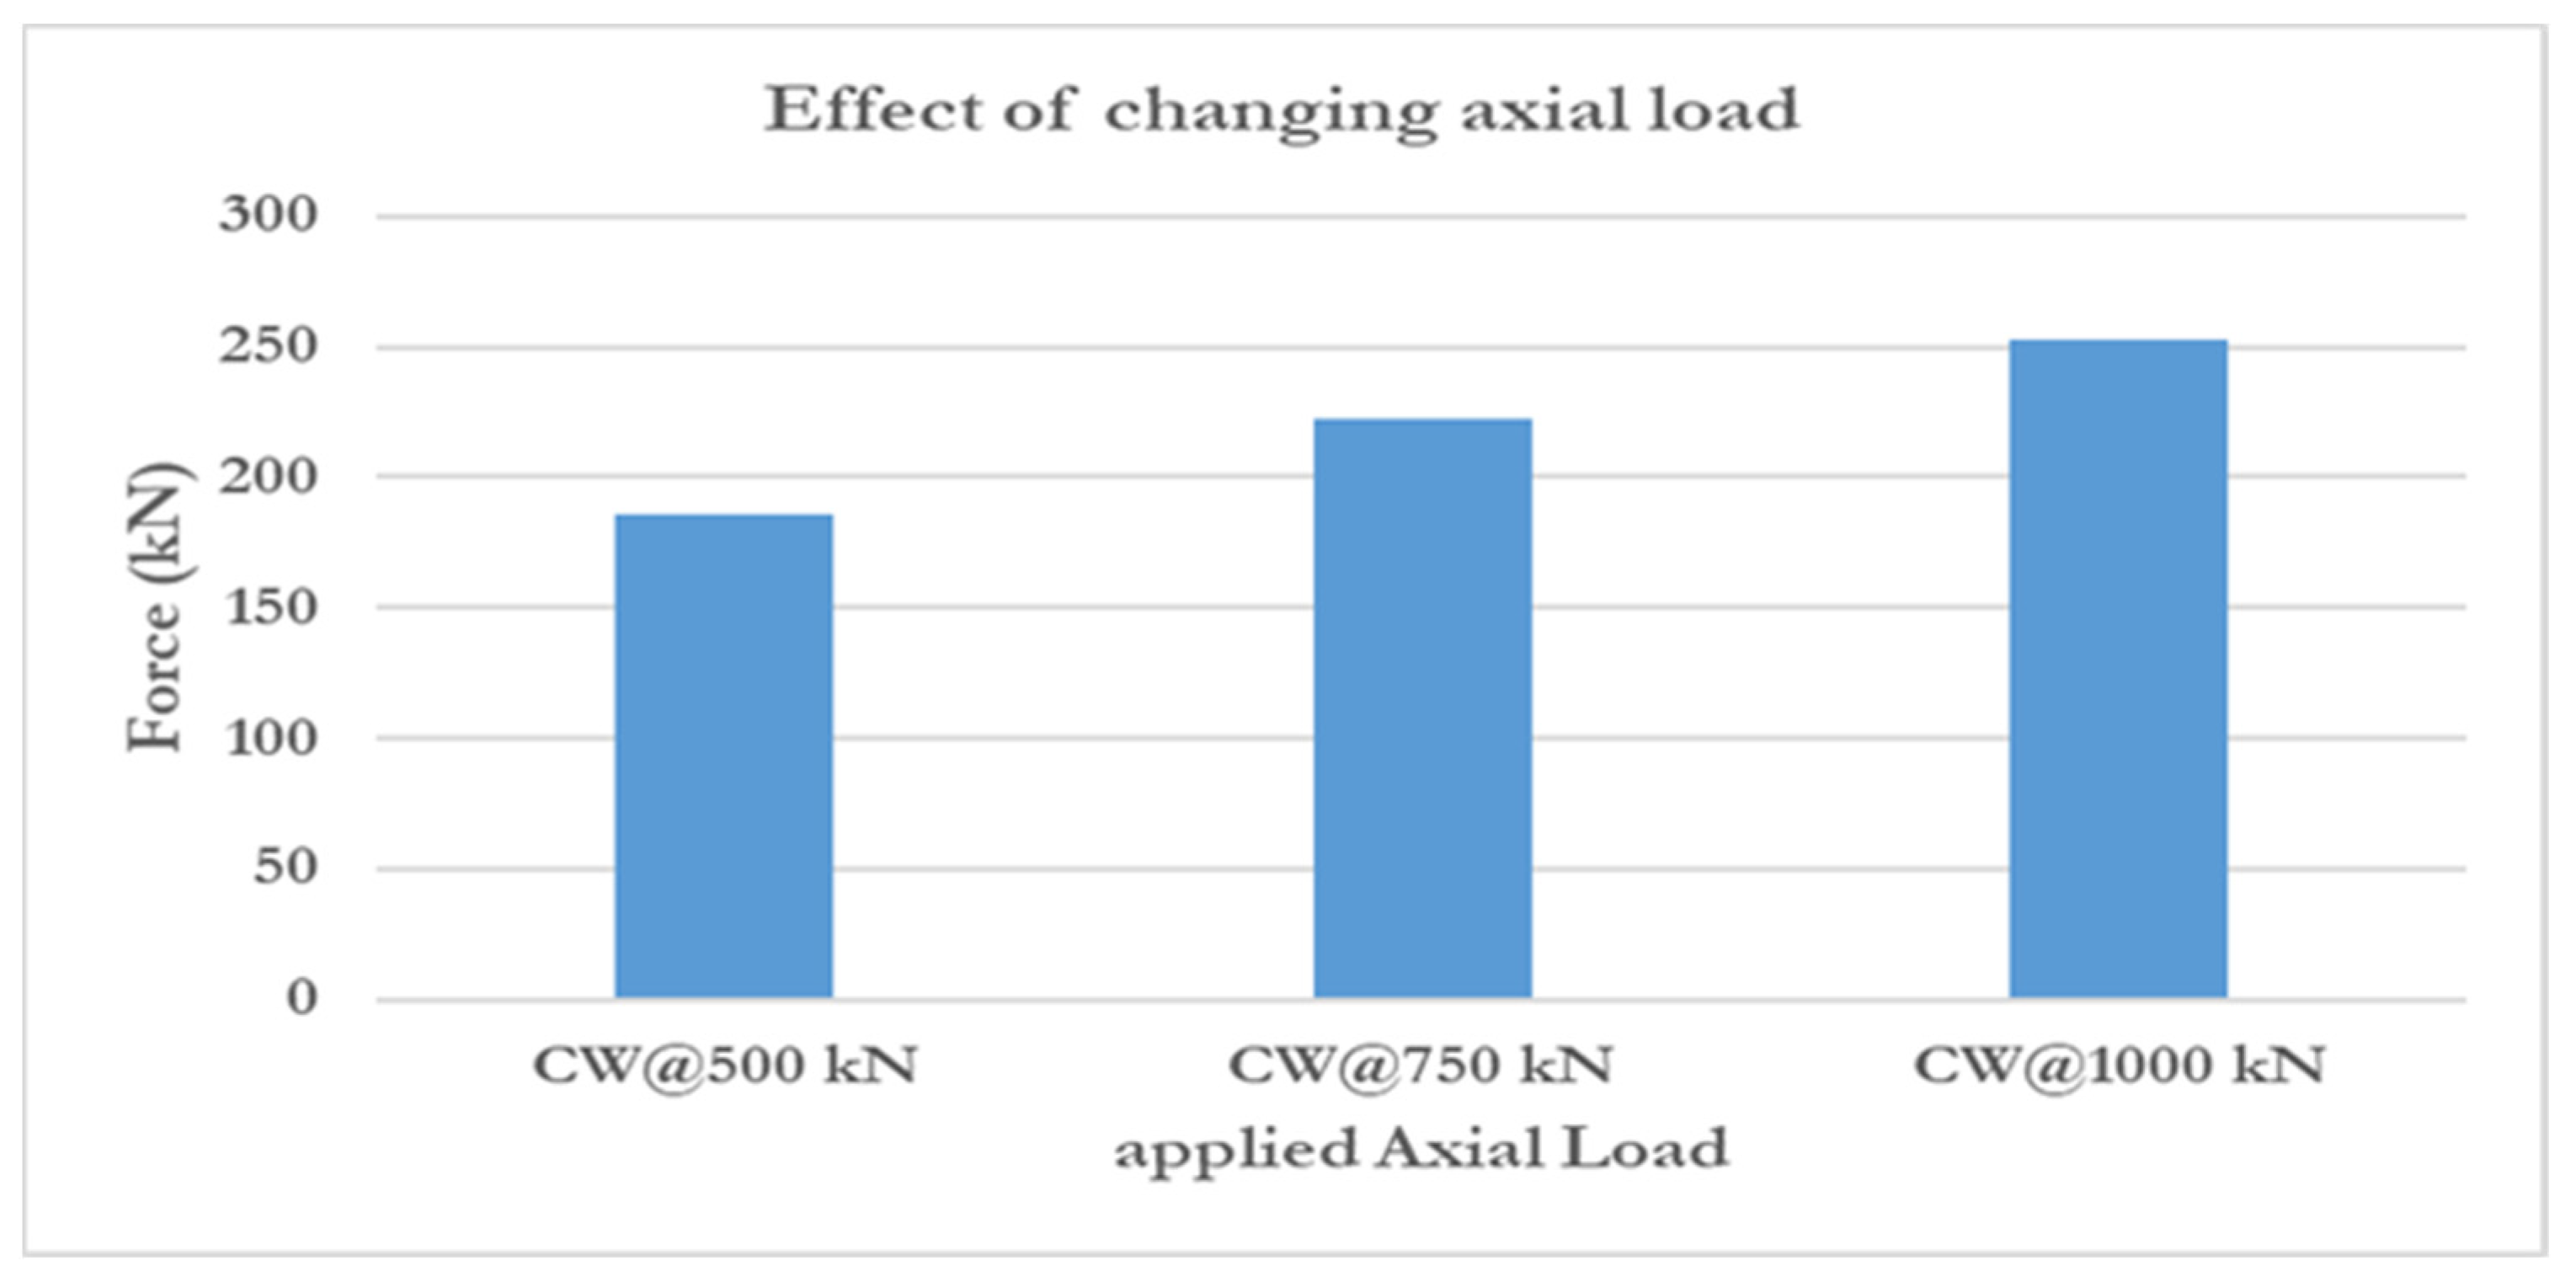
4.5. Effect of the Vertical Axial Load on Shear Walls
4.6. Impact of the Compressive Strength of Concrete
5. Discussion
5.1. Stiffness Degradation
5.2. Ductility
5.3. Energy Dissipation Capacity
6. Conclusions
- The opening’s location greatly affects lateral bearing capacity, energy absorption, and stiffness. The ideal opening placement is at the wall’s bottom when the opening is away from the wall center axis, where the wall’s load-bearing capacity is lowered by 18%. When the hole is cut into the wall’s top, its centralization percentage is 16%.
- Load-bearing capability depended on the eccentric ratio. The lateral loading capacity drop increased by 8% when the bottom wall opening was created with an eccentric ratio of 0% to 16%. Create the top wall opening with an eccentric ratio from 0% to 16% to reduce lateral loading capacity by 5%.
- The size ratio lowered wall capacity and stiffness and increased flexibility and displacement. In addition, opening size ratios below 21% demonstrated that opening height had a modest and undetectable effect on concrete wall loading capacity.
- The opening width exerted a significant influence on the load capacity of the wall. Therefore, it is suggested that any opening in the concrete wall be reduced, the width should not exceed 40% of the total width, and the area of the cut-out hole should not exceed 21% of the entire area of the wall.
- By increasing the wall aspect ratio, the lateral bearing capacity and stiffness decreased. The aspect ratio of 1.5 was the optimum ratio.
- This study confirmed that increasing the applied axial load can enhance the lateral bearing capacity of the wall but adversely affect its ductility.
- This investigation shows that load-bearing capacity decreases with increasing concrete strength under constant vertical load. With an enhancement rate of 15.5% from 30 MPa to 50 MPa and 5.75% from 50 MPa to 70 MPa, the concrete strength of 50 MPa appears to be the most efficient concrete strength for this kind of wall.
- The stiffness and energy dissipation capacity of the walls decreased with increasing the opening cross-section area, unlike ductility, which increases with the increase in the cross-sectional area of the wall.
Author Contributions
Funding
Data Availability Statement
Conflicts of Interest
References
- Aslani, K.; Kohnehpooshi, O. Structural behavior of FRP-strengthened reinforced concrete shear walls with openings using finite element method. Adv. Struct. Eng. 2018, 21, 1072–1087. [Google Scholar] [CrossRef]
- Mosallam, A.S.; Nasr, A. Structural performance of RC shear walls with post-construction openings strengthened with FRP composite laminates. Compos. Part B Eng. 2017, 115, 488–504. [Google Scholar] [CrossRef]
- Hosseini, S.A.; Kheyroddin, A.; Mastali, M. An experimental investigation into the impacts of eccentric openings on the in-plane behavior of squat RC shear walls. Eng. Struct. 2019, 197, 109410. [Google Scholar] [CrossRef]
- Yu, H.J.; Kang, S.M.; Park, H.G.; Chung, L. Cyclic loading test of structural walls with small openings. Int. J. Concr. Struct. Mater. 2019, 13, 40. [Google Scholar] [CrossRef]
- ACI. ACI 318R-19; Building Code Requirements for Structural Concrete and Commentary. American Concrete Institute (ACI): Farmington Hills, MI, USA, 2019.
- Liu, M.; Yuan, G.; Sun, W.; Shu, Q.; Zhao, Z.; Lu, L. Experimental and numerical investigation on the seismic performance of RC squat shear walls with single post-opening reinforced by steel plates. Eur. J. Environ. Civ. Eng. 2024, 28, 53–79. [Google Scholar] [CrossRef]
- Mosoarca, M. Failure analysis of RC shear walls with staggered openings under seismic loads. Eng. Fail. Anal. 2014, 41, 48–64. [Google Scholar] [CrossRef]
- Popescu, C.; Sas, G.; Sabău, C.; Blanksvärd, T. Effect of cut-out openings on the axial strength of concrete walls. J. Struct. Eng. 2016, 142, 04016100. [Google Scholar] [CrossRef]
- Li, B.; Qian, K.; Wu, H. Flange effects on seismic performance of reinforced concrete squat walls with irregular or regular openings. Eng. Struct. 2016, 110, 127–144. [Google Scholar] [CrossRef]
- Simulia. ABAQUS/Standard user’s Manual, Volume II Version 6.10; Hibbitt Karlsson and Sorenson Inc.: Providence, RI, USA, 2010. [Google Scholar]
- Ou, Y.C.; Hoang, L.; Roh, H. Cyclic behavior of squat reinforced concrete walls with openings typical of exterior walls of row houses in Taiwan. Eng. Struct. 2019, 195, 231–242. [Google Scholar] [CrossRef]
- Sabau, C.; Popescu, C.; Bagge, N.; Sas, G.; Blanksvärd, T.; Täljsten, B. Local and global behavior of walls with cut-out openings in multi-story reinforced concrete buildings. Eng. Struct. 2019, 187, 57–72. [Google Scholar] [CrossRef]
- Todea, V.; Dan, D.; Florut, S.C.; Stoian, V. Experimental investigations on the seismic behavior of composite steel concrete coupled shear walls with central openings. Structures 2021, 33, 878–896. [Google Scholar] [CrossRef]
- Raza, A.; Khan QU, Z.; Ahmad, A. Numerical Investigation of Load-Carrying Capacity of GFRP-Reinforced Rectangular Concrete Members Using CDP Model in ABAQUS. Adv. Civ. Eng. 2019, 2019, 1745341. [Google Scholar] [CrossRef]
- Husain, M.; Eisa, A.S.; Hegazy, M.M. Strengthening of reinforced concrete shear walls with openings using carbon fiber-reinforced polymers. Int. J. Adv. Struct. Eng. 2019, 11, 129–150. [Google Scholar] [CrossRef]
- Kabaila, A.; Saenz, L.P.; Tulin, L.G.; Gerstle, K.H. Equation for the stress-strain curve of concrete. ACI J. 1964, 61, 1227–1239. [Google Scholar] [CrossRef]
- Hu, H.T.; Schnobrich, W.C. Constitutive modeling of concrete by using nonassociated plasticity. J. Mater. Civ. Eng. 1989, 1, 199–216. [Google Scholar] [CrossRef]
- Kmiecik, P.; Kamiński, M. Modelling of reinforced concrete structures and composite structures with concrete strength degradation taken into consideration. Arch. Civ. Mech. Eng. 2011, 11, 623–636. [Google Scholar] [CrossRef]
- Nielsen, M.P.; Hoang, L.C. Limit Analysis and Concrete Plasticity; CRC Press: Boca Raton, FL, USA, 2016. [Google Scholar] [CrossRef]
- Nayal, R.; Rasheed, H.A. Tension stiffening model for concrete beams reinforced with steel and FRP bars. J. Mater. Civ. Eng. 2016, 18, 831–841. [Google Scholar] [CrossRef]
- Lubliner, J.; Oliver, J.; Oller, S.; Oñate, E. A plastic-damage model for concrete. Int. J. Solids Struct. 1989, 25, 299–326. [Google Scholar] [CrossRef]
- Birtel, V.; Mark, P. Parameterised finite element modelling of RC beam shear failure. In Proceedings of the ABAQUS Users’ Conference, Cambridge, MA, USA, 23–25 May 2006; Volume 14, pp. 95–108. [Google Scholar]
- Canadian Standards Association. A23.3-04; Design of Concrete Structures. Canadian Standards Association: Mississauga, ON, Canada, 2004.
- Wang, J.Y.; Sakashita, M.; Kono, S.; Tanaka, H.; Lou, W.J. Behavior of reinforced concrete structural walls with various opening locations: Experiments and macro model. J. Zhejiang Univ. Sci. A 2010, 11, 202–211. [Google Scholar] [CrossRef]
- Wang, J.; Sakashita, M.; Kono, S.; Tanaka, H. Shear behaviour of reinforced concrete structural walls with eccentric openings under cyclic loading: Experimental study. Struct. Des. Tall Spec. Build. 2012, 21, 669–681. [Google Scholar] [CrossRef]
- Emara, M.; Rizk, M.; Mohamed, H.; Zaghlal, M. Enhancement of circular RC columns using steel mesh as internal or external confinement under the influence of axial compression loading. Frat. Integrità Strutt. 2021, 15, 86–104. [Google Scholar] [CrossRef]
- Salonikios, T.N.; Kappos, A.J.; Tegos, I.A.; Penelis, G.G. Cyclic load behavior of low-slenderness reinforced concrete walls: Failure modes, strength and deformation analysis, and design implications. ACI Struct. J. 2000, 97, 132–141. [Google Scholar]
- Long, N.-M.; Phuong, P.-V.; Duong, T.-T.; Quynh, P.T.T.; Thong, M.P.; Cuong, N.-H.; Rovňák, M. Flexural-strengthening efficiency of CFRP sheets for unbonded post-tensioned concrete T-beams. Eng. Struct. 2018, 166, 1–15. [Google Scholar] [CrossRef]


| Dilation Angle (ψ) | Eccentricity | K | Viscosity Parameter | |
|---|---|---|---|---|
| 37 | 0.1 | 1.16 | 0.67 | 0.001 |
| Average Tensile Strength [MPa] | Average Compressive Strength [MPa] | Compressive Strain | Modulus of Elasticity [MPa] | |
|---|---|---|---|---|
| Concrete | Fctm = 3 | Fcm = 50 | 0.0035 | Ec = 34,000 |
| Diameter [mm] | Yield Strength [MPa] | Ultimate Strength [MPa] | Modulus of Elasticity [MPa] | |
| Rebar | 6 | Fy = 386 | Fu = 551 | Es = 210,000 |
| Specimens Label | Experimental [5] | Numerical (FEM) | PFEM⁄PEXP % | ||
|---|---|---|---|---|---|
| Ultimate Load PEXP [kN] | Ultimate Displacement [mm] | Ultimate Load PFEM [kN] | Ultimate Displacement [mm] | ||
| CW | 113.63 | 14.00 | 106.397 | 26.48 | 93.63 |
| SW8 | 70.85 | 11.80 | 68.80 | 13.60 | 97.10 |
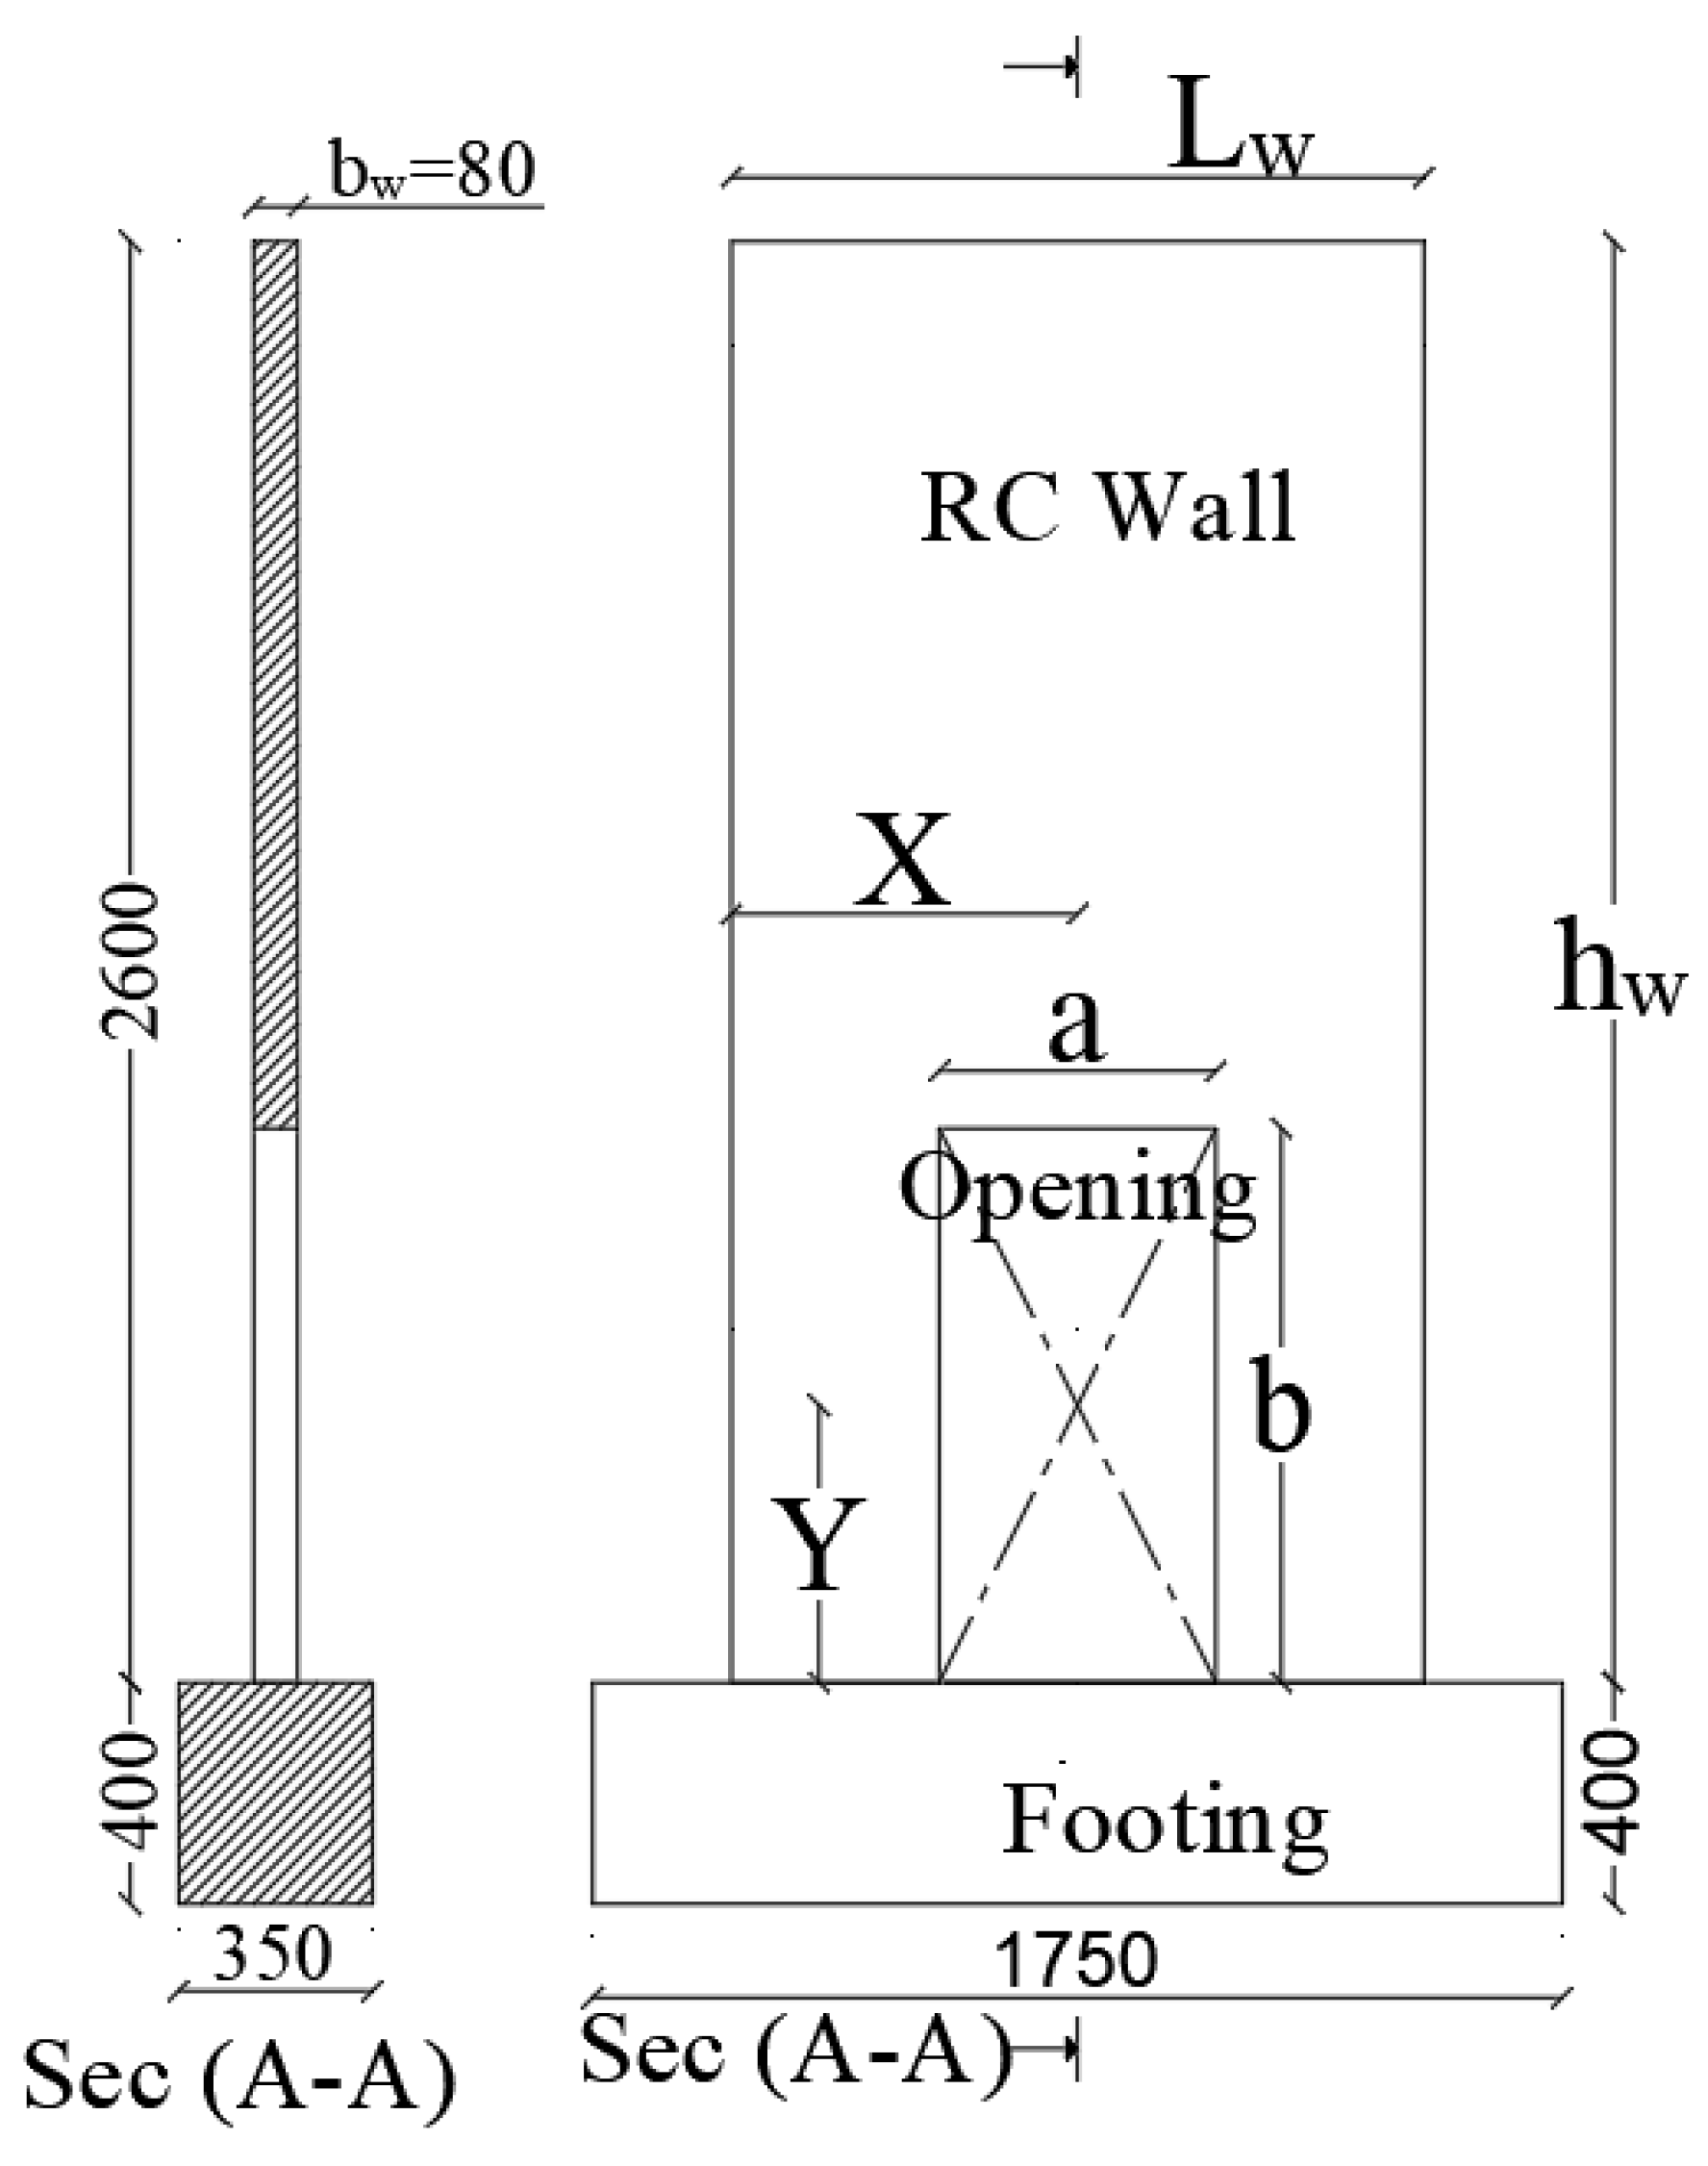
| Parametric Study | Opening Location | Specimen Label | Dim. of Wall hw × lw × bw [mm, mm, mm] | Opening dim. and loc. | ||
|---|---|---|---|---|---|---|
| a × b [mm] | X [mm] | Y [mm] | ||||
| Parametric no (1) locations of cutting-out openings = 50 MPa | No | CW | 2600 × 1250 × 80 | ----- | 0 | 0 |
| B | SW1-e0% | 500 × 1000 | 625 | 500 | ||
| SW2-e8% | 500 × 1000 | 525 | 500 | |||
| SW3-e16% | 500 × 1000 | 425 | 500 | |||
| M | SW4-e0% | 500 × 1000 | 625 | 1300 | ||
| SW5-e8% | 500 × 1000 | 525 | 1300 | |||
| SW6-e16% | 500 × 1000 | 425 | 1300 | |||
| T | SW7-e0% | 500 × 1000 | 625 | 2100 | ||
| SW8-e8% | 500 × 1000 | 525 | 2100 | |||
| SW9-e16% | 500 × 1000 | 425 | 2100 | |||
| Parametric no (3) = 50 MPa | No | CW-AR0.5 | 625 × 1250 × 80 | ----- | 0 | 0 |
| No | CW-AR1 | 1250 × 1250 × 80 | ----- | 0 | 0 | |
| B | SW1-AR1 | 500 × 1000 | 625 | 500 | ||
| M | SW4-AR1 | 500 × 1000 | 625 | 625 | ||
| T | SW7-AR1 | 500 × 1000 | 625 | 750 | ||
| No | CW-AR1.5 | 1875 × 1250 × 80 | ----- | 0 | 0 | |
| B | SW1-AR1.5 | 500 × 1000 | 625 | 500 | ||
| M | SW4-AR1.5 | 500 × 1000 | 625 | 937.50 | ||
| T | SW7-AR1.5 | 500 × 1000 | 625 | 1375 | ||
| No | CW-AR2 | 2600 × 1250 × 80 | ----- | 0 | 0 | |
| B | SW1-AR2 | 500 × 1000 | 625 | 500 | ||
| M | SW4-AR2 | 500 × 1000 | 625 | 1300 | ||
| T | SW7-AR2 | 500 × 1000 | 625 | 2100 | ||
| No | CW-AR3 | 3850 × 1250 × 80 | ----- | 0 | 0 | |
| B | SW1-AR3 | 500 × 1000 | 625 | 500 | ||
| M | SW4-AR3 | 500 × 1000 | 625 | 1925 | ||
| T | SW7-AR3 | 500 × 1000 | 625 | 3350 | ||
| Dimension | Shear Wall Real Life (mm) | Numerical Model (mm) |
|---|---|---|
| Wall height | 10,400 | 2600 |
| Wall width | 5000 | 1250 |
| Wall thickness | 250 | 80 |
| Opening height | 2000 | 500 |
| Opening width | 1000 | 250 |
| Model Label | Ultimate Load [kN] | Ultimate Displacement [mm] | Percentage Decrease in Ultimate Load |
|---|---|---|---|
| CW | 222.3 | 23.0 | 0.0 |
| SW1-e0% | 168.0 | 15.2 | 24.4 |
| SW2-e8% | 183.3 | 17.5 | 17.5 |
| SW3-e16% | 181.8 | 21.8 | 18.1 |
| SW4-e0% | 181.6 | 29.8 | 18.3 |
| SW5-e8% | 194.5 | 28.6 | 12.5 |
| SW6-e16% | 206.5 | 23.3 | 7.1 |
| SW7-e0% | 211.6 | 30.0 | 4.8 |
| SW8-e8% | 216.3 | 30.0 | 2.6 |
| SW9-e16% | 222.3 | 30.0 | 0.0 |
| Model Label | Wall Dimensions [mm] | Opening Percentage | Opening Width [mm] | Opening Height [mm] |
|---|---|---|---|---|
| CW-R0% | 1875 × 1250 × 80 | 0% | 0.00 | 0.00 |
| SW1-R2% | 2.67% | 250 | 250 | |
| SW1-R5% | 5.30% | 250 | 500 | |
| SW1-R10% | 10.6% | 500 | 500 | |
| SW1-R16% | 16% | 500 | 750 | |
| SW1-R21% | 21.30% | 500 | 1000 | |
| SW1-R24% | 24% | 750 | 750 | |
| SW1-R32% | 32% | 750 | 1000 | |
| SW1-R42% | 42.6% | 1000 | 1000 |
| Wall Set | Specimen Label | Dimension hw × lw× bw [mm] | Aspect Ratio |
|---|---|---|---|
| Set a | CW.AR0.5 | 625 × 1250 × 80 | 0.50 |
| Set b | CW.AR1, SW1.AR1, SW4.AR1, SW7.AR1 | 1250 × 1250 × 80 | 1.00 |
| Set c | CW.AR1.5, SW1.AR1.5, SW4.AR1.5, SW7.AR1.5 | 1875 × 1250 × 80 | 1.50 |
| Set d | CW.AR2, SW1.AR2, SW4.AR2, SW7.AR2 | 2600 × 1250 × 80 | 2.08 |
| Set e | CW.AR3, SW1.AR3, SW4.AR3, SW7.AR3 | 3850 × 1250 × 80 | 3.08 |
| Specimen No | Specimen Label | [kN] | [mm] | [kN/mm] | Percentage Decrease |
|---|---|---|---|---|---|
| 1 | CW-R0% | 42.200 | 0.299 | 141.08 | 0 |
| 2 | SW1-R2% | 41.619 | 0.299 | 139.05 | 1.44 |
| 3 | SW1-R5% | 40.547 | 0.299 | 135.42 | 4.01 |
| 4 | SW1-R10% | 37.965 | 0.299 | 126.78 | 10.13 |
| 5 | SW1-R16% | 35.464 | 0.300 | 118.39 | 16.08 |
| 6 | SW1-R21% | 32.744 | 0.300 | 109.30 | 22.52 |
| 7 | SW1-R24% | 32.361 | 0.301 | 107.69 | 23.67 |
| 8 | SW1-R32% | 30.046 | 0.300 | 100.09 | 29.05 |
| 9 | SW1-R42% | 28.224 | 0.301 | 93.76 | 33.54 |
| Specimen No | Specimen Label | [mm] | [mm] | *** DI | % Increase in the Ductility Index |
|---|---|---|---|---|---|
| 1 | CW-R0% | 0.72 | 13.40 | 18.61 | - |
| 2 | SW1-R2% | 0.6 | 14.55 | 24.25 | 30.3 |
| 3 | SW1-R5% | 0.4 | 10.46 | 26.16 | 40.5 |
| 4 | SW1-R10% | 0.39 | 8.32 | 21.32 | 14.6 |
| 5 | SW1-R16% | 0.35 | 10.21 | 29.18 | 56.8 |
| 6 | SW1-R21% | 0.30 | 11.61 | 38.85 | 108.7 |
| 7 | SW1-R24% | 0.30 | 9.19 | 30.65 | 64.7 |
| 8 | SW1-R32% | 0.30 | 12.13 | 40.43 | 117.2 |
| 9 | SW1-R42% | 0.30 | 11.46 | 38.21 | 105.3 |
| Specimen No | Specimen Label | Energy Absorption Capacity Eb [kN mm] | Percentage Decrease |
|---|---|---|---|
| 1 | CW-R0% | 4011.94 | - |
| 2 | SW1-R2% | 3936.88 | 1.87 |
| 3 | SW1-R5% | 3804.75 | 5.16 |
| 4 | SW1-R10% | 3162.13 | 21.18 |
| 5 | SW1-R16% | 3156.95 | 21.31 |
| 6 | SW1-R21% | 2943.25 | 26.64 |
| 7 | SW1-R24% | 2364.08 | 41.07 |
| 8 | SW1-R32% | 1803.11 | 55.06 |
| 9 | SW1-R42% | 321.28 | 92.00 |
Disclaimer/Publisher’s Note: The statements, opinions and data contained in all publications are solely those of the individual author(s) and contributor(s) and not of MDPI and/or the editor(s). MDPI and/or the editor(s) disclaim responsibility for any injury to people or property resulting from any ideas, methods, instructions or products referred to in the content. |
© 2024 by the authors. Licensee MDPI, Basel, Switzerland. This article is an open access article distributed under the terms and conditions of the Creative Commons Attribution (CC BY) license (https://creativecommons.org/licenses/by/4.0/).
Share and Cite
Saad, I.M.; Mohamed, H.A.; Emara, M.; El-Zohairy, A.; El-Beshlawy, S. Finite Element Modeling and Analysis of RC Shear Walls with Cutting-Out Openings. Modelling 2024, 5, 1314-1338. https://doi.org/10.3390/modelling5030068
Saad IM, Mohamed HA, Emara M, El-Zohairy A, El-Beshlawy S. Finite Element Modeling and Analysis of RC Shear Walls with Cutting-Out Openings. Modelling. 2024; 5(3):1314-1338. https://doi.org/10.3390/modelling5030068
Chicago/Turabian StyleSaad, Islam M., Heba A. Mohamed, Mohamed Emara, Ayman El-Zohairy, and Sherif El-Beshlawy. 2024. "Finite Element Modeling and Analysis of RC Shear Walls with Cutting-Out Openings" Modelling 5, no. 3: 1314-1338. https://doi.org/10.3390/modelling5030068