

Neural Network Prediction and Enhanced Strength Properties of Natural Fibre-Reinforced Quaternary-Blended Composites

 ,
,  ,
,  and
and
Abstract
:1. Introduction
2. Materials and Methods
2.1. Materials
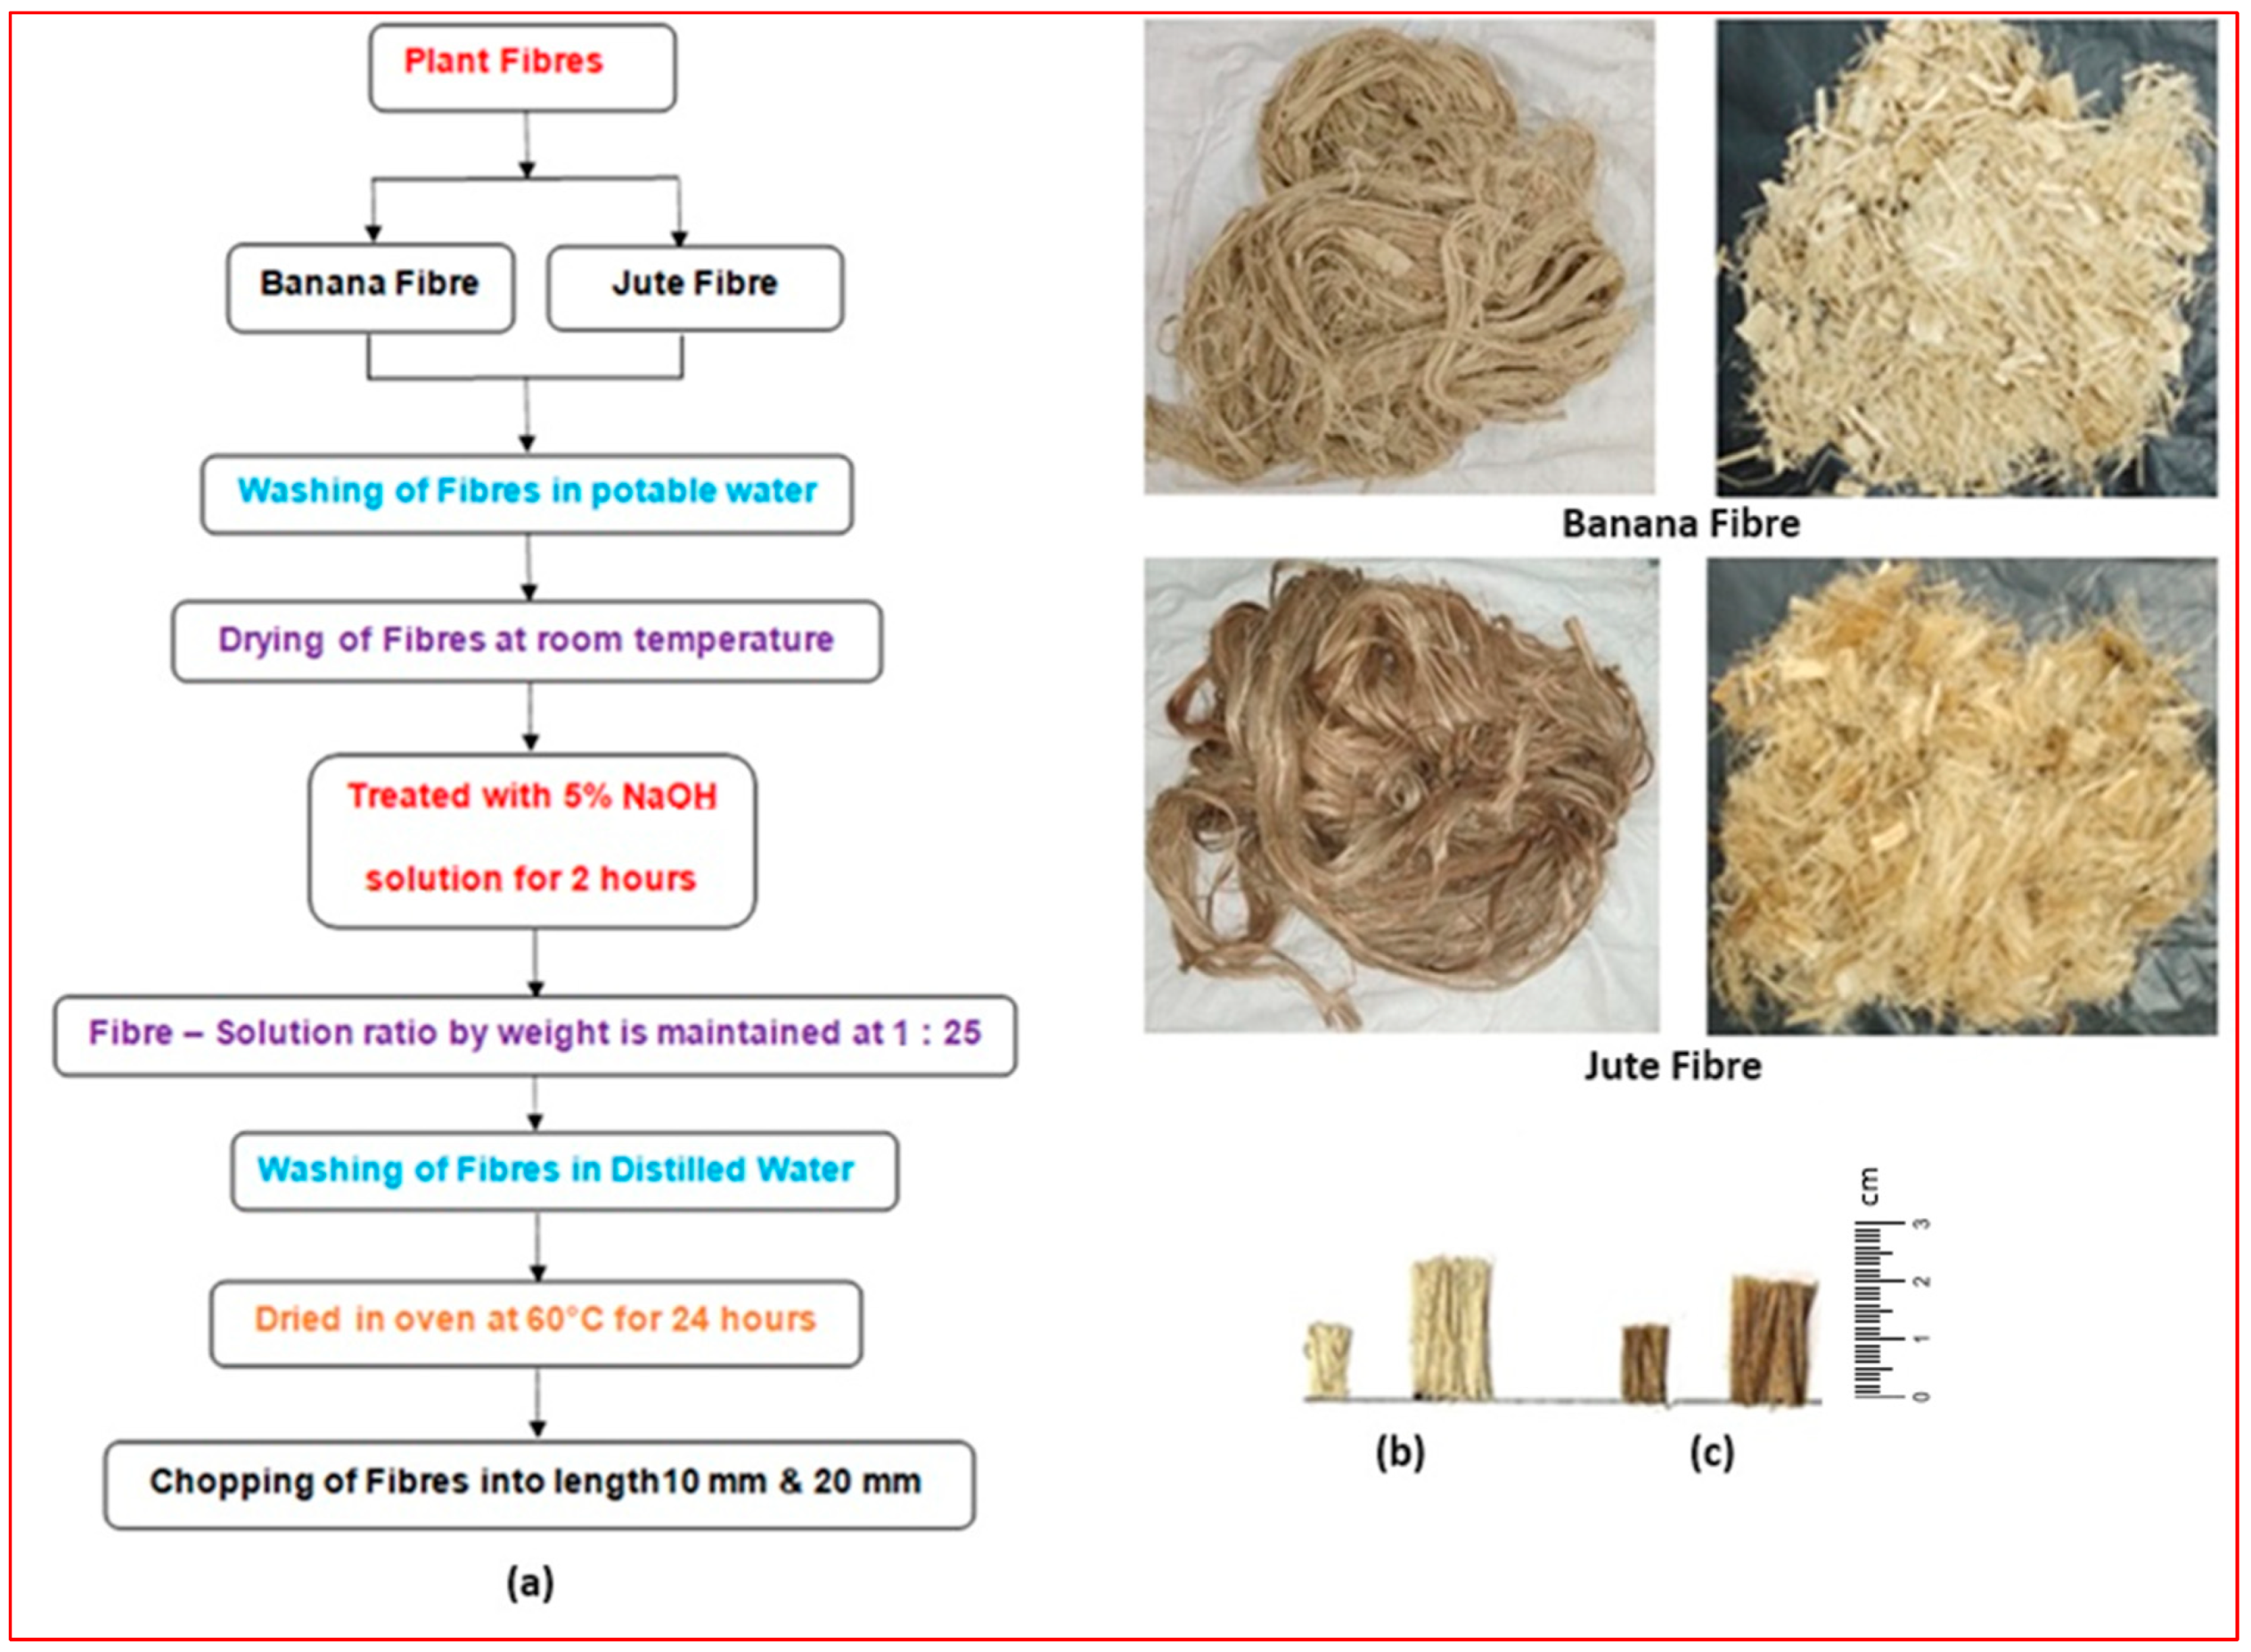
2.2. Processing and Properties of Natural Fibres
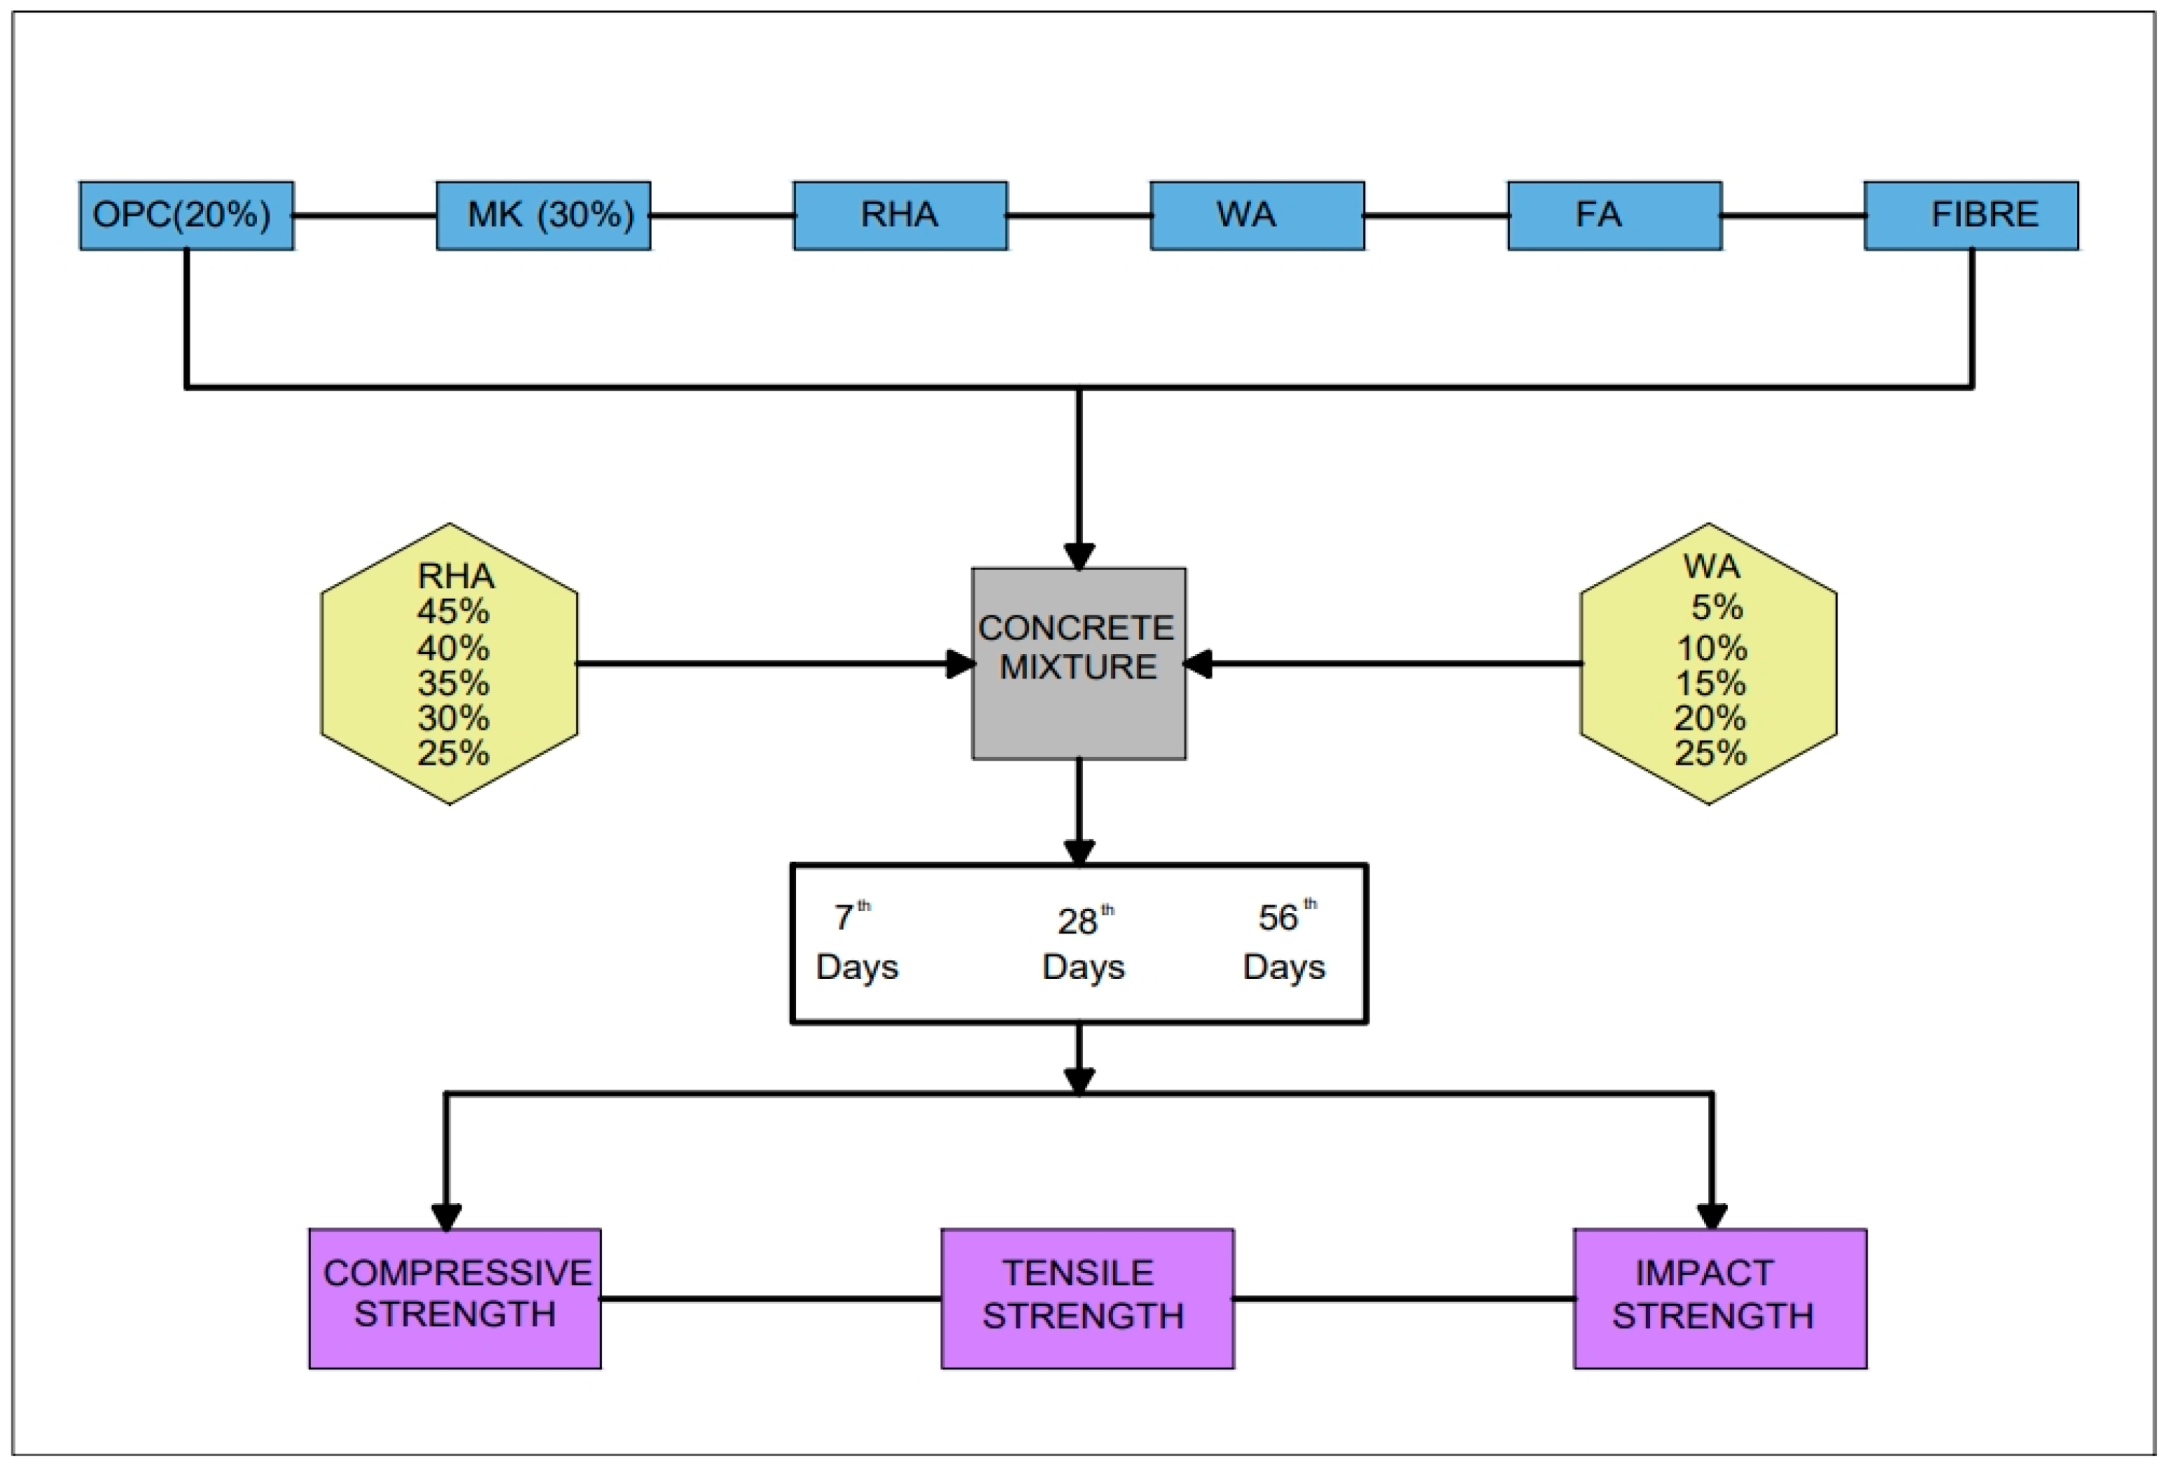
2.3. Mix Proportions of Quaternary-Blended Composites
2.4. Experimental Test Methods
2.5. Neural Network Modelling
2.6. Training Methodology
3. Test Results and Discussions
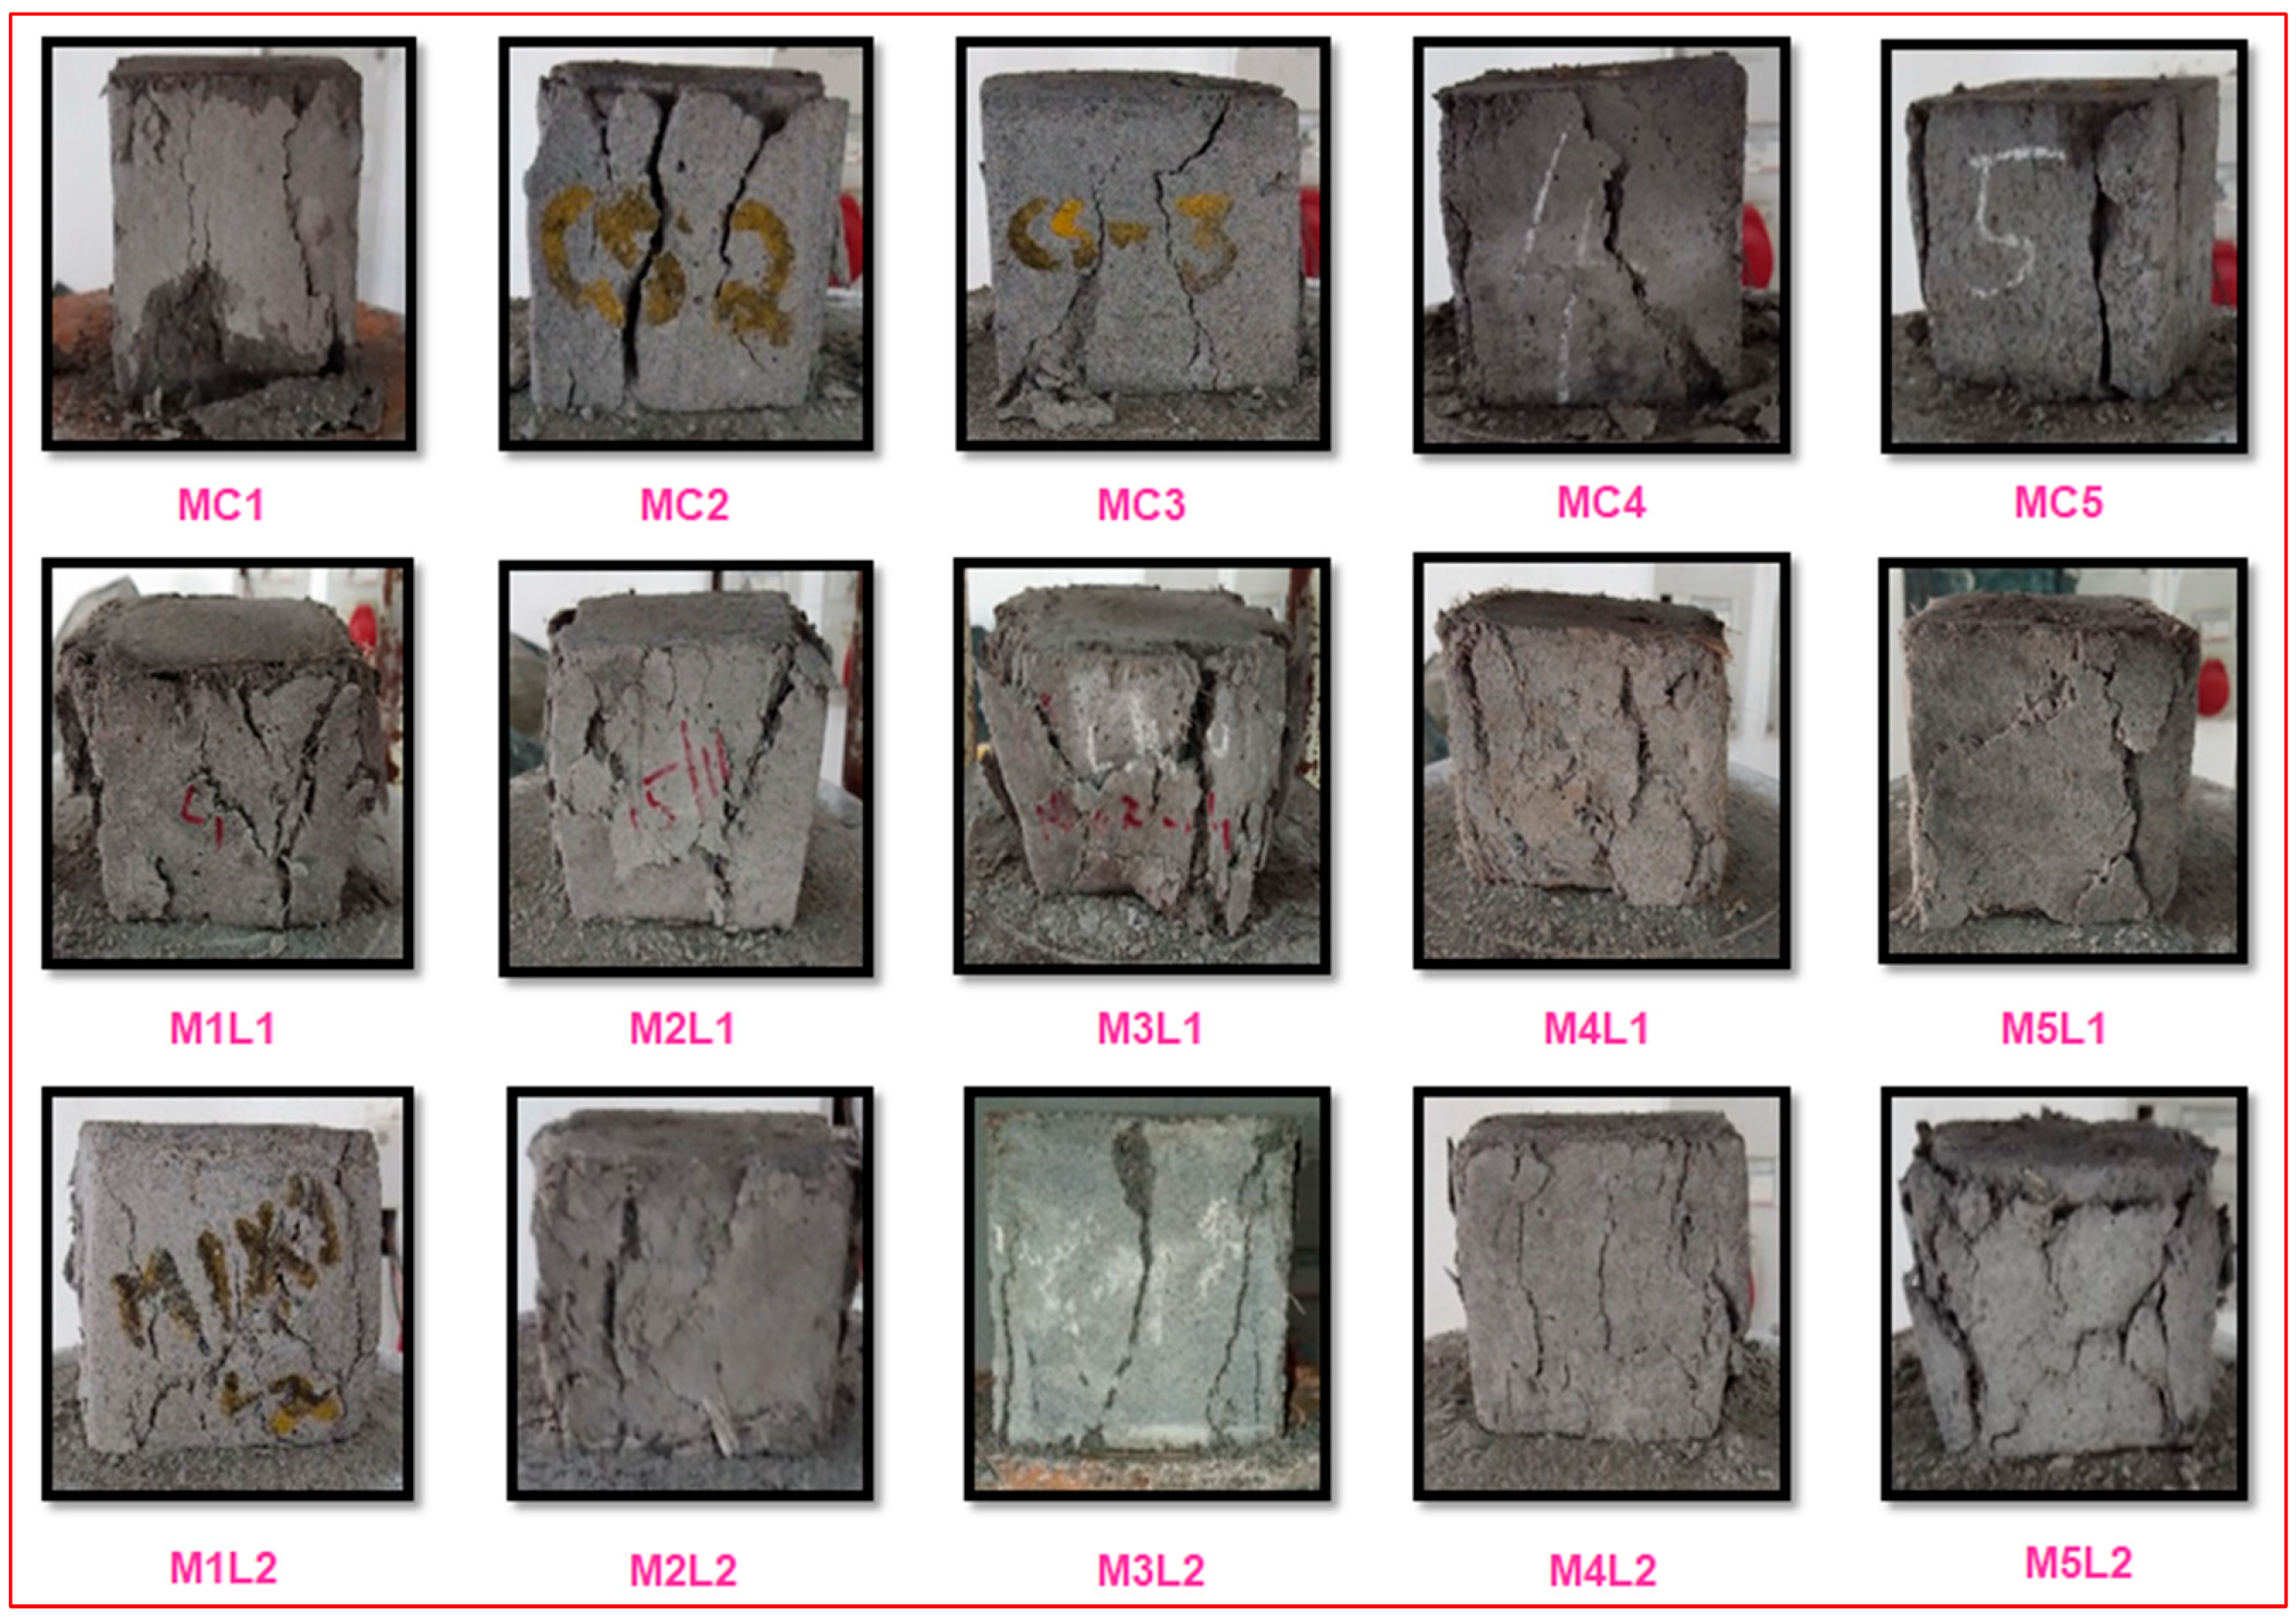
3.1. Compressive Strength
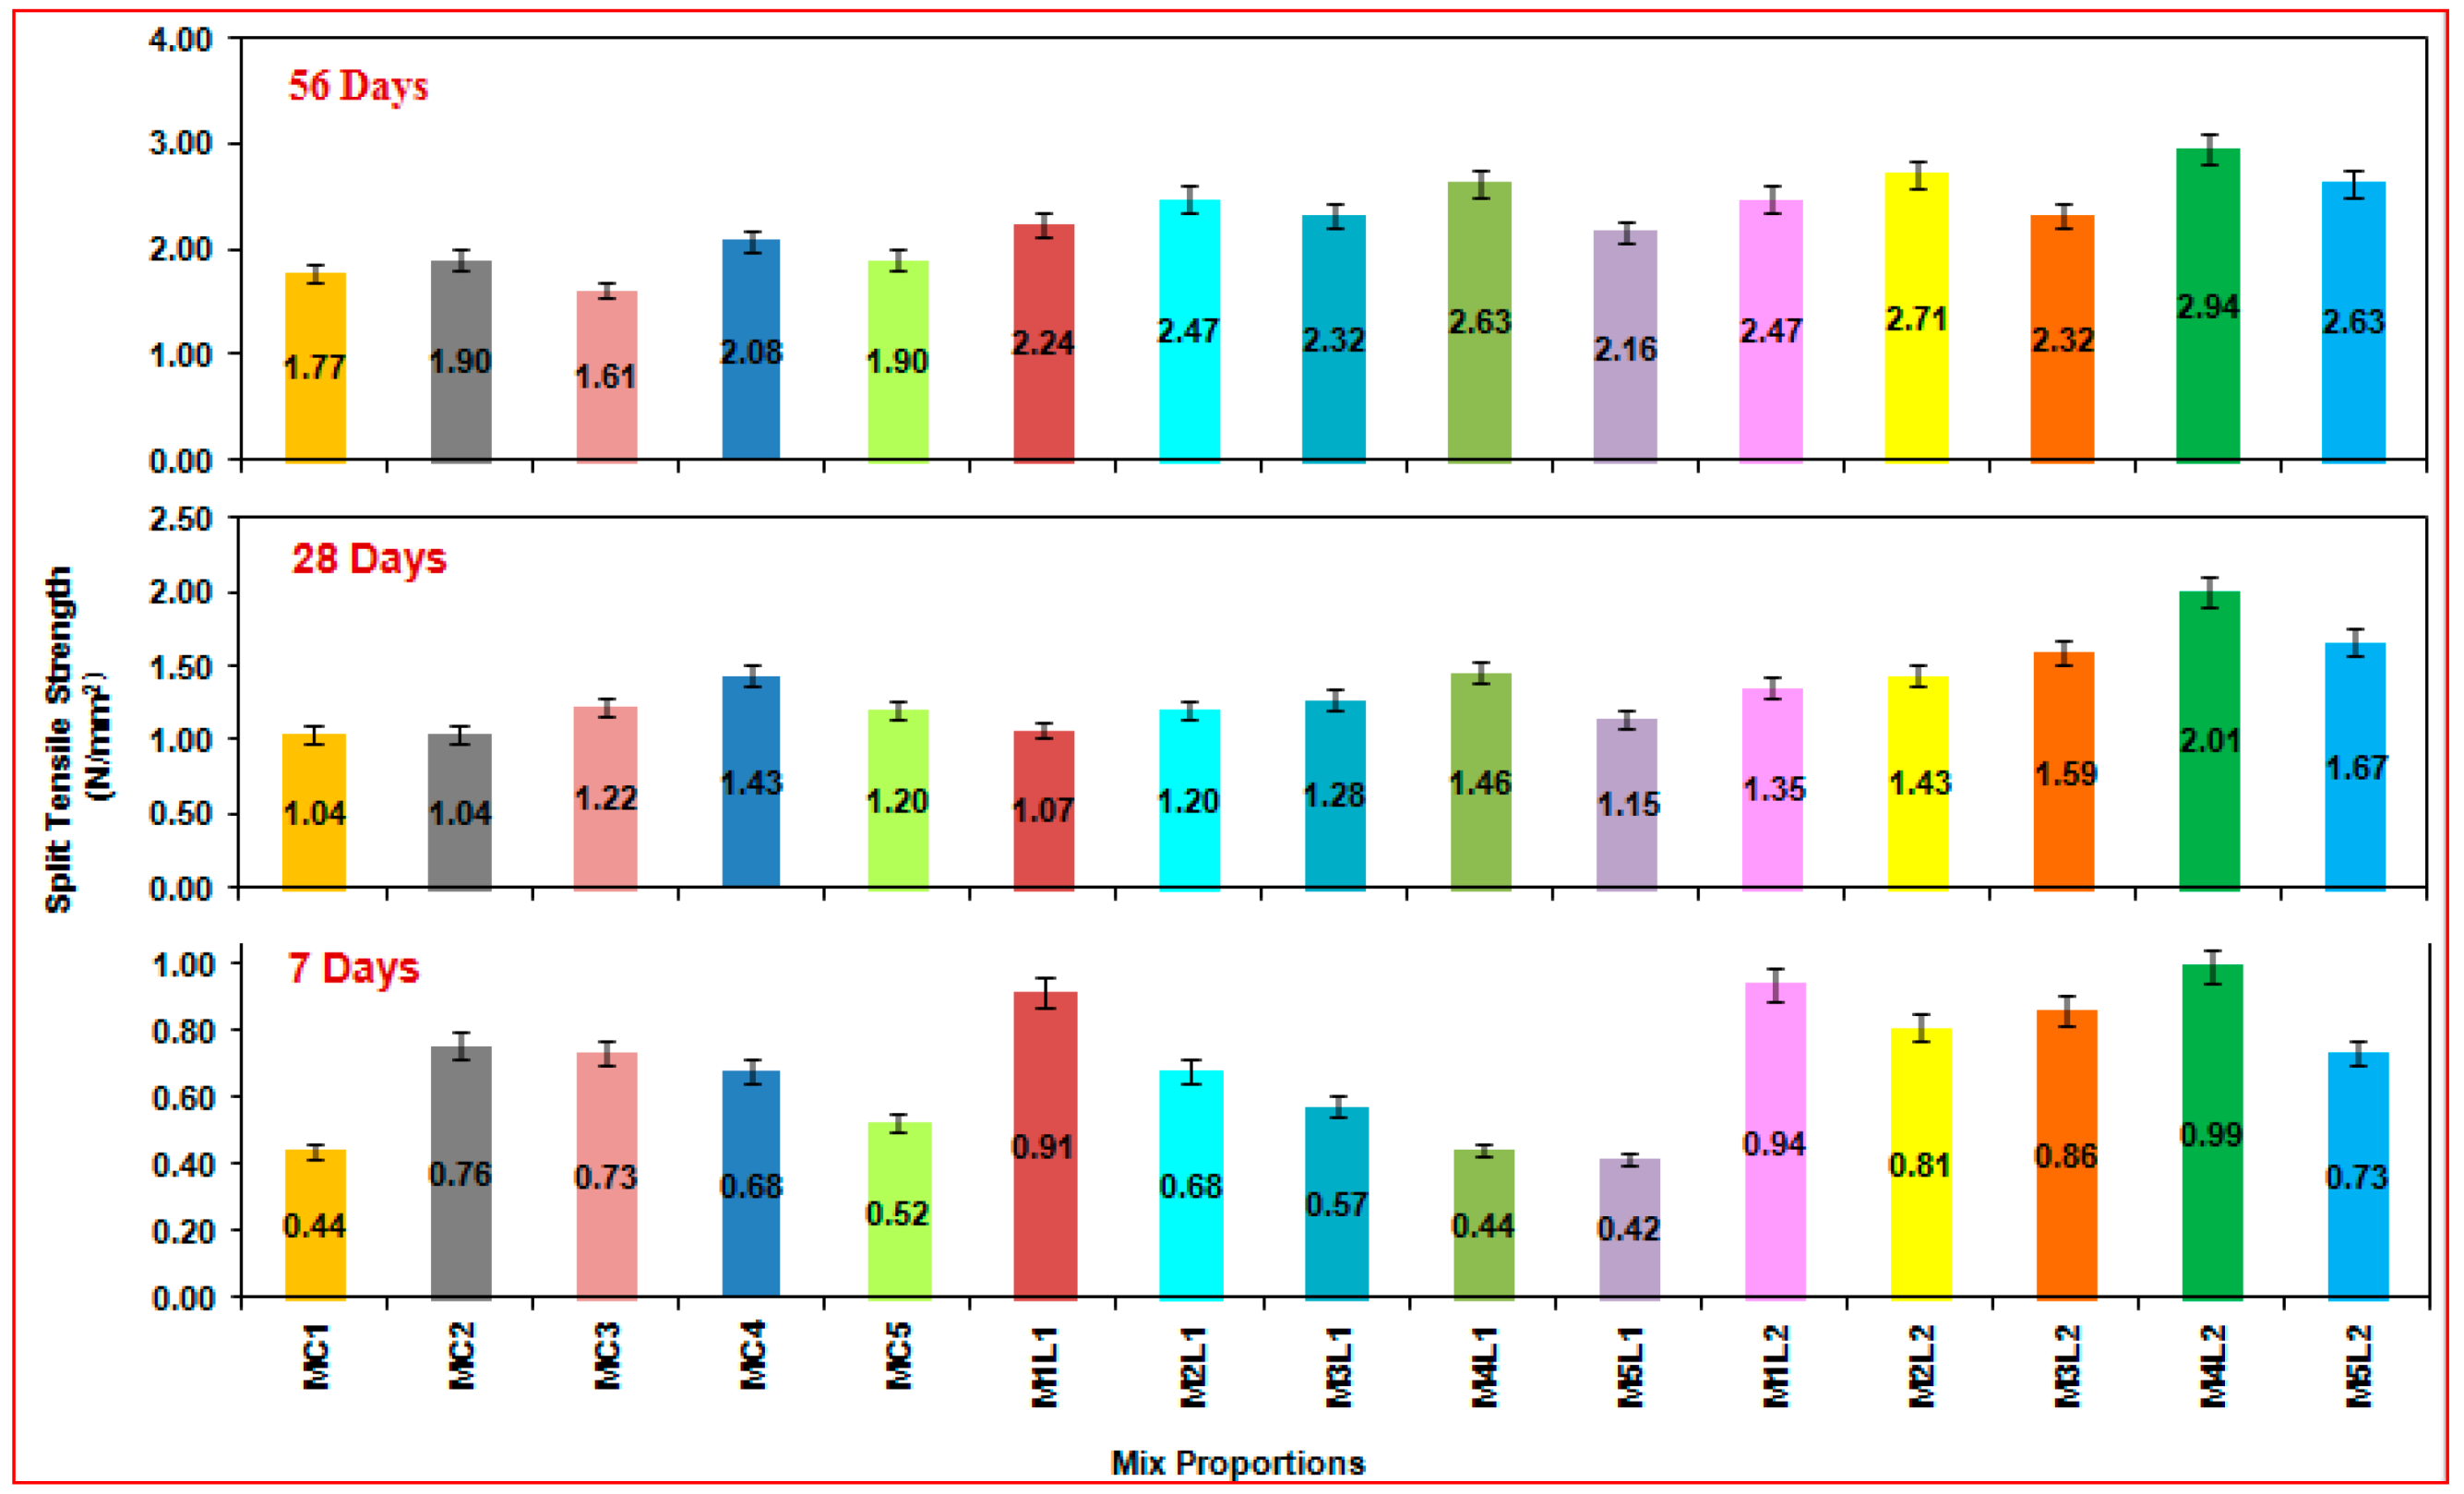
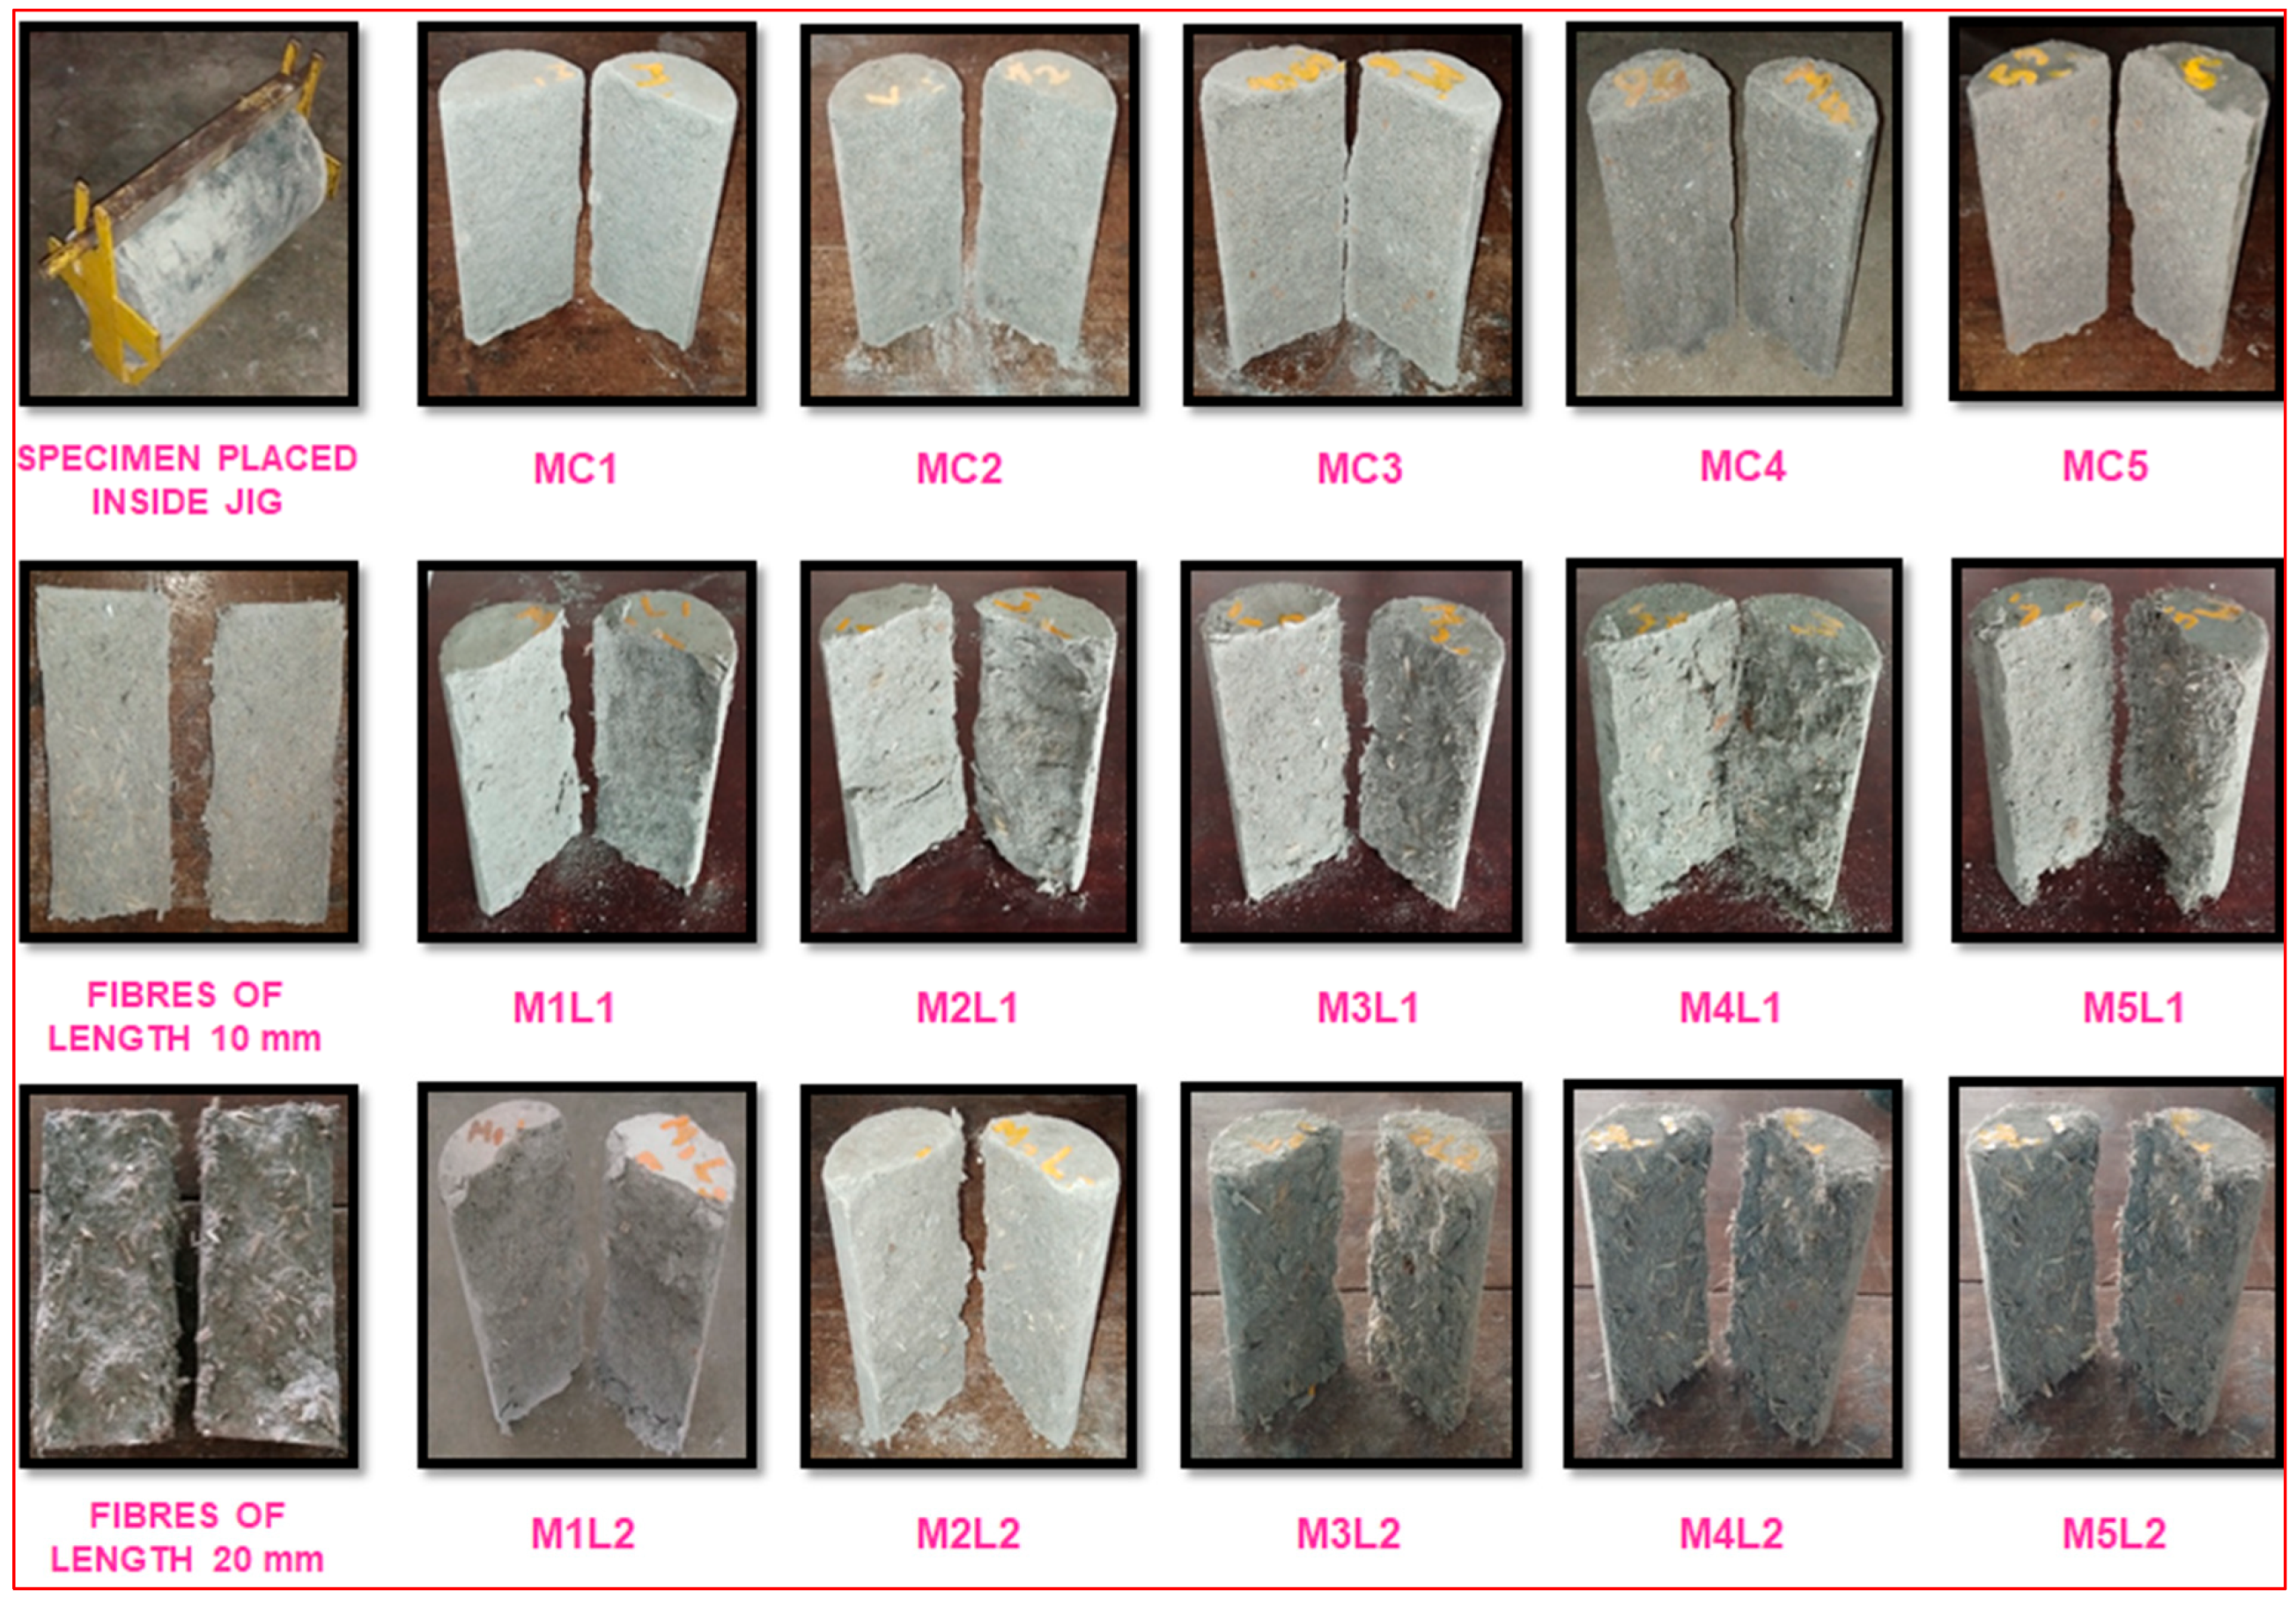
3.2. Splitting Tensile Strength
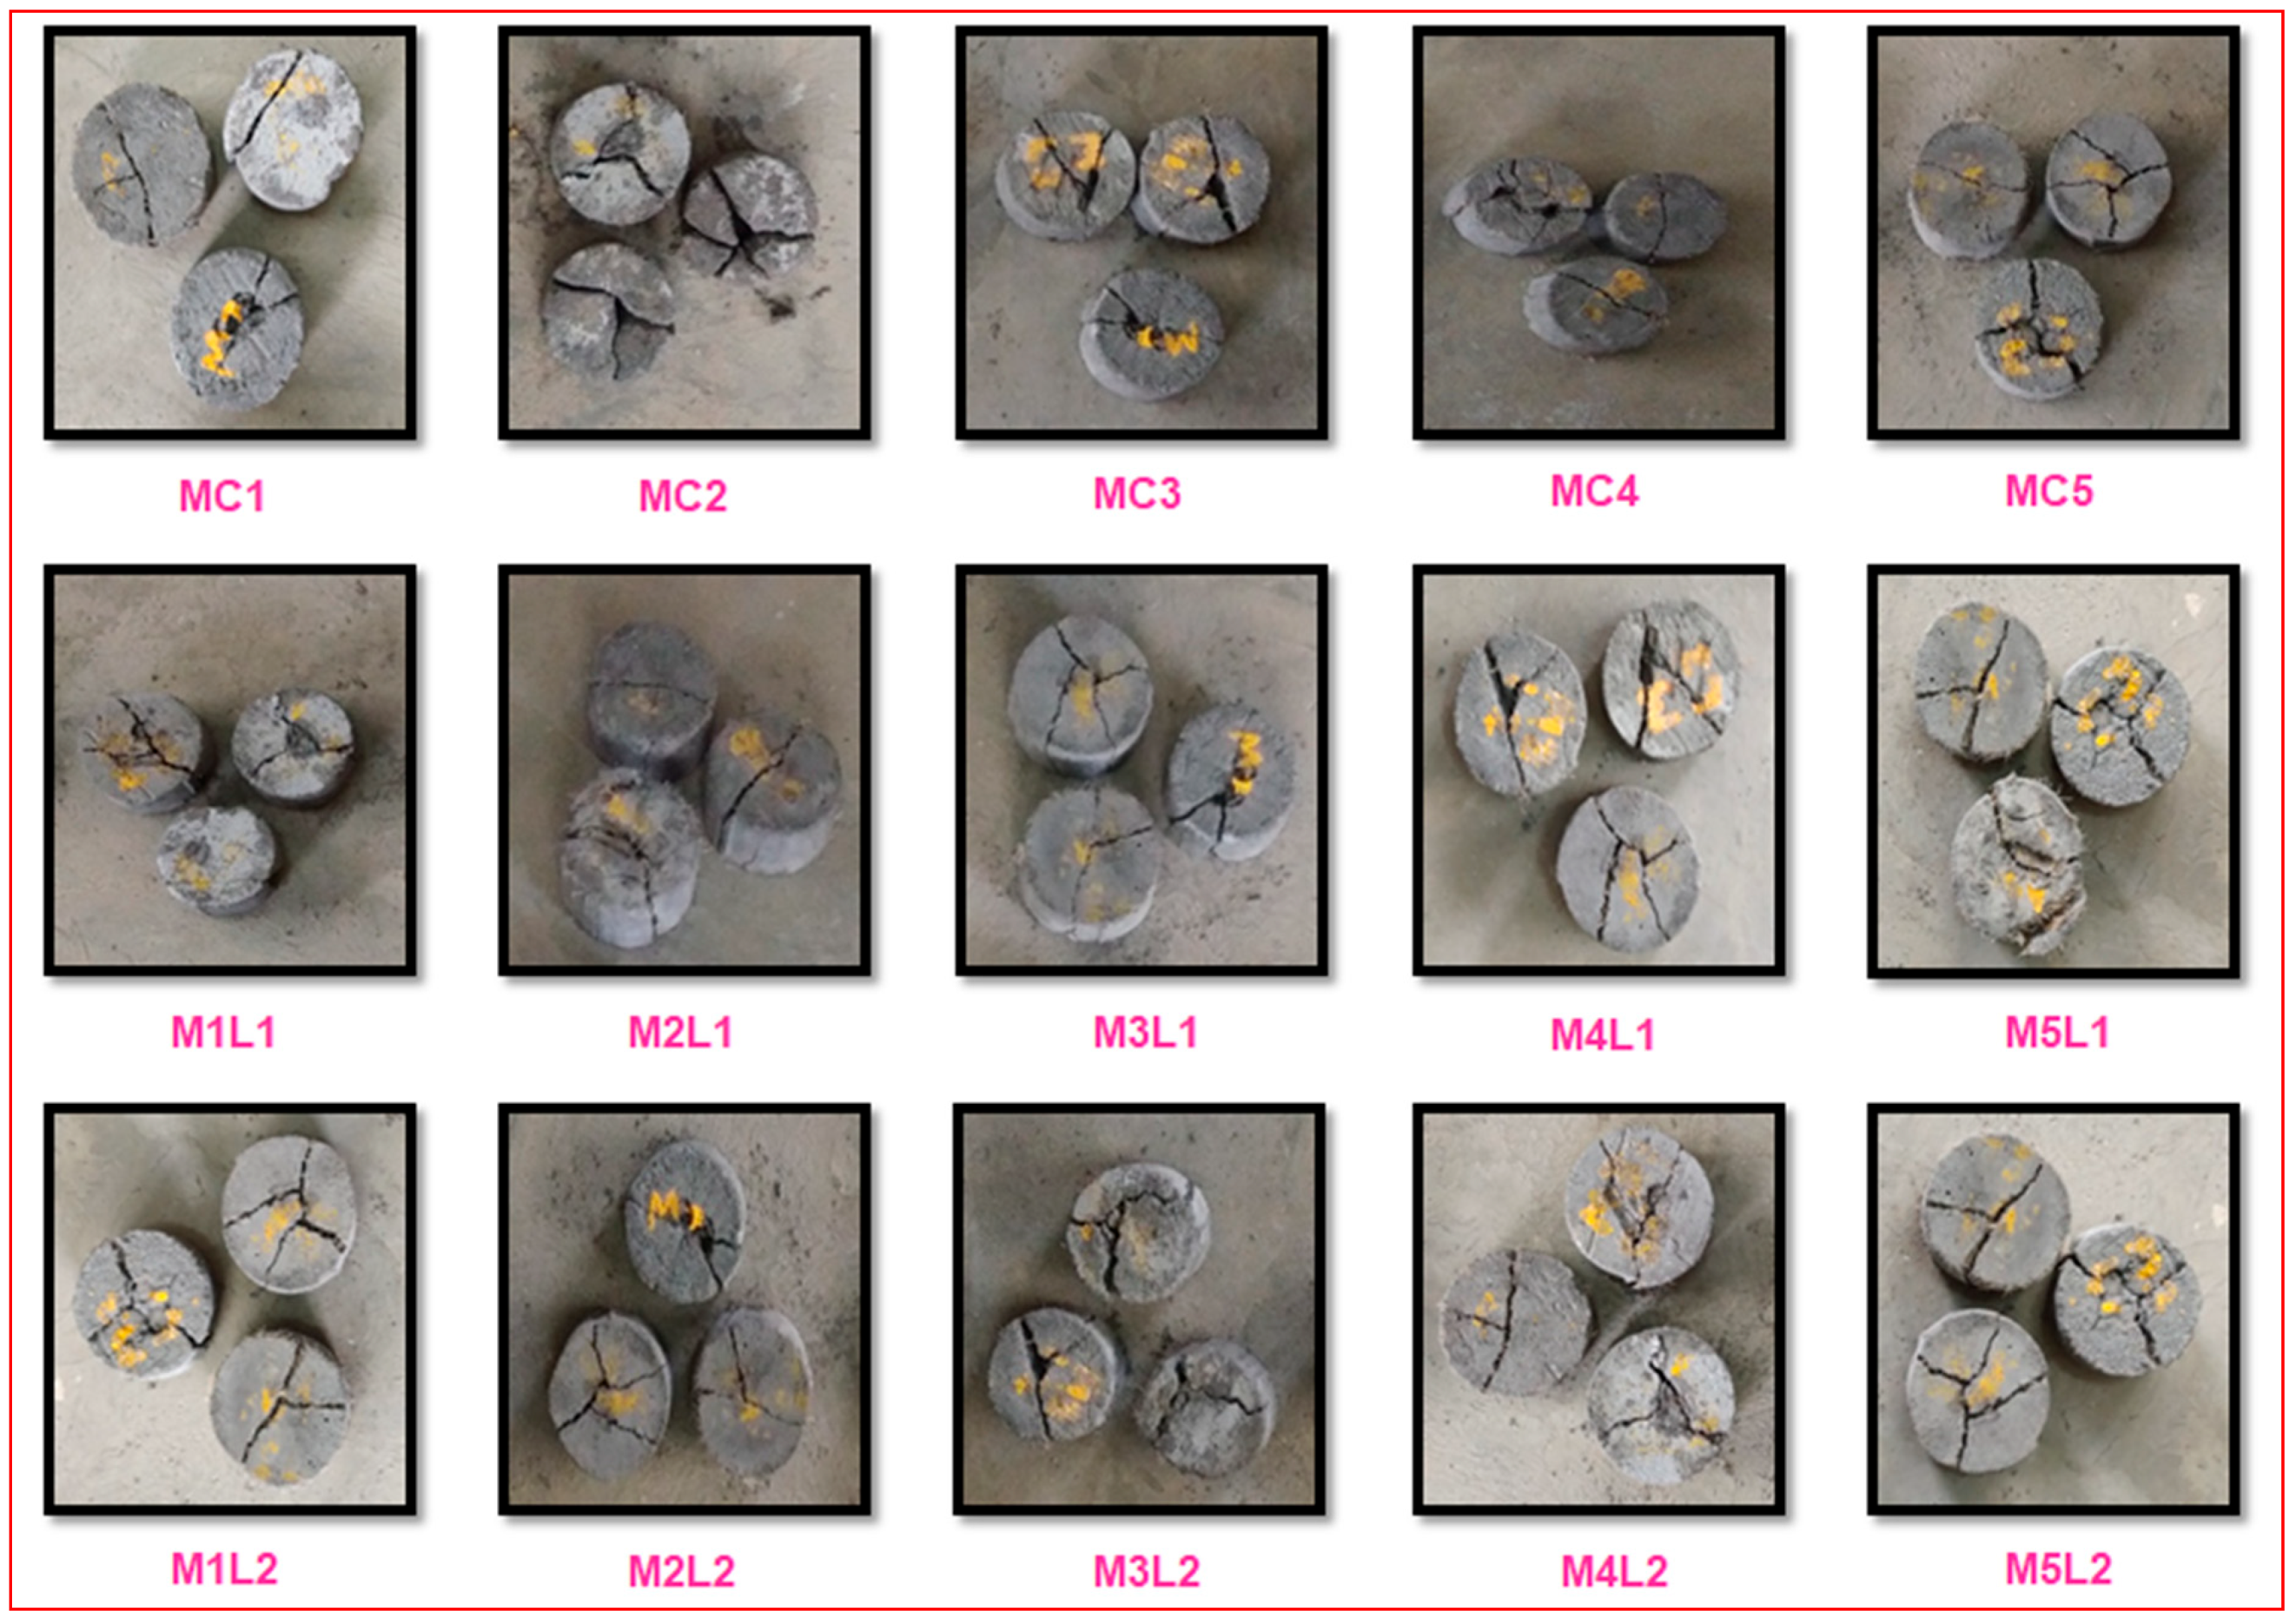
3.3. Impact Strength
3.4. Microstructural Study
4. Proposed Expressions for Synergic Action of Binder Materials
5. Performance Evaluation of Strength Predictions of QCB from ANN Modelling
6. Conclusions
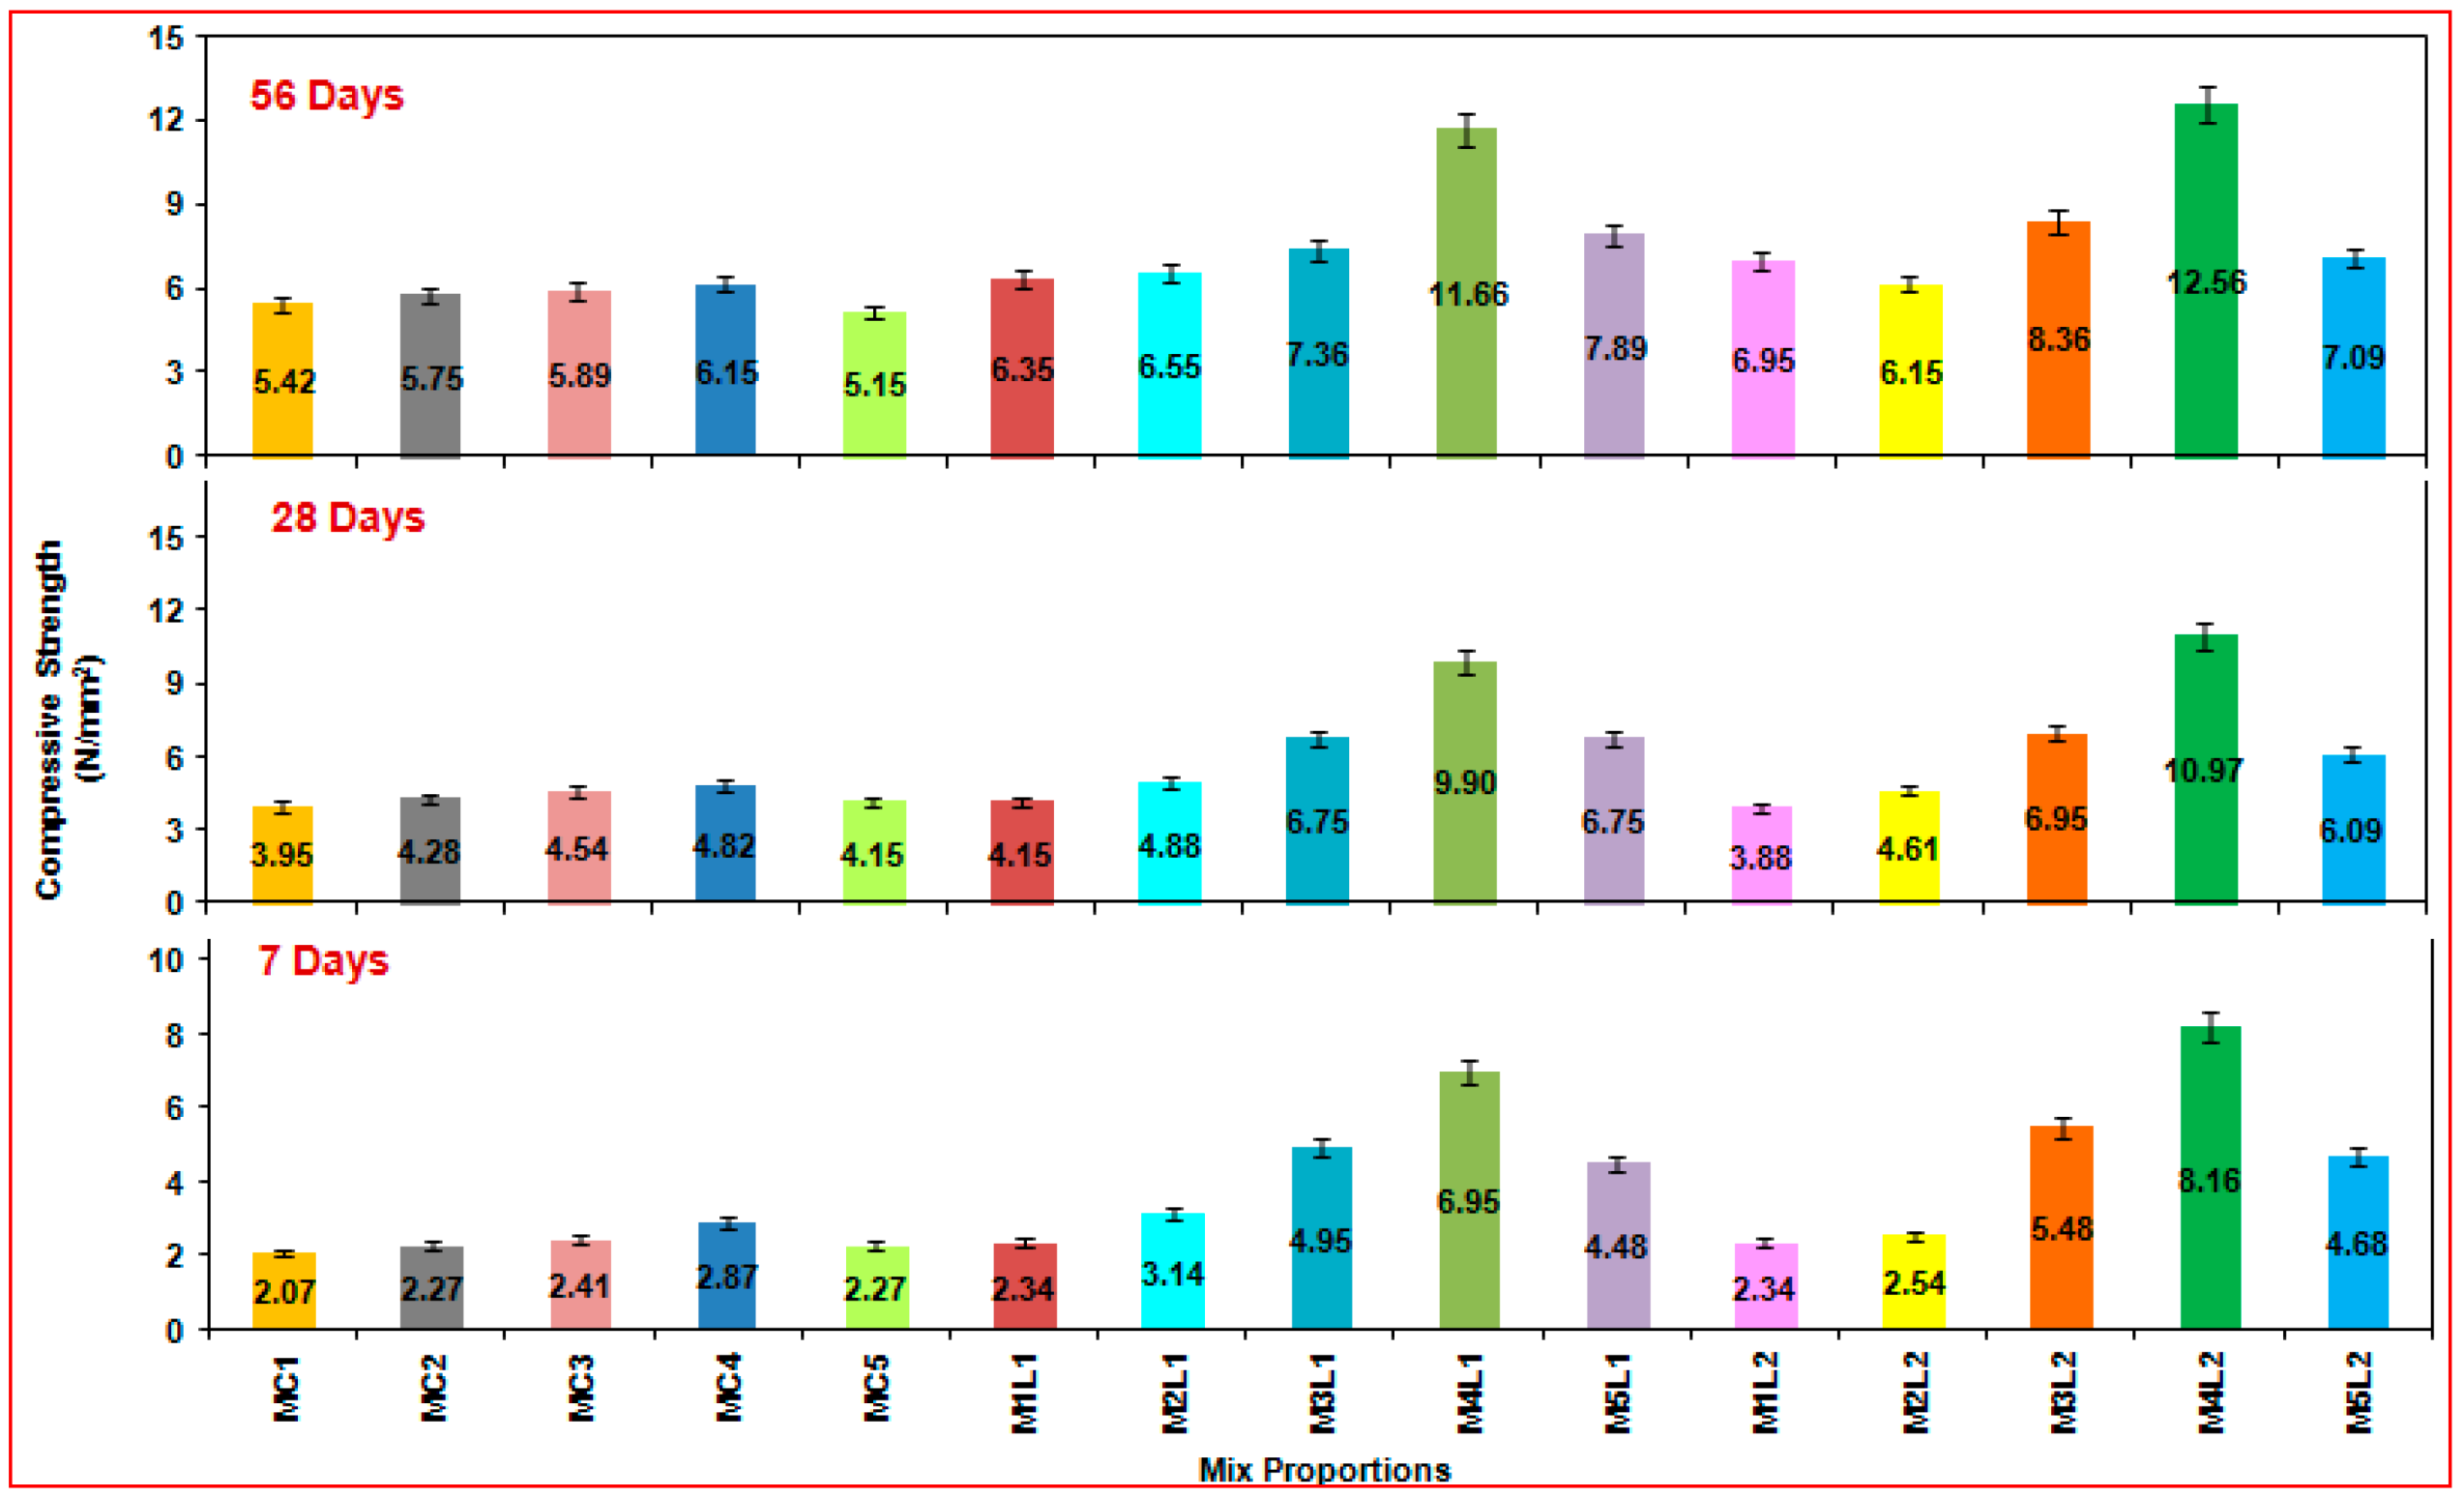
- The highest compressive strength value was attained at M4L2, which was incorporated with fibres of 20 mm in length. The maximum strength attained at 56 days of testing was found to be 12.563 N/mm2. On comparing the results of 56 days of testing with 28 days, there was an increase in strength of 12.70%. The increase in strength was about 51.03% for mix M4L2 compared to control mix MC4 at 56 days of testing.
- Similarly, mix M4L2 produced a higher strength of about 2.942 N/mm2 for the tensile strength. On comparing the results of 56 days of testing with 28 days, there was an increase in strength of 31.84%. There was an increase in strength of about 29.19% for mix M4L2 when compared to control mix MC4 at 56 days of testing.
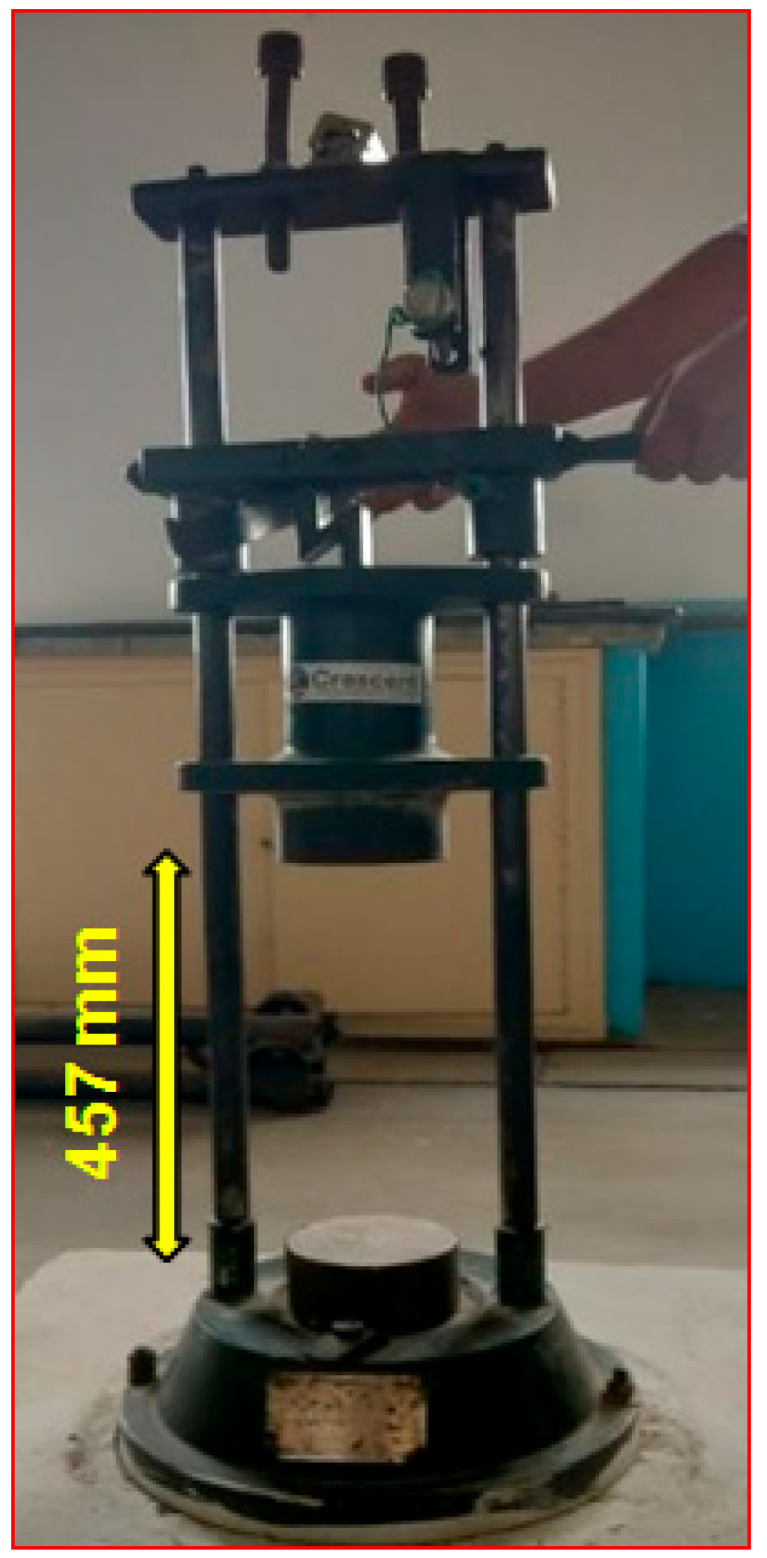
- The mix M5L1 produced higher impact energy among all the mixes. An increase in energy value of 35.37% was observed. Small strands of fibres with a length of 10 mm withstand a higher number of impact blows than the 20 mm length of fibres. There was an increase in energy value of about 36.40% for mix M5L1 when compared to control mix MC5 at 56 days of testing.
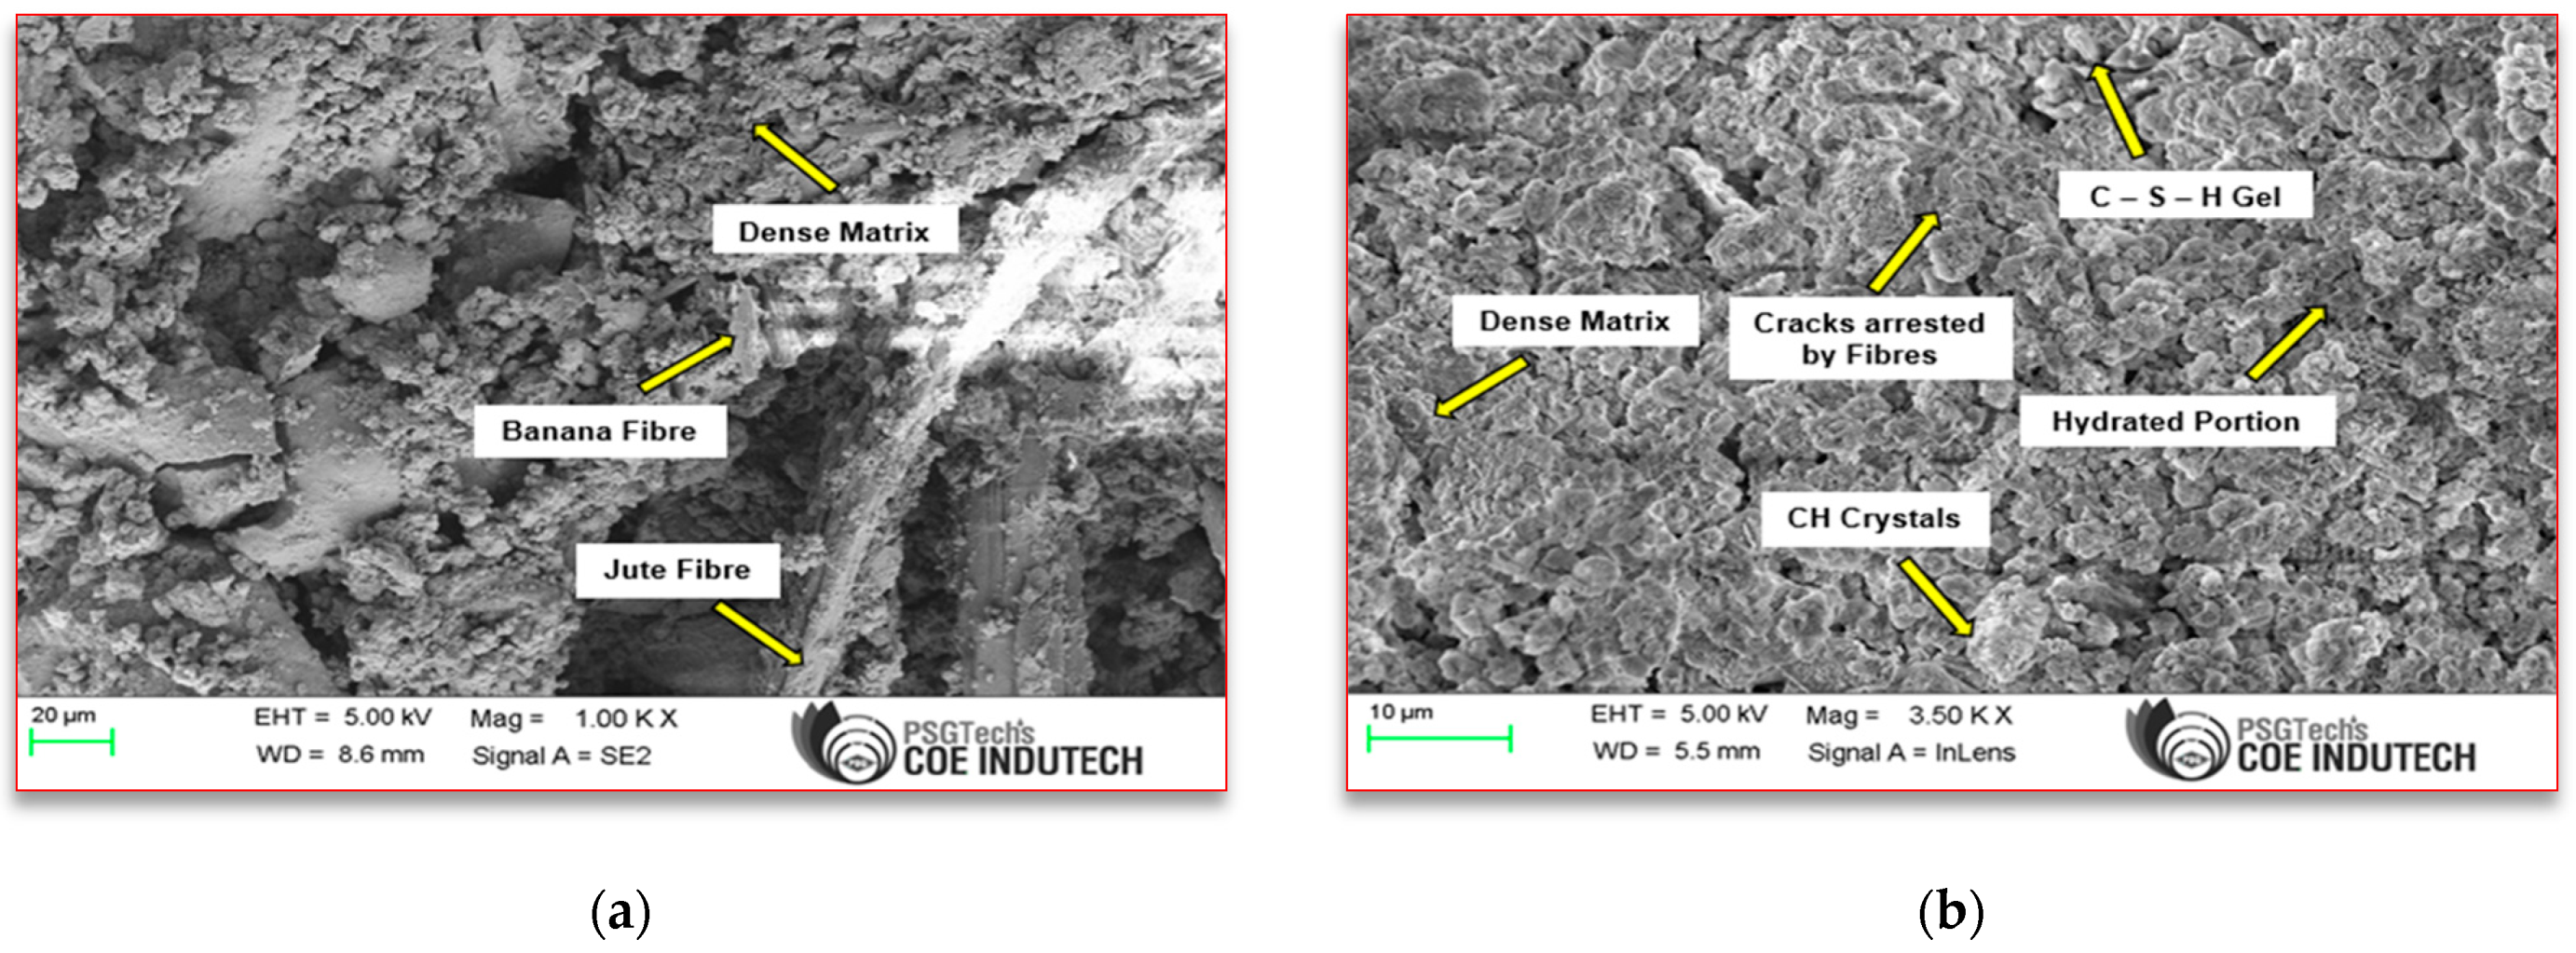
- On observing the microstructural characteristics in MC4, larger cracks were developed, and larger voids were present. Meanwhile, characteristics of M4L2 were due to the proper cohesion of particles observed with a denser matrix. Only a few microvoids were present in M4L2. Due to the presence of hybrid fibres in the mix, most cracks were arrested. Hence, adding metakaolin to the mix improves the binding properties and enhances the microstructure in QBC.
- The efficiency factor showed a significant difference, and the strength values showed a synergic effect compared to the value obtained from the experimental work.
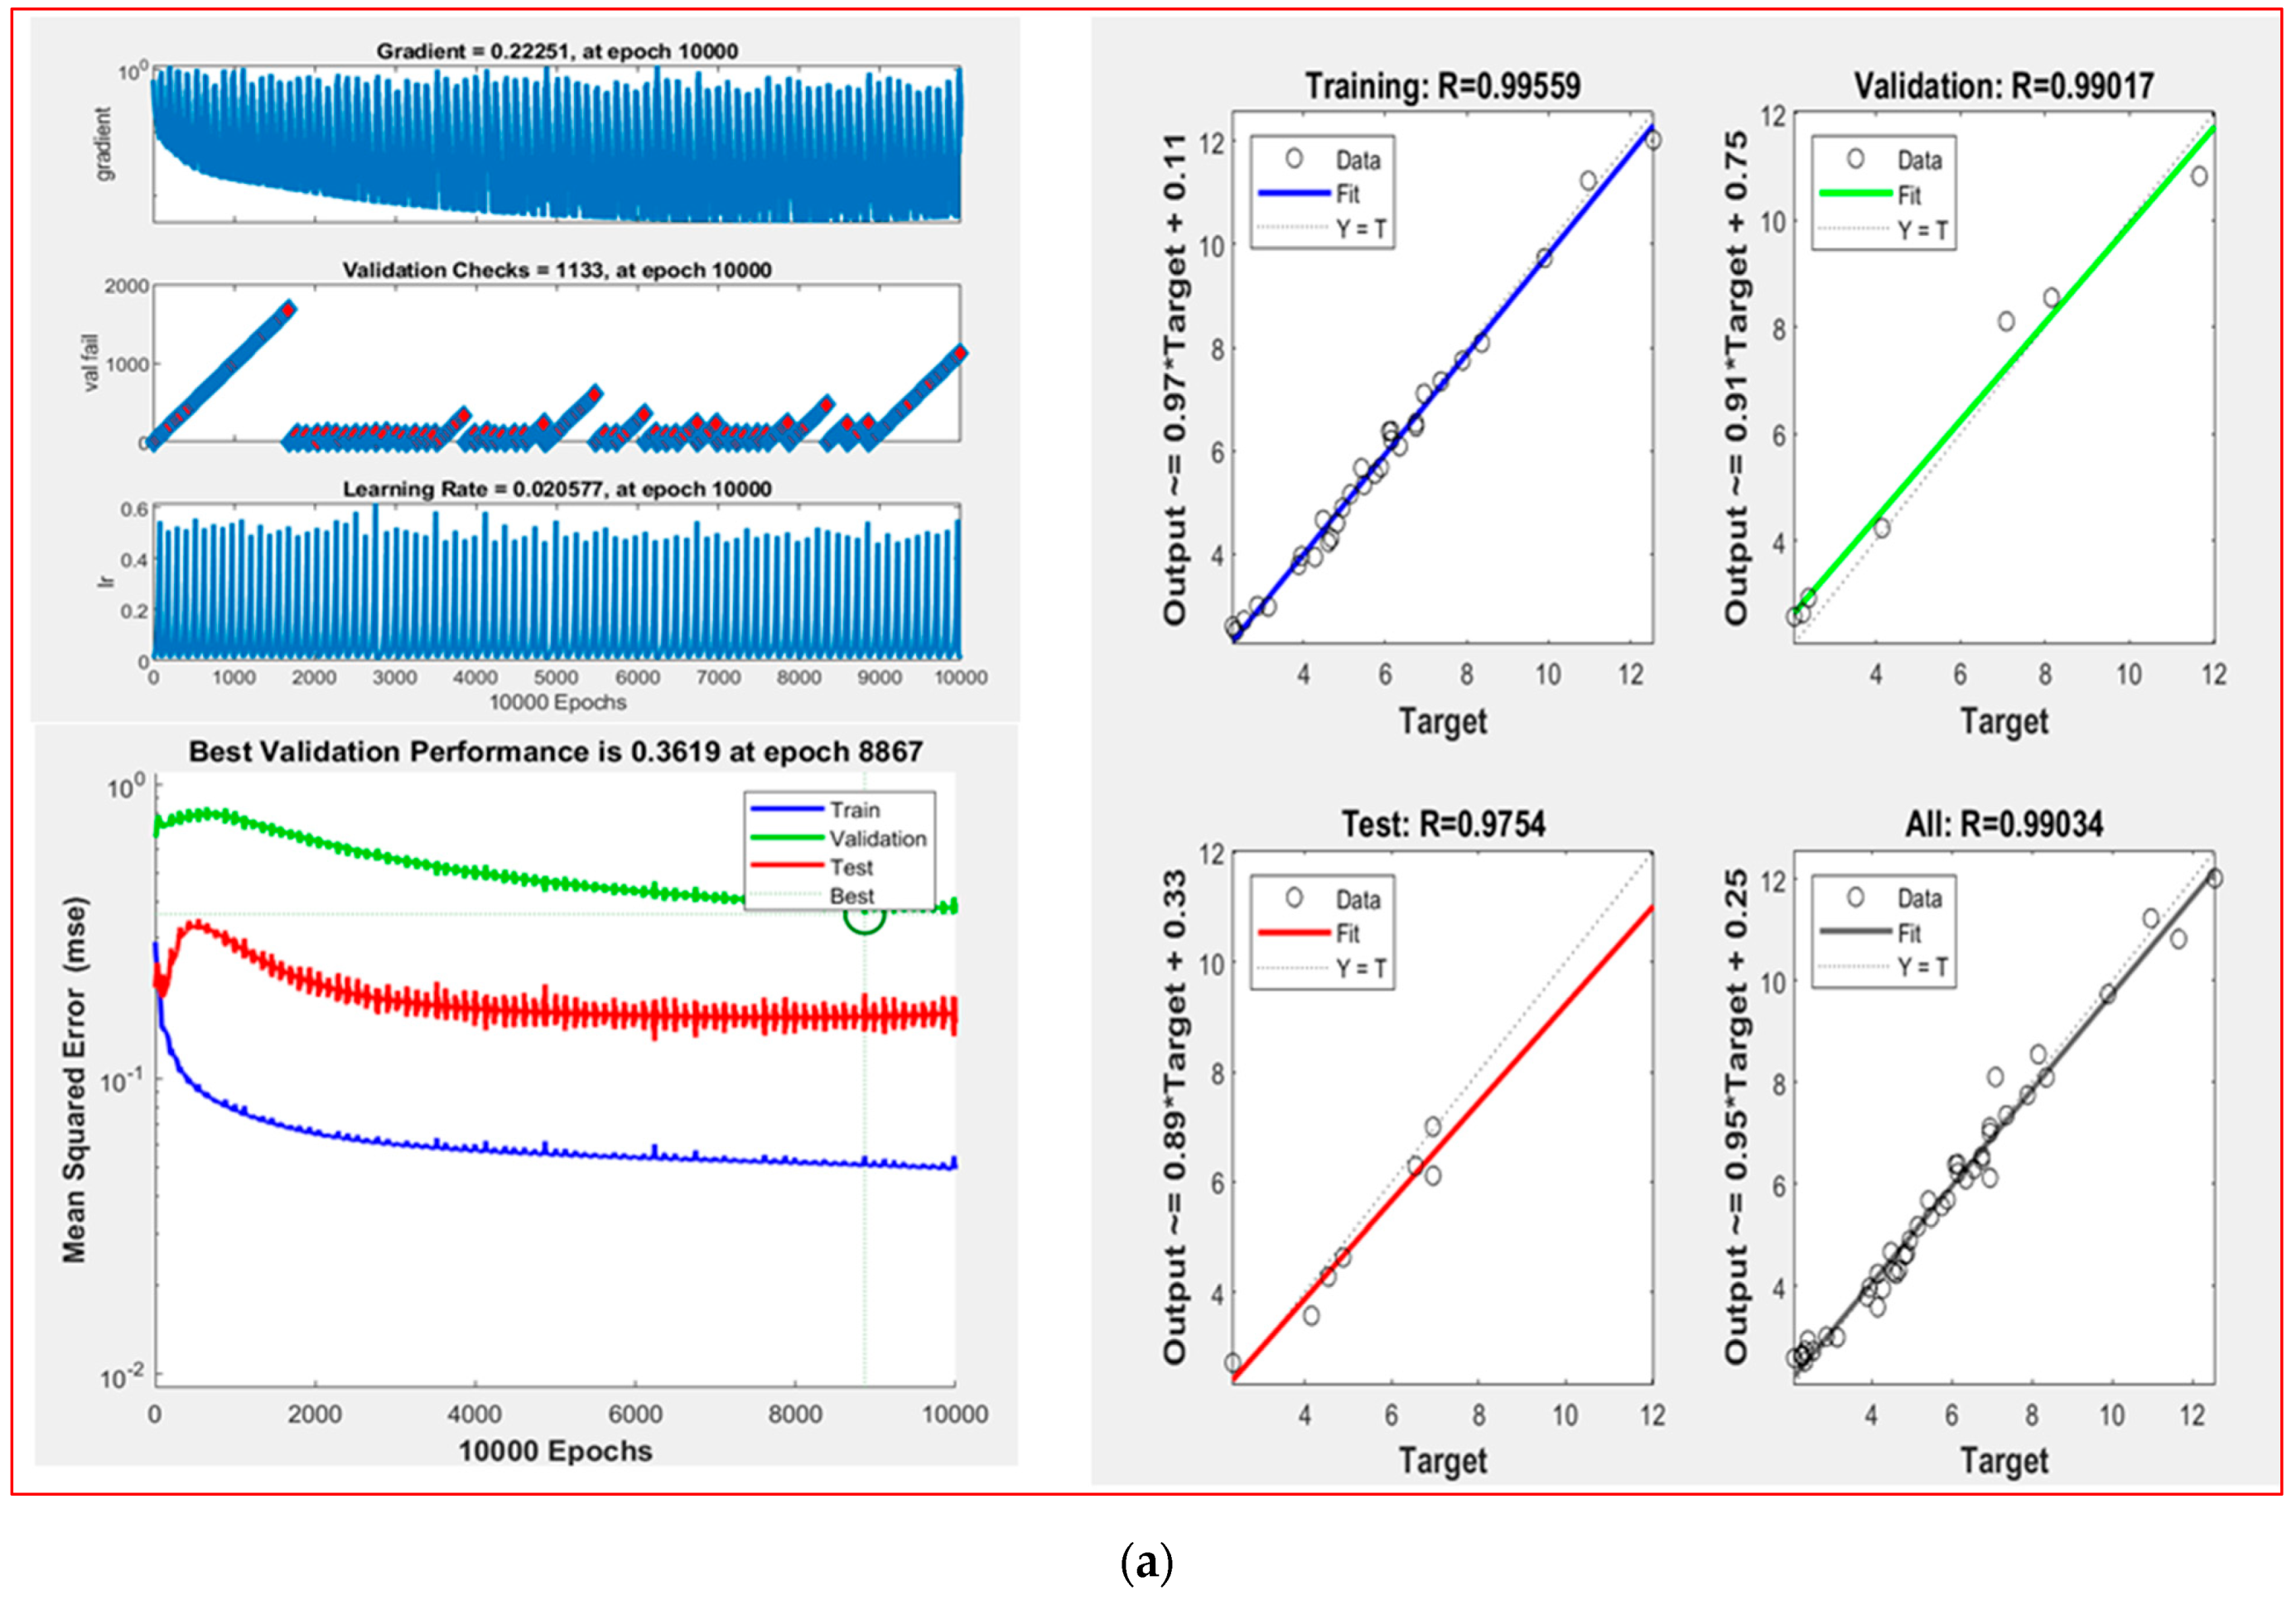
- The ANN model used in this study to predict the compressive strength, tensile strength, and impact strength characteristics of QBC was found to be precise and agree well with the test results. ANN models [4:5:1], [4:10:1], and [4:8:1] were the best possible outcomes for compressive strength, tensile strength, and impact strength, respectively.
7. Scope for Future Work
Author Contributions
Funding
Data Availability Statement
Conflicts of Interest
Appendix A
| Fibre Length (mm) | Cement (kg/m3) | Metakaolin (kg/m3) | Rice Husk Ash (kg/m3) | Wood Ash (kg/m3) | Fine Aggregate (kg/m3) | Curing (Days) | Compressive Strength (N/mm2) | Tensile Strength (N/mm2) | Impact Strength (N/mm2) |
| 0 | 66 | 101 | 150 | 17 | 666 | 7 | 2.07 | 0.44 | 977 |
| 0 | 66 | 101 | 134 | 33 | 666 | 7 | 2.27 | 0.76 | 1160 |
| 0 | 66 | 101 | 117 | 50 | 666 | 7 | 2.41 | 0.73 | 1669 |
| 0 | 66 | 101 | 101 | 66 | 666 | 7 | 2.87 | 0.68 | 1506 |
| 0 | 66 | 101 | 84 | 83 | 666 | 7 | 2.27 | 0.52 | 2035 |
| 10 | 66 | 101 | 150 | 17 | 666 | 7 | 2.34 | 0.91 | 2503 |
| 10 | 66 | 101 | 134 | 33 | 666 | 7 | 3.14 | 0.68 | 2280 |
| 10 | 66 | 101 | 117 | 50 | 666 | 7 | 4.95 | 0.57 | 2341 |
| 10 | 66 | 101 | 101 | 66 | 666 | 7 | 6.95 | 0.44 | 2198 |
| 10 | 66 | 101 | 84 | 83 | 666 | 7 | 4.48 | 0.42 | 2463 |
| 20 | 66 | 101 | 150 | 17 | 666 | 7 | 2.34 | 0.94 | 2219 |
| 20 | 66 | 101 | 134 | 33 | 666 | 7 | 2.54 | 0.81 | 2137 |
| 20 | 66 | 101 | 117 | 50 | 666 | 7 | 5.48 | 0.86 | 2259 |
| 20 | 66 | 101 | 101 | 66 | 666 | 7 | 8.16 | 0.99 | 1954 |
| 20 | 66 | 101 | 84 | 83 | 666 | 7 | 4.68 | 0.73 | 2361 |
| 0 | 66 | 101 | 150 | 17 | 666 | 28 | 3.95 | 1.04 | 1079 |
| 0 | 66 | 101 | 134 | 33 | 666 | 28 | 4.28 | 1.04 | 1282 |
| 0 | 66 | 101 | 117 | 50 | 666 | 28 | 4.54 | 1.22 | 1669 |
| 0 | 66 | 101 | 101 | 66 | 666 | 28 | 4.82 | 1.43 | 1649 |
| 0 | 66 | 101 | 84 | 83 | 666 | 28 | 4.15 | 1.2 | 2178 |
| 10 | 66 | 101 | 150 | 17 | 666 | 28 | 4.15 | 1.07 | 2605 |
| 10 | 66 | 101 | 134 | 33 | 666 | 28 | 4.88 | 1.2 | 2341 |
| 10 | 66 | 101 | 117 | 50 | 666 | 28 | 6.75 | 1.28 | 2503 |
| 10 | 66 | 101 | 101 | 66 | 666 | 28 | 9.90 | 1.46 | 2239 |
| 10 | 66 | 101 | 84 | 83 | 666 | 28 | 6.75 | 1.15 | 2565 |
| 20 | 66 | 101 | 150 | 17 | 666 | 28 | 3.88 | 1.35 | 2300 |
| 20 | 66 | 101 | 134 | 33 | 666 | 28 | 4.61 | 1.43 | 2178 |
| 20 | 66 | 101 | 117 | 50 | 666 | 28 | 6.95 | 1.59 | 2300 |
| 20 | 66 | 101 | 101 | 66 | 666 | 28 | 10.97 | 2.01 | 2035 |
| 20 | 66 | 101 | 84 | 83 | 666 | 28 | 6.09 | 1.67 | 2402 |
| 0 | 66 | 101 | 150 | 17 | 666 | 56 | 5.42 | 1.77 | 1445 |
| 0 | 66 | 101 | 134 | 33 | 666 | 56 | 5.75 | 1.9 | 1486 |
| 0 | 66 | 101 | 117 | 50 | 666 | 56 | 5.89 | 1.61 | 1913 |
| 0 | 66 | 101 | 101 | 66 | 666 | 56 | 6.15 | 2.08 | 1628 |
| 0 | 66 | 101 | 84 | 83 | 666 | 56 | 5.15 | 1.9 | 2524 |
| 10 | 66 | 101 | 150 | 17 | 666 | 56 | 6.35 | 2.24 | 3236 |
| 10 | 66 | 101 | 134 | 33 | 666 | 56 | 6.55 | 2.47 | 3419 |
| 10 | 66 | 101 | 117 | 50 | 666 | 56 | 7.36 | 2.32 | 3786 |
| 10 | 66 | 101 | 101 | 66 | 666 | 56 | 11.66 | 2.63 | 3521 |
| 10 | 66 | 101 | 84 | 83 | 666 | 56 | 7.89 | 2.16 | 3969 |
| 20 | 66 | 101 | 150 | 17 | 666 | 56 | 6.95 | 2.47 | 3134 |
| 20 | 66 | 101 | 134 | 33 | 666 | 56 | 6.15 | 2.71 | 3318 |
| 20 | 66 | 101 | 117 | 50 | 666 | 56 | 8.36 | 2.32 | 3562 |
| 20 | 66 | 101 | 101 | 66 | 666 | 56 | 12.56 | 2.94 | 3643 |
| 20 | 66 | 101 | 84 | 83 | 666 | 56 | 7.09 | 2.63 | 3704 |
References
- Damtoft, J.S.; Lukasik, J.; Herfort, D.; Gartner, E.M. Sustainable development and climate change initiatives. Cem. Concr. Res. 2008, 38, 115–127. [Google Scholar] [CrossRef]
- Georgescu, M.; Panait, N. Influence of CaCo3 on the hydration and hardening processes in C3S–H2O system. Rom. J. Mater. 2004, 34, 27–35. [Google Scholar]
- Wi, K.; Lee, H.; Lim, S.; Song, H.; Hussin, M.; Ismail, M. Use of an agricultural by-product, nano-sized Palm Oil Fuel Ash as a supplementary cementitious material. Constr. Build. Mater. 2018, 183, 139–149. [Google Scholar] [CrossRef]
- Keerio, M.A.; Saand, A.; Kumar, A.; Bheel, N.; Ali, A. Effect of local metakaolin developed from natural material soorh and coal bottom ash on fresh, hardened properties and embodied carbon of self-compacting concrete. Environ. Sci. Pollut. Res. 2021, 28, 60000–60018. [Google Scholar] [CrossRef] [PubMed]
- Sakir, S.; Raman, S.N.; Safiuddin, M.; Amrul Kaish, A.B.M.; Mutalib, A.A. Utilization of By-Products and Wastes as Supplementary Cementitious Materials in Structural Mortar for Sustainable Construction. Sustainability 2020, 12, 3888. [Google Scholar] [CrossRef]
- Kumar, R.; Shafiq, N.; Kumar, A.; Jhatial, A.A. Investigating embodied carbon, mechanical properties, and durability of high-performance concrete using ternary and quaternary blends of metakaolin, nano-silica, and fly ash. Environ. Sci. Pollut. Res. 2021, 28, 49074–49088. [Google Scholar] [CrossRef] [PubMed]
- Revathy, J.; Yaswanth, K.K.; Gajalakshmi, P. Flexural performance of GGBS-based EGC layered reinforced cement concrete and geopolymer concrete beams: A retrofit perspective. Innov. Infrastruct. Solut. 2023, 8, 263. [Google Scholar] [CrossRef]
- Supit, S.W.M.; Shaikh, F.U.A.; Sarker, P.K. Effect of ultrafine fly ash on mechanical properties of high volume fly ash mortar. Constr. Build. Mater. 2014, 51, 278–286. [Google Scholar] [CrossRef]
- Praveen Kumar, V.V.; Ravi Prasada, D. Influence of supplementary cementitious materials on strength and durability characteristics of concrete. Adv. Concr. Constr. 2019, 7, 75. [Google Scholar] [CrossRef]
- Madurwar, M.; Ralegaonkar, R.; Mandavgane, S. Application of agro-waste for sustainable construction materials: A review. Constr. Build. Mater. 2013, 38, 872–878. [Google Scholar] [CrossRef]
- Sam, A.R.M.; Usman, J.; Sumadi, S.R. Properties of binary and ternary blended cement mortars containing palm oil fuel ash and metakaolin. J. Chin. Inst. Eng. 2017, 40, 170–178. [Google Scholar] [CrossRef]
- Güneyisi, E.; Gesoğlu, M. Properties of self-compacting mortars with binary and ternary cementitious blends of fly ash and metakaolin. Mater. Struct. 2008, 41, 1519–1531. [Google Scholar] [CrossRef]
- Alex, J.; Dhanalakshmi, J.; Ambedkar, B. Experimental investigation on rice husk ash as cement replacement on concrete production. Constr. Build. Mater. 2016, 127, 353–362. [Google Scholar] [CrossRef]
- Rukzon, S.; Chindaprasirt, P. Strength, porosity, and chloride resistance of mortar using the combination of two kinds of pozzolanic materials. Int. J. Miner. Metall. Mater. 2013, 20, 808–814. [Google Scholar] [CrossRef]
- Oruji, S.; Brake, N.A.; Nalluri, L.; Guduru, R.K. Strength activity and Microstructure of blended ultra–fine coal bottom ash–cement mortar. Constr. Build. Mater. 2017, 153, 317–326. [Google Scholar] [CrossRef]
- Chindaprasir, P.; Ruzkon, S. Strength, porosity and corrosion resistance of ternary Portland cement, rice husk ash and fly ash mortar. Constr. Build. Mater. 2008, 22, 1601–1606. [Google Scholar] [CrossRef]
- Nagaratnam, B.H.; Mannan, M.A.; Rahman, M.E.; Mirasa, A.K.; Richardson, A.; Nabinejad, O. Strength and microstructural characteristics of palm oil fuel ash and fly ash as binary and ternary blends in Self-Compacting concrete. Constr. Build. Mater. 2019, 202, 103–120. [Google Scholar] [CrossRef]
- Gesoglu, M.; Guneyisi, E.; Ozbay, E. Properties of Self–Compacting Concretes made with binary, ternary and quaternary cementitious blends of Fly Ash, Blast Furnace Slag and Silica Fume. Constr. Build. Mater. 2009, 23, 1847–1854. [Google Scholar] [CrossRef]
- Choudhary, R.; Gupta, R.; Nagar, R. Impact on fresh, mechanical, and microstructural properties of high strength self- compacting concrete by marble cutting slurry waste, fly ash, and silica fume. Constr. Build. Mater. 2020, 239, 117888. [Google Scholar] [CrossRef]
- Dave, N.; Misra, A.K.; Srivastava, A.; Kaushik, S.K. Experimental analysis of strength and durability properties of quaternary cement binder and mortar. Constr. Build. Mater. 2016, 107, 117–124. [Google Scholar] [CrossRef]
- Isaia, G.C.; Gastaldini, A.L.G.; Moraes, R. Physical and pozzolanic action of mineral additions on the mechanical strength of high performance concrete. Cem. Concr. Compos. 2003, 25, 69–76. [Google Scholar] [CrossRef]
- Imam, A.; Kumar, V.; Srivastava, V. Empirical predictions for the mechanical properties of Quaternary Cement Concrete. J. Struct. Integr. Maint. 2018, 3, 183–196. [Google Scholar] [CrossRef]
- Sivakumar, A.; Santhanam, M. Mechanical properties of high strength concrete reinforced with metallic and non-metallic fibres. Cem. Concr. Compos. 2007, 29, 603–608. [Google Scholar] [CrossRef]
- Kanagavel, R.; Arunachalam, K. Experimental Investigation on Mechanical Properties of Hybrid Fiber Reinforced Quaternary Cement Concrete. J. Eng. Fibers Fabr. 2015, 10, 155892501501000407. [Google Scholar] [CrossRef]
- Kumar, S.; Ganesan, N.; Indira, P.V. Engineering Properties of Hybrid Fibre Reinforced Ternary Blend Geopolymer Concrete. J. Compos. Sci. 2021, 5, 203. [Google Scholar] [CrossRef]
- Arokiaprakash, A.; Selvan, S.S. Experimental strength evaluation of steel-polypropylene hybrid fibre reinforced concrete. J. Eng. Res. ACMM Spec. Issue 2022, 1–13. [Google Scholar] [CrossRef]
- Pickering, K.L.; Aruan Efendy, M.G.; Le, T.M. A review of recent developments in natural fibre composites and their mechanical performance. Compos. Part A Appl. Sci. Manuf. 2016, 83, 98–112. [Google Scholar] [CrossRef]
- Poongodi, K.; Khan, A.; Mushraf, M.; Prathap, V.; Harish, G. Strength properties of hybrid fibre reinforced quaternary blended high performance concrete. Mater. Today: Proc. 2021, 39, 627–632. [Google Scholar] [CrossRef]
- Abellan-Garcia, J.; Fernández-Gómez, J.; Khan, M.I.; Abbas, Y.M.; Pacheco-Bustos, C. ANN approach to evaluate the effects of supplementary cementitious materials on the compressive strength of recycled aggregate concrete. Constr. Build. Mater. 2023, 402, 132992. [Google Scholar] [CrossRef]
- Ahmad, A.; Ahmad, W.; Aslam, F.; Joyklad, P. Compressive strength prediction of fly ash-based geopolymer concrete via advanced machine learning techniques. Case Stud. Constr. Mater. 2022, 16, e00840. [Google Scholar] [CrossRef]
- Arokiaprakash, A.; Selvan, S.S. Application of Random Forest and Multi-layer Perceptron ANNS in Estimating the Axial Compression Capacity of Concrete-Filled Steel Tubes. Iran. J. Sci. Technol. Trans. Civ. Eng. 2022, 46, 4111–4130. [Google Scholar] [CrossRef]
- Bai, J.; Wild, S.; Ware, J.A.; Sabir, B.B. Using neural networks to predict workability of concrete incorporating metakaolin and fly ash. Adv. Eng. Softw. 2003, 34, 663–669. [Google Scholar] [CrossRef]
- Amar, M.; Benzerzour, M.; Zentar, R.; Abriak, N.-E. Prediction of the Compressive Strength of Waste-Based Concretes Using Artificial Neural Network. Materials 2022, 15, 7045. [Google Scholar] [CrossRef]
- Mohamed, O.; Kewalramani, M.; Ati, M.; Hawat, W.A. Application of ANN for prediction of chloride penetration resistance and concrete compressive strength. Materialia 2021, 17, 101123. [Google Scholar] [CrossRef]
- Khan, A.Q. Optimized artificial neural network model for accurate prediction of compressive strength of normal and high strength concrete. Clean. Mater. 2023, 10, 100211. [Google Scholar] [CrossRef]
- Murthy, M.N.; Amruth, S.K.; Marulasiddappa, S.B. Modeling the compressive strength of binary and ternary blended high-performance concrete mixtures using ensemble machine learning models. Soft Comput. 2024, 28, 6683–6693. [Google Scholar] [CrossRef]
- Lingam, A.; Karthikeyan, J. Prediction of compressive strength for HPC mixes containing different blends using ANN. Comput. Concr. 2014, 13, 621–632. [Google Scholar] [CrossRef]
- Liu, F.; Ding, W.; Qiao, Y. An artificial neural network model on tensile behavior of hybrid steel-PVA fiber reinforced concrete containing fly ash and slag power. Front. Struct. Civ. Eng. 2020, 14, 1299–1315. [Google Scholar] [CrossRef]
- Verma, N.K.; Meesala, C.R.; Kumar, S. Developing an ANN prediction model for compressive strength of fly ash-based geopolymer concrete with experimental investigation. Neural Comput. Applic 2023, 35, 10329–10345. [Google Scholar] [CrossRef]
- Yaswanth, K.K.; Sathish Kumar, V.; Revathy, J.; Murali, G.; Pavithra, C. Compressive strength prediction of ternary blended geopolymer concrete using artificial neural networks and support vector regression. Innov. Infrastruct. Solut. 2024, 9, 32. [Google Scholar] [CrossRef]
- Chepurnenko, A.; Turina, V.; Akopyan, V. Artificial Neural Network Models for Determining the Load-Bearing Capacity of Eccentrically Compressed Short Concrete-Filled Steel Tubular Columns. CivilEng 2024, 5, 150–168. [Google Scholar] [CrossRef]
- Veerapandian, V.; Pandulu, G.; Jayaseelan, R. Simplified deep-learning approach for estimating the ultimate axial load of circular composite columns. Asian J. Civ. Eng. 2023, 24, 2375–2387. [Google Scholar] [CrossRef]
- Demir, T.; Duranay, Z.B.; Demirel, B.; Yildirim, B. Artificial neural network evaluation of concrete performance exposed to elevated temperature with destructive–non-destructive tests. Neural Comput. Applic 2024, 36, 17079–17093. [Google Scholar] [CrossRef]
- Raheel, M.; Khan, H.; Iqbal, M.; Khan, R.; Saberian, M.; Li, J.; Ullah, Q.S. Experimental investigation of quaternary blended sustainable concrete along with mix design optimization. Structures 2023, 54, 499–514. [Google Scholar] [CrossRef]
- IS 12269: 2013; Indian Standard Methods of Specification for Ordinary Portland Cement—53 Grade. BIS: Washington, DC, USA, 2013.
- IS 383: 2016; Indian Standard Specification For Coarse And Fine Aggregates From Natural Sources For Concrete. BIS: Washington, DC, USA, 2016.
- IS 2386 (Part 3): 1963; Indian Standard Methods of Methods of Test for Aggregates for Concrete. BIS: Washington, DC, USA, 1963.
- Geremew, A.; De Winne, P.; Demissie, T.A.; De Backer, H. Treatment of Natural Fiber for Application in Concrete Pavement. Adv. Civ. Eng. 2021, 2021, 6667965. [Google Scholar] [CrossRef]
- Prasanna, K.; Anandh, K.S.; Ravi Shankar, S. An experimental study on strengthening of concrete mixed with ground granulated blast furnace slag (GGBS). ARPN J. Eng. Appl. Sci. 2017, 12, 2439–2444. [Google Scholar]
- IS 4031 (Part 6):1988; Indian Standard Methods of Physical Tests for Hydraulic Cement, (Reaffirmed 2005). BIS: Washington, DC, USA, 1988.
- IS 5816:1999; Indian Standard Methods of Splitting Tensile Strength of Concrete—Method of Test, (Reaffirmed 2004). BIS: Washington, DC, USA, 1999.
- ACI 544.2R—89: 1999; Measurement of Properties of Fibre Reinforced Concrete. ACI: Farmington Hills, MI, USA, 1999.
- Karthiga, S.; Umamaheswari, N. Prediction of displacement of composite slab with profiled steel deck using artificial neural network. Asian J. Civ. Eng. 2024, 25, 4179–4196. [Google Scholar] [CrossRef]
- Yaswanth, K.K.; Revathy, J.; Gajalakshmi, P. Artificial intelligence for the compressive strength prediction of novel ductile geopolymer composites. Comput. Concr. 2021, 28, 55–68. [Google Scholar] [CrossRef]
- Sheela, K.G.; Deepa, S.N. Review on methods to fix number of hidden neurons in neural networks. Math. Probl. Eng. 2013, 2013, 425740. [Google Scholar] [CrossRef]
- Revathy, J.; Gajalakshmi, P.; Ashwini, G. Neural networks for the prediction of fresh properties and compressive strength of flowable concrete. J. Urban Environ. Eng. 2019, 13, 183–197. [Google Scholar] [CrossRef]
- Albostami, A.S.; Al-Hamd, R.K.S.; Alzabeebee, S.; Minto, A.; Keawsawasvong, S. Application of soft computing in predicting the compressive strength of self-compacted concrete containing recyclable aggregate. Asian J. Civ. Eng. 2024, 25, 183–196. [Google Scholar] [CrossRef]
- Chandramouli, P.; Jayaseelan, R.; Pandulu, G.; Sathish Kumar, V.; Murali, G.; Vatin, N.I. Estimating the Axial Compression Capacity of Concrete-Filled Double-Skin Tubular Columns with Metallic and Non-Metallic Composite Materials. Materials 2022, 15, 3567. [Google Scholar] [CrossRef] [PubMed]
- Mala, K.; Mullick, A.K.; Jain, K.K. Effect of Relative Levels of Mineral Admixtures on Strength of Concrete with Ternary Cement Blend. Int. J. Concr. Struct. Mater. 2013, 7, 239–249. [Google Scholar] [CrossRef]
- Elmoaty Abd, M.; Morsy, A.M.; Harraz, A.B. Effect of Fiber Type and Volume Fraction on Fiber Reinforced Concrete and Engineered Cementitious Composite Mechanical Properties. Buildings 2022, 12, 2108. [Google Scholar] [CrossRef]
- Ismail, M.K.; Hassan, A.A.A.; Lachemi, M. Performance of Self Consolidating Engineered Cementitious Composite under Drop Weight Impact Loading. J. Mater. Civ. Eng. 2019, 31, 04018400. [Google Scholar] [CrossRef]
- Bharatkumar, B.H.; Narayanan, R.; Raghuprasad, B.K.; Ramachandramurthy, D.S. Mix Proportioning of High Performance Concrete. Cem. Concr. Compos. 2001, 23, 71–80. [Google Scholar] [CrossRef]


| OPC | MK | RHA | WA | |
|---|---|---|---|---|
| Physical Properties | ||||
| Specific gravity | 3.14 | 2.30 | 2.14 | 1.71 |
| Specific surface area (cm2/g) | 2285 | 8735 | 3750 | 1203 |
| Mean particle size (μm) | 90 | 2 | 4 | 180 |
| Chemical Composition (%) | ||||
| SiO2 | 20.38 | 55.25 | 97.32 | 9.29 |
| CaO | 71.60 | 0.40 | --- | 58.27 |
| Na2O | 0.18 | 0.18 | 0.26 | 6.96 |
| K2O | 0.09 | 1.40 | -- | 3.95 |
| Al2O3 | 3.22 | 44.14 | 0.20 | 3.03 |
| FeO | 2.88 | 0.09 | 7.68 | |
| MnO | 0.07 | 0.08 | 0.01 | 0.24 |
| MgO | 0.98 | 0.08 | 0.21 | 5.03 |
| TiO2 | 0.29 | --- | 0.19 | 0.27 |
| SO3 | 0.26 | --- | --- | 2.88 |
| P2O5 | 0.05 | --- | --- | 0.62 |
| ZnO | --- | --- | --- | --- |
| LoI | 2.20 | 0.25 | 4.0 | 20.1 |
| Plant Fibre Type | Density (g/cm3) | Tensile Strength (MPa) | Elongation (%) | Failure Strain | Moisture Regain | Avg. Dia. (d) (mm) | Length (l) (mm) | l/d |
|---|---|---|---|---|---|---|---|---|
| BF | 1.3 | 780 | 3 | 2 | 60 | 0.16 | 10 | 63 |
| 20 | 125 | |||||||
| JF | 1.3 | 750 | 1.7 | 3 | 17 | 0.20 | 10 | 50 |
| 20 | 100 |
| Mix ID | Length of Fibers (mm) | OPC (kg/m3) | MK (kg/m3) | RHA (kg/m3) | WA (kg/m3) | FA (kg/m3) |
|---|---|---|---|---|---|---|
| MC1 | - | 66 | 101 | 150 | 17 | 666 |
| MC2 | - | 66 | 101 | 134 | 33 | 666 |
| MC3 | - | 66 | 101 | 117 | 50 | 666 |
| MC4 | - | 66 | 101 | 101 | 66 | 666 |
| MC5 | - | 66 | 101 | 84 | 83 | 666 |
| M1L1 | 10 | 66 | 101 | 150 | 17 | 666 |
| M2L1 | 10 | 66 | 101 | 134 | 33 | 666 |
| M3L1 | 10 | 66 | 101 | 117 | 50 | 666 |
| M4L1 | 10 | 66 | 101 | 101 | 66 | 666 |
| M5L1 | 10 | 66 | 101 | 84 | 83 | 666 |
| M1L2 | 20 | 66 | 101 | 150 | 17 | 666 |
| M2L2 | 20 | 66 | 101 | 134 | 33 | 666 |
| M3L2 | 20 | 66 | 101 | 117 | 50 | 666 |
| M4L2 | 20 | 66 | 101 | 101 | 66 | 666 |
| M5L2 | 20 | 66 | 101 | 84 | 83 | 666 |
| Input/Output | Parameters | Range |
|---|---|---|
| Input | Fibre length | 0–20 |
| RHA | 0–150 | |
| WA | 0–100 | |
| Curing days | 7–56 | |
| Output | Compressive strength | 2.07–12.56 |
| Tensile strength | 0.42–2.94 | |
| Impact strength | 977–3969 |
| Mix ID | Number of Blows | |||||
|---|---|---|---|---|---|---|
| 7 Days | 28 Days | 56 Days | ||||
| Initial Stage (N1) | Final Stage (N2) | Initial Stage (N1) | Final Stage (N2) | Initial Stage (N1) | Final Stage (N2) | |
| MC1 | 20 | 48 | 25 | 53 | 38 | 71 |
| MC2 | 26 | 57 | 31 | 63 | 40 | 73 |
| MC3 | 33 | 82 | 39 | 82 | 47 | 94 |
| MC4 | 31 | 74 | 36 | 81 | 30 | 80 |
| MC5 | 38 | 100 | 43 | 107 | 53 | 124 |
| M1L1 | 59 | 123 | 66 | 128 | 72 | 159 |
| M2L1 | 54 | 112 | 58 | 115 | 66 | 168 |
| M3L1 | 67 | 115 | 73 | 123 | 81 | 186 |
| M4L1 | 60 | 108 | 65 | 110 | 75 | 173 |
| M5L1 | 74 | 121 | 80 | 126 | 91 | 195 |
| M1L2 | 55 | 109 | 58 | 113 | 67 | 154 |
| M2L2 | 52 | 105 | 55 | 107 | 58 | 163 |
| M3L2 | 60 | 111 | 63 | 113 | 75 | 175 |
| M4L2 | 52 | 96 | 57 | 100 | 69 | 179 |
| M5L2 | 70 | 116 | 74 | 118 | 90 | 182 |
| Mix ID | Age of Testing | X1 | X2 |
|---|---|---|---|
| MC1 | 7 | −5.20 | 2.60 |
| 28 | 5.22 | −2.61 | |
| 56 | −2.60 | 1.30 | |
| MC2 | 7 | −5.22 | 2.61 |
| 28 | −5.20 | 2.60 | |
| 56 | 5.22 | −2.61 | |
| MC3 | 7 | −0.53 | 2.67 |
| 28 | 5.20 | −2.60 | |
| 56 | 1.04 | −5.20 | |
| MC4 | 7 | −4.99 | 2.49 |
| 28 | 0 | 4.81 | |
| 56 | 5.22 | −2.61 | |
| MC5 | 7 | −5.22 | 2.61 |
| 28 | −1.04 | 5.22 | |
| 56 | −1.04 | 5.22 | |
| M1L1 | 7 | 5.22 | −2.61 |
| 28 | 5.22 | −2.61 | |
| 56 | 5.22 | −2.61 | |
| M2L1 | 7 | −1.04 | 5.22 |
| 28 | −5.20 | 2.60 | |
| 56 | −1.04 | 5.20 | |
| M3L1 | 7 | −1.04 | 5.20 |
| 28 | −1.04 | 5.22 | |
| 56 | −1.04 | 5.22 | |
| M4L1 | 7 | −1.04 | 5.20 |
| 28 | −5.22 | 2.61 | |
| 56 | 1.65 | −8.26 | |
| M5L1 | 7 | −2.08 | 1.04 |
| 28 | −1.04 | 5.22 | |
| 56 | −5.22 | 2.61 | |
| M1L2 | 7 | 5.22 | −2.61 |
| 28 | −5.22 | 2.61 | |
| 56 | −1.04 | 5.20 | |
| M2L2 | 7 | 5.22 | −2.61 |
| 28 | 0 | 4.61 | |
| 56 | 5.22 | −2.61 | |
| M3L2 | 7 | −5.22 | 2.61 |
| 28 | −1.04 | 5.20 | |
| 56 | −1.04 | 5.22 | |
| M4L2 | 7 | −1.04 | 5.20 |
| 28 | −1.04 | 5.22 | |
| 56 | 5.20 | −2.60 | |
| M5L2 | 7 | −5.22 | 2.61 |
| 28 | −5.22 | 2.61 | |
| 56 | −5.22 | 2.61 |
| Mix ID | Age of Testing | αMA | αMK | αRHA | αWA |
|---|---|---|---|---|---|
| MC1 | 7 | 0.042 | 0.296 | 0.199 | 1.760 |
| 28 | −0.091 | 1.988 | 1.338 | 11.813 | |
| 56 | 0.041 | −2.413 | −1.624 | −14.337 | |
| MC2 | 7 | 0.034 | 0.233 | 0.176 | 0.715 |
| 28 | 0.094 | −0.418 | −0.315 | −1.279 | |
| 56 | −0.090 | 2.570 | 1.937 | 7.868 | |
| MC3 | 7 | 0.003 | 2.068 | 1.785 | 4.177 |
| 28 | −0.090 | 2.186 | 1.887 | 4.416 | |
| 56 | −0.016 | 17.311 | 14.944 | 34.970 | |
| MC4 | 7 | −4.306 | 0.002 | 0.002 | 0.003 |
| 28 | 0 | 0 | 0 | 0 | |
| 56 | −0.089 | 2.700 | 2.700 | 4.131 | |
| MC5 | 7 | 0.034 | 0.233 | 0.281 | 0.284 |
| 28 | 0.011 | 2.366 | 2.845 | 2.879 | |
| 56 | 0.002 | 0.743 | 0.893 | 0.904 | |
| M1L1 | 7 | −0.093 | 1.470 | 0.990 | 8.739 |
| 28 | −0.091 | 2.053 | 1.382 | 12.198 | |
| 56 | −0.089 | 2.764 | 1.861 | 16.426 | |
| M2L1 | 7 | 0.013 | 3.989 | 3.007 | 12.211 |
| 28 | 0.088 | −0.612 | −0.462 | −1.876 | |
| 56 | 0.021 | −1.561 | −1.176 | −4.778 | |
| M3L1 | 7 | 0.006 | 1.036 | 0.894 | 2.093 |
| 28 | 0.020 | −1.854 | −1.600 | −3.745 | |
| 56 | 0.018 | −2.828 | −2.441 | −5.713 | |
| M4L1 | 7 | 0.019 | −2.210 | −2.210 | −3.382 |
| 28 | 0.077 | −2.224 | −2.224 | −3.404 | |
| 56 | −0.026 | 19.925 | 19.925 | 30.491 | |
| M5L1 | 7 | 0.034 | −2.469 | −2.969 | −3.005 |
| 28 | 0.020 | −1.854 | −2.229 | −2.256 | |
| 56 | 0.079 | −1.577 | −1.896 | −1.919 | |
| M1L2 | 7 | −0.093 | 1.470 | 0.990 | 8.739 |
| 28 | 0.105 | −0.283 | −0.191 | −1.685 | |
| 56 | 0.019 | −2.210 | −1.488 | −13.132 | |
| M2L2 | 7 | −0.092 | 1.535 | 1.157 | 4.700 |
| 28 | 0 | 0 | 0 | 0 | |
| 56 | −0.089 | 2.700 | 2.035 | 8.263 | |
| M3L2 | 7 | 0.084 | −0.801 | −0.691 | −1.618 |
| 28 | 0.019 | −2.210 | −1.908 | −4.465 | |
| 56 | 0.017 | −4.451 | −3.843 | −8.992 | |
| M4L2 | 7 | 0.017 | −4.158 | −4.158 | −6.364 |
| 28 | 0.016 | −8.672 | −8.672 | −13.272 | |
| 56 | −0.087 | 4.782 | 4.782 | 7.318 | |
| M5L2 | 7 | 0.090 | −0.542 | −0.652 | −0.660 |
| 28 | 0.082 | −0.995 | −1.196 | −1.2117 | |
| 56 | 0.080 | −1.318 | −1.585 | −1.604 |
| MIX ID | Experimental Compressive Strength (N/mm2) | Predicted Compressive Strength (N/mm2) | Difference (%) | ||||||
|---|---|---|---|---|---|---|---|---|---|
| 7 Days | 28 Days | 56 Days | 7 Days | 28 Days | 56 Days | 7 Days | 28 Days | 56 Days | |
| MC1 | 2.073 | 3.945 | 5.416 | 2.472 | 4.102 | 5.163 | 17.55 | 3.90 | 4.78 |
| MC2 | 2.273 | 4.280 | 5.751 | 2.325 | 4.956 | 6.050 | 2.26 | 14.63 | 5.06 |
| MC3 | 2.407 | 4.543 | 5.885 | 2.524 | 4.907 | 5.185 | 4.74 | 7.70 | 12.64 |
| MC4 | 2.872 | 4.815 | 6.152 | 2.667 | 4.356 | 6.652 | 7.40 | 10.00 | 7.81 |
| MC5 | 2.273 | 4.146 | 5.149 | 2.524 | 3.908 | 5.546 | 10.46 | 5.91 | 7.42 |
| M1L1 | 2.340 | 4.146 | 6.353 | 2.981 | 4.606 | 6.950 | 24.09 | 10.51 | 8.97 |
| M2L1 | 3.143 | 4.882 | 6.553 | 4.121 | 4.205 | 6.015 | 26.92 | 14.90 | 8.56 |
| M3L1 | 4.948 | 6.754 | 7.356 | 3.946 | 6.903 | 7.053 | 22.53 | 2.18 | 4.20 |
| M4L1 | 6.954 | 9.897 | 11.661 | 5.279 | 9.108 | 11.473 | 27.38 | 8.30 | 1.62 |
| M5L1 | 4.480 | 6.754 | 7.891 | 3.350 | 6.237 | 7.292 | 28.86 | 7.95 | 7.89 |
| M1L2 | 2.340 | 3.878 | 6.954 | 2.145 | 3.102 | 6.154 | 8.69 | 22.23 | 12.20 |
| M2L2 | 2.541 | 4.614 | 6.152 | 2.068 | 4.011 | 6.869 | 20.52 | 13.98 | 11.01 |
| M3L2 | 5.483 | 6.954 | 8.359 | 4.954 | 6.249 | 8.157 | 10.13 | 10.67 | 2.44 |
| M4L2 | 8.158 | 10.967 | 12.563 | 7.603 | 10.026 | 12.062 | 7.04 | 8.96 | 4.06 |
| M5L2 | 4.681 | 6.085 | 7.088 | 5.165 | 7.010 | 7.485 | 9.83 | 14.12 | 5.44 |
| Parameters | Compressive Strength | Tensile Strength | Impact Energy | ||||||
|---|---|---|---|---|---|---|---|---|---|
| 7 Days | 28 Days | 56 Days | 7 Days | 28 Days | 56 Days | 7 Days | 28 Days | 56 Days | |
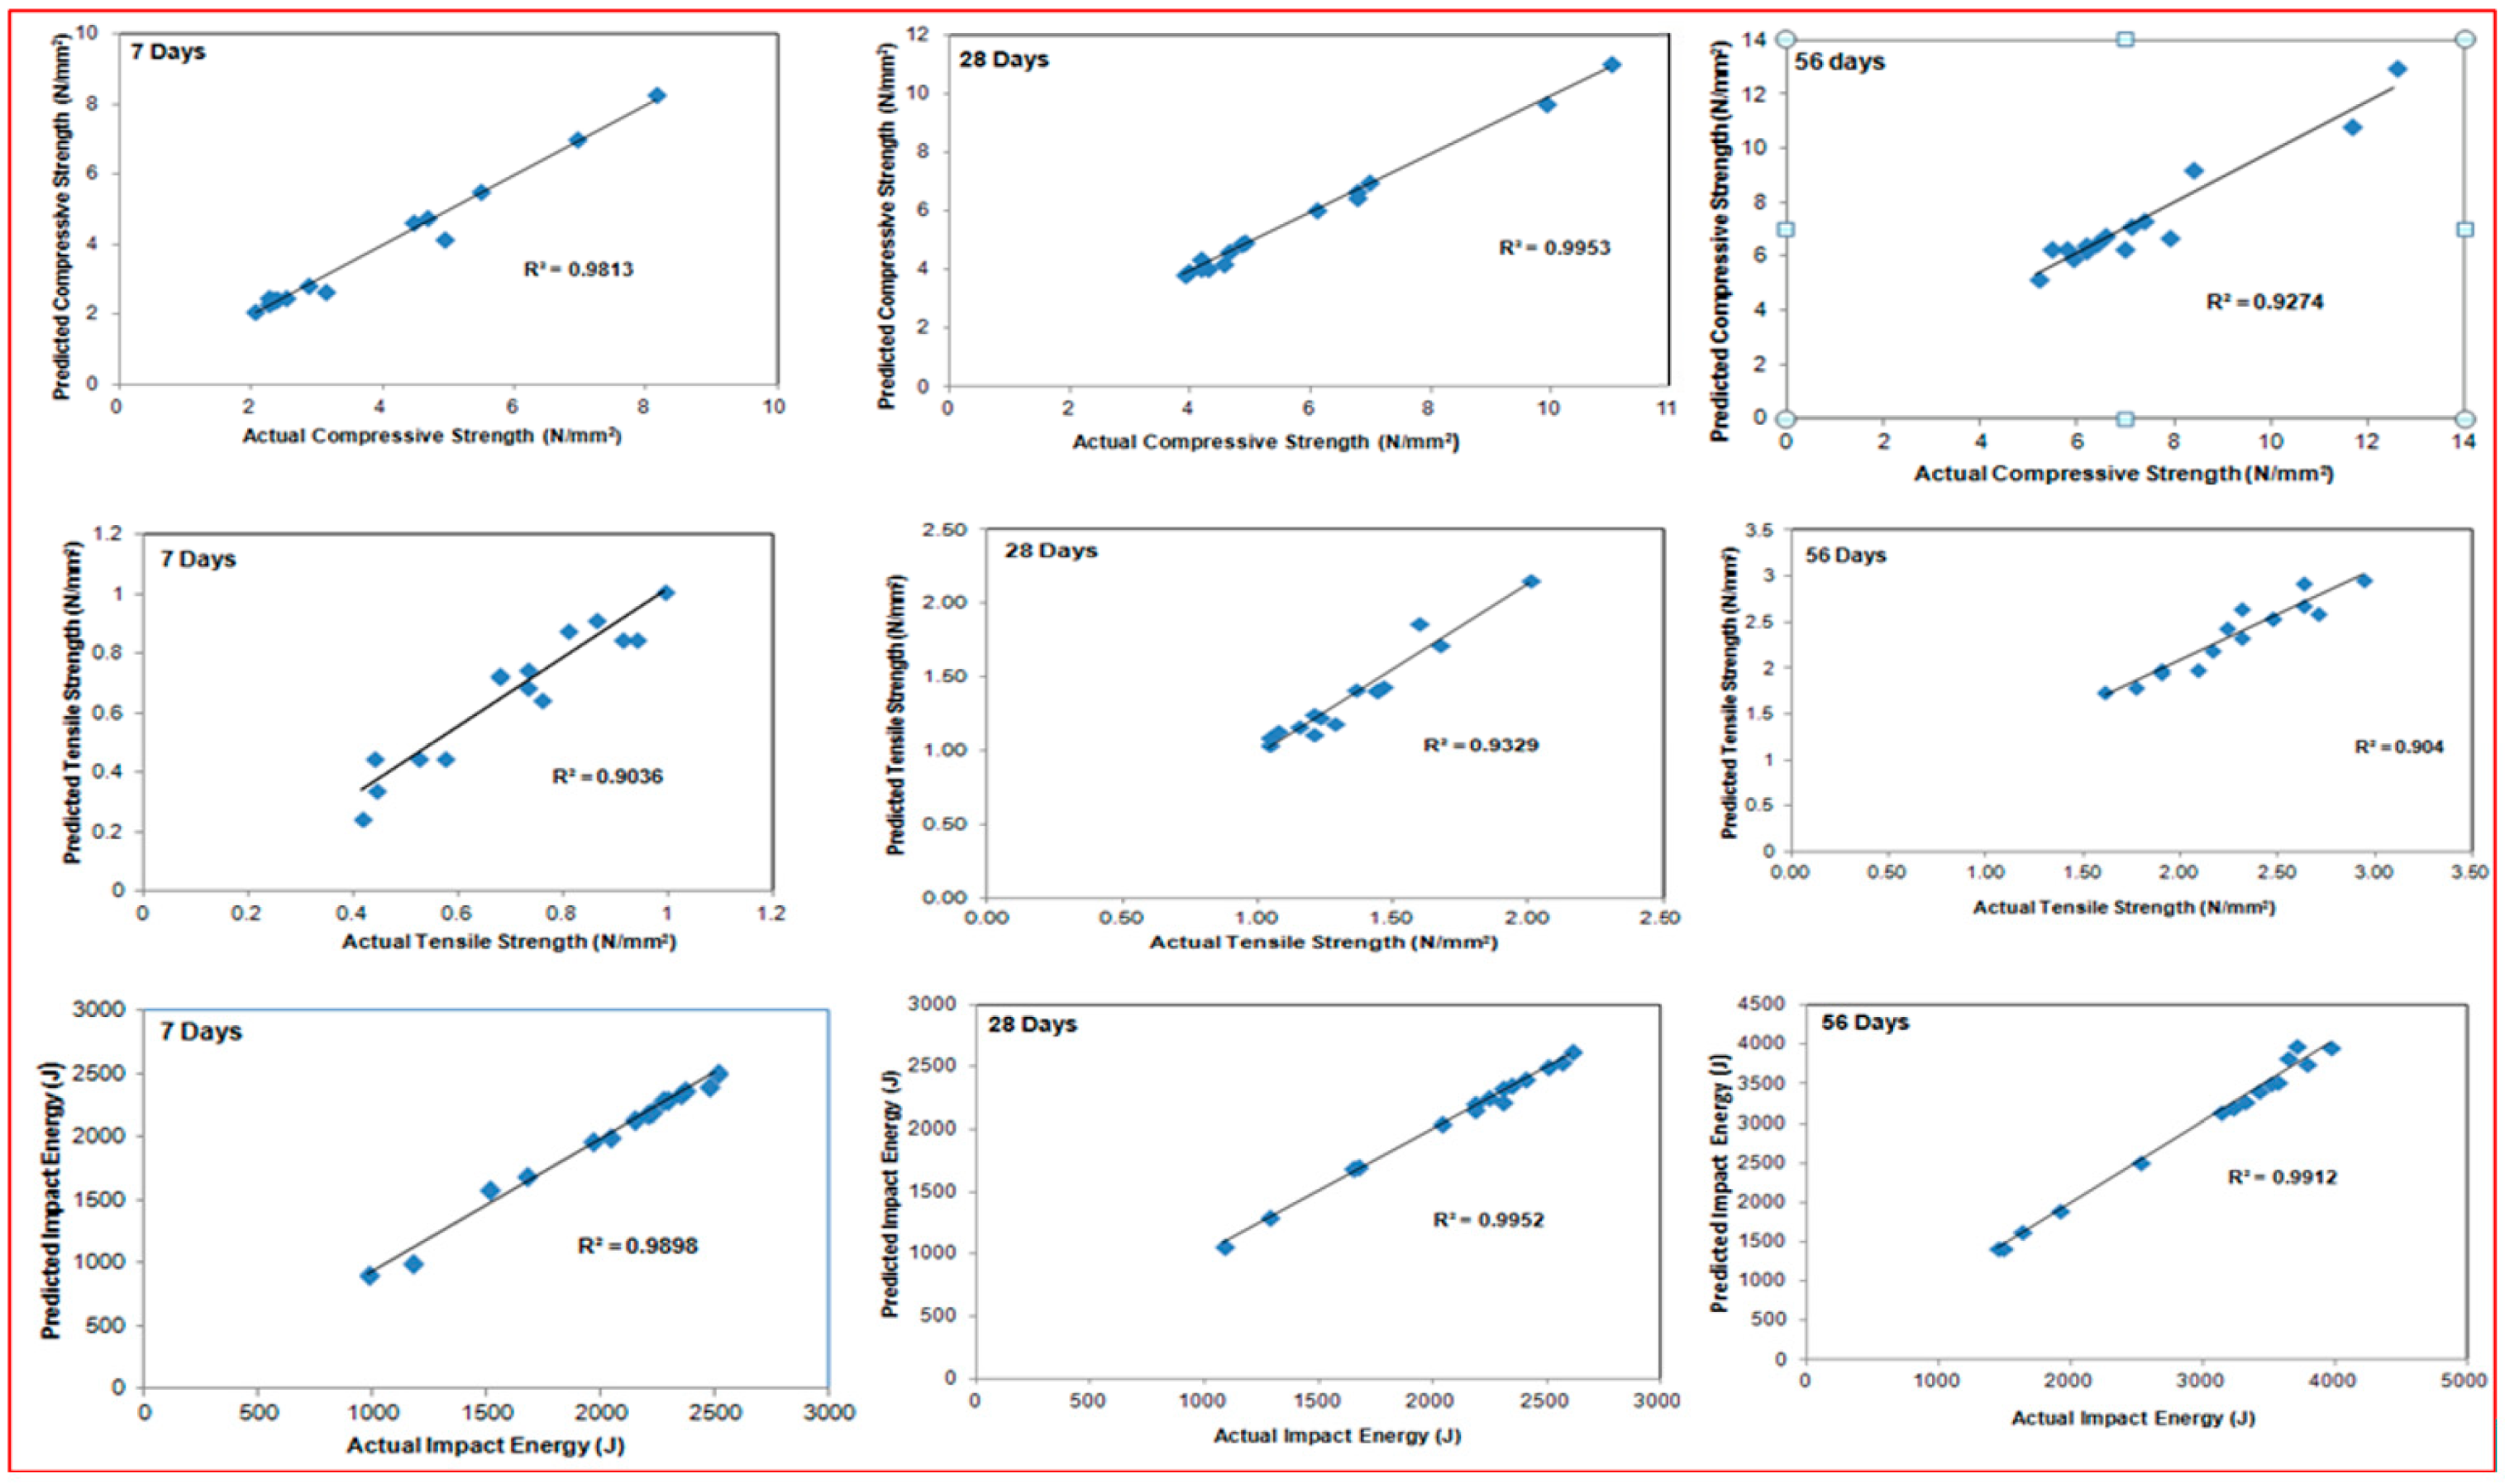
| R | 0.990 | 0.997 | 0.963 | 0.951 | 0.965 | 0.951 | 0.994 | 0.997 | 0.995 |
| R2 | 0.981 | 0.995 | 0.927 | 0.903 | 0.932 | 0.904 | 0.989 | 0.995 | 0.991 |
| RMSE | 0.255 | 0.150 | 0.562 | 0.080 | 0.092 | 0.146 | 54.750 | 31.280 | 94.230 |
| MAE | 0.152 | 0.118 | 0.410 | 0.069 | 0.065 | 0.112 | 34.215 | 23.810 | 46.860 |
| MAPE | 4.250 | 2.236 | 5.551 | 11.380 | 4.600 | 4.990 | 2.390 | 1.201 | 1.530 |
Disclaimer/Publisher’s Note: The statements, opinions and data contained in all publications are solely those of the individual author(s) and contributor(s) and not of MDPI and/or the editor(s). MDPI and/or the editor(s) disclaim responsibility for any injury to people or property resulting from any ideas, methods, instructions or products referred to in the content. |
© 2024 by the authors. Licensee MDPI, Basel, Switzerland. This article is an open access article distributed under the terms and conditions of the Creative Commons Attribution (CC BY) license (https://creativecommons.org/licenses/by/4.0/).
Share and Cite
Chandramouli, P.; Akthar, M.R.N.; Kumar, V.S.; Jayaseelan, R.; Pandulu, G. Neural Network Prediction and Enhanced Strength Properties of Natural Fibre-Reinforced Quaternary-Blended Composites. CivilEng 2024, 5, 827-851. https://doi.org/10.3390/civileng5040043
Chandramouli P, Akthar MRN, Kumar VS, Jayaseelan R, Pandulu G. Neural Network Prediction and Enhanced Strength Properties of Natural Fibre-Reinforced Quaternary-Blended Composites. CivilEng. 2024; 5(4):827-851. https://doi.org/10.3390/civileng5040043
Chicago/Turabian StyleChandramouli, Pavithra, Mohamed Riyaaz Nayum Akthar, Veerappan Sathish Kumar, Revathy Jayaseelan, and Gajalakshmi Pandulu. 2024. "Neural Network Prediction and Enhanced Strength Properties of Natural Fibre-Reinforced Quaternary-Blended Composites" CivilEng 5, no. 4: 827-851. https://doi.org/10.3390/civileng5040043