Article

Non-Contacting Plant Health Monitoring via Ultrasound in Ambient Air

1
Center for Agile and Adaptive Additive Manufacturing, University of North Texas, Denton, TX 76207, USA
2
Department of Materials Science and Engineering, University of North Texas, Denton, TX 76207, USA
*
Author to whom correspondence should be addressed.
Biophysica 2022, 2(4), 315-323; https://doi.org/10.3390/biophysica2040029
Submission received: 8 September 2022 / Revised: 15 September 2022 / Accepted: 20 September 2022 / Published: 27 September 2022

Abstract

:
In this work, we report a non-destructive and non-contacting ultrasound system with a novel air-coupled transducer to continuously monitor the drying process of prickly pear (nopal) pads in a lab environment. Compared with conventional imaging and spectroscopic methods or electrical-based approaches, ultrasound-based methods are non-invasive, cost-effective, and suitable for large volume evaluation. The time-dependent elastic modulus of the cactus can be obtained and monitored by using our proposed ultrasonic method. The evaluated elastic modulus behavior shows a good agreement with the destructive testing results in the existing literature. With further development, the proposed method can be used for in vivo plant health monitoring.

1. Introduction

With the rapidly growing global population, the demand for agricultural productivity has also increased. However, many obstacles negatively impact the yields due to climatic changes, such as extreme temperatures, drought, flooding, and soil degradation [1]. The increasing frequency, intensity, and spatial–temporal extent of extreme weather [2] events caused by climate change pose a significant threat to social–economical–ecological security [3]. For example, California is one of the most productive agricultural regions of the world, with more than 400 different farm products; this output is about 1/10 that of the entire United States [4]. However, the agriculture and water supply system of California has been challenged by the increased drought. Reports showed that the current drought is the most severe in almost 120 years of the instrumental record, and the situation is becoming worse [5]. Drought is the main reason for the shortage of grain production leading to food insecurity in recent years [6]. Therefore, sustainable agricultural approaches are urgent for modern practice. Remote sensing for plant health monitoring is one of the solutions to increase yields by constantly monitoring the water level, soil quality, harmful pathogens, and pests to efficiently use the irrigation water and agricultural chemical and maintain optimal plant growth [7]. The emerging technologies for in vivo plant health monitoring include genetic engineering technologies such as photosensors [8], imaging and spectroscopic methods such as polymerase chain reaction test (PCR) [9], enzyme-linked immunosorbent assay (ELISA) [10], thermography [11], fluorescent imaging [12], Raman spectroscopy [7], X-ray spectroscopy [13], and electrical-based approaches such as microneedle electrodes [14]. These techniques can provide a variety of helpful information; however, they are expensive, highly invasive, and require specific skills and facilities to analyze samples, limiting their usage.
By contrast, ultrasound techniques have been successfully used in the non-destructive testing (NDT) field since 1970 [15], their applications ranging from material defects and property evaluation [16,17,18,19] to human body diagnostics [20,21]. A coupling medium such as water is needed for conventional ultrasonic applications to overcome the high impedance mismatch between the transducer and the air [22]. However, for some applications, especially for monitoring, water or coupling gel is undesirable and impractical, which hinders the further development of ultrasound diagnostics [23]. Luckily, during the last decade, the use of air-coupled ultrasound techniques has extended beyond the laboratory, opening up more possibilities for testing. Here, we proposed an ultrasonic monitoring method, namely the dynamic elastic modulus distribution map (EBME) [24] in the configuration of monitoring [25,26], to constantly monitor the overall elastic modulus of the cactus as a proof of concept.
Ultrasound non-destructive tests are broadly applied in the industrial field for flaw detections [27] and elasticity evaluations [19,28]. The conventional ultrasonic elasticity evaluations are highly limited to the surface conditions and sample geometry of the sample for properly using the contacting configuration [29]. Variations in the sample surface conditions can result in deviations from the estimated values by introducing uncertainties in the time-of-flight measurements [30]. Furthermore, for testing soft matter, the commonly existing viscoelastic properties and high fluid volume fractions heavily impact the operating frequency selection and the feasibility of measuring the shear wave speed of sound [31,32]. As an alternative method, the proposed air-coupled non-contacting dynamic elastic modulus elastography, based on the effective acoustic impedance measurements, overcomes the abovementioned limitations of conventional methods, with the slightly lower sensitivity as a trade-off due to its long-operating acoustic wavelength.
The cactus is the most important crop in the desert and has gained considerable attention as an ornamental plant during the last decade for its ability to thrive in desert conditions and its easy maintenance. Cactus plants have distinct anatomical features such as high tissue suberization, narrow vessels, and air spaces within the root cortex tissue to cope with drought environments [33]. Owing to their low surface-to-volume ratio, cacti have stems that can absorb large amounts of water and are known as water reservoirs in the desert [34]. The leaves of cacti are reduced to spikes to limit water loss via transpiration, and their thick wall layer can further protect their stems from water loss. Another mechanism for cacti to adapt to arid conditions is that their stomata remain shut during the daytime and reopen during the night to exchange gases, which is a characteristic of those plants that use Crassulacean acid metabolism (also known as CAM photosynthesis) [35]. Prickly pear cactus (commonly known as nopal) is an important plant in the western United States and Mexico. The cladodes of prickly pear have been a nutritional source for centuries since they are rich in dietary fiber, minerals, vitamins, carbohydrates, etc., and even have medical usage [36]. Nevertheless, the cladodes are very perishable and have short storage life, only days under room temperature. Dehydration is a common alternative way to store and handle them. Therefore, we used a prickly pear (nopal) pad as an experiment specimen to monitor the drying process in a lab environment.

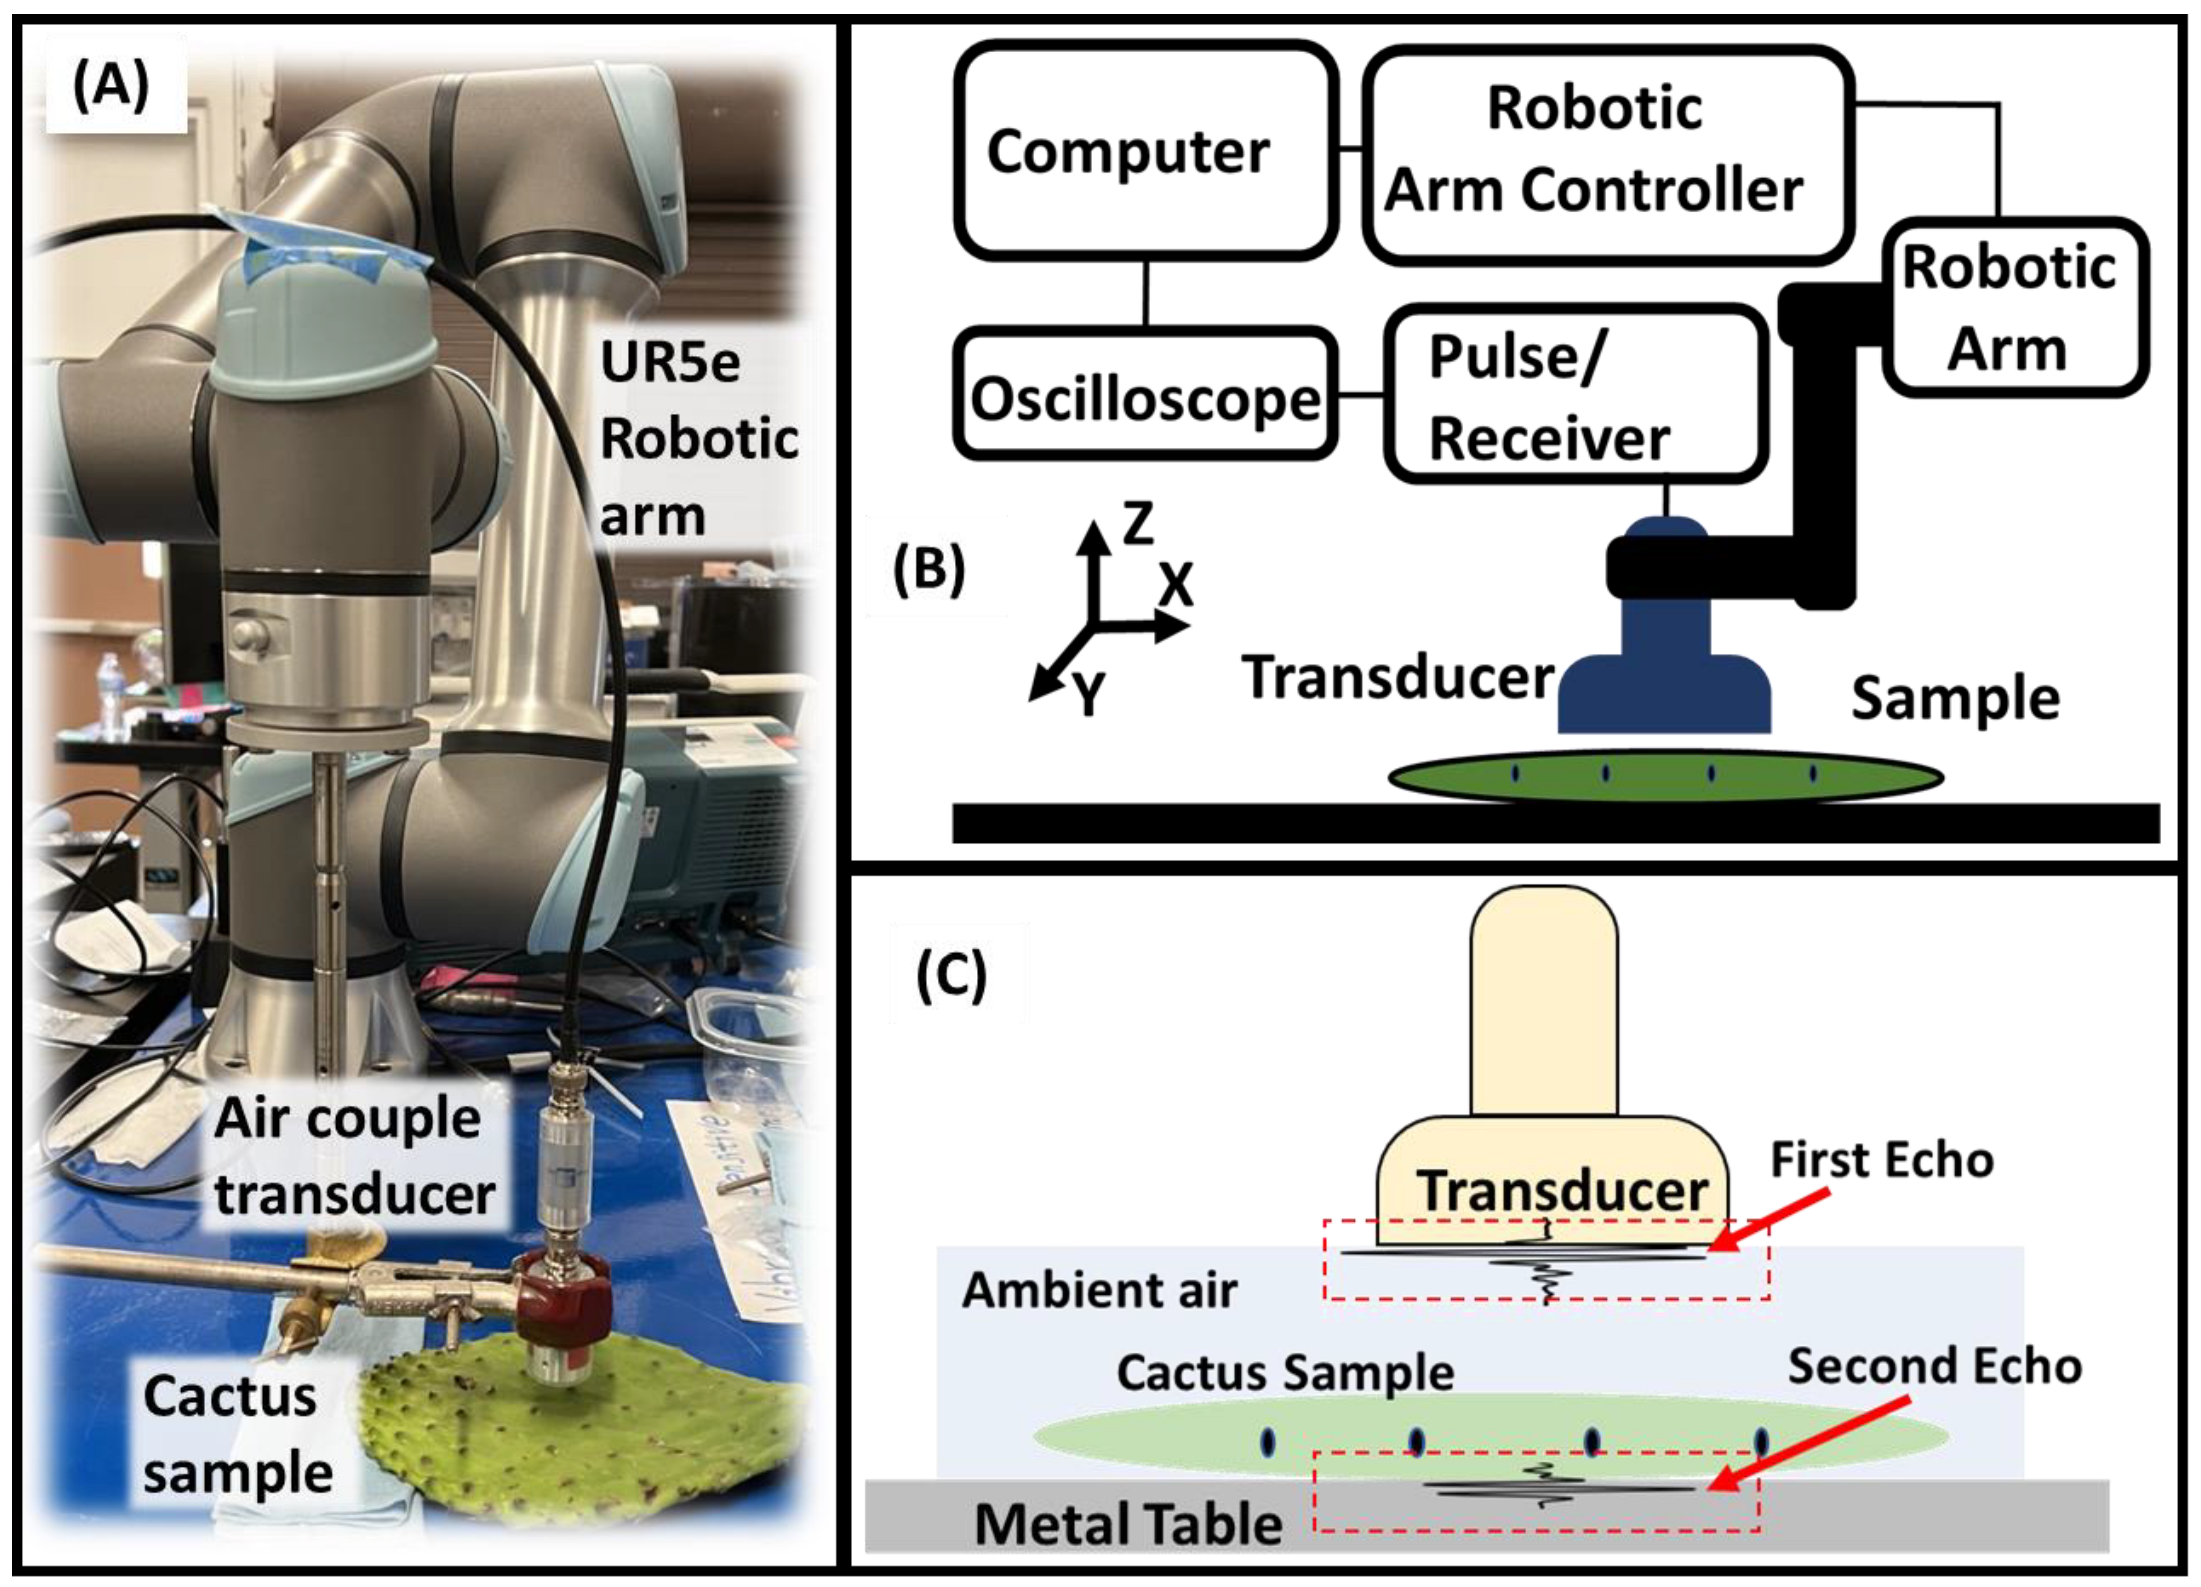
2. Materials and Methods
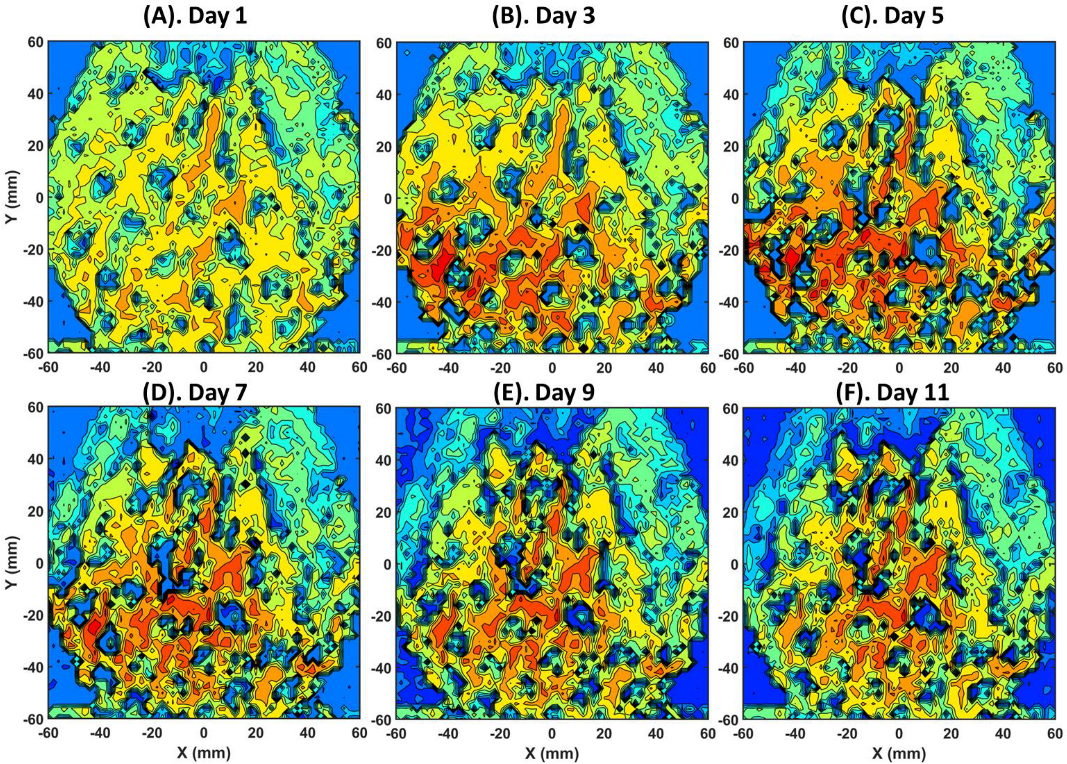
A prickly pear (nopal) pad bought from a MEXICO supermarket was used as the specimen in the monitoring experiment (Figure 1A). The schematic experimental setup is illustrated in Figure 1B. The ultrasound-based elastography (EBME) tests were performed under ambient air conditions at T = 20 °C and relative humidity of around 40–50%. A non-contacting transducer with a 1 MHz nominal frequency (NCT1-D25-P50) from the Ultran group (State College, PA, USA) was used to perform the experiment. The active diameter of the transducer is 25.5 mm with a 50 mm focal length (Figure 1B). The detail transducer information was posted in Table A1. A UR5e collaborative robotic arm from Universal Robots (Plano, TX, USA) was used to perform a raster scan with a predefined script from MATLAB 5.5 from Mathwork (Natick, MA, USA). A Imaginant JSR Ultrasonic DPR 500 Pulse/Receiver (Pittsford, NY, USA) operated the pulse source and time trigger. The detail setting on pulser was posted in Table A2. A Tektronix MDO 3024b oscilloscope (Dallas, TX, USA) was used to collect the data with a 1 GHz sampling rate. The scanned area was 120 mm by 120 mm with a 2 mm step interval. In order to monitor the water content, we analyzed the data every 2 days to compare the results with each other and observe the water loss for the cactus leaf.
Effective bulk modulus elastography is a new imaging technique that uses the acoustic impedance difference in a scanned sample and ambient conditions to demonstrate the effective bulk modulus and the effective density mapping, which are calculated based on the classical speed of sound theories as follows:
K = ρ c 2 = Z c
where K is the effective bulk modulus, ρ is the effective density, c   is the effective speed of sound obtained using the time delay between the first and second reflection from the measurement, and Z is the impedance.
The relationship between the impedance and the echoes are:
Z 1 Z 0 = 1 α 4 α + 1 α 2 ,       α = p 1 p e p 0
where Z 1 is the impedance mismatch between the table and the transducer, and Z 0 is the impedance mismatch between the air and the transducer. α is a dimensionless calculation factor; p e , p 0 , and p 1 are the sound pressure values of the emitted wave; the first echo occurred at the interface between the transducer surface and the ambient air; and the second echo traveled through the sample and reflected back at the upper surface from the metal table. The illustration of the measurement configuration is shown in Figure 1C. It should be noted that the illustrated locations of the reflection indicate the locations where the reflections were produced, not the locations where the echo was received.
In this study, the ambient air and the prickly pear sample were treated as the subjects in the whole experiment to avoid the influence of variations in temperature since an air-coupled transducer is very sensitive. The volume of matter between the air-coupled transducer and the metal table was measured as a homogenized material. The variation in the cactus’s physical properties contributed to the effective value, as indicated by the effective medium approximation. The proposed mechanism of scanning the cactus sample was based on the analysis of acoustic pulses between the first echo from the transducer and ambient air and the second echo reflected from the top surface of the table. With the speed of sound value obtained from time-of-flight methods and the impedance value obtained from the two echoes, the effective bulk modulus can be calculated based on the above equations. The major reason for using the entire volume under the transducer as the homogenized material was due to the slightly unstable mechanical properties of air due to its commonly occurring flows and temperature variations. The first echo was selected as the reflection that occurred due to an impedance mismatch between the ambient air and the air-coupled transducer, which can self-normalize the environmental influence of air during raster scans.

3. Results

For monitoring the physical conditions of the prickly pear (nopal) pad, we recorded the data every other day and plotted the data using effective bulk modulus elastography. The variation in the effective elastic modulus can be caused by dehydration hardening and tissue degradation processes, resulting in an increase or decrease in the measured effective elastic modulus values. The elastography data were translated into a uniform color scale from blue (low modules) to red (high modules). In the ultrasound scanned area, the internal structure [37] of the cactus was characterized by a net-like layout of vascular bundles [38], as shown in Figure 2A, which was expected to have a higher effective elastic modulus over the entire depth. During our time-dependent monitoring, the scanned area remained identical over different time points, thus allowing for a proper comparison. Different from the internal vascular bundles’ region, the outer boundary region of the cactus, the dermal tissue, is not equipped to hold as much water and fibrotic materials as the internal zone; thus, it was expected to have a lower effective elastic modulus and faster degradation behavior. In Figure 2B,C, the scanned area is highlighted by the red dash boxes on the photographs of the cactus. The selected scanning area included the vascular bundles, the dermal tissue, and the reference ambient regions for better contrast in the elastographic images.
Figure 3 presents the entire ultrasound monitoring process with 2 days as time intervals. The outer boundaries of the cactus sample can be observed in all the elastographic images with four corners of the ambient air regions. Figure 3A shows the cactus sample on the 1st day, which had the highest uniformity in terms of the effective elastic modulus. The central region of the cactus showed higher effective elastic modulus values with the presence of the spreading patterns, indicating the higher volume fraction of vascular bundles and water compared with that of the dermal tissue. Close to the boundary regions (around X = 40 and −40 mm, Y = 40 mm), the lower effective elastic modulus regions were indicative of a higher fraction of the dermal tissue. Figure 3B illustrates the elastographic image of day 3. A significant effective elastic modulus increase was observed in the central vascular bundles’ region due to dehydration hardening. Since the elastic modulus of water was lower than those of the vascular bundles and the dermal tissue, the decrease in water fraction effectively increased the fraction of the biomass, which induced an increase in the effective elastic modulus. On the boundary region of the cactus sample, the degradation in the dermal tissue was not clearly observed at this time point. In Figure 3C, comparing day 5 with day 3, the central region of the cactus experienced an increase in the elastic modulus due to continuous dehydration. On the boundary, a clear effective elastic modulus decrease was notable on the cactus due to tissue degradation, which induced a softening effect. From day 7, the dehydration-induced hardening effect almost stopped, as shown in Figure 3D. Hence, further tissue degradation induced a softening effect that started to introduce a lower effective elastic modulus over the entire cactus sample, especially on the boundary regions of the cactus sample. This time-dependent dehydration behavior estimated from the elastographic images relatively agreed with the almost exponential behavior described in the existing literature [39]. Figure 3E,F present the results of further ultrasound monitoring of the cactus sample on days 9 and 11; as expected, the hardening effect was not observed. The softening effect caused by tissue degradation was still significant from day 7 (Figure 3D) to day 9 (Figure 3E) in both central and boundary regions. Comparing day 9 (Figure 3E) to day 1 (Figure 3F), the difference between the elastographic images became more indistinguishable, which indicated a decrease in the rate of tissue degradation.
In summary, the entire ultrasonic elastography monitoring process showed the increasing and then decreasing behavior of the different regions in the cactus sample, with a higher volume fraction observed in the vascular bundles. Additionally, a continuous softening effect on the dermal tissue region was also observed. The time-dependent increasing and decreasing behavior in the mechanical properties of prickly cactus were previously found using destructive mechanical tests for the time points of 1 day, 4 days, and 8 days [40], showing a good agreement with our results. By using conventional testing methods, the time-dependent mapping of mechanical properties can be also realized via hardness mapping, but the values can only present the mechanical properties around the surface and subsurface regions, thus lacking penetration to deeper layers. By contrast, a bulk tensile or shear test can provide a study of mechanical behavior over the entire depth, but it is challenging to provide mechanical property distribution over the entire sample. Here, the proposed ultrasound elastography monitoring technique offers a well-balanced observation scale for plant monitoring applications.
Since a novel air-coupled transducer was used in the experiments rather than a traditional immersion transducer, the monitoring process was non-contacting and non-invasive, and no ambient fluid or coupling material was needed, making the ultrasound testing more convenient and flexible. The mapping was generated through a raster scan with a robotic arm using a predefined path to reveal the drying process of the cactus, which has a unique internal structure. The proposed method can also perform point measurements with a much faster monitoring rate. For the in situ monitoring of live plants, the same monostatic setup as that presented in this paper or a bistatic setup with a transmission test could be used depending on the plant leaves’ thickness and the plant type.
Comparing the pictures (Figure 2B,C) of the prickly pear pad on day 1 and day 11, no apparent differences could be observed between the two photographs, which indicates that the ultrasound-based monitoring system is very sensitive in terms of water-loss-induced hardening and tissue degradation. The air-coupled transducer can also be integrated with an acoustic metamaterial lens [41,42] or artificial intelligence techniques [43] to further enhance the resolution to the subwavelength scale. With the proposed setup and data processing method, the system can be used for plant health monitoring in vivo since it is a non-contacting and non-invasive technique.

Author Contributions

Conceptualization, A.N. and N.B.D.; methodology, Y.J. and T.Y.; software, T.Y.; validation, T.Y., A.N. and N.B.D.; formal analysis, Y.J.; investigation, Y.J.; resources, A.N.; data curation, Y.J.; writing—original draft preparation, Y.J.; writing—review and editing, T.Y., A.N. and N.B.D.; supervision, A.N.; project administration, A.N.; funding acquisition, N.B.D. All authors have read and agreed to the published version of the manuscript. A.N. was formerly at the University of North Texas.

Funding

The support from the infrastructure and support of the Center for Agile and Adaptive and Additive Manufacturing (CAAAM) funded through State of Texas Appropriation #190405-105-805008-220 is also gratefully acknowledged.

Institutional Review Board Statement

Not applicable.

Data Availability Statement

Data are available from the corresponding author.

Conflicts of Interest

The authors declare no conflict of interest.

Appendix A

Table A1. Transducer information from datasheet.
Model numberNCT 1.5-D13-P25
Active area13 mm diameter
Nominal frequency1.5 MHz
Bandwidth650–1.35 MHz
Focal length in air25 mm with sphere focal point
Amplitude0.85 V @ receiver
Pulse duration4.0 μs
Table A2. Experiment settings.
Low-pass filter5.0 MHz
High-pass filter0 MHz
Gain40 dB
Voltage400 V
Damping94.0 Ohms

References

  1. Sweet, S.K.; Wolfe, D.W.; DeGaetano, A.; Benner, R. Anatomy of the 2016 drought in the Northeastern United States: Implications for agriculture and water resources in humid climates. Agric. For. Meteorol. 2017, 247, 571–581. [Google Scholar] [CrossRef]
  2. Cogato, A.; Meggio, F.; De Antoni Migliorati, M.; Marinello, F. Extreme weather events in agriculture: A systematic review. Sustainability 2019, 11, 2547. [Google Scholar] [CrossRef]
  3. West, H.; Quinn, N.; Horswell, M. Remote sensing for drought monitoring & impact assessment: Progress, past challenges and future opportunities. Remote Sens. Environ. 2019, 232, 111291. [Google Scholar]
  4. Cooley, H.; Donnelly, K.; Phurisamban, R.; Subramanian, M. Impacts of California’s Ongoing Drought: Agriculture; Pacific Institute: Oakland, CA, USA, 2015. [Google Scholar]
  5. Medellín-Azuara, J.; MacEwan, D.; Howitt, R.E.; Sumner, D.A.; Lund, J.R.; Scheer, J.; Gailey, R.; Hart, Q.; Alexander, N.D.; Arnold, B.; et al. Economic Analysis of the 2016 California Drought on Agriculture; Center for Watershed Sciences, University of California: Davis, CA, USA, 2016. [Google Scholar]
  6. Kogan, F.; Guo, W.; Yang, W. Drought and food security prediction from NOAA new generation of operational satellites. Geomat. Nat. Hazards Risk 2019, 10, 651–666. [Google Scholar] [CrossRef]
  7. Roper, J.M.; Garcia, J.F.; Tsutsui, H. Emerging technologies for monitoring plant health in vivo. ACS omega 2021, 6, 5101–5107. [Google Scholar] [CrossRef]
  8. Liu, W.; Stewart Jr, C.N. Plant synthetic biology. Trends Plant Sci. 2015, 20, 309–317. [Google Scholar] [CrossRef] [PubMed]
  9. Alemu, K. Real-time PCR and its application in plant disease diagnostics. Adv. Life Sci. Technol. 2014, 27, 39–49. [Google Scholar]
  10. Pastorelli, A.A.; Blasi, E.; Giammarioli, S.; Silano, M.; Stacchini, P.; Boniglia, C. Presence of soy in cereals and cereal products: Validation of an ELISA technique and monitoring of products from the Italian market. J. Consum. Prot. Food Saf. 2021, 16, 315–321. [Google Scholar] [CrossRef]
  11. Costa, J.M.; Grant, O.M.; Chaves, M.M. Thermography to explore plant–environment interactions. J. Exp. Bot. 2013, 64, 3937–3949. [Google Scholar] [CrossRef]
  12. Chaerle, L.; Van Der Straeten, D. Seeing is believing: Imaging techniques to monitor plant health. Biochim. Biophys. Acta (BBA)-Gene Struct. Expr. 2001, 1519, 153–166. [Google Scholar] [CrossRef]
  13. Farber, C.; Mahnke, M.; Sanchez, L.; Kurouski, D. Advanced spectroscopic techniques for plant disease diagnostics. A review. TrAC Trends Anal. Chem. 2019, 118, 43–49. [Google Scholar] [CrossRef]
  14. Jeon, E.; Choi, S.; Yeo, K.-H.; Park, K.S.; Rathod, M.L.; Lee, J. Development of electrical conductivity measurement technology for key plant physiological information using microneedle sensor. J. Micromech. Microeng. 2017, 27, 085009. [Google Scholar] [CrossRef]
  15. Gallego-Juárez, J.A. Ultrasound in Food Processing: Recent Advances; Wiley: Hoboken, NJ, USA, 2017. [Google Scholar] [CrossRef]
  16. Petcher, P.A.; Dixon, S. Weld defect detection using PPM EMAT generated shear horizontal ultrasound. NDT E Int. 2015, 74, 58–65. [Google Scholar] [CrossRef]
  17. Jin, Y.; Yang, T.; Heo, H.; Krokhin, A.; Shi, S.Q.; Dahotre, N.; Choi, T.-Y.; Neogi, A. Novel 2D dynamic elasticity maps for inspection of anisotropic properties in fused deposition modeling objects. Polymers 2020, 12, 1966. [Google Scholar] [CrossRef] [PubMed]
  18. Yang, T.; Mazumder, S.; Jin, Y.; Squires, B.; Sofield, M.; Pantawane, M.V.; Dahotre, N.B.; Neogi, A. A review of diagnostics methodologies for metal additive manufacturing processes and products. Materials 2021, 14, 4929. [Google Scholar] [CrossRef] [PubMed]
  19. Pantawane, M.V.; Yang, T.; Jin, Y.; Joshi, S.S.; Dasari, S.; Sharma, A.; Krokhin, A.E.A. Crystallographic texture dependent bulk anisotropic elastic response of additively manufactured Ti6Al4V. Sci. Rep. 2021, 11, 633. [Google Scholar] [CrossRef] [PubMed]
  20. Ritter, T.A.; Shrout, T.R.; Tutwiler, R.; Shung, K.K. A 30-MHz piezo-composite ultrasound array for medical imaging applications. IEEE Trans. Ultrason. Ferroelectr. Freq. Control 2002, 49, 217–230. [Google Scholar] [CrossRef] [PubMed]
  21. Saini, K.; Dewal, M.L.; Rohit, M. Ultrasound imaging and image segmentation in the area of ultrasound: A review. Int. J. Adv. Sci. Technol. 2010, 24. [Google Scholar]
  22. Blomme, E.; Bulcaen, D.; Declercq, F. Air-coupled ultrasonic NDE: Experiments in the frequency range 750 kHz–2 MHz. NDT E Int. 2002, 35, 417–426. [Google Scholar] [CrossRef]
  23. Chimenti, D.E. Review of air-coupled ultrasonic materials characterization. Ultrasonics 2014, 54, 1804–1816. [Google Scholar] [CrossRef]
  24. Jin, Y.; Walker, E.; Krokhin, A.; Heo, H.; Choi, T.-Y.; Neogi, A. Enhanced Instantaneous Elastography in Tissues and Hard Materials Using Bulk Modulus and Density Determined without Externally Applied Material Deformation. IEEE Trans. Ultrason. Ferroelectr. Freq. Control 2019, 67, 624–634. [Google Scholar] [CrossRef] [PubMed]
  25. Neogi, A.; Jin, Y.; Yang, T. Ltrasonic Sensor Based In-Situ Diagnostics for at Least One of Additive Manufacturing and 3D Printers. U.S. Patent 17/677,592, 25 August 2022. [Google Scholar]
  26. Yang, T.; Jin, Y.; Squires, B.; Choi, T.-Y.; Dahotre, N.B.; Neogi, A. In-situ monitoring and ex-situ elasticity mapping of laser induced metal melting pool using ultrasound: Numerical and experimental approaches. J. Manuf. Process. 2021, 71, 178. [Google Scholar] [CrossRef]
  27. Essig, W.; Bernhardt, Y.; Döring, D.; Solodov, I.; Gautzsch, T.; Gaal, M.; Hufschläger, D. Air-coupled Ultrasound–Emerging NDT Method. Fachbeiträge 2021, 1, 32. [Google Scholar]
  28. Pantawane, M.V.; Yang, T.; Jin, Y.; Mazumder, S.; Pole, M.; Dasari, S.; Krokhin, A.; Neogi, A.; Mukherjee, S.; Banerjee, R.; et al. Thermomechanically Influenced Dynamic Elastic Constants of Laser Powder Bed Fusion Additively Manufactured Ti6Al4V. Mater. Sci. Eng. A 2021, 811, 140990. [Google Scholar] [CrossRef]
  29. Tevet, O.; Svetlizky, D.; Harel, D.; Barkay, Z.; Geva, D.; Eliaz, N. Measurement of the anisotropic dynamic elastic constants of additive manufactured and wrought Ti6Al4V alloys. Materials 2022, 15, 638. [Google Scholar] [CrossRef] [PubMed]
  30. Xia, N.; Zhao, P.; Zhang, J.; Xie, J.; Zhang, C.; Fu, J. Investigation of ultrasound velocity measurements of polymeric parts with different surface roughness. Polym. Test. 2020, 81, 106231. [Google Scholar] [CrossRef]
  31. Jin, Y.; Heo, H.; Walker, E.; Krokhin, A.; Choi, T.Y.; Neogi, A. The effects of temperature and frequency dispersion on sound speed in bulk poly (Vinyl Alcohol) poly (N-isopropylacrylamide) hydrogels caused by the phase transition. Ultrasonics 2020, 104, 105931. [Google Scholar] [CrossRef] [PubMed]
  32. Jin, Y.; Yang, T.; Ju, S.; Zhang, H.; Choi, T.-Y.; Neogi, A. Thermally Tunable Dynamic and Static Elastic Properties of Hydrogel Due to Volumetric Phase Transition. Polymers 2020, 12, 1462. [Google Scholar] [CrossRef] [PubMed]
  33. Kirschner, G.K.; Xiao, T.T.; Blilou, I. Rooting in the desert: A developmental overview on desert plants. Genes 2021, 12, 709. [Google Scholar] [CrossRef]
  34. Gibson, A.C. Photosynthetic organs of desert plants. Bioscience 1998, 48, 911–920. [Google Scholar] [CrossRef]
  35. Lüttge, U. Ability of crassulacean acid metabolism plants to overcome interacting stresses in tropical environments. AoB Plants 2010, 2010, plq005. [Google Scholar] [CrossRef] [PubMed]
  36. López, R.A.; Ita, D.; Vaca, M. Drying of prickly pear cactus cladodes ((Opuntia ficus indica) in a forced convection tunnel. Energy Convers. Manag. 2009, 50, 2119–2126. [Google Scholar] [CrossRef]
  37. Gibson, A.C.; Nobel, P.S. The Cactus Primer; Harvard University Press: Cambridge, MA, USA, 1986. [Google Scholar]
  38. Mylo, M.D.; Hesse, L.; Masselter, T.; Leupold, J.; Drozella, K.; Speck, T.; Speck, O. Morphology and anatomy of branch–branch junctions in Opuntia ficus-indica and Cylindropuntia bigelovii: A comparative study supported by mechanical tissue quantification. Plants 2021, 10, 2313. [Google Scholar] [CrossRef] [PubMed]
  39. Kamal, T.; Ul-Islam, M.; Khan, S.B.; Bakhsh, E.M.; Chani, M.T.S. Preparation, Characterization, and Biological Features of Cactus Coated Bacterial Cellulose Hydrogels. Gels 2022, 8, 88. [Google Scholar] [CrossRef] [PubMed]
  40. Rodrigues, S.; dos Santos, D.P.; Machado Enes, A.; Sobrinha, M.N.A.B.; Gazzola, J.; Dal Fabbro, I.M. Mechanical Properties Characterization of Spineless Cactus (Opuntia FiCus-Indica). Int. J. Sci. Eng. Investig. 2015, 4, 1. [Google Scholar]
  41. Yang, T.; Jin, Y.; Choi, T.-Y.; Dahotre, N.; Neogi, A. Mechanically tunable ultrasonic metamaterial lens with a subwavelength resolution at long working distances for bioimaging. Smart Mater. Struct. 2020, 30, 015022. [Google Scholar] [CrossRef]
  42. Walker, E.L.; Jin, Y.; Reyes, D.; Neogi, A. Sub-wavelength lateral detection of tissue-approximating masses using an ultrasonic metamaterial lens. Nat. Commun. 2020, 11, 5967. [Google Scholar] [CrossRef]
  43. Jin, Y.; Wang, X.; Fox, E.A.; Xie, Z.; Neogi, A.; Mishra, R.S.; Wang, T. Numerically Trained Ultrasound AI for Monitoring Tool Degradation. Adv. Intell. Syst. 2022, 4, 2100215. [Google Scholar] [CrossRef]
Figure 1. (A) The overall experiment setup: a UR-5 robotic arm was used to hold the air-coupled transducer and perform the scan. The scan area and scan path were controlled via MATLAB script. A prickly pear (nopal) pad bought from a MEXICO supermarket was used as specimen and placed in a lab environment at temperature T 0 = 20 °C and relative humidity around 4–50%; (B) schematic picture of all the components, including computer, robotic arm controller, robotic arm, oscilloscope, pulse/receiver, and an air-coupled transducer; (C) the elaboration of the measurement configuration. The volume of matter between the air-coupled transducer and the metal table was measured as a homogenized material. The variation in the cactus’s physical properties contributed to the effective value, as indicated by the effective medium approximation.
Biophysica 02 00029 g001
Figure 2. MRI scans of Opuntia ficus-indica (prickly pear) from reference [38]: (A1) overview scan includes vascular system (blue), dermal tissue (transparent green), and peridermal tissue (orange). The web-like structure of the vascular is clearly shown in the figure; (A2) surface coil scan with dermal tissue; (A3) surface coil scan without dermal tissue; (B,C) photographs of the scanned cactus sample at the start of the monitoring (day 1) and end of monitoring (day 11), with the red boxes indicating the EBME scanned areas on the sample.
Biophysica 02 00029 g002
Figure 3. Time-dependent cactus sample monitoring in terms of effective bulk modulus. The color scales of elastographic images are under normal uniform normalized scale with the normalization factor 3.4 GPa: (AF) scans on day 1 to day 11 with 2-day intervals.
Biophysica 02 00029 g003
Publisher’s Note: MDPI stays neutral with regard to jurisdictional claims in published maps and institutional affiliations.

