1. Introduction
The remote sensing of health condition is fundamental to monitoring patients’ improvements during rehabilitation and therapy [
1]. Moreover, during the COVID-19 pandemic, several solutions have been proposed in order to remotely assess the vital signs and the clinical conditions of patients to avoid contagions [
2]. Furthermore, the contactless monitoring of the emotional and autonomic conditions of individuals during several tasks, such as working and driving, could help improve the human safety and well-being. Among the physiological signals, the heart rate (HR) could be suggestive of both the clinical condition and emotional state of the subject [
3]. Particularly, several contactless methods for HR estimation based on a visible camera have been proposed [
4]. However, poor illumination conditions could be detrimental to these methods. A valuable tool to that could help overcome this limitation could be the infrared thermography (IRT), which is a non-invasive, contactless and low-cost technology that passively measures the radiation of a body, providing information on its superficial temperature [
5]. Facial IRT could provide insight on the human autonomic activity through the evaluation of the temperature time course and spatial patterns [
6]. Recently, machine learning (ML)-based approaches have been employed for IRT data analysis to increase the capability of this technology in assessing pathologies and to improve emotion recognition for human–machine interaction [
7,
8].
This work aims to investigate the possibility of estimating the average HR from facial IRT through an ML framework. Specifically, a Support Vector Regression (SVR) was implemented to estimate the average HR from features evaluated on the temperature time course of facial ROIs.
2. Material and Methods
2.1. Experimental Procedure and Data Acquisition
The experimental session involved 24 healthy volunteers (16 women and 8 men, age = 51.46
7.68 years). Participants were requested to perform a breathing task sitting down in front of a computer. The rate and the intensity of the breathing was modulated by a visual stimulus. The esperimental session lasted 1 min. During the breathing task, the RR intervals were recorded using a photopletismographic (PPG) sensor (emWave Pro Plus, HeartMath, Inc., Boulder Creek, CA, United States) positioned on the fingertip of the subjects’ left hand. The sample frequency was 370 Hz. The facial temperature was recorded by means of a digital thermal infrared camera FLIR SC660 (FLIR, Wilsonville, OR, USA) (640 × 480 bolometer FPA, sensitivity/noise equivalent temperature difference: <30 mK @ 30 °C, field of view: 24° × 18°). The IRT device pointed toward the face of the subject, at a distance of 60 cm. The sample frequency was 10 Hz. The camera was blackbody-calibrated, in order to remove eventual drift/shift of the sensor’s response and optical artifacts. The acquisitions were performed in accordance with the standard guidelines for thermal measurements [
9].
2.2. Data Preprocessing
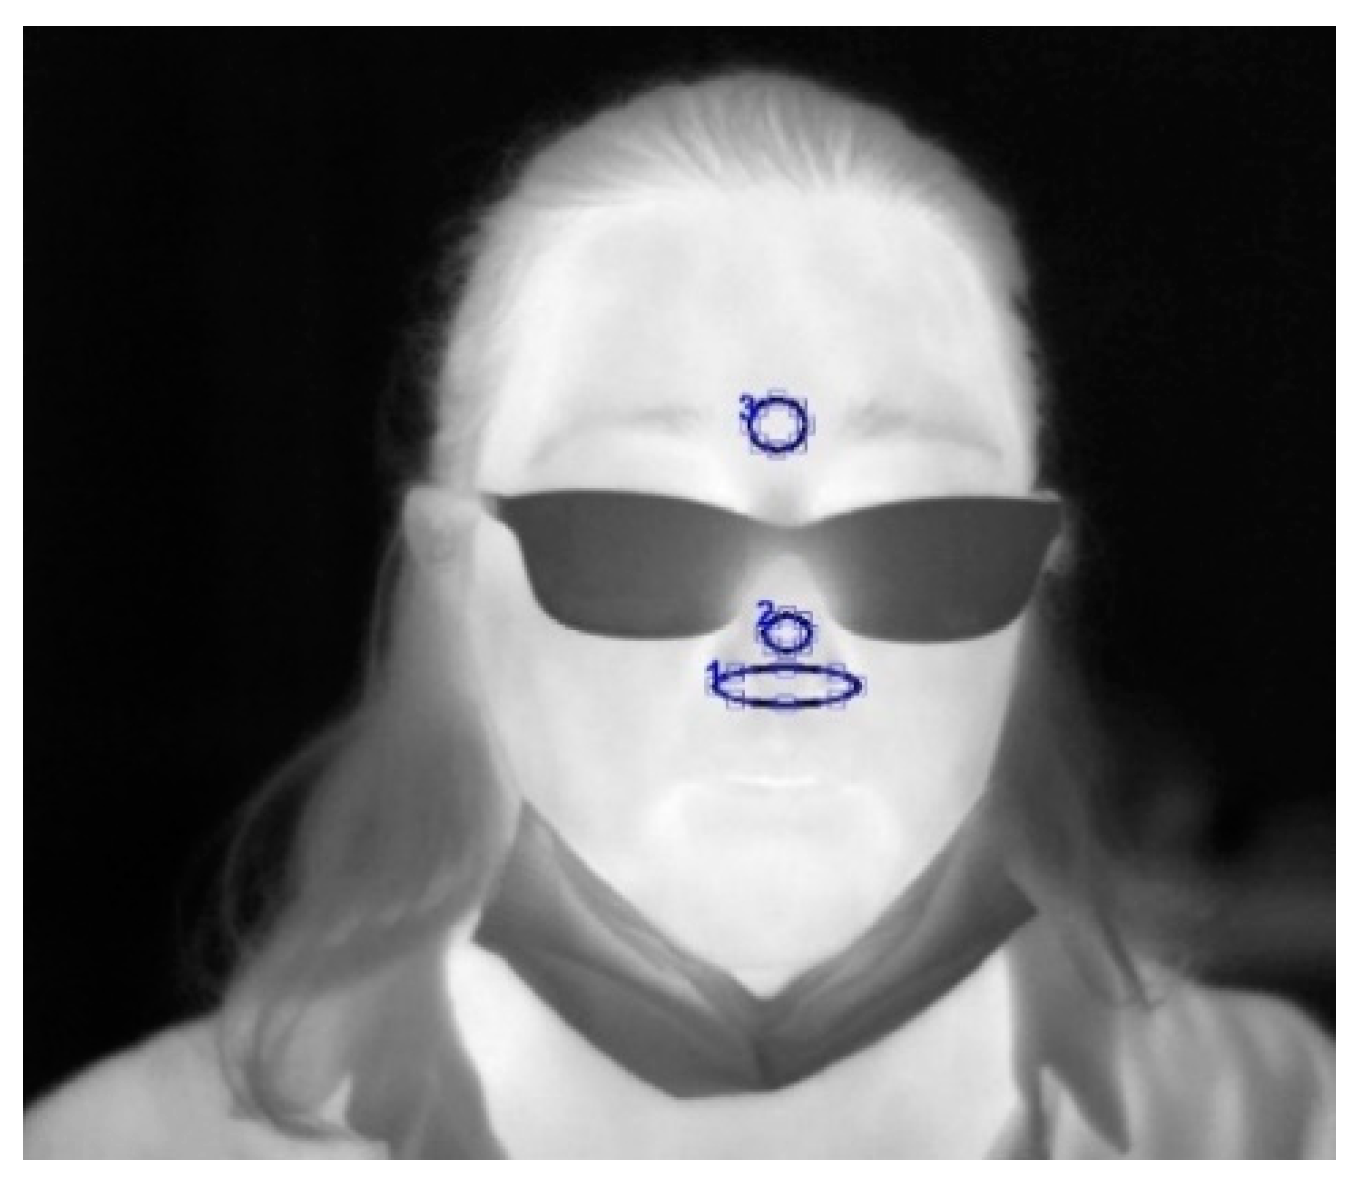
Concerning the PPG signal, the cut-off frequencies were set at 0.2 and 10 Hz. The PPG peaks were idenfied on filtered and normalized (z-score) signals. The procedure provided an excellent automatic peak identification without the need of any manual correction after visual inspection. The PPG peaks were used to evaluate the average HR during the 1 min recording. The quality of IRT signals was checked by visual inspection. No video was rejected. Three ROIs were selected on the nostrils, the nose tip and glabella. (
Figure 1). The temperature time course over the ROIs was obtained by applying a tracking algorithm [
10]. From each ROIs, several features were computed: mean value, standard deviation, kurtosis, skewness, difference between the average of the first and last 5 s of the acquisition, sample entropy, the power at the respiratory, cardiac and myogenic frequency bands.
2.3. Machine Learning Procedure
A regression based on SVM was implemented using a linear kernel. The input of the models was constituted by the thermal features extracted from the different ROIs, and the output was the HR evaluated from PPG. Of note, the metrics were normalized (z-score). Since the number of predictors (i.e., number of ROIs × number of features, 27) was higher then the number of participants (i.e., 24), a subset of the features was considered after a features selection procedure based on the wrapper method [
11]. Specifically, the standard deviation, kurtosis and sample entropy from the nostrils and glabella, and the skeweness and power of the respiratory band from the nose tip, were employed as regressors. A leave-one-out cross-validation was implemented to reduce the overfitting effect and to test the generalization capabilities of the model. The performance of the model was evaluated by correlation analysis, a Bland–Altman plot and paired
t-test.
3. Results and Discussion
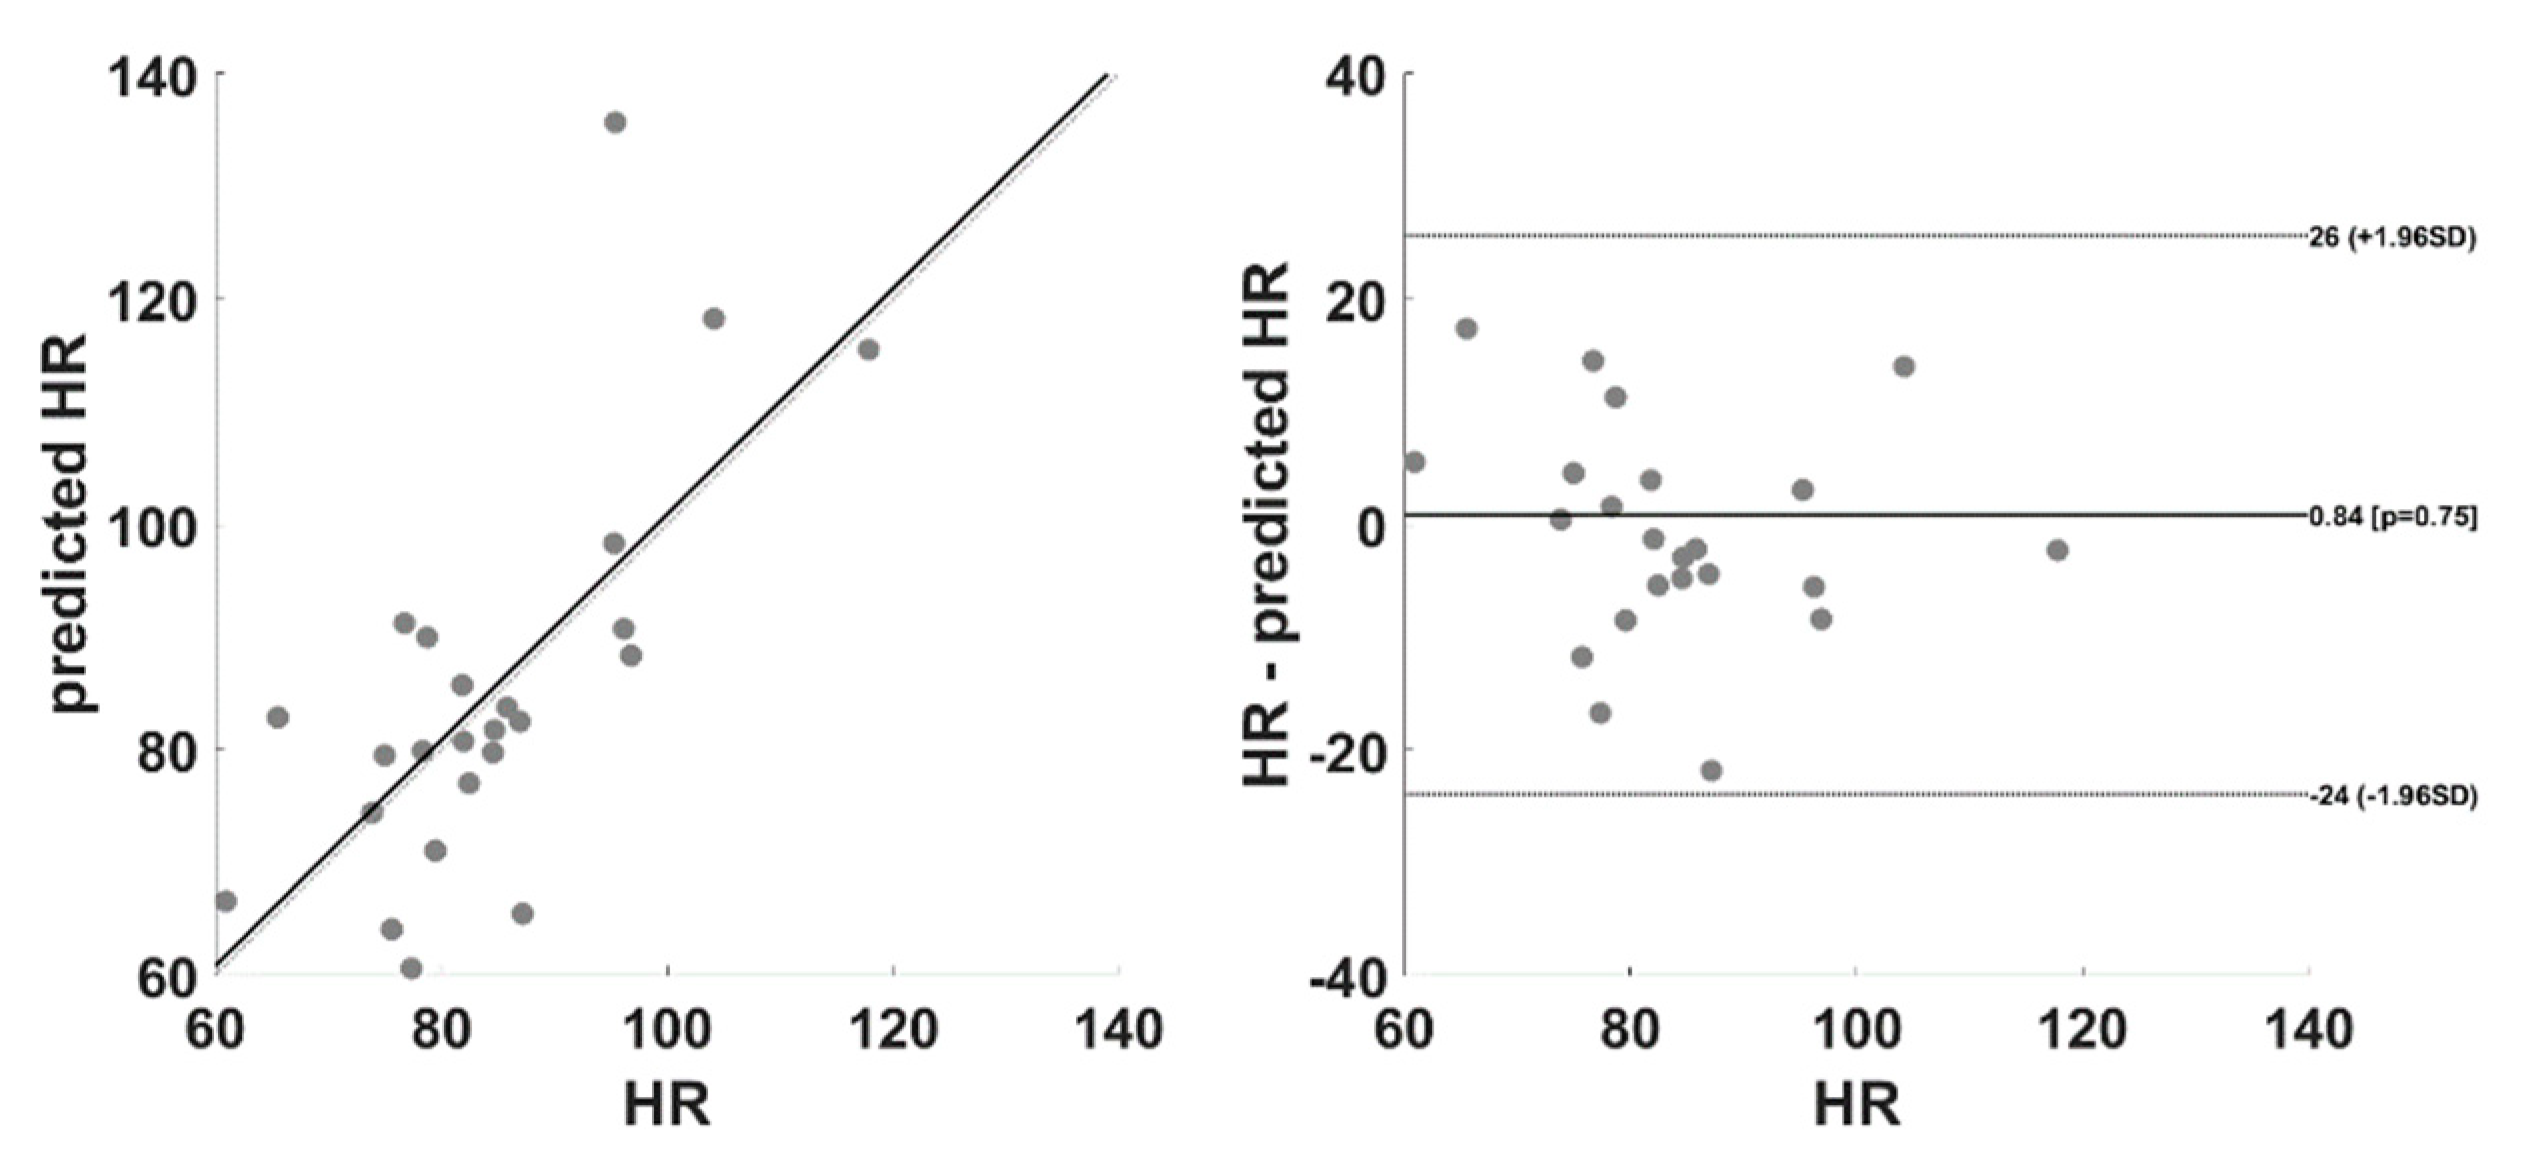
Figure 2 reports the correlation and Bland–Altman plot obtained by comparing the measured HR with the cross-validated output of the model.
The correlation coefficient was 0.70 (p < 0.001), and the paired t-test did not assess significant differences between the measured and predicted HR (t = −0.33; d.f. = 23; p = 0.75).
The results demonstrate the feasibility of employing IRT to evaluate average HR in a contactless manner. The advantage of employing such a technology to monitor HR relies on the possibility of concurrently evaluating several physiological signals (e.g., breathing rate, facial temperature, sweat glands activity). IRT could indeed be used for remote sensing in clinical applications, as well as to monitor the human well-being, stress and emotional state for different purposes (e.g., automotive, workplace).
The limitation of this work is the reduced number of participants. However, it is worth highlighting that the cross-validation procedure implemented allowed us to test the generalization performance of the model. Moreover, an increment of the sample size could deliver more accurate results and could allow us to test the performances of more complex machineries, such as deep learning. Moreover, the ML framework proposed is able to estimate the average HR over a temporal window of 1 min. Further studies are indeed necessary to investigate the possibility to assess the HR in smaller temporal windows or to predict the pulse signal itself. The latter could be fundamental to estimating heart rate variability (HRV) metrics through IRT.
4. Conclusions
The paper proposed an innovative model based on SVR to estimate the HR from IRT. The model was tested through correlation, the Bland–Altman plot and paired t-test. Although preliminary, these results could pave the way for the employment of IRT for HR and HRV assessment.
Author Contributions
Conceptualization, P.I., B.G. and A.D.B.; methodology, D.P., C.F., D.C. and P.C.; software, D.P. and A.D.C.; validation, D.P. and A.D.C.; formal analysis, D.P., A.D.C., C.F., D.C. and P.C.; investigation, D.P., A.D.C., C.F., D.C. and P.I.; resources, B.G., A.D.B. and A.M.; data curation, D.P. and A.D.C.; writing—original draft preparation, D.P.; writing—review and editing, D.P. and A.D.C.; visualization, D.P. and A.D.C.; supervision, B.G., A.D.B. and A.M.; project administration, B.G. and A.D.B.; funding acquisition, B.G. and A.D.B. All authors have read and agreed to the published version of the manuscript.
Funding
This research received no external funding.
Institutional Review Board Statement
The study was conducted according to the guidelines of the Declaration of Helsinki and approved by the Research Ethics Committee of the University G. D’Annunzio of Chieti-Pescara, Italy (protocol code: 2077, date of approval: 14 May 2020).
Informed Consent Statement
Informed consent was obtained from all subjects involved in the study.
Data Availability Statement
The data presented in this study are available on request from the corresponding author. The data are not publicly available due to privacy issues.
Conflicts of Interest
The authors declare no conflict of interest.
References
- Ruiz-Fernández, D.; Marcos-Jorquera, D.; Gilart-Iglesias, V.; Vives-Boix, V.; Ramírez-Navarro, J. Empowerment of Patients with Hypertension through BPM, IoT and Remote Sensing. Sensors 2017, 17, 2273. [Google Scholar] [CrossRef] [PubMed] [Green Version]
- Perpetuini, D.; Filippini, C.; Cardone, D.; Merla, A. An Overview of Thermal Infrared Imaging-Based Screenings during Pandemic Emergencies. Int. J. Environ. Res. Public Health 2021, 18, 3286. [Google Scholar] [CrossRef] [PubMed]
- Wascher, C. Heart Rate as a Measure of Emotional Arousal in Evolutionary Biology. Philos. Trans. R. Soc. B Biol. Sci. 2021, 376. [Google Scholar] [CrossRef] [PubMed]
- Blöcher, T.; Schneider, J.; Schinle, M.; Stork, W. An Online PPGI Approach for Camera Based Heart Rate Monitoring Using Beat-to-Beat Detection. In Proceedings of the 2017 IEEE Sensors Applications Symposium (SAS), Glassboro, NJ, USA, 13–15 March 2017; pp. 1–6. [Google Scholar]
- Vardasca, R.; Simoes, R. Current issues in medical thermography. In Topics in Medical Image Processing and Computational Vision; Springer: Dordrecht, The Netherlands, 2013; pp. 223–237. [Google Scholar]
- Ioannou, S.; Gallese, V.; Merla, A. Thermal Infrared Imaging in Psychophysiology: Potentialities and Limits. Psychophysiology 2014, 51, 951–963. [Google Scholar] [CrossRef] [PubMed] [Green Version]
- Magalhaes, C.; Mendes, J.; Vardasca, R. Meta-Analysis and Systematic Review of the Application of Machine Learning Classifiers in Biomedical Applications of Infrared Thermography. Appl. Sci. 2021, 11, 842. [Google Scholar] [CrossRef]
- Filippini, C.; Cardone, D.; Perpetuini, D.; Chiarelli, A.M.; Gualdi, G.; Amerio, P.; Merla, A. Convolutional Neural Networks for Differential Diagnosis of Raynaud’s Phenomenon Based on Hands Thermal Patterns. Appl. Sci. 2021, 11, 3614. [Google Scholar] [CrossRef]
- Diakides, M.; Bronzino, J.D.; Peterson, D.R. Medical Infrared Imaging: Principles and Practices; CRC Press: Boca Raton, FL, USA, 2012; ISBN 1-4398-7250-3. [Google Scholar]
- Perpetuini, D.; Cardone, D.; Filippini, C.; Chiarelli, A.M.; Merla, A. A Motion Artifact Correction Procedure for FNIRS Signals Based on Wavelet Transform and Infrared Thermography Video Tracking. Sensors 2021, 21, 5117. [Google Scholar] [CrossRef] [PubMed]
- Kohavi, R.; John, G.H. Wrappers for Feature Subset Selection. Artif. Intell. 1997, 97, 273–324. [Google Scholar] [CrossRef] [Green Version]
| Publisher’s Note: MDPI stays neutral with regard to jurisdictional claims in published maps and institutional affiliations. |
© 2021 by the authors. Licensee MDPI, Basel, Switzerland. This article is an open access article distributed under the terms and conditions of the Creative Commons Attribution (CC BY) license (https://creativecommons.org/licenses/by/4.0/).


 ,
, 


