Article

Synthetic Chemicals as Potential Tracers of Impacts of Fracturing Fluids on Groundwater

Watershed Hydrology and Ecology Research Division, Environment and Climate Change Canada, 867 Lakeshore Road, P.O. Box 5050, Burlington, ON L7S 1A1, Canada
*
Author to whom correspondence should be addressed.
Pollutants 2024, 4(3), 373-392; https://doi.org/10.3390/pollutants4030026
Submission received: 20 June 2024 / Revised: 20 July 2024 / Accepted: 29 July 2024 / Published: 13 August 2024
(This article belongs to the Section Emerging Pollutants)

Abstract

:
Application of hydraulic fracturing to produce “unconventional” oil and gas from shale formations and other low-permeability geological units has raised concerns about the potential environmental impacts, including potential adverse effects of fracturing fluids (FF) on groundwater. In this study, laboratory batch test experiments and new analytical methods were developed to analyze FF chemicals as potential indicators (tracers) to detect impacts of fracturing fluids on groundwater. The tests, conducted over 101–196 days, included FF with synthetic chemicals (~40,000–4,000,000 µg/L), placed in batches with groundwater and sediment at 5° and 25 °C, along with sterile controls. Using the new methods, measurable concentrations of the FF chemicals were many orders in magnitude lower (~3000 to 3,000,000 X) compared to their concentrations in synthetic fracturing fluids, indicating that these chemicals are excellent candidates as indicators of FF contamination in groundwater, if they are relatively persistent, and not prone to extensive loss by sorption during migration in the subsurface. Variable sorption and degradation of the chemicals was observed in both batch and column tests. Sorption was negligible (sorption coefficient, Kd~0.0) for some synthetic chemicals (polyethylene glycol, ethanolamines, isopropanol, and ethyl hexanol) in some tests. At the other extreme, strong sorption was observed for some of the higher molecular weight cocamido propyl betaine (max Kd = 1.17) and polyethylene glycol (max Kd = 1.12) components, and triethanolamine (max Kd = 0.47) in other tests. Apparent loss by degradation was observed for each chemical in some tests, but negligible in others. The shortest apparent half-lives were for isopropanol and ethyl hexanol at 25 °C (t½ < 11 days), and the most persistent synthetic chemicals were polyethylene glycols (t½ ≥ 182 d) and the ethanolamines (t½ ≥ 212 d). Of the potentially diagnostic FF chemicals investigated, the relatively hydrophilic and persistent lower molecular weight polyethylene glycols are some of the most promising as potential indicators of contamination of groundwater by FF.

1. Introduction

The use of hydraulic fracturing for the “unconventional” production of natural gas from shale formations and other low-permeability geological units was first developed during the late 1970s to 1990s in the United States [1]. In recent decades, the use of this unconventional technology (sometimes referred to as “fracking”) has expanded to the production of oil and gas from deep (>1000 m) “tight” (low permeability) reservoirs, in the United States and Canada for example [1,2,3]. This development has raised concerns about potential environmental and health impacts, including the potential adverse effects of fracturing fluids (FF) on groundwater. The main concerns are groundwater impacts by fugitive natural gas (largely methane) [4], by formation fluids (largely as flowback), and by fracturing fluids [5,6,7,8,9,10]. Significant science gaps about these impacts and effects remain [4,11,12,13,14,15,16].

1.1. Previous Ideas on Fracturing Fluid Indicators

Various studies have reviewed the various chemicals used in fracturing fluids, including synthetic organic compounds, and analytical techniques to measure them [17,18]. A number of authors have suggested which chemicals could be indicators or tracers of contamination of environmental waters by fracturing fluids [19,20,21,22,23]. Researchers have detected various FF chemicals in flowback and produced water, including ethylene oxide surfactants, polyethylene glycols and polyethylene glycol carboxylates, polypropylene glycols, linear alkyl ethoxylates, 2-n-butoxyethanol, BTEX compounds, linear alkyl-ethoxylates, and triisopropanolamine [23,24,25,26,27,28]. In some instances, the hydraulic fracturing industry has been using chemical tracers that are added fracturing fluids to quantify recovery of these fluids during flowback [29], or to monitor the movement of hydraulic fluids in the subsurface [30]. However, it appears that there is little published information about the use of these tracers.

1.2. Detections of Chemicals Derived from Fracturing Fluids in Groundwater

Various studies have reported the probable or possible detection in groundwater of FF chemicals or other contaminants resulting from hydraulic fracturing. Gross et al. [31] analyzed reported data of BTEX concentrations in groundwater at various sites across the United States affected by surface spills associated with hydraulic fracturing operations. They found evidence that benzene can contaminate groundwater sources following surface spills at active well sites. Various studies in Texas have reported probable contamination of groundwater by fracturing fluids in areas of unconventional gas production [32,33,34,35]. Fontenot et al. [32] detected methanol and ethanol in some private water wells, along with some elevated inorganic constituents. Hildenbrand et al. [33] found “significant changes in total organic carbon and pH” in groundwater, “along with ephemeral detections of ethanol, bromide, and dichloromethane”. McMahon et al. [34] detected benzene in a sample of shallow groundwater that they suggested might have been derived from a surface release associated with hydrocarbon production activities. Rodriguez et al. [35] reported detections of petroleum distillates and guar gum in groundwater.
In an investigation of an “incident of suspected shale gas contamination of drinking water wells in Pennsylvania, Llewellyn et al. [26] reported occurrences of similar “unresolved complex mixture of organic compounds” and 2-n-butoxyethanol in samples of both the drinking water and flowback. Llewellyn et al. [26] interpreted this as “likely” evidence that “drilling or HF compounds were driven ~1–3 km along shallow to intermediate depth fractures to the aquifer used as a potable water source”.
DiGiulio and Jackson [36] analyzed a range of organic compounds in groundwater samples collected in an unconventional wellfield in Wyoming; they detected petroleum hydrocarbons, alcohols (methanol, ethanol, isopropanol, tert-butyl alcohol, 2-butoxyethanol), glycols (diethylene glycol, triethylene glycol, tetraethylene glycol), low molecular weight organic acids, phenols, and ketones (including acetone). Some of these had been used as additives to fracturing fluids used in the area (e.g., alcohols, glycols). Their detection of organic compounds used for well stimulation in samples from two monitoring wells installed by the USEPA, plus anomalies in major ion concentrations in water from one of these monitoring wells “..provide …evidence of impact …and indicate upward solute migration to depths of current groundwater use” [36].
Recently, Xiong et al. [37] reported possible contamination of a few private wells in Pennsylvania from hydraulic fracturing sites nearby; the highest concentrations of diesel range organics also contained bis-2-ethylhexyl phthalate and N,N-dimethyltetradecylamine. Shaheen et al. [4] reported statistically significant regional correlations between groundwater chloride concentrations and proximity to sites of unconventional oil and gas development in southwestern Pennsylvania. They concluded that, if the elevated Cl is a contaminant derived from brines leaked from wellbores, impoundments, or spills, then elevated thallium concentrations could potentially pose a human health risk in the areas with most dense unconventional oil and gas development. They noted that many of the chemical species more threatening to human health than Cl, such as thallium “are not typically analyzed in predrill data sets”, and “include species like arsenic that may only be detected by commercial analytical labs at concentrations harmful to human health”.

1.3. Focus of This Study

In this study, we report research on methods to analyze FF chemicals as potential indicators (tracers) to detect the impacts of fracturing fluids on groundwater quality. Following a literature review, FF chemicals selected as potential indicators were tested in the laboratory. Some of these were synthetic organic chemicals that are considered to be potentially diagnostic of FF impacts. In detail, methods were developed to analyze the selected FF chemicals, and microcosm (batch) tests were designed to assess attenuation of the selected chemicals under groundwater conditions by such processes as sorption and biodegradation. These experiments included anaerobic tests given that there is a lack of information about the fate of some FF chemicals under anaerobic conditions, though these conditions are prevalent in groundwater. Background information on the chemicals used in fracturing fluids is provided in the Supplementary Material (S1).

2. Methods

2.1. Selection of FF Chemicals

Based on information about the chemical composition of fracturing fluids used across Canada, as posted by the BC (British Columbia) Ministry of Energy and Resources in the registry FracFocus.ca [38], 19 Saskatchewan records were chosen, and some of the most commonly reported chemicals were selected for this laboratory research. Average concentrations of these chemicals in FF (based on the chosen records) were used to prepare synthetic FF for batch tests (Table 1). The synthetic FF “SKB” that was prepared (October 2014) included guar gum, petroleum hydrocarbons, alcohols, a mixture of cocamidopropyl betaine (CAPB), polyethylene glycols (PEG), ethanolamines, other organics, and various inorganic chemicals (Table 1). For the final phase of batch testing, a new synthetic FF “SKC” was prepared (April 2015), which had a reduced number of chemicals, by excluding the relatively hydrophobic and volatile species (petroleum hydrocarbons), and non-diagnostic inorganic chemicals (Table 1). The chemicals that were included were added at similar concentrations to those in SKB.

2.2. Collection of Field Samples

Samples of sediments and groundwater for the laboratory tests included in this study were collected from the following three provinces in Canada:
  • Shallow (~1.5 m depth) “pristine” groundwater and sediment (aquifer) samples collected from a site near Duck Lake, Saskatchewan.
  • Sediment samples (17–34 m depth) from a borehole near Saint-Édouard, Quebec, and groundwater from the same borehole.
  • Shallow sediment (aquifer) samples (0.3–0.4 m depth) from a site near Alliston, Ontario, which were mixed in a 1:1 ratio by volume with silica sand and groundwater (10–15 m depth) sampled at Burlington, Ontario.
Further details are provided in the Supplementary Material (S2).

2.3. Preparation of Microcosms (Batch Tests)

An array of sealed laboratory batch (microcosm) test experiments was conducted, by adding synthetic
FF to either groundwater or mixtures of groundwater and sediment in 125 mL glass serum bottles. Each batch was sealed with a Teflon-coated butyl rubber septum (in crimp cap) and shaken at the start of the experiment. These batches were prepared in a glove box under an Ar atmosphere to minimize the introduction of oxygen and the opportunity for aerobic degradation of the FF chemicals, allowing anaerobic conditions to develop readily. The reasoning behind this is that contaminant plumes in groundwater typically are anaerobic, due to rapid consumption of the limited dissolved oxygen present in groundwater during the first onset of biodegradation.
These batch tests were used to investigate sorption and degradability of FF chemicals in the microcosms at 5 °C and 25 °C in the dark. The 5 °C tests were included because they are representative of the approximate temperature of groundwater at FF sites in Canada. The 25 °C tests were included because it is often assumed (and sometimes observed) that rates of microbial growth and microbial biodegradation of contaminants increase with temperature [39], hence it might be easier to detect biodegradation processes at 25 °C.
Sterilized controls (5 °C) were included to distinguish biodegradation and abiotic processes (e.g., sorption) during these experiments. The sterilization procedures included autoclaving of the groundwater samples and microcosm bottles, and irradiation of the sediment/aquifer samples. The irradiation conducted at the McMaster Nuclear Reactor by McMaster University was single exposure Cobalt-60 gamma radiation of three samples (~1 L each), with a dose rate of 2.2 kGy/h for 21 h on 3–5 March 2015. Batches with just groundwater and no aquifer/sediment material (“water only”) were included as controls for assessing sorption to the aquifer/sediment solids. Batch test samples were obtained over periods of 196 days (tests with SKB) or 135 days (second round of tests with SKC).
The full range of tests conducted is shown in Table S2.2 in the Supplementary Material.

2.4. Microcosm Sampling

At predetermined sampling times, two microcosms for each treatment were selected at random and removed from storage. The microcosms were gently inverted and rocked back and forth to suspend all sediments while minimizing foam production. Microcosms were placed on a platform orbital shaker (New Brunswick Scientific G-33, New Brunswick, NJ, USA) at 250 rpm for 30 min and then transferred to a water bath (VWR Scientific 1225, Radnor, PA, USA) at 25 °C for 1 h. Microcosms were removed from the water bath and a disposable BD syringe attached to a 3-way valve with luer lock fittings and a disposable BD 22 gauge 1 ½-inch needle was used to pierce the microcosm septa and collect a gas sample. The syringe and the 3-way valve had been flushed with helium before sample collection. The syringe equilibrated the microcosm to atmospheric pressure and the amount of gas collected during the equilibration was recorded. If no gas or <3 mL was pushed into the syringe during equilibration then 3 mL of headspace gas was withdrawn manually. The 3-way valve was closed and the syringe and needle were withdrawn. The gas sample in the syringe was used for GC headspace analysis (see GC headspace analysis description). The level of liquid in the microcosm was marked. Using a glass gas-tight syringe, aqueous samples were removed for volatiles analysis (see below), diluted in a 50 mL glass volumetric with MQ water, gently mixed and transferred to a 40 mL volatile vial. Using a glass gas-tight syringe, an aqueous sample was removed for analyses of dissolved FF chemicals (see below). Samples (1.5 mL) from the microcosms were centrifuged in a 2 mL polypropylene centrifuge tube for 15 min at 12,000 rpm and the supernatant was transferred to an amber pre-cleaned glass 2 mL sample storage vial with a PTFE-lined septum. Centrifuged samples were frozen at −20 °C until analysis.
As a complement to the batch tests, a column test was used to investigate the mobility of the components of cocamidopropyl betaine (CAPB) within the Saskatchewan aquifer material (Supplementary Material S3).

2.5. Analytical Methods

An array of laboratory methods was developed and used to analyze the selected FF chemicals and to analyze for other relevant species that were potential indicators of biodegradation. Components of cocamidopropyl betaine (CAPB), polyethylene glycols (PEG), and ethoxylated alcohols (EA) were analyzed using liquid chromatography coupled to a quadrupole time-of-flight detector (see S4.1 in Supplementary Material for details). Volatiles in the aqueous phase (hydrocarbons and polar solvents) were analyzed using purge and trap with gas chromatography coupled to a mass spectrometry detector (MSD) (S4.2 in Supplementary Material). The analytes included isopropanol, 2-ethyl-1-hexanol, 2,6-dimethyl-4-heptanone, hexane, cyclohexane, 2-methyl pentane, 3-methyl pentane, and methyl cyclohexane. Diethanolamine and triethanolamine were analyzed using liquid chromatography coupled to a tandem mass spectrometer using the method outlined in Wang and Schnute [40] with minor modifications (S4.3 in Supplementary Material). Gas chromatography, using headspace injection and flame ionization detection (GC FID) was used to analyze straight chain hydrocarbons (C1 to C6) in batch test headspace samples (S4.4 in Supplementary Material). Supplementary analyses of various gases, ions, and redox species were also conducted, using methods described in S4.4 and S4.5 (Supplementary Material). Detection limits for some of the analyses are shown in Table S5.1 in the Supplementary Material.

2.6. Error Bars for Analyses

Error bars for analyses of the synthetic fracturing fluid chemicals were as follows: cocamidopropyl betaine (total), ±11%; polyethylene glycol (total), ±17%; diethanolamine, ±6%; triethanolamine, ±8%; isopropanol, ±14%; ethyl hexanol, ±7%; dissolved hydrocarbons (total), ±3%; hydrocarbons in headspace (total), ±5%. The method for calculating these error bars is explained in Table S5.2 in the Supplementary Material.

2.7. Calculations of Distribution (Sorption) Coefficients

The extent of sorption of the FF chemicals in the batch experiments was determined by calculating the distribution (sorption) coefficient, Kd, for each experiment [41]:
Kd = Csed/Cw
where Csed and Cw are the concentrations of the organic chemical sorbed by the sediment (µg/kg) and dissolved in aqueous phase (µg/L), respectively.
For our batch tests, Cw was measured directly, as the measured aqueous concentration in the “groundwater and sediment” batches (on day 1), designated as Cgw+sed (µg/L). In contrast, as explained below, Csed was inferred indirectly, using both these measured Cgw+sed (µg/L) values, as well as the aqueous concentrations in the corresponding “groundwater only” batch (on day 1), Cgw (µg/L).
In order to calculate Csed, we needed to account for the fact that the “groundwater and sediment” (gw + sed) batches had more water compared to the “groundwater only” (gw) batches. We used the measured water contents for each sediment, to calculate an adjustment factor, ψ, as the ratio of the volume of water in each gw batch to the volume in the corresponding gw + sed batch. Then, from the measured concentration in each gw batch, Cgw, we calculated the decline in the groundwater concentration in each corresponding gw + sed batch due to sorption as Cgw × ψCgw+sed. From this, Csed (µg/kg) was calculated as:
Csed = (Cgw × ψCgw+sed) × Vgw+/msed
where Vgw+ is the volume of groundwater in the gw + sed batch (L), and msed is the mass of the sediment (kg, as dry weight)
Substituting the right side of Equation (2) into Equation (1), we have the equation we used to calculate Kd values for the FF chemicals in our tests:
Kd = ((Cgw × ψCgw+sed) × (Vgw+/msed))/Cgw+sed
Some of the abbreviations used in this article are shown in Table 2.

3. Results and Discussion

3.1. Validation of Analytical Methods

Using the analytical methods developed in this study to analyze aqueous concentrations of synthetic FF chemicals, our results indicated measurable concentrations in standards and in water samples from the batch tests that were many orders in magnitude lower (~3000 to 3,000,000 X) compared to their nominal concentrations in the synthetic fracturing fluids (Table S5.2 in Supplementary Material). This indicates that these chemicals are excellent candidates as indicators of FF contamination in groundwater, if they are relatively persistent, and not prone to extensive loss by sorption during migration in the subsurface.

3.2. Evidence for Sorption

A comparison of the concentrations of FF chemicals in “day 1” samples of the “groundwater only” controls and “groundwater and sediment” batch tests indicated that some were noticeably higher in the “groundwater only” batches (Figure 1; Table S6.1 in Supplementary Material). This included cocamidopropyl betaine (CAPB), the polyethylene glycols, diethanolamine, and triethanolamine (Figure 1; Table S6.1). The lower concentrations in the “groundwater and sediment” batches (Figure 1) are strong evidence for a rapid phase of sorption (by day 1). Based on this evidence, we calculated sorption coefficients, Kd, for each of these fracturing fluid chemicals using Equation (3) (Figure 2; Table S6.2).
Sorption was negligible (sorption coefficient, Kd~0.0) for some of the synthetic chemicals (polyethylene glycol, ethanolamines, isopropanol, and ethyl hexanol) in some of the tests (Figure 2; Table S6.2). At the other extreme, strong sorption was observed for some of the higher molecular weight cocamido propyl betaine (max Kd = 1.17) and polyethylene glycol (max Kd = 1.120) components, and triethanolamine (max Kd = 0.47) in other tests (Figure 2; Table S6.2).
The degree of sorption observed was dependent on the sediment/aquifer material. Sorption was relatively strong in the Quebec and Saskatchewan batches compared to the Ontario batches (Figure 2; Table S6.2). This apparently reflects the differences in texture: The Ontario sediment (mixture of Borden and silica sand) is coarser in texture (less silt and clay), has lower cation exchange capacity (Table S2.1), and has relatively low organic carbon (Table S2.1, and previous studies, e.g., [42]).
In a column experiment, sorption and chromatographic separation of the C8 and C10 CAPB components was observed (Figure 3). The C10 component was more strongly sorbed, as shown by the greater delay in transport of this component through the column (~10 pore volumes of flow on average) compared to the C8 component (~5 pore volumes) (Figure 3). The results indicated retardation factors (Rf values) of 1.8 for the CAPB C8 fraction and 2.9 for the CAPB C10 fraction. The C12 and C14 CAPB components were not detected, apparently due to even stronger sorption.
In both the batch tests and the column test, the higher molecular weight components of CAPB tended to be most strongly sorbed (Figure 2 and Figure 3; Table S6.2). In all batches, the ratios of concentrations (groundwater only/groundwater plus sediment) were low for C8, but increased with increasing molecular weight through C14. This is consistent with the results of Eichhorn and Knepper [43] who reported that “higher alkyl homologues” (of CAPB) “were more prone to adsorption”. The batch tests also indicated preferential sorption of the higher molecular weight PEG and ethanolamines (Figure 2; Table S6.2). Based on these results, the higher molecular weight components of these chemicals are expected to be less mobile in groundwater, whereas the lower molecular weight compounds (C8) are potentially mobile enough under some groundwater conditions to be useful as diagnostic indicators of the impacts by FF. For example, if FF-impacted groundwater moves along fractures, these chemicals will tend to sorb less compared to the migration of FF-impacted groundwater through porous matrices.
Sorption was strong for the ethanolamines in the Quebec and Saskatchewan batches, but much weaker in the Ontario batches (Figure 2; Table S6.2). This is likely related to the lower cation exchange capacity of the Ontario sand (see above), given that previous research has shown that alkanolamines tend to sorb to soils largely via cation exchange [44,45].
For the CAPB C10 component, the batch tests with Saskatchewan groundwater and sediment indicated much stronger sorption (higher Kd values) compared to the corresponding column test (Figure 2; Table S6.2). This is consistent with the oft-reported reduction in sorption coefficients (Kd) at increasing sediment/water ratios [46]. In our study, the Kd values for the column test are more reflective of conditions (higher sediment/water ratio) that we would expect in the groundwater environment.

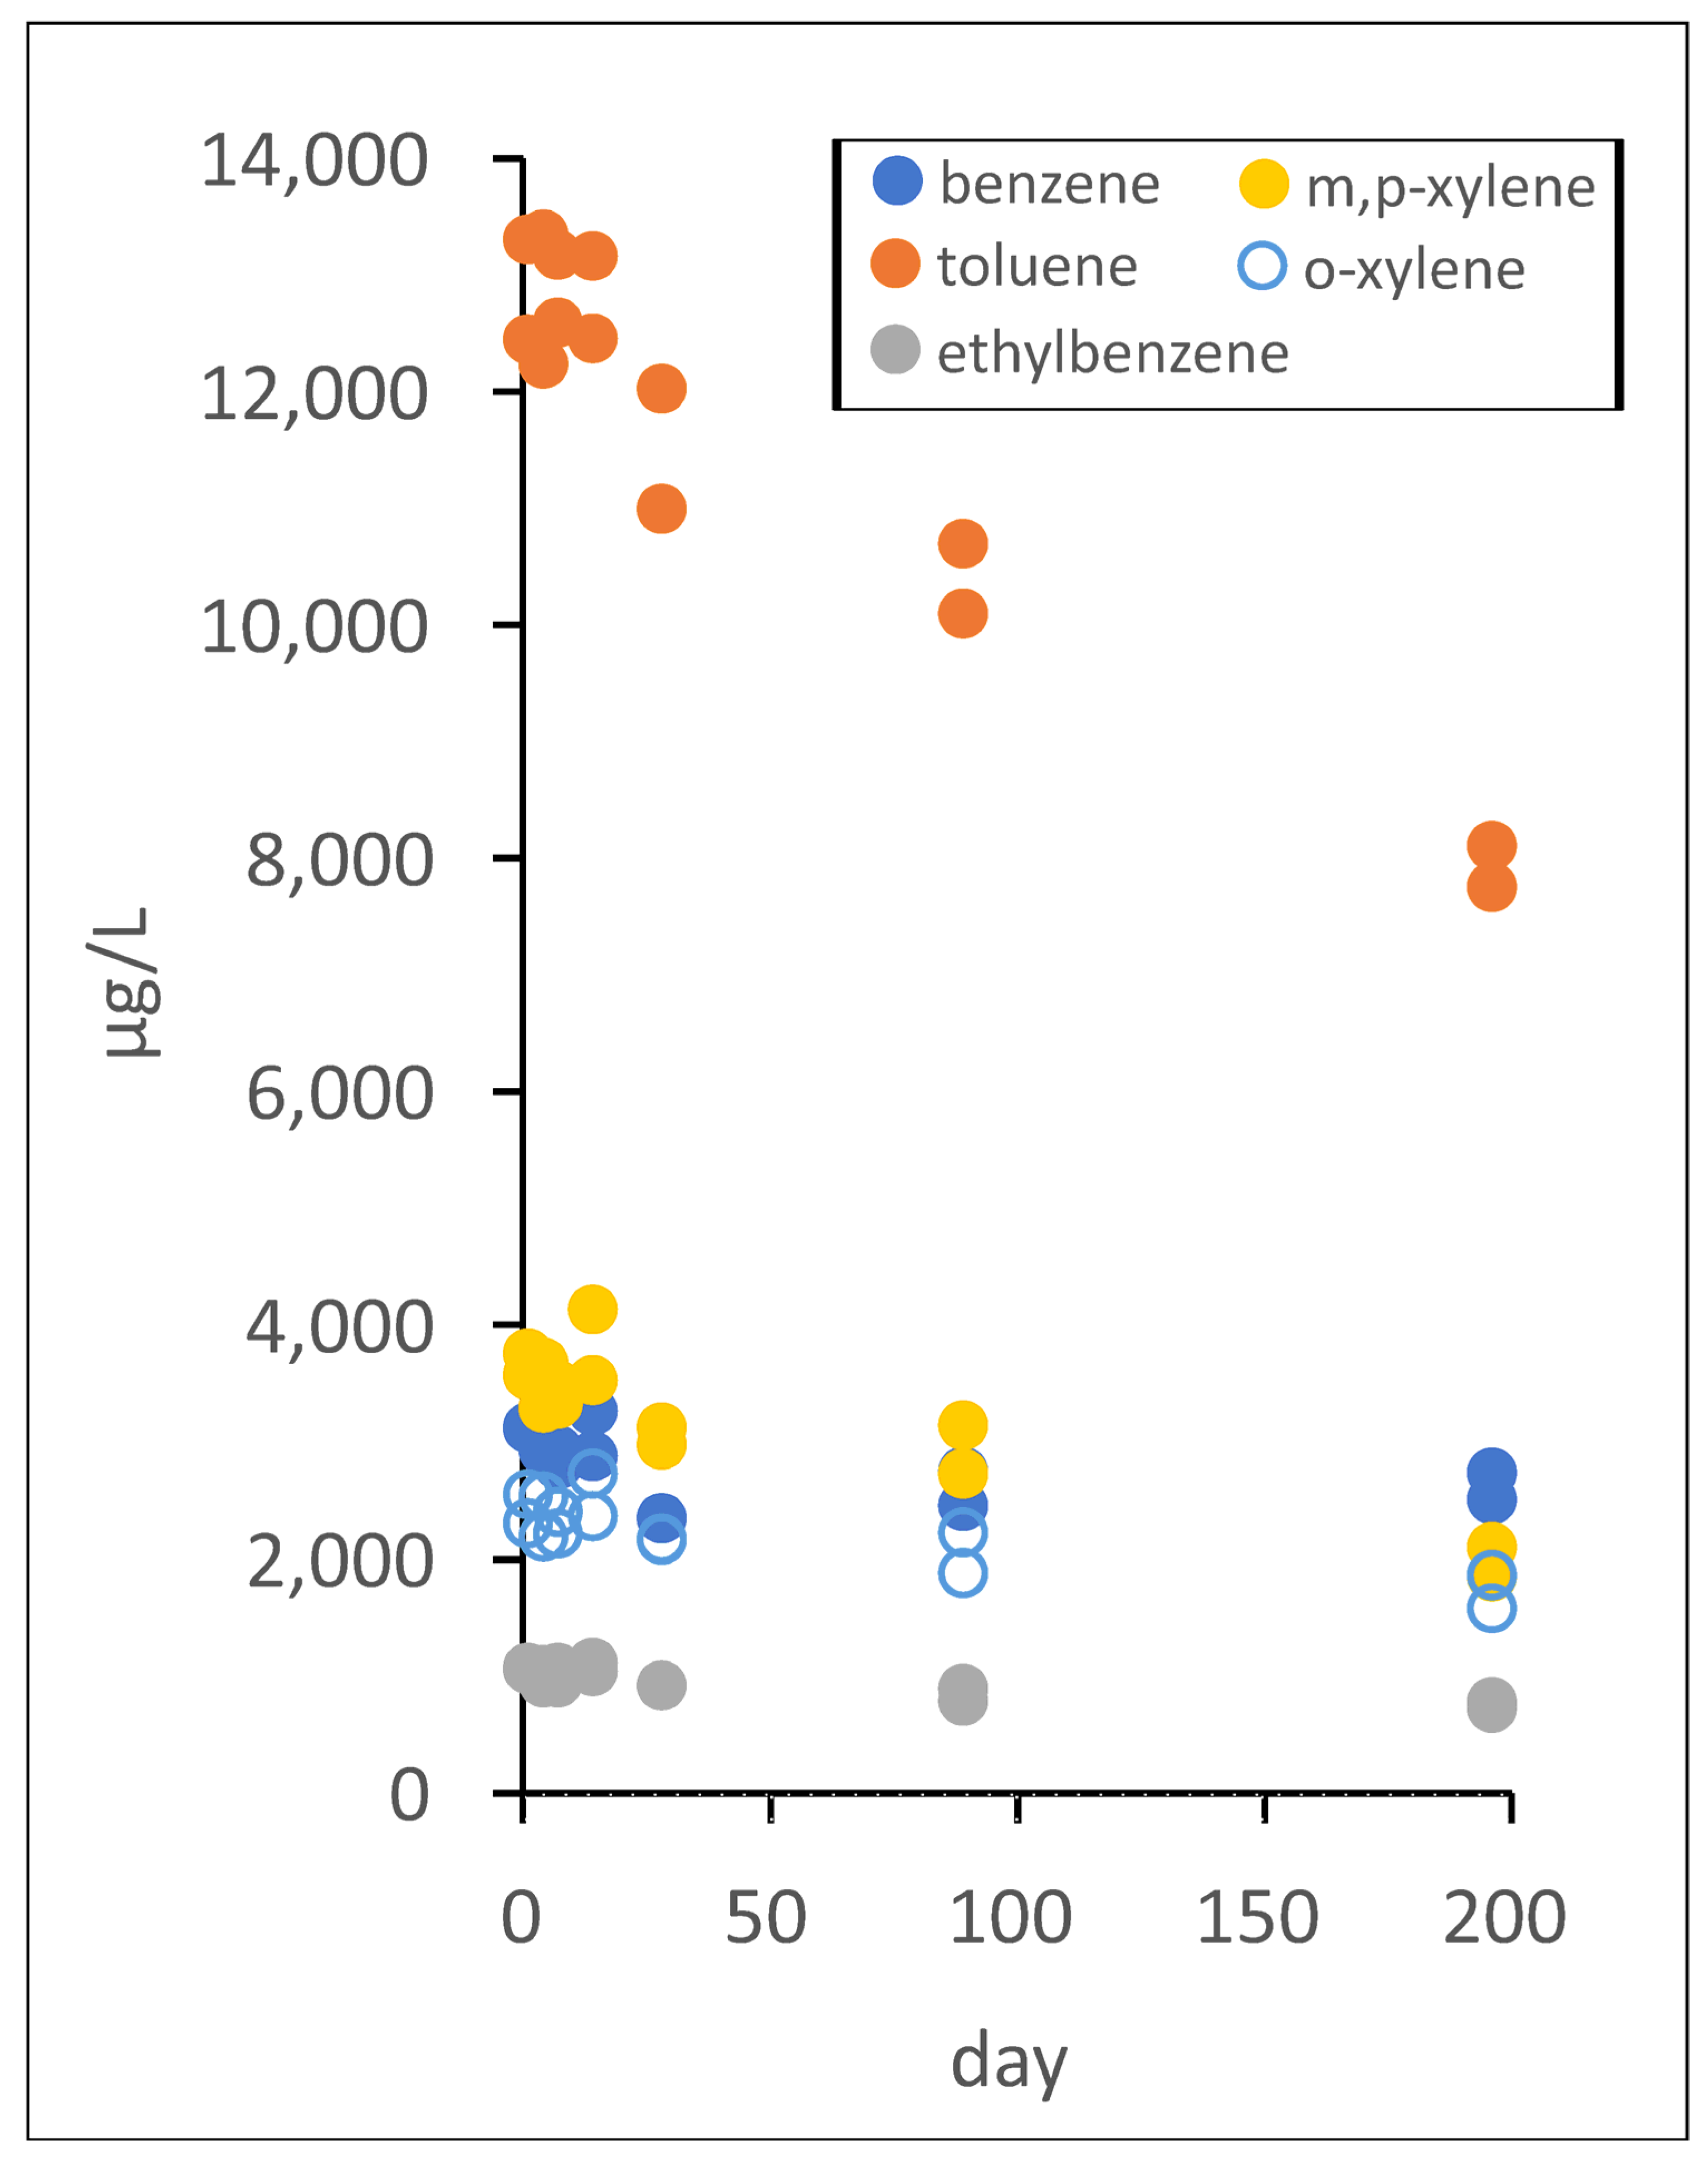
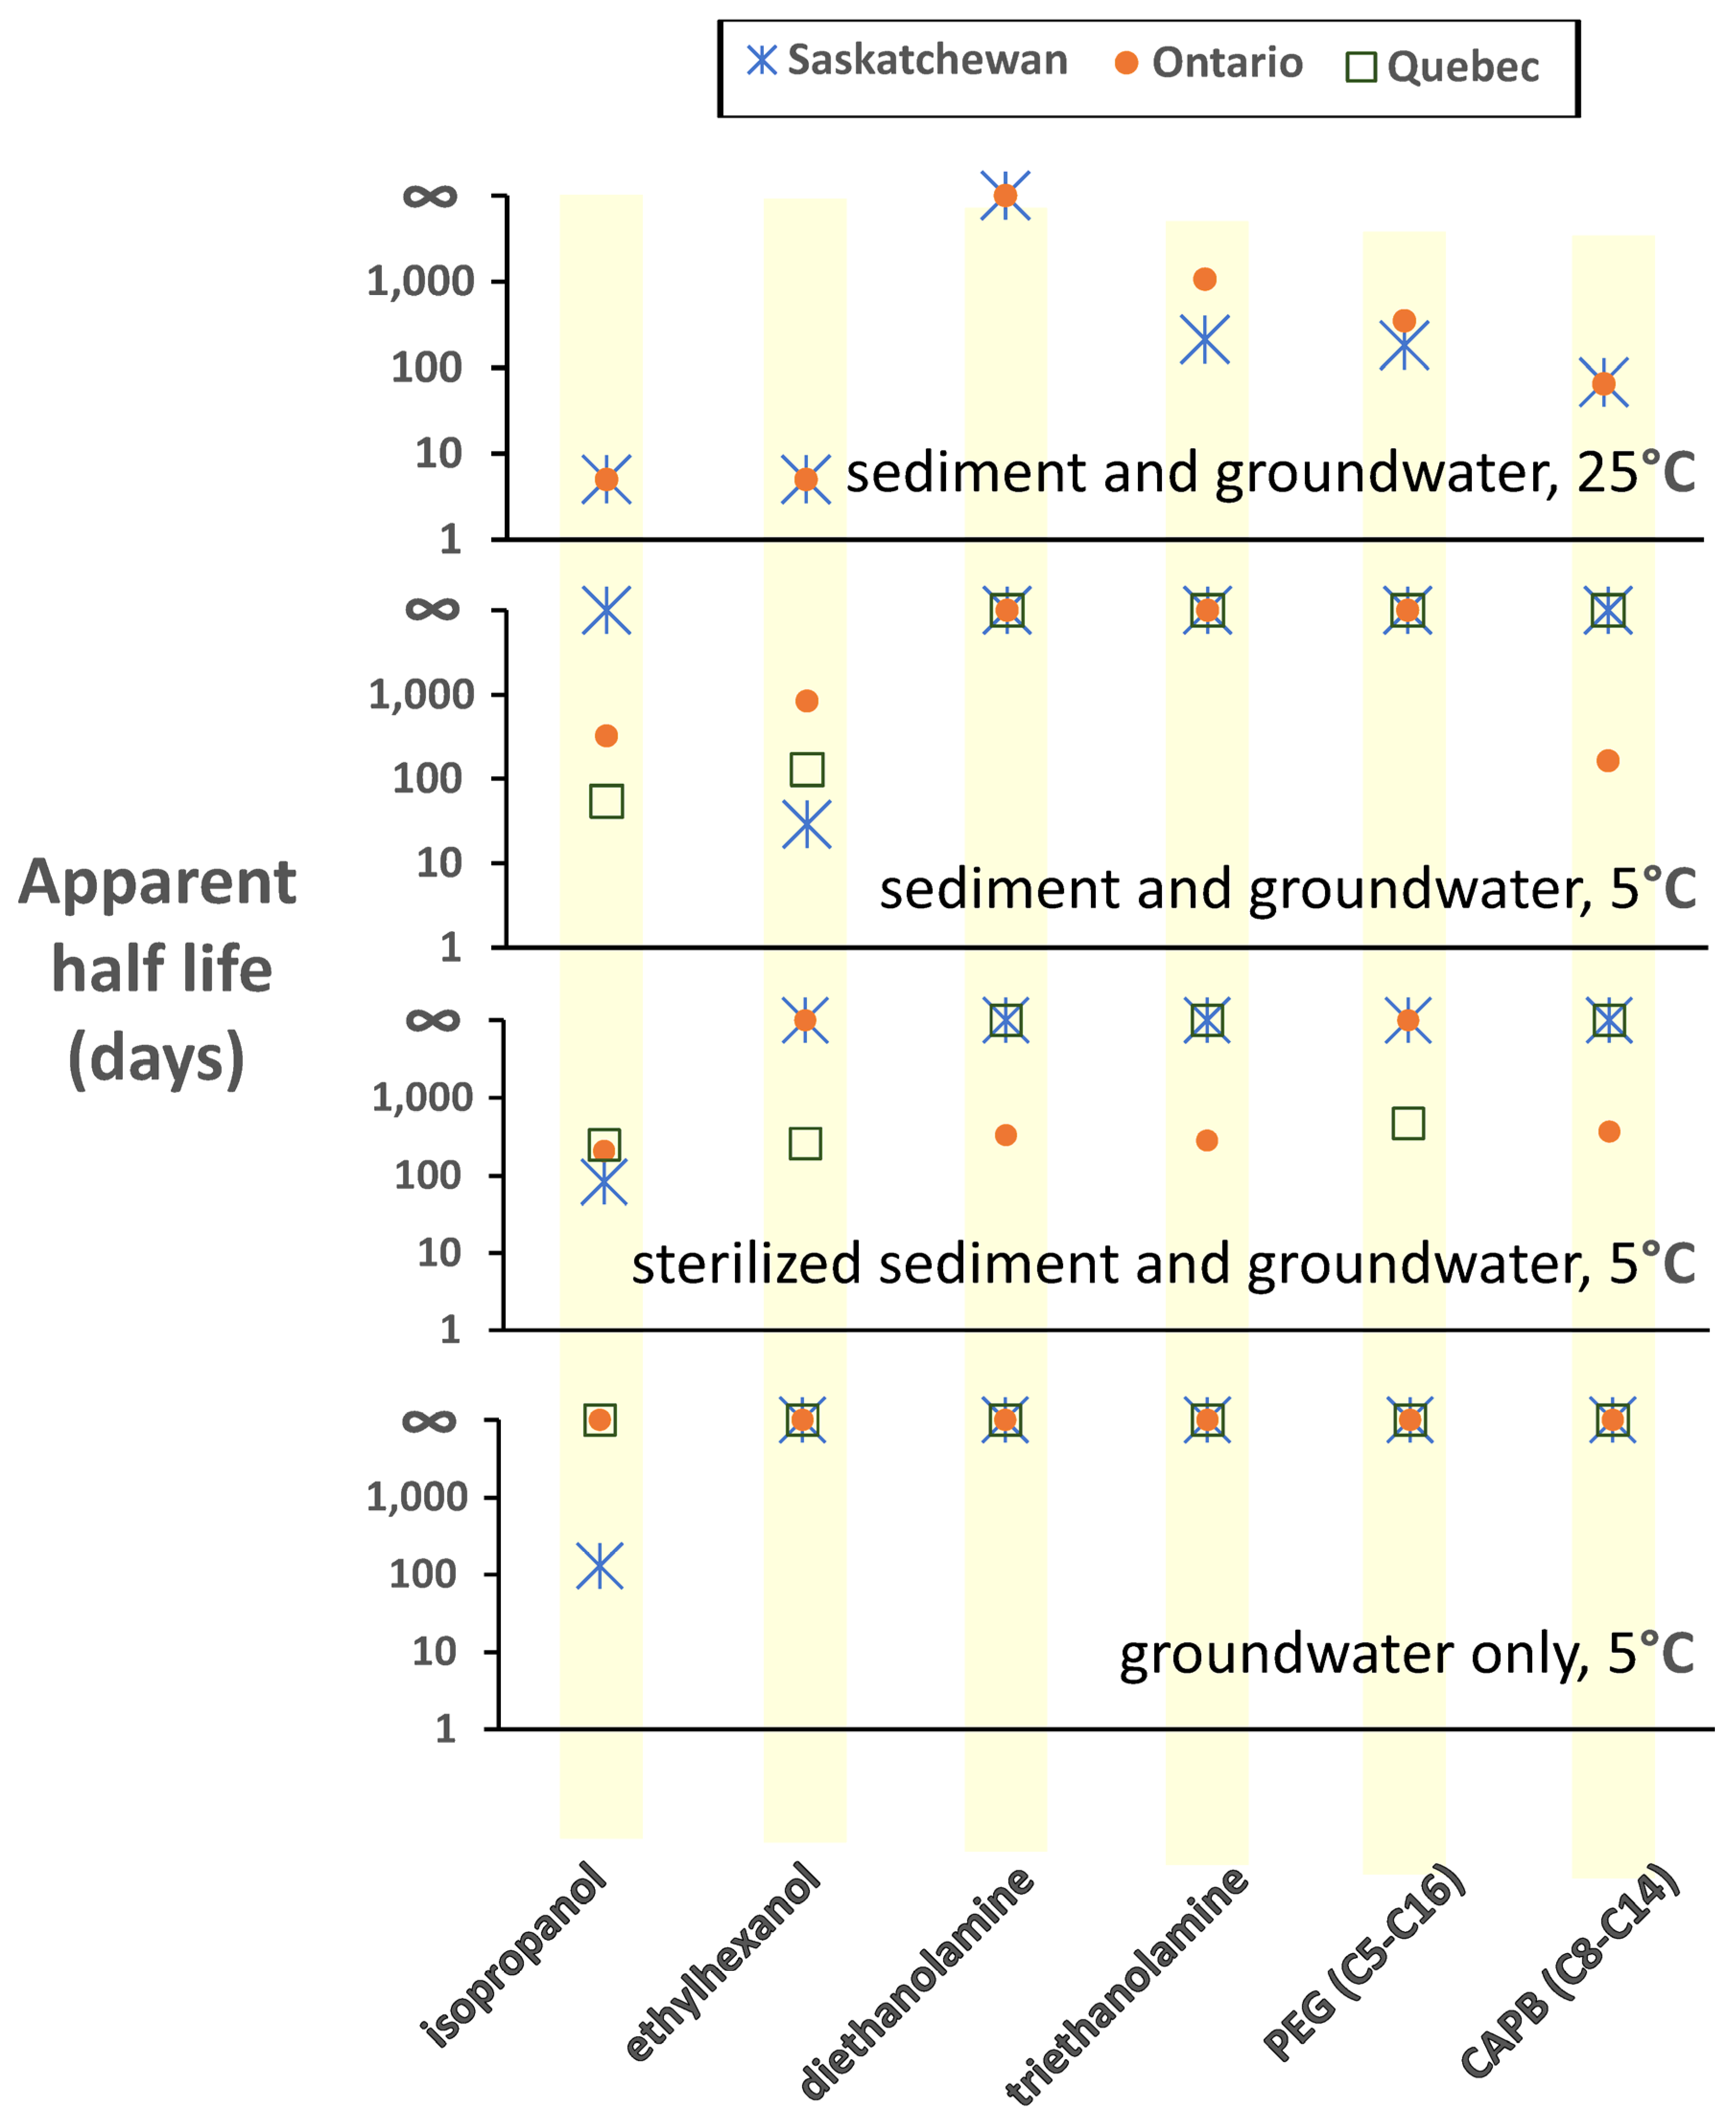
3.3. Evidence for Biodegradation of FF Chemicals

Evidence for biodegradation of the synthetic organic FF chemicals was based on observed losses over time (comparison of day 1 data to end of experiment data), and also by comparing the results in the sterile batch tests to those of the intact (i.e., microbially active, not sterilized) batch tests.
There were declines over time in concentrations of the synthetic organic FF chemicals added (Figure 4). Especially noticeable were declines in isopropanol, ethyl hexanol, and the CAPB components (Figure 4). Many of these trends were significant (Table S7.1 in Supplementary Material). There were also declines in concentrations of some petroleum hydrocarbons added as chemicals in fracturing fluid SKB, especially toluene (Figure 5). Acetone, which is inferred to be a metabolite of one or more FF chemicals (cf. [47,48]; see Section 3.4) was detected in some of the batch tests (Figure 4). There were also increases in the concentrations of CO2 (headspace) (Figure 6). Combined, these observations are evidence for active biodegradation of the synthetic mixtures of FF chemicals under largely anaerobic conditions.
The evidence for biodegradation was generally most pronounced in the 25 °C intact (unsterilized), microbially active batch tests, although evidence was also found for slower degradation in the 5 °C microbially active batch tests, and also in some of the 5 °C “sterile” batch tests (Figure 7, Table S7.1). The latter was evidence for possible survival of some microorganisms in spite of the sterilization procedures. Further evidence for microbial activity in these “sterile” tests were increases in CO2 and changes in redox chemistry over time (Table S8.1).

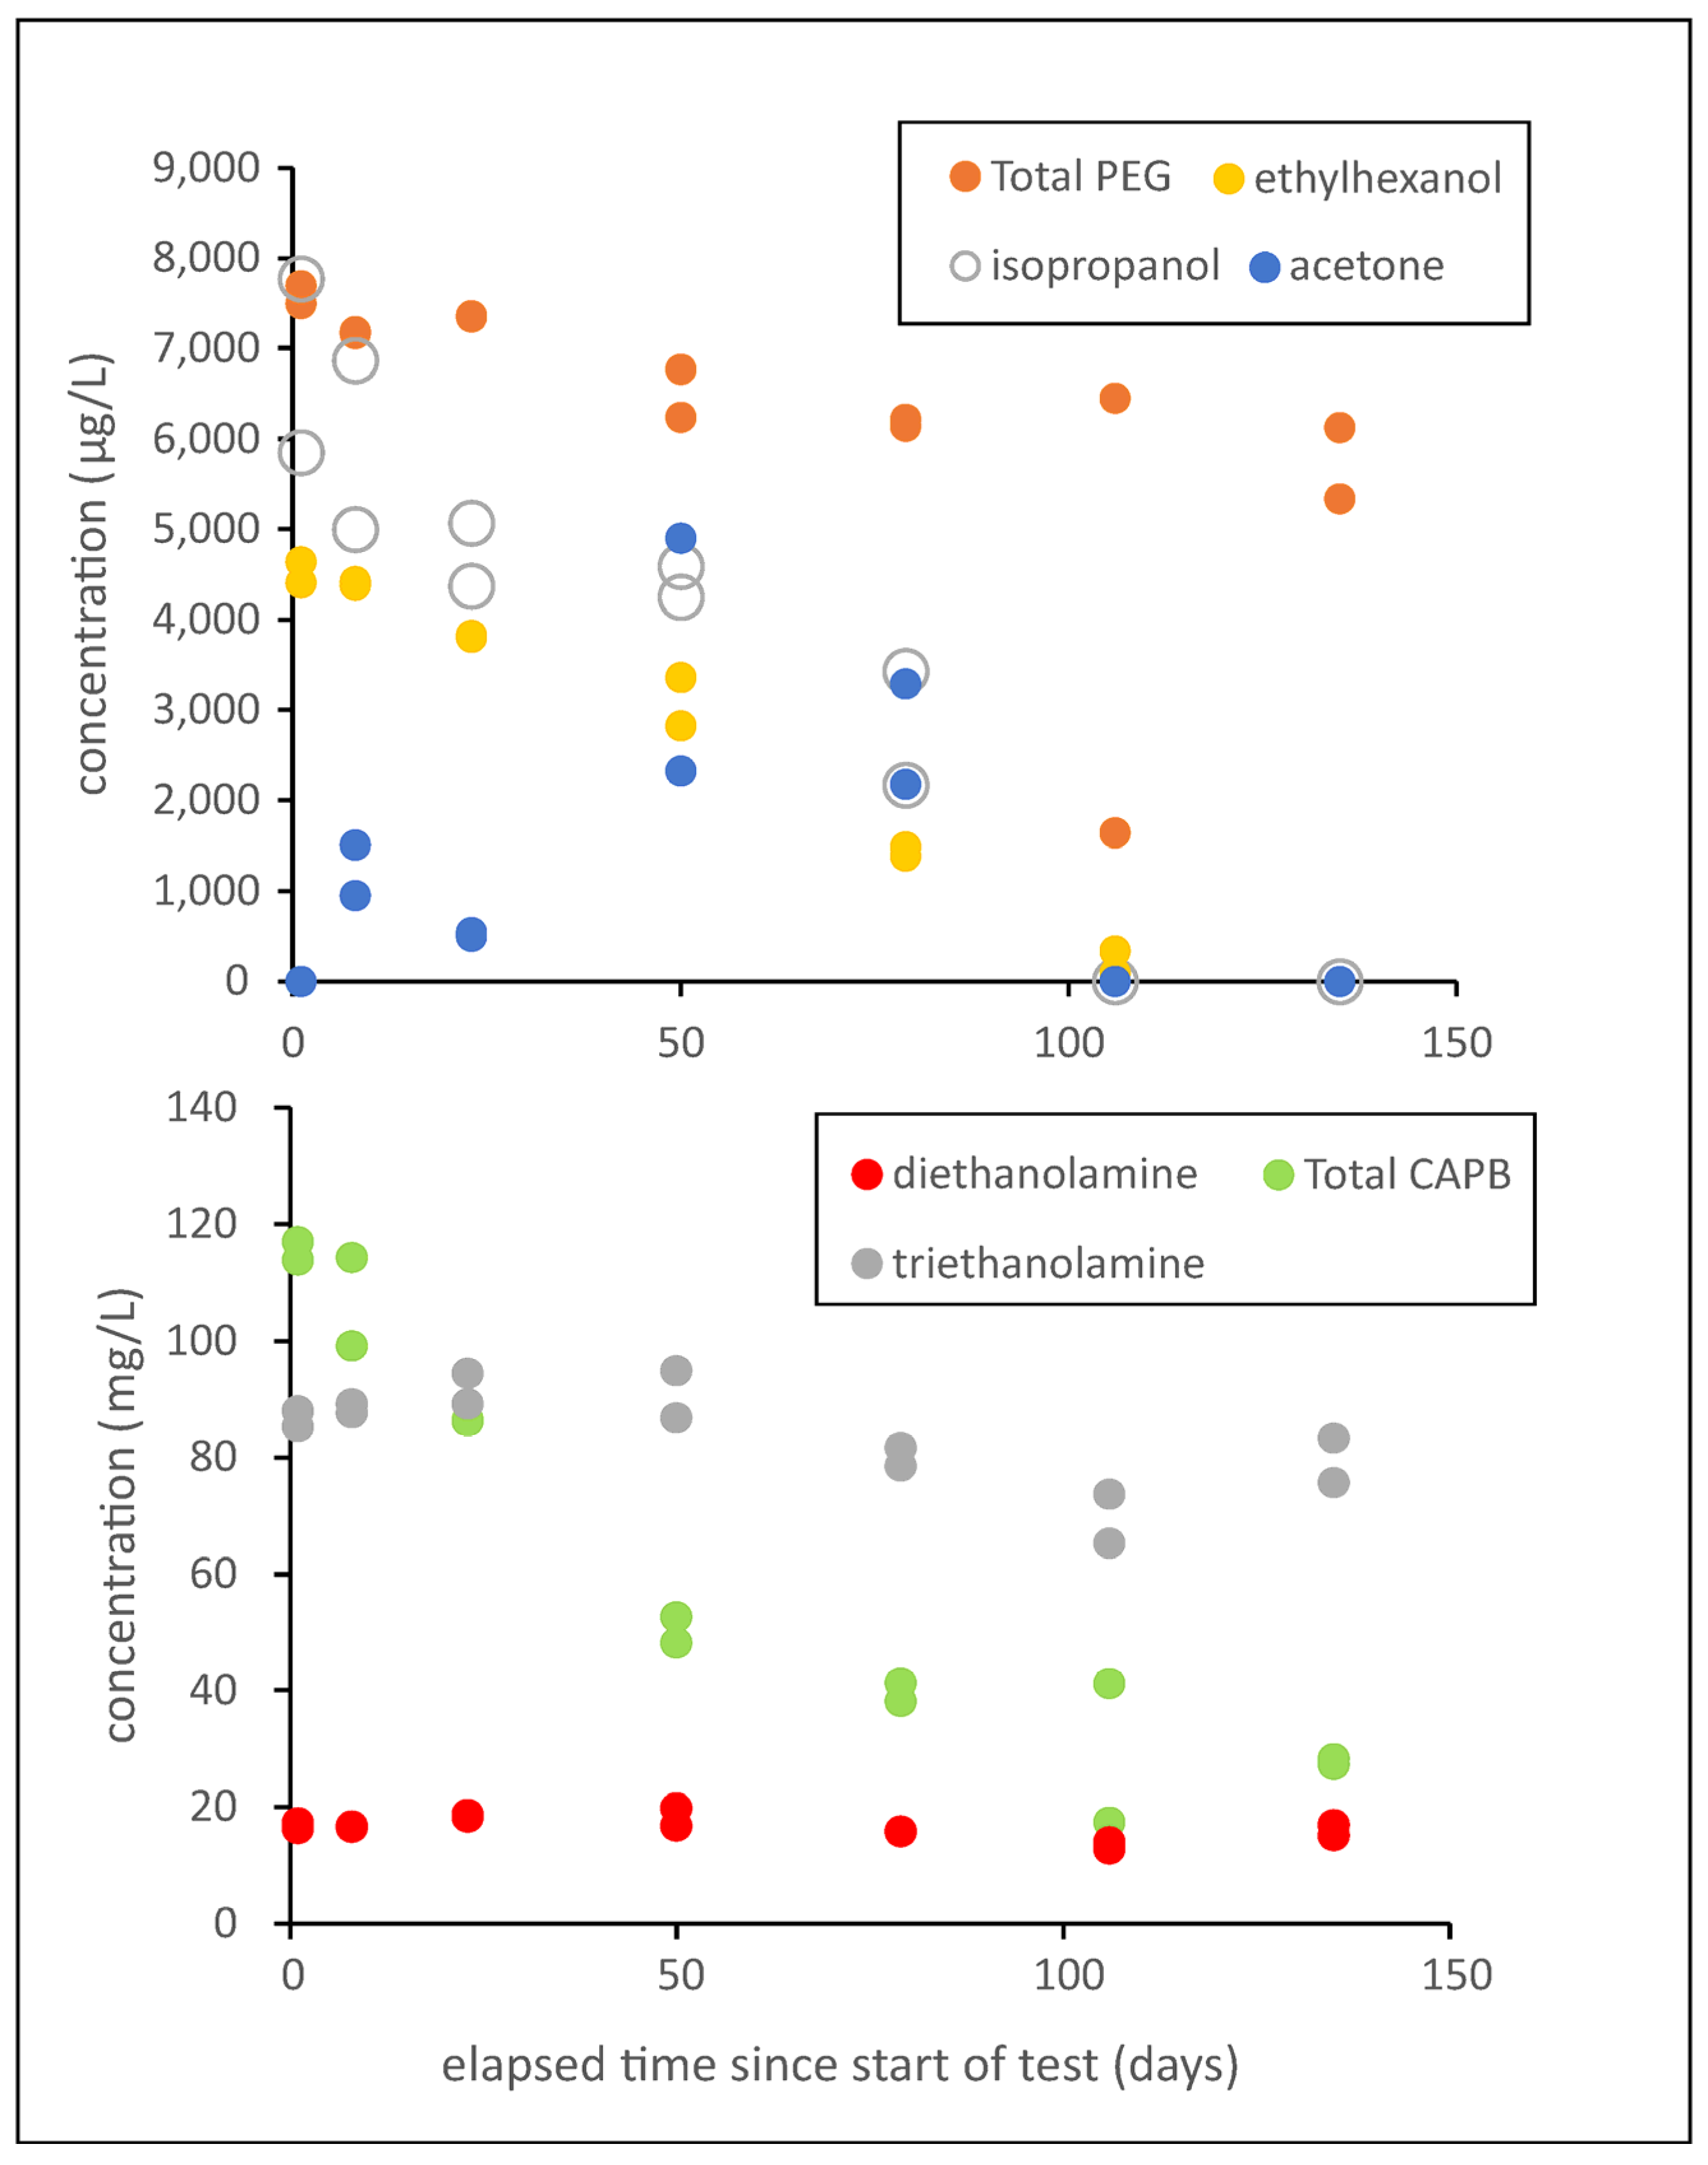
3.4. Biodegradation of Alcohols

The alcohols included in this study, isopropanol and ethyl hexanol, tended to be biodegraded, most readily in the intact 25 °C batches (Figure 7, Table S7.1). In the Saskatchewan and Ontario tests at 25 °C, isopropanol and ethyl hexanol had the shortest apparent half-lives observed in this study (t½ < 11 days) (Figure 7). They were also apparently biodegraded to some extent in the 5 °C batches and in some sterile batches (Figure 7). Degradation of isopropanol was possibly the source of the acetone, which was not added, but appears in the batches over time, and is known to be a metabolite of this alcohol [49]. Despite the tendency for these alcohols to be degraded, high concentrations remained in some of the microcosms after 135 days (Figure 7, Table S7.1). This was the case, even though biocides, which are common constituents of FF, were not used in our batches. Biocides have been observed to impede the biodegradation of alcohols [50], including isopropanol [51]. Thus, under some conditions, these alcohols might be persistent [50] and useful indicators of FF impacts on groundwater.

3.5. Biodegradation of Ethanolamines

Diethanolamine and triethanolamine were generally persistent in the microcosms, with some evidence that triethanolamine tended to be degraded more readily (Figure 7, Table S7.1). In most tests, there was no detectable loss of these chemicals, the shortest apparent half-lives (t½) were 334 days for diethanolamine, and 212 days for triethanolamine (Figure 7).
These aforementioned results suggest that under anaerobic conditions (i.e., our microcosms), where sorption is limited (e.g., rapid flow along fractures), the ethanolamines may be useful indicators of FF impacts on groundwater. The concentrations of ammonia tended to decline in the batch tests (Supporting Materials: S9), providing no evidence for the production of ammonia as a metabolite of ethanolamine degradation.
Both aerobic and anaerobic degradation of ethanolamines have been reported previously [52,53,54,55]. For example, West and Gonsior [53] reported rapid biodegradation of triethanolamine under aerobic conditions in surface soil and surface water, and also in activitated sludge. Studies that appear more relevant to our objectives are those of Mrklas et al. [54] and Hawthorne et al. [45]. In microcosms that contained groundwater and “soil” from the site in Alberta, Canada, Mrklas et al. [54] reported that monoethanolamine was readily biodegraded under aerobic conditions, but persisted (slow biodegradation rate) under anaerobic conditions. Hawthorne et al. [45] reported the persistence of monoethanolamine in soil and groundwater for more than 10 years at an industrial site. Similarly, in tests with soils, Kookana et al. [56] found that triethanolamine was persistent, especially when a fracturing fluid was also added.

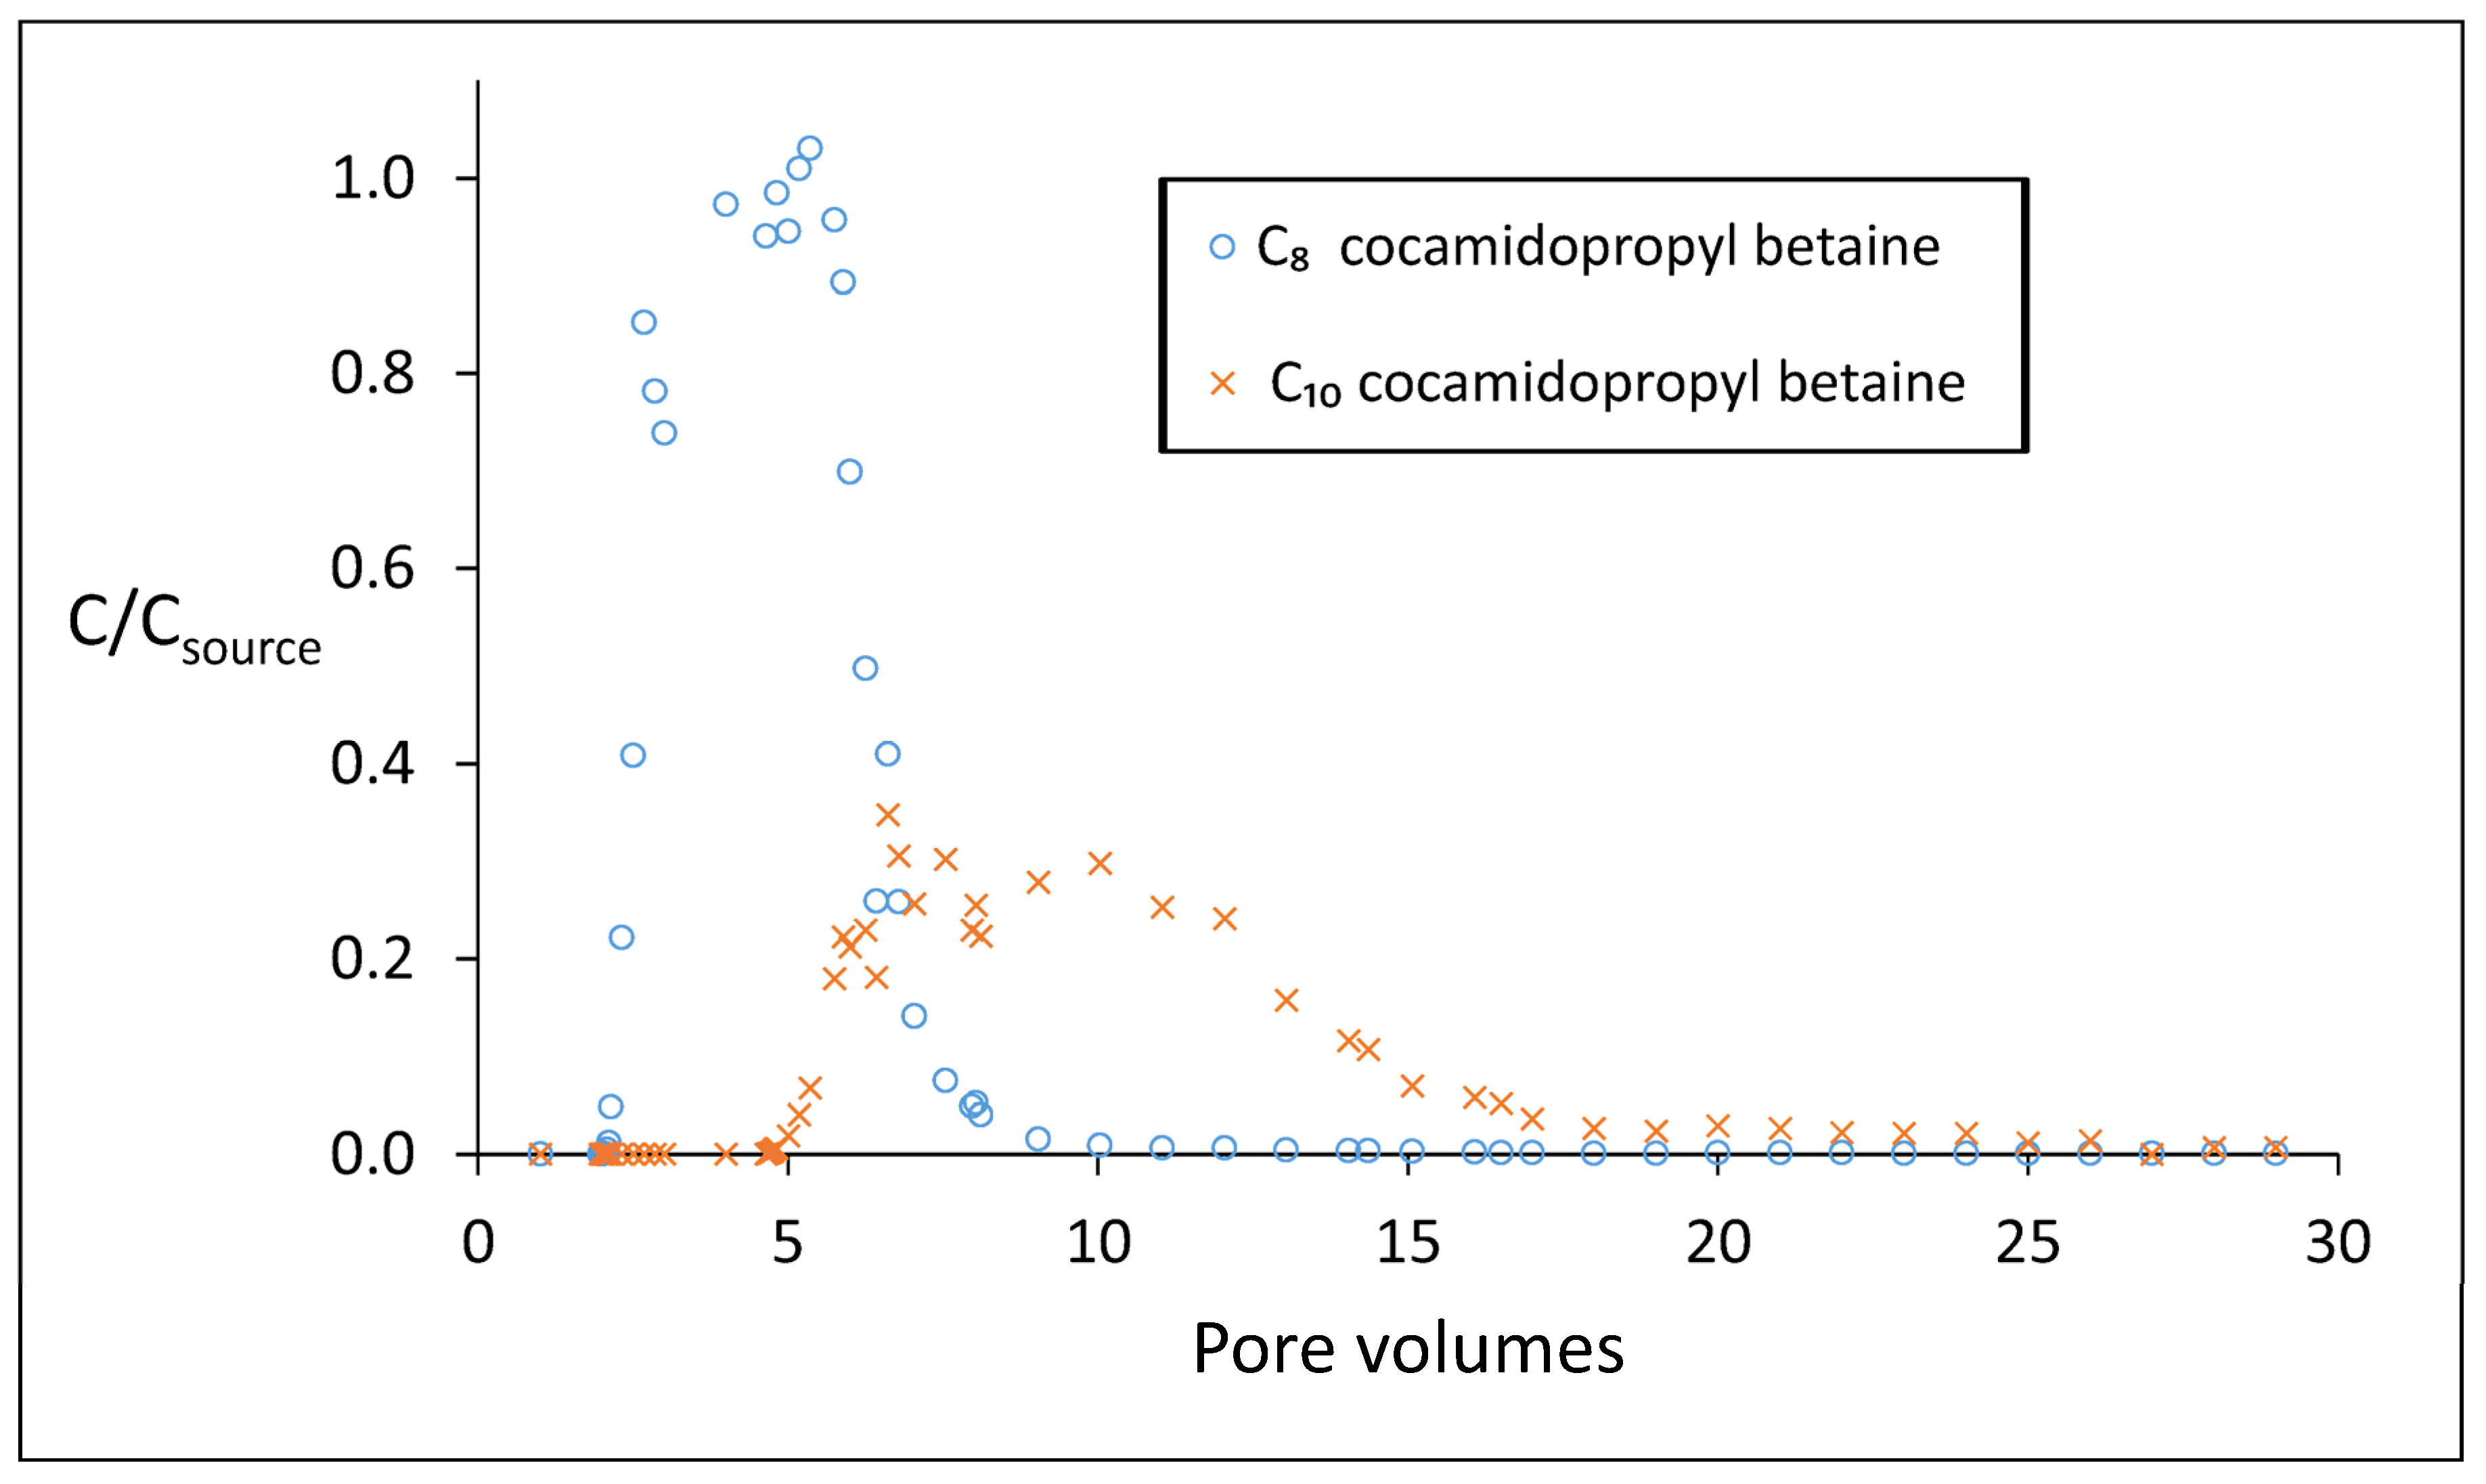
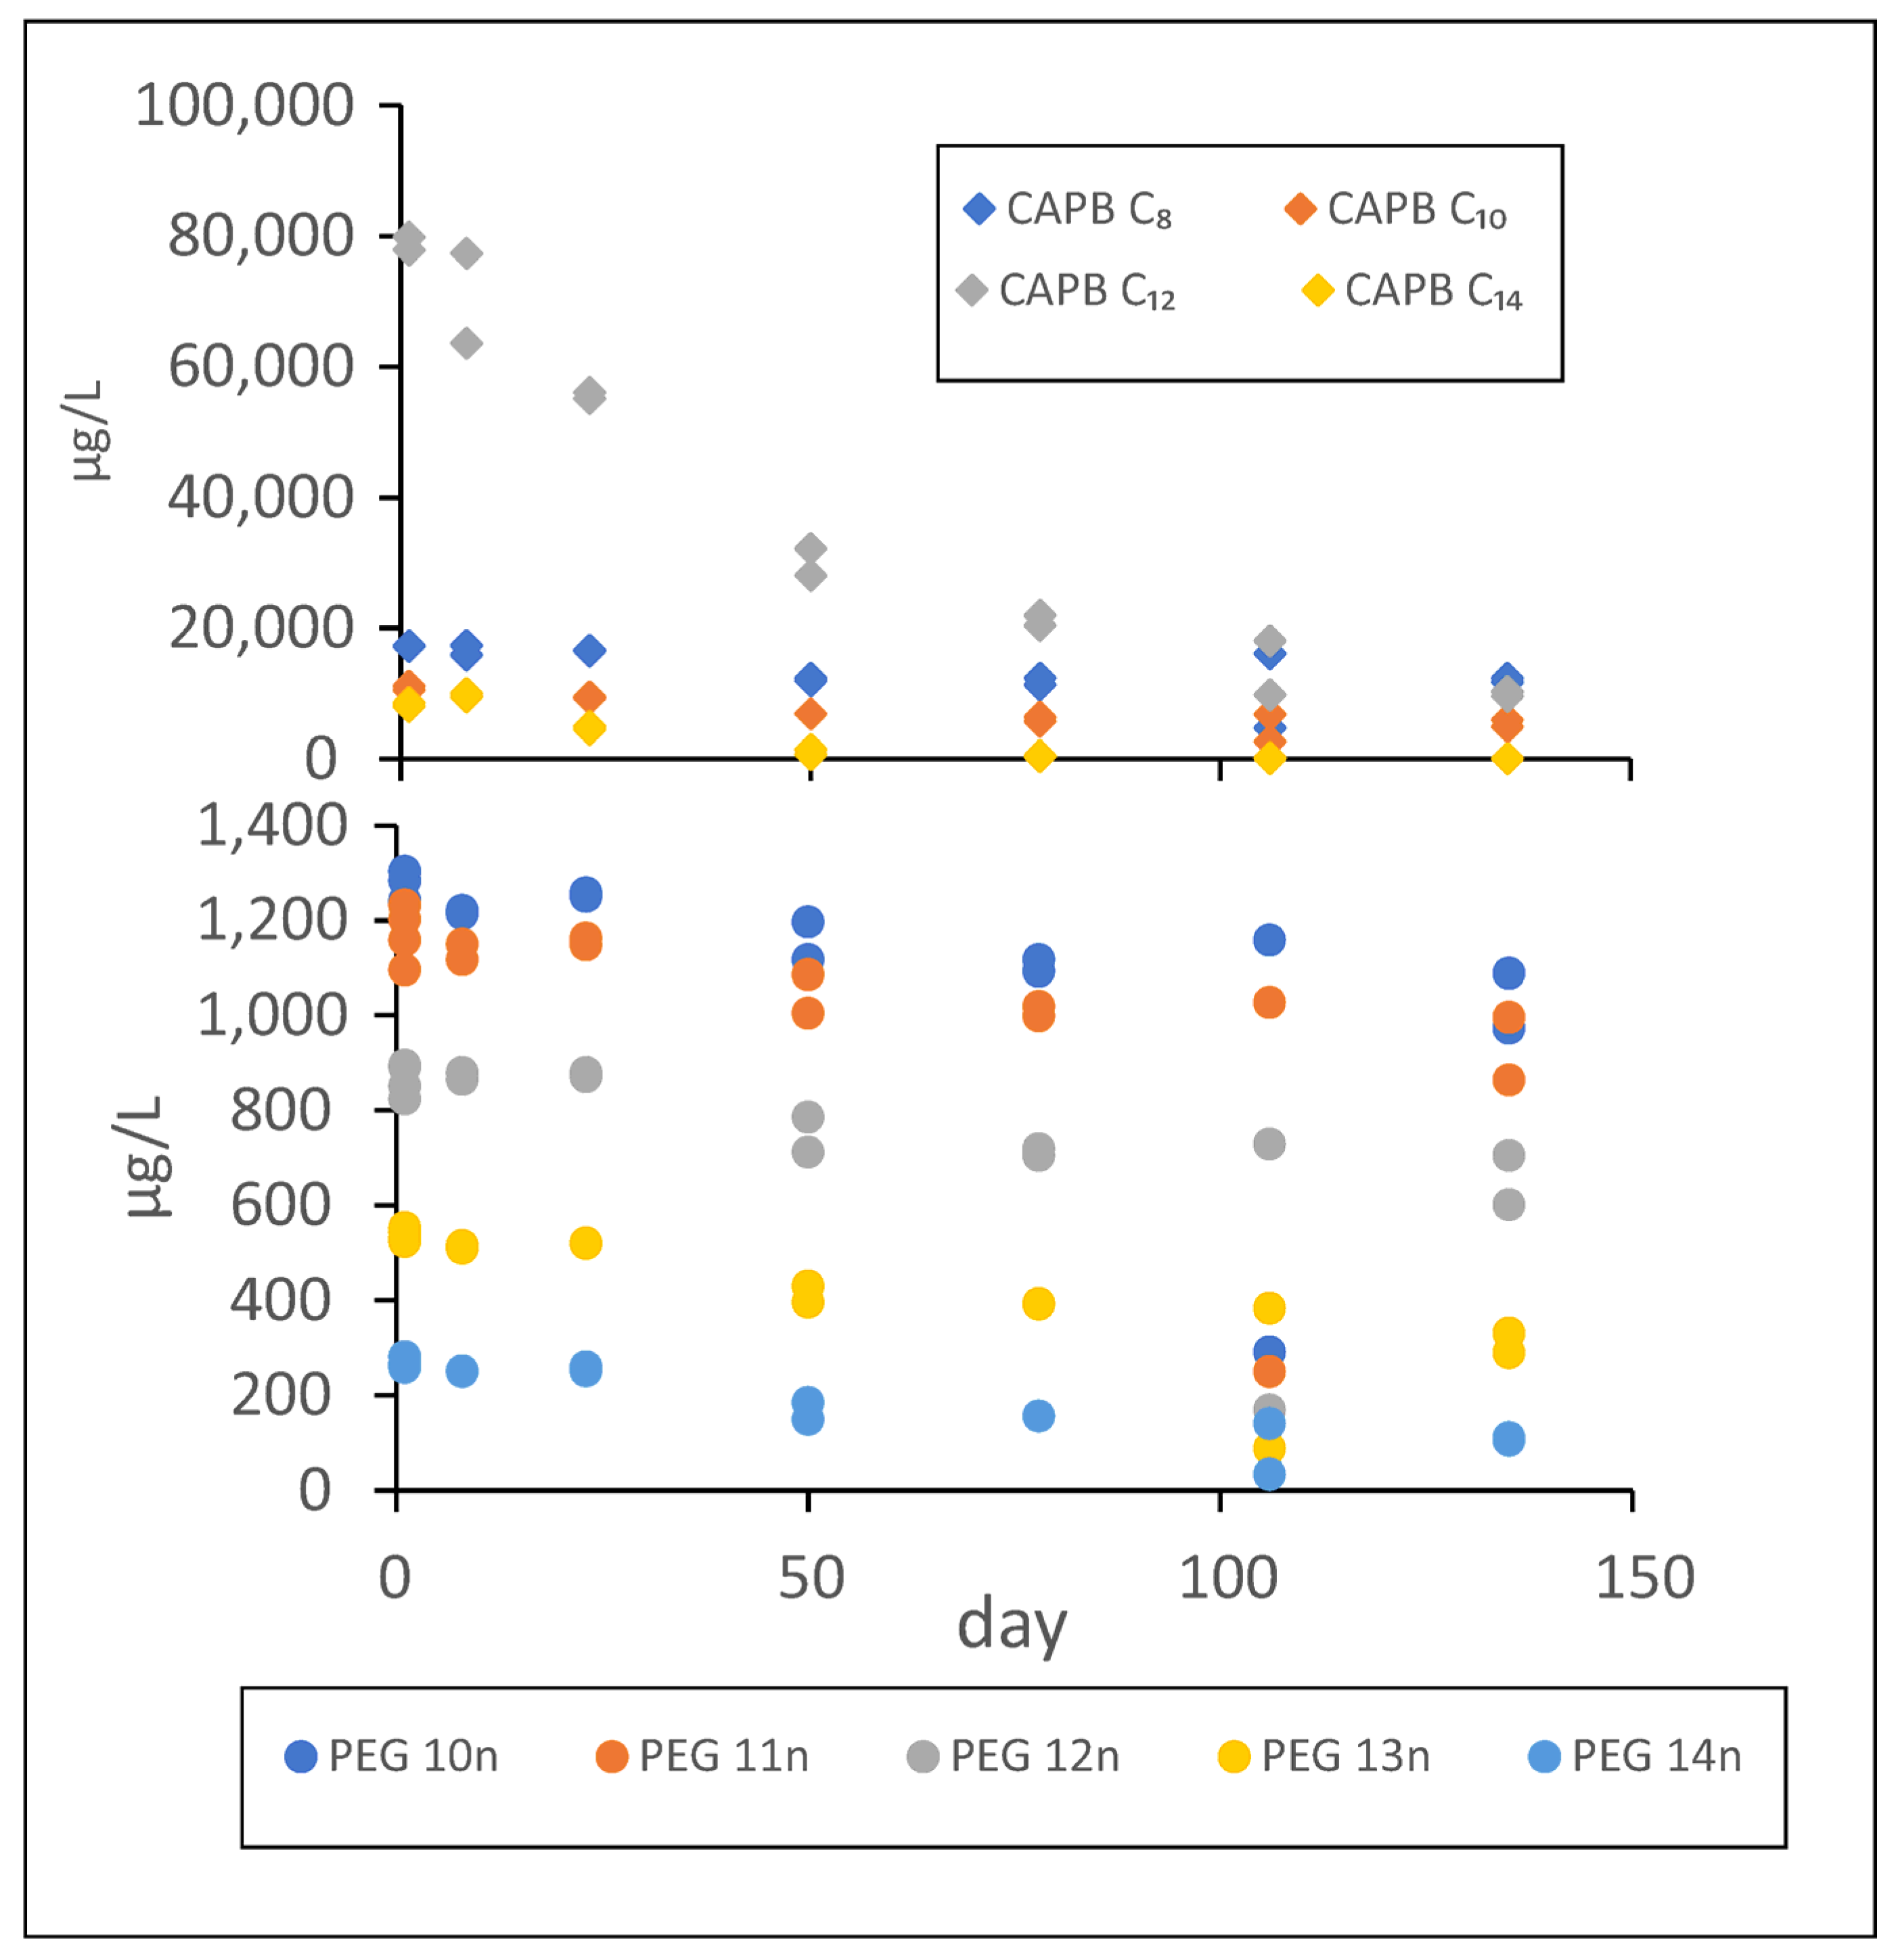
3.6. Biodegradation of Cocamidopropyl Betaine

The CAPB components (betaines) showed a tendency for persistence, and slow biodegradation over time in some of the batches (Figure 7, Table S7.1). The shortest apparent half-lives (t½) were for the Saskatchewan and Ontario tests at 25 °C (65 to 68 d) (Figure 7).
Overall, the C12 betaines seemed to be the most readily degraded (Figure 8). It is possible that the biodegradation process resulted in the shortening of the carbon chains, thus shorter chains (C8, C10) only appeared to be more persistent. Our results suggest that under some anaerobic groundwater conditions (i.e., our microcosms), the CAPB components may be useful indicators of FF impacts on groundwater.
Rapid rates of the biodegradation of cocamidopropyl betaine have been reported in previous laboratory tests [43,57,58,59,60,61,62]. Based on our results, the previous experiments may not be relevant for all environmental conditions, particularly in groundwater and under anaerobic conditions.

3.7. Biodegradation of Polyethylene Glycols

The polyethylene glycols (PEGs) tended to persist in the microcosm tests, with slow biodegradation over time in a few of the microcosms (Figure 7, Table S7.1). The shortest apparent half-life (t½) was for the Saskatchewan test at 25 °C (212 d) (Figure 7).
In the Ontario tests at 25 °C, the highest molecular weight PEGs appeared to have biodegraded the fastest (Figure 8). Perhaps the biodegradation process resulted in the shortening of the carbon chains, thus shorter chains appeared to be more persistent.
As summarized by Kawai [63], the biodegradation of PEGs has been investigated for more than 50 years. In microcosms that contained groundwater and “soil” from the site in Alberta, Canada, Mrklas et al. [54] reported that ethylene glycol and triethylene glycol were readily biodegraded under aerobic conditions, but persisted (slow biodegradation) under anaerobic conditions. More recently, McLaughlin et al. [64] reported on the biodegradation and sorption of PEGs in soil. Previous studies have demonstrated that the biodegradation rate can be strongly affected by the presence of biocides, salt, etc. [64]. Reaction with other FF chemicals must also be considered [64]. In a field study of fracturing fluids and produced waters, McAdams et al. [27] inferred a possible downhole transformation of alkyl ethoxylates to PEGs through central cleavage of the ethoxylate chain from the alkyl group. This possibly could explain the rise in PEG concentrations in the early stages of some batch tests in our study.

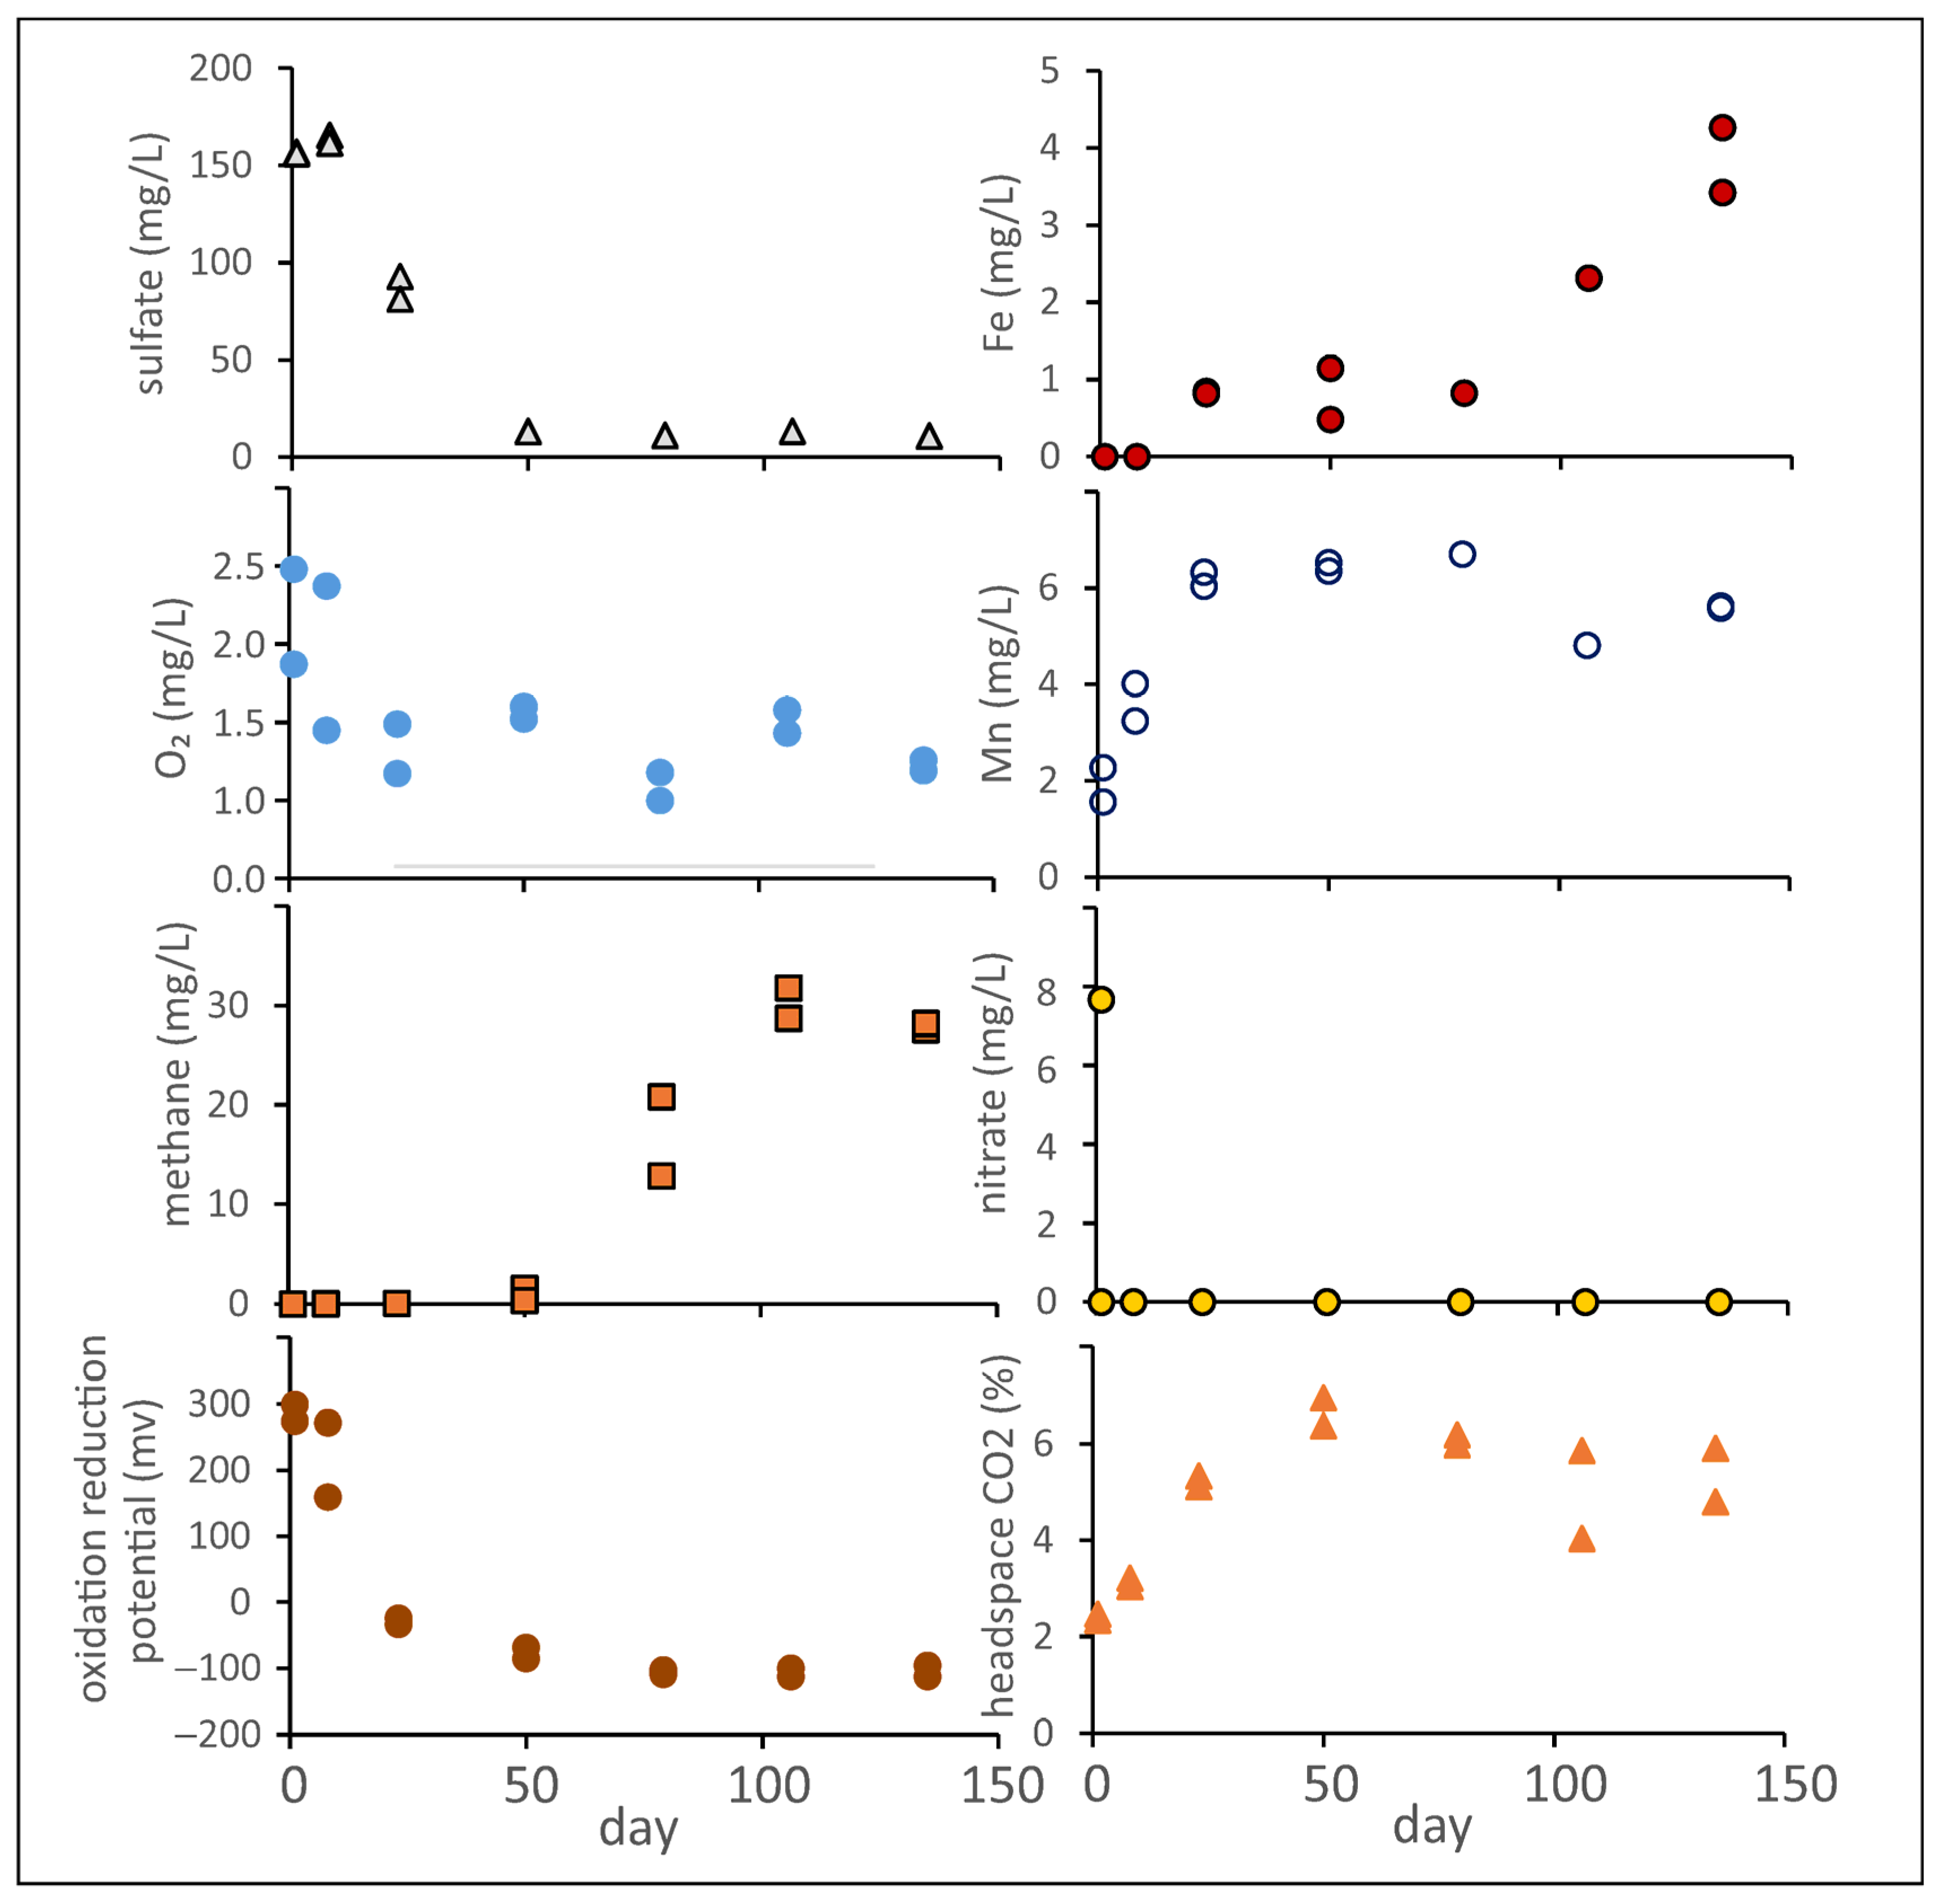
3.8. Trends in Dissolved Oxygen, Nitrate, Sulfate, Methane, Iron, and Manganese

Development of low O2 or anaerobic conditions in the microcosms was indicated by low levels and/or losses of O2, and changes in the concentration of other redox-indicator species: declines in concentrations of NO3 and/or SO42−, increases in dissolved Fe, Mn concentrations, and appearances of methane (Figure 6). Such trends are the result of microbial metabolism, in which O2 is consumed by aerobic microbial processes; nitrogen, sulfur, iron, and manganese are reduced via anaerobic microbial processes [65], and methane is produced during anoxic decomposition of organic matter by methanogenic microorganisms [66]. Sulfide odor was detected in some headspaces and black precipitates, possibly metal sulfides (Table S8.2 in Supplementary Material). These observations probably indicate anaerobic microbial reduction of sulfate to sulfide [65]. Some of the observed redox-indicator trends were statistically significant, based on Pearson correlation tests (Table S8.1 in Supplementary Material). Note, however, that this test does not take into consideration nonlinear trends. The observed trends (Figure 6, Table S8.1) indicate the activity of anaerobic microorganisms, suggesting the possible role of such microorganisms in the biodegradation of FF chemicals.

4. Discussion

In this study, some FF chemicals were persistent, even though biocides, which are often included in fracturing fluids, were deliberately excluded. If biocides had been included, some of the FF chemicals would likely have been more persistent, based on earlier studies of the effects of biocides [51,64].
Overall, of the potentially diagnostic FF chemicals investigated, the relatively hydrophilic and persistent lower molecular weight polyethylene glycols appear to be some of the most promising as potential indicators of FF impacts. While it may be possible to use some persistent and mobile chemical components of FF as diagnostic indicators, tracking their fate and behavior may be even better if they are analyzed along with other, non-diagnostic but mobile and persistent, FF chemicals, such as boron and/or chloride (dependent on mixtures of FF chemicals used), to determine the impacts of FF on the groundwater in the vicinity.
The differential sorption behavior observed in this study has also been observed previously for other mixtures of chemicals (e.g., petroleum hydrocarbons), and clearly demonstrates that attenuation by sorption during groundwater flow can result in preferential transport of the more hydrophilic members of complex mixtures of synthetic FF chemicals, thus potentially strongly altering the chemistry of the contaminant plumes containing these mixtures along their flow paths. As demonstrated in this study, sorption will vary from sediment to sediment, thus relatively hydrophobic chemicals may still be somewhat mobile in groundwater in sediments that have relatively low organic carbon and/or clay content. Also, rapid movement of FF along fractures may minimize the extent of sorption of the FF chemicals.
For some compounds that have been observed to be readily biodegradable in earlier studies (for example, in aerobic soil environments), this study provided clear evidence for their greater/longer persistence in simulated groundwater conditions, with limited O2 and/or anaerobic conditions, including some of our tests at cold temperatures (5 °C). For example, diethanolamine was reported to be readily biodegradable in the review by Stringfellow [67], but was found to be persistent in all tests in this study. Similarly, though isopropanol has been reported to be readily biodegradable [67], it persisted at relatively high concentrations for 135 days in most of our 5 °C intact batch tests (i.e., simulated groundwater conditions). The fact that some FF chemicals may be relatively persistent in groundwater, compared to soil or surface water environments, needs to be taken into consideration when predicting and modeling their fate in the environment.

Suggested Future Studies

Many FF chemicals that have been used at various locations in Canada and elsewhere were not included in this study. More research would be required to select key, definitive indicators that can be applied to the various areas or sites where FF is being practiced.
Some of the analytical methods developed in this study would not be easily transferable for routine commercial application, in part due to the expensive and specialized instruments that were used. In these cases, follow-up method development is needed to advance the findings of this study and to provide practical techniques that can be applied for commercial analyses, using other instruments (for example, to analyze the mixtures of polyethylene glycols and betaines).
During this study, no access was gained to collect groundwater at FF field sites (immediate vicinity of where FF has or is being practiced). For this reason, this study only included microcosm and column tests to simulate groundwater conditions. If possible, future research should include onsite sampling at FF field sites.
Ethoxylated alcohols were only added to the initial batches, and were not detectable even in the earliest samples, suggesting that they were very rapidly lost by biodegradation and/or chemical reaction. Because the purpose of this study was to focus on relatively stable compounds that might be suitable as indicators of FF impacts, there was no further investigation of the fate of these compounds, and they were excluded from the second round of batch tests. However, given the uncertainty regarding the fate of these compounds, further testing is recommended.

5. Conclusions

We report successful development of methods to analyze some of the complex mixtures of synthetic organic chemicals that are used in fracturing fluids (polyethylene glycols, ethoxylated alcohols, and cocamidopropyl betaine components) at concentrations many orders of magnitude below typical concentrations that may be used for FF. Few previous methods have been published or are readily available for commercial analysis of these mixtures in environmental waters. The methods published here can be used to assist future research on the occurrence and fate of these chemicals in environmental waters potentially affected by fracturing fluids.
To our knowledge, this study includes the first reported experiment to investigate the behavior of mixtures of cocamidopropyl betaines in simulated groundwater environments. The batch tests also included mixtures of polyethylene glycols, for which little if any information on fate in groundwater was previously available.
Some of the chemicals that are potentially diagnostic of FF were found to be persistent under anaerobic conditions in most of the simulated groundwater batch tests. These included polyethylene glycols, CAPB components, and ethanolamines. These chemicals tended to maintain relatively stable concentrations over the duration of the batch tests, in both the sterile and intact batches (both synthetic FF, both 5 °C and 25 °C). The shortest apparent half-lives were for isopropanol and ethyl hexanol at 25 °C (t½ < 11 days), though they were more persistent at 5 °C (t½ ≥ 29 d). The most persistent synthetic chemicals were polyethylene glycols (t½ ≥ 182 d), diethanolamine (t½ ≥ 334 d), and triethanolamine (t½ ≥ 212 d).
Sorption was negligible (sorption coefficient, Kd~0.0) for some of the synthetic chemicals (polyethylene glycol, ethanolamines, isopropanol, and ethyl hexanol) in some tests. At the other extreme, strong sorption was observed for some of the higher molecular weight cocamido propyl betaine (max Kd = 1.17) and polyethylene glycol (max Kd = 1.12) components, and triethanolamine (max Kd = 0.47) in other tests.
Of the “potentially diagnostic” FF chemicals that we investigated, the relatively hydrophilic and persistent lower molecular weight polyethylene glycols appear to be the most promising as potential indicators of FF impacts. At sites where they have been components of FF, it may be possible to use them together with other, non-diagnostic but mobile and persistent, FF chemicals (dependent on mixtures of FF chemicals used) to determine the impacts of FF on the groundwater in the vicinity.

Supplementary Materials

The following supporting information can be downloaded at: https://www.mdpi.com/article/10.3390/pollutants4030026/s1, S1. Background information: chemicals used in fracturing fluids; S2. Sediment samples used in batch and column tests; S3. Column test apparatus and procedures; S4. Analytical methods to measure concentrations of synthetic fracturing fluid chemicals; S5. Analyte detection limits, error bars, concentrations in synthetic fracturing fluids, standards and batch tests; S6. Evidence for sorption of fracturing fluid chemicals in the batch tests; S7. Evidence for biodegradation of fracturing fluid chemicals in the batch tests; S8. Results of analyses of redox indicators and CO2 in batch tests; S9. Data compilation of analytical results for this study (Excel file).

Author Contributions

Conceptualization, D.R.V.S.; Data curation, S.B. and P.C.; Formal analysis, S.B., P.K. and P.C.; Funding acquisition, D.R.V.S.; Investigation, P.K.; Methodology, D.R.V.S. and S.B.; Supervision, D.R.V.S.; Writing—original draft, D.R.V.S.; Writing—review and editing, S.B., P.K. and P.C. All authors have read and agreed to the published version of the manuscript.

Funding

This research project was funded by the Government of Canada under the federal ecoEnergy Innovation Initiative, and by Environment and Climate Change Canada (ECCC). ECCC also provided the funding for the APC.

Data Availability Statement

Data from this study is provided in the Supplementary Materials (S9).

Acknowledgments

Randy Schmidt (Environment and Climate Change Canada) provided the Saskatchewan samples of groundwater and sediment. Christine Rivard (Natural Resources Canada) provided the Quebec samples of groundwater and sediment. Jim Roy (Environment and Climate Change Canada) provided valuable advice during the planning and laboratory experiment phases of this study.

Conflicts of Interest

The authors declare that they have no conflicts of interest.

References

  1. King, G.E. Thirty Years of Gas Shale Fracturing: What Have We Learned? In Proceedings of the SPE Annual Technical Conference and Exhibition (SPE 133456), Florence, Italy, 19–22 September 2010. [Google Scholar]
  2. Stevens, S.; Kuuskraa, V. Special Report: Gas Shale-1: Seven Plays Dominate North America Activity. Oil Gas J. 2009, 107, 36–41. [Google Scholar]
  3. Canada Energy Regulator. Canada Energy Future 2023: Energy Supply and Demand Projections to 2050. Available online: https://www.cer-rec.gc.ca/en/data-analysis/canada-energy-future/2023/canada-energy-futures-2023.pdf (accessed on 15 July 2024).
  4. Shaheen, S.; Wen, T.; Herman, A.; Brantley, S.L. Geochemical evidence of potential groundwater contamination with human health risks where hydraulic fracturing overlaps with extensive legacy hydrocarbon extraction. Environ. Sci. Technol. 2022, 56, 10010–10019. [Google Scholar] [CrossRef] [PubMed]
  5. Gordalla, B.C.; Ewers, U.; Frimmel, F.H. Hydraulic fracturing: A toxicological threat for groundwater and drinking-water? Environ. Earth Sci. 2013, 70, 3875–3893. [Google Scholar] [CrossRef]
  6. Birdsell, D.T.; Rajaram, H.; Dempsey, D.; Viswanathan, H.S. Hydraulic fracturing fluid migration in the subsurface: A review and expanded modeling results. Water Resour. Res. 2015, 51, 7159–7188. [Google Scholar] [CrossRef]
  7. Jasechko, S.; Perrone, D. Hydraulic fracturing near domestic groundwater wells. Proc. Natl. Acad. Sci. USA 2017, 114, 13138–13143. [Google Scholar] [CrossRef] [PubMed]
  8. Taherdangkoo, R.; Tatomir, A.; Anighoro, T.; Sauter, M. Modeling fate and transport of hydraulic fracturing fluid in the presence of abandoned wells. J. Contam. Hydrol. 2019, 221, 58–68. [Google Scholar] [CrossRef] [PubMed]
  9. Taherdangkoo, R.; Tatomir, A.; Taherdangkoo, M.; Qiu, P.; Sauter, M. Nonlinear autoregressive neural networks to predict hydraulic fracturing fluid leakage into shallow groundwater. Water 2020, 12, 841. [Google Scholar] [CrossRef]
  10. Mallants, D.; Bekele, E.; Schmid, W.; Miotlinski, K.; Taylor, A.; Gerke, K.; Gray, B. A generic method for predicting environmental concentrations of hydraulic fracturing chemicals in soil and shallow groundwater. Water 2020, 12, 941. [Google Scholar] [CrossRef]
  11. Jackson, R.E.; Gorody, A.W.; Mayer, B.; Roy, J.W.; Ryan, M.C.; Van Stempvoort, D.R. Groundwater protection and unconventional gas extraction: The critical need for field-based hydrogeological research. Groundwater 2013, 51, 488–510. [Google Scholar] [CrossRef]
  12. Vidic, R.D.; Brantley, S.L.; Vandenbossche, J.M.; Yoxtheimer, D.; Abad, J.D. Impact of shale gas development on regional water quality. Science 2013, 340, 1235009. [Google Scholar] [CrossRef]
  13. Lacoursière, J.-P.; Lacoursière, S. Étude De Risques Technologiques Associés À L’extraction Du Gaz De Schiste. Étude E3-4, Préparé pour: L’Évaluation Environnementale stratégique sur le gaz de schiste; Département de Génie Chimique, Université de Sherbrooke, JP Lacoursière Inc.: Repentigny, QC, Canada, 2013. [Google Scholar]
  14. Vengosh, A.; Jackson, R.B.; Warner, N.; Darrah, T.H.; Kondash, A. Critical review of the risks to water resources from unconventional shale gas development and hydraulic fracturing in the United States. Environ. Sci. Technol. 2014, 48, 8334–8348. [Google Scholar] [CrossRef] [PubMed]
  15. Adgate, J.L.; Goldstein, B.D.; McKenzie, L.M. Potential public health hazards, exposures and health effects from unconventional natural gas development. Environ. Sci. Technol. 2014, 48, 8307–8320. [Google Scholar] [CrossRef] [PubMed]
  16. U.S. Environmental Protection Agency. Assessment of the Potential Impacts of Hydraulic Fracturing for Oil and Gas on Drinking Water Resources; EPA/600/R-15/047a External Review Draft; Office of Research and Development: Washington, DC, USA, 2015. [Google Scholar]
  17. Elsner, M.; Hoelzer, K. Quantitative survey and structural classification of hydraulic fracturing chemicals reported in unconventional gas production. Environ. Sci. Technol. 2016, 50, 3290–3314. [Google Scholar] [CrossRef] [PubMed]
  18. Luek, J.L.; Michael Gonsior, M. Organic compounds in hydraulic fracturing fluids and wastewaters: A review. Water Res. 2017, 123, 536–548. [Google Scholar] [CrossRef] [PubMed]
  19. Blake, U. Designing a water quality program for shale exploration. In Proceedings of the Technical Workshops for the Hydraulic Fracturing Study: Chemical & Analytical Methods, Arlington, VA, USA, 24–25 February 2011. Publication No. EPA 600-R-11-066. [Google Scholar]
  20. McGrath, A.E. Fate and transport of select compounds of potential concern (COPC) in fracing fluids. In Proceedings of the Technical Workshops for the Hydraulic Fracturing Study: Fate & Transport, Arlington, VA, USA, 24–25 February 2011. Publication No. EPA 600-R-11-047. [Google Scholar]
  21. Aminto, A.; Stone Olson, M. Four-compartment partition model of hazardous components in hydraulic fracturing fluid additives. J. Nat. Gas Sci. Eng. 2012, 7, 16–21. [Google Scholar] [CrossRef]
  22. Bibby, K.J.; Brantley, S.L.; Reible, D.D.; Linden, K.G.; Mouser, P.J.; Gregory, K.B.; Ellis, B.R.; Vidic, R.D. Suggested reporting parameters for investigations of wastewater from unconventional shale gas extraction. Environ. Sci. Technol. 2013, 47, 13220–13221. [Google Scholar] [CrossRef] [PubMed]
  23. Rosenblum, J.; Thurman, E.M.; Ferrer, I.; Aiken, G.; Linden, K.G. Organic Chemical Characterization and Mass Balance of a Hydraulically Fractured Well: From Fracturing Fluid to Produced Water over 405 Days. Environ. Sci. Technol. 2017, 51, 14006–14015. [Google Scholar] [CrossRef] [PubMed]
  24. Thurman, E.M.; Ferrer, I.; Blotevogel, J.; Borch, T. Analysis of hydraulic fracturing flowback and produced waters using accurate mass: Identification of ethoxylated surfactants. Anal. Chem. 2014, 86, 9653–9661. [Google Scholar] [CrossRef] [PubMed]
  25. Thurman, E.M.; Ferrer, I.; Rosenblum, J.; Linden, K.; Ryan, J.N. Identification of polypropylene glycols and polyethylene glycol carboxylates in flowback and produced water from hydraulic fracturing. J. Hazard. Mater. 2017, 323, 11–17. [Google Scholar] [CrossRef]
  26. Llewellyn, G.T.; Dorman, F.; Westland, J.L.; Yoxtheimer, D.; Grieve, P.; Sowers, T.; Humston-Fulmer, E.; Brantley, S.L. Evaluating a groundwater supply contamination incident attributed to Marcellus Shale gas development. Proc. Natl. Acad. Sci. USA 2015, 112, 6325–6330. [Google Scholar] [CrossRef]
  27. McAdams, B.C.; Carter, K.E.; Blotevogel, J.; Borch, T.; Hakala, J.A. In situ transformation of hydraulic fracturing surfactants from well injection to produced water. Environ. Sci. Process. Impacts 2019, 21, 1777–1786. [Google Scholar] [CrossRef] [PubMed]
  28. Sitterley, K.A.; Silverstein, J.; Rosenblum, J.; Linden, K.G. Aerobic biological degradation of organic matter and fracturing fluid additives in high salinity hydraulic fracturing wastewaters. Sci. Total Environ. 2021, 758, 143622. [Google Scholar] [CrossRef] [PubMed]
  29. Asadi, M.; Woodroof, R.A.; Himes, R.E. Comparative Study of Flowback Analysis Using Polymer Concentrations and Fracturing-Fluid Tracer Methods: A Field Study. SPE Prod. Oper. 2008, 23, 147–157. [Google Scholar] [CrossRef]
  30. Li, G. Oilfield Tracer Analysis and Application for Hydraulic Fracture Diagnostics. Master’s Thesis, Texas A&M University, College Station, TX, USA, May 2021. [Google Scholar]
  31. Gross, S.A.; Avens, H.J.; Banducci, A.M.; Sahmel, J.; Panko, J.M.; Tvermoes, B.E. Analysis of BTEX groundwater concentrations from surface spills associated with hydraulic fracturing operations. J. Air Waste Manag. Assoc. 2013, 63, 424–432. [Google Scholar] [CrossRef] [PubMed]
  32. Fontenot, B.E.; Hunt, L.R.; Hildenbrand, Z.L.; Carlton, D.D.; Oka, H.; Walton, J.L.; Hopkins, D.; Osorio, A.; Bjorndal, B.; Hu, Q.H.; et al. An evaluation of water quality in private drinking water wells near natural gas extraction sites in the Barnett shale formation. Environ. Sci. Technol. 2013, 47, 10032–10040. [Google Scholar] [CrossRef] [PubMed]
  33. Hildenbrand, Z.L.; Carlton, D.D.; Fontenot, B.E.; Meik, J.M.; Walton, J.L.; Thacker, J.B.; Korlie, S.; Shelor, C.P.; Kadjo, A.F.; Clark, A.; et al. Temporal variation in groundwater quality in the Permian Basin of Texas, a region of increasing unconventional oil and gas development. Sci. Total Environ. 2016, 562, 906–913. [Google Scholar] [CrossRef] [PubMed]
  34. McMahon, P.B.; Barlow, J.R.; Engle, M.A.; Belitz, K.; Ging, P.B.; Hunt, A.G.; Jurgens, B.C.; Kharaka, Y.K.; Tollett, R.W.; Kresse, T.M. Methane and benzene in drinking-water wells overlying the Eagle Ford, Fayetteville, and Haynesville shale hydrocarbon production areas. Environ. Sci. Technol. 2017, 51, 6727–6734. [Google Scholar] [CrossRef]
  35. Rodriguez, J.; Heo, J.; Kim, K.H. The impact of hydraulic fracturing on groundwater quality in the Permian Basin, West Texas, USA. Water 2020, 12, 796. [Google Scholar] [CrossRef]
  36. DiGiulio, D.C.; Jackson, R.B. Impact to underground sources of drinking water and domestic wells from production well stimulation and completion practices in the Pavillion, Wyoming, field. Environ. Sci. Technol. 2016, 50, 4524–4536. [Google Scholar] [CrossRef]
  37. Xiong, B.; Soriano, M.A., Jr.; Gutchess, K.M.; Hoffman, N.; Clark, C.J.; Siegel, H.G.; De Vera, G.A.D.; Li, Y.; Brenneis, R.J.; Cox, A.J.; et al. Groundwaters in Northeastern Pennsylvania near intense hydraulic fracturing activities exhibit few organic chemical impacts. Environ. Sci. Process. Impacts 2022, 24, 252–264. [Google Scholar] [CrossRef]
  38. BC Oil & Gas Commission, 2014–2016 (Years Accessed). FracFocus, a Website with an Online Database Listing the Chemicals Used in Fracturing Fluids in Canada, on a Well by Well Basis (Primarily British Columbia, Alberta, Saskatchewan). This Project Is Intended “to Provide Objective Information on Hydraulic Fracturing. Fracturing Fluids, Groundwater and Surface Water Protection and Related Oil and Gas Activities in Canada”. Available online: http://fracfocus.ca/ (accessed on 2 June 2016).
  39. Fiorenza, S.; Duston, K.L.; Ward, C.H. Decision making—Is bioremediation a viable option? J. Hazard. Mater. 1991, 28, 171–183. [Google Scholar] [CrossRef]
  40. Wang, L.J.; Schnute, W.C. Quantitative RSLC-MS/MS Analysis of Nitrogen Mustard Hydrolysis Products as Ethanolamines in Water Samples; Dionex Corporation: Sunnyvale, CA, USA, 2011. [Google Scholar]
  41. Doucette, W.J. Quantitative structure-activity relationships for predicting soil-sediment sorption coefficients for organic chemicals. Environ. Toxicol. Chem. 2003, 22, 1771–1788. [Google Scholar] [CrossRef]
  42. Grathwohl, P.; Farrell, J.; Reinhard, M. Desorption kinetics of volatile organic contaminants from aquifer materials. In Contaminated Soil ‘90, Third KfK/TNO Conference; Arendt, F., Ed.; Kluwer: Karlsruhe, Germany, 1990; Volume I, pp. 343–350. [Google Scholar]
  43. Eichhorn, P.; Knepper, T.P. Electrospray ionization mass spectrometric studies on the amphoteric surfactant cocamidopropylbetaine. J. Mass Spectrom. 2001, 36, 677–684. [Google Scholar] [CrossRef] [PubMed]
  44. Davis, J.W. Physico-chemical factors influencing ethyleneamine sorption to soil. Environ. Toxicol. Chem. 1993, 12, 27–35. [Google Scholar]
  45. Hawthorne, S.B.; Kubátová, A.; Gallagher, J.R.; Sorensen, J.A.; Miller, D.J. Persistence and biodegradation of monoethanolamine and 2-propanolamine at an abandoned industrial site. Environ. Sci. Technol. 2005, 39, 3639–3645. [Google Scholar] [CrossRef]
  46. Schrap, S.M.; Opperhuizen, A. On the contradictions between experimental sorption data and the sorption partitioning model. Chemosphere 1992, 24, 1259–1282. [Google Scholar] [CrossRef]
  47. Kekacs, D.; Drollette, B.D.; Brooker, M.; Plata, D.L.; Mouser, P.J. Aerobic biodegradation of organic compounds in hydraulic fracturing fluids. Biodegradation 2015, 26, 271–287. [Google Scholar] [CrossRef] [PubMed]
  48. Heyob, K.M.; Blotevogel, J.; Brooker, M.; Evans, M.V.; Lenhart, J.J.; Wright, J.; Lamendella, R.; Borch, T.; Mouser, P.J. Natural Attenuation of Nonionic Surfactants Used in Hydraulic Fracturing Fluids: Degradation Rates, Pathways, and Mechanisms. Environ. Sci. Technol. 2017, 51, 13985–13994. [Google Scholar] [CrossRef] [PubMed]
  49. Bustard, M.T.; McEvoy, E.M.; Goodwin, J.A.S.; Burgess, J.G.; Wright, P.C. Biodegradation of propanol and isopropanol by a mixed microbial consortium. Appl. Microbiol. Biotechnol. 2000, 54, 424–431. [Google Scholar] [CrossRef]
  50. Rogers, J.D.; Ferrer, I.; Tummings, S.S.; Bielefeldt, A.R.; Ryan, J.N. Inhibition of Biodegradation of Hydraulic Fracturing Compounds by Glutaraldehyde: Groundwater Column and Microcosm Experiments. Environ. Sci. Technol. 2017, 51, 10251–10261. [Google Scholar] [CrossRef]
  51. Akyon, B.; Lipus, D.; Bibby, K. Glutaraldehyde inhibits biological treatment of organic additives in hydraulic fracturing produced water. Sci. Total Environ. 2019, 666, 1161–1168. [Google Scholar] [CrossRef]
  52. Knapp, J.S.; Jenkey, N.D.; Townsley, C.C. The anaerobic biodegradation of diethanolamine by a nitrate reducing bacterium. Biodegradation 1996, 7, 183–189. [Google Scholar] [CrossRef] [PubMed]
  53. West, R.J.; Gonsior, S.J. Biodegradation of triethanolamine. Environ. Toxicol. Chem. 1996, 15, 472–480. [Google Scholar] [CrossRef]
  54. Mrklas, O.; Chu, A.; Lunn, S.; Bentley, L.R. Biodegradation of monoethanolamine, ethylene glycol and triethylene glycol in laboratory bioreactors. Water Air Soil Pollut. 2004, 159, 249–263. [Google Scholar] [CrossRef]
  55. Speranza, G.; Morelli, C.F.; Cairoli, P.; Müller, B.; Schink, B. Mechanism of anaerobic degradation of triethanolamine by a homoacetogenic bacterium. Biochem. Biophys. Res. Commun. 2006, 349, 480–484. [Google Scholar] [CrossRef]
  56. Kookana, R.S.; Williams, M.; Gregg, A.; Semmler, A.; Du, J.; Apte, S.C. Sorption, degradation and microbial toxicity of chemicals associated with hydraulic fracturing fluid and produced water in soils. Environ. Pollut. 2022, 309, 119754. [Google Scholar] [CrossRef]
  57. Garcia, M.T.; Campos, E.; Marsal, A.; Ribosa, I. Fate and effects of amphoteric surfactants in the aquatic environment. Environ. Int. 2008, 34, 1001–1005. [Google Scholar] [CrossRef] [PubMed]
  58. Garland, J.L.; Levine, L.H.; Yorio, N.C.; Hummerick, M.E. Response of graywater recycling systems based on hydroponic plant growth to three classes of surfactants. Water Res. 2004, 38, 1952–1962. [Google Scholar] [CrossRef] [PubMed]
  59. Vonlanthen, S.; Brown, M.T.; Turner, A. Toxicity of the amphoteric surfactant, cocamidopropyl betaine, to the marine macroalga, Ulva lactuca. Ecotoxicology 2011, 20, 202–207. [Google Scholar] [CrossRef]
  60. Gheorghe, S.; Lucaciu, I.; Pascu, L. Biodegradability assessment of cationic and amphoteric raw materials. J. Environ. Prot. Ecol. 2012, 13, 155–163. [Google Scholar]
  61. Blagojević, S.N.; Blagojević, S.M.; Pejić, N.D. Performance and Efficiency of Anionic Dishwashing Liquids with Amphoteric and Nonionic Surfactants. J. Surfactants Deterg. 2016, 19, 363–372. [Google Scholar] [CrossRef]
  62. Burlachenko, A.S.; Salishcheva, O.V.; Dyshlyuk, L.S.; Prosekov, A.Y. Investigation of the kinetic regularities of the process of biodegradation of betaine surfactant by bacteria of the genus pseudomonas. Appl. Sci. 2021, 11, 8939. [Google Scholar] [CrossRef]
  63. Kawai, F. Biodegradation of polyethylene glycols and polyethoxylated surfactants. In Polyethers and Polyethylene Glycol: Characterization, Properties and Applications; Williams, J., Ed.; Nova Science Pub Inc.: Hauppauge, NY, USA, 2015; pp. 27–50. [Google Scholar]
  64. McLaughlin, M.C.; Borch, T.; Blotevogel, J. Spills of hydraulic fracturing chemicals on agricultural topsoil: Biodegradation, sorption, and co-contaminant interactions. Environ. Sci. Technol. 2016, 50, 6071–6078. [Google Scholar] [CrossRef] [PubMed]
  65. Burgin, A.J.; Yang, W.H.; Hamilton, S.K.; Silver, W.L. Beyond carbon and nitrogen: How the microbial energy economy couples elemental cycles in diverse ecosystems. Front. Ecol. Environ. 2011, 9, 44–52. [Google Scholar] [CrossRef]
  66. Grbić-Galić, D. Methanogenic transformation of aromatic hydrocarbons and phenols in groundwater aquifers. Geomicrobiol. J. 1990, 8, 167–200. [Google Scholar] [CrossRef]
  67. Stringfellow, W.T.; Domen, J.K.; Camarillo, M.K.; Sandelin, W.L.; Borglin, S. Physical, chemical, and biological characteristics of compounds used in hydraulic fracturing. J. Hazard. Mater. 2014, 275, 37–54. [Google Scholar] [CrossRef]
Figure 1. Comparison of concentrations of selected fracturing fluid chemicals in groundwater only (“gw only”) controls and groundwater and sediment (“gw + sed”) batch tests, on day 1 of each test (a few data points for day 0). (CAPB = cocamidopropyl betaine components; PEG = polyethylene glycols).
Pollutants 04 00026 g001
Figure 2. Sorption (distribution) coefficients (Kd) (see equations 1 through 3) for various fracturing fluid chemicals based on batch tests with the SKC fracturing fluid added to sediment and groundwater from Saskatchewan, Quebec, and Ontario. Higher values indicate stronger sorption. Cocamidopropyl betaine (CAPB) is a mixture of components with a common molecular structure represented by the formula C7H15N2O3(CnH2n−1), where n ranged from 8 to 14 (abbreviated here as C8 to C14). Also shown are results for CAPB C8 to C14 in a column test with Saskatchewan sediment and groundwater. Polyethylene glycols (PEG) included a complex mixture of homologues, sharing the same molecular structure (C2nH4n+2On+1), where n in this formula ranged from 10 to 14 (abbreviated here as 10n to 14n). See Table S6.2 in Supplementary Material for details.
Pollutants 04 00026 g002
Figure 3. Chromatographic separation of the C8 and C10 CAPB components (see caption of Figure 2) in the sediment column test. The ratio C/Csource refers to concentrations in samples collected at the exit end of the column (C) and concentrations in the source solution (Csource) that were pumped into the column. A pore volume is the total volume of pore space between sediment grains in the column. See the Supplementary Material (S3) for explanation of the test.
Pollutants 04 00026 g003
Figure 4. Examples of declines over time in concentrations of synthetic organic fracturing fluid (FF) chemicals added to batch tests, and appearance of acetone, which is inferred to be a metabolite of one or more FF chemicals (e.g., isopropanol, see text). Both graphs show concentrations in the batch tests with synthetic fracturing fluid SKC and Ontario groundwater and sediment at 25 °C. (PEG = polyethylene glycols; CAPB = cocamidopropyl betaine components).
Pollutants 04 00026 g004
Figure 5. Examples of trends in concentrations of “BTEX” as components of petroleum hydrocarbons added as components of the synthetic fracturing fluid SKB in one of the batch tests (Saskatchewan sediment and groundwater at 5 °C). Note in particular the decline in toluene concentrations.
Pollutants 04 00026 g005
Figure 6. Examples of trends in concentrations of redox indicator species, oxidation reduction potential (with reference to silver/silver chloride reference electrode), and CO2 (headspace) during the batch (microcosm) tests. This example (all 8 panels) shows concentrations in batch tests with synthetic fracturing fluid SKC, Ontario groundwater, and sediment at 25 °C.
Pollutants 04 00026 g006
Figure 7. Apparent half-lives (days) of synthetic organic chemicals tested as FF components (SKC) in active microcosms: alcohols, ethanolamines, cocamidopropyl betaines (CAPB), and polyethylene glycols. These half-lives are based on comparing day 1 concentrations (and a few data for day 0) to end of experiment concentrations (at 134 days), and do not take into account nonlinear processes or sorption. See Table S7.1 in Supplementary Material for further details. (∞ (infinity) = no statistically significant loss).
Pollutants 04 00026 g007
Figure 8. Example showing decline over time in different cocamidopropyl betaine (CAPB) components and polyethylene glycols (PEG) in one of the batch tests (SKC fracturing fluid, Ontario sediment, and groundwater at 25 °C). The CAPB is a mixture of components with a common molecular structure represented by the formula C7H15N2O3(CnH2n−1), where n ranged from 8 to 14 (abbreviated here as C8 to C14). The PEG included a complex mixture of homologues, sharing the same molecular structure (C2nH4n+2On+1), where n in this formula ranged from 10 to 14 (abbreviated here as 10n to 14n). In both cases, the smaller molecules (lower n values) appeared to be more persistent.
Pollutants 04 00026 g008
Table 1. Composition of the synthetic fracturing fluids prepared for this study.
Simulated Fracturing SKB (October 2014)Concentration
g/L
Simulated Fracturing SKC
(3 Batches: April, May, June, 2015)
Concentration
g/L
Organics Organics
guar gum **4.0guar gum ** (after pretreating with ammonium persulfate)4.0
2-ethylhexanol0.0542-ethylhexanol0.27
isopropanol0.054isopropanol0.27
diethanolamine0.19diethanolamine0.19
triethanolamine0.91triethanolamine0.91
cocamidopropyl betaine * ~1.5cocamidopropyl betaine3.75
polyethylene glycols0.063polyethylene glycols0.32
ethoxylated alcohols0.043
ethylene glycol **0.56
naphthalene8.1 × 10−5
1,2,4-trimethylbenzene0.017
naphtha5.6 ##
Inorganics Inorganics
ammonium persulfate ***1.9ammonium persulfate (pre-treatment)1.4
sodium chloride *0.048
potassium carbonate0.69
boric acid #0.35
potassium hydroxide0.36
* Added 1 day later than the others, separately to each microcosm; ** added but not monitored; *** persulfate not monitored, assumed to be very reactive forming sulfate, which was monitored; # monitored as boron; ## monitored as mixture of petroleum hydrocarbons, some remained as NAPL.
Table 2. Key abbreviations used in this article (does not include standard units of measure or symbols for chemical elements).
CAPBCocoamidopropyl Betaine
CgwConcentration of a dissolved fracturing fluid chemical in a “groundwater only” batch (µg/L) (sometimes reported as mg/L)
Cgw+sedConcentration of a dissolved fracturing fluid chemical in a “groundwater and sediment” batch (µg/L)
CsedConcentration of sorbed fracturing fluid chemical in a “groundwater and sediment” batch (µg/kg)
FFFracturing fluids
gwGroundwater
HFHydraulic fracturing
KdDistribution (sorption) coefficient
msedMass of sediment in batch (kg)
PEGPolyethylene glycol
RfRetardation factor, which accounts for delay in transport of a dissolved chemical through a test column due to sorption
sedSediment
SKB, SKCTwo synthetic fracturing fluids prepared in this study
t½Apparent half-life of synthetic chemical in a batch test
VgwVolume of groundwater in a “groundwater and sediment” batch (L)
ψan adjustment factor, taking into account the additional water in the “groundwater and sediment” batches compared to the “groundwater only” batches
Disclaimer/Publisher’s Note: The statements, opinions and data contained in all publications are solely those of the individual author(s) and contributor(s) and not of MDPI and/or the editor(s). MDPI and/or the editor(s) disclaim responsibility for any injury to people or property resulting from any ideas, methods, instructions or products referred to in the content.

