
A Systems Approach to Interrogate Gene Expression Patterns in African American Men Presenting with Clinically Localized Prostate Cancer

 , , , ,
Abstract
:Simple Summary
Abstract
1. Introduction
2. Results
2.1. Patient Cohort
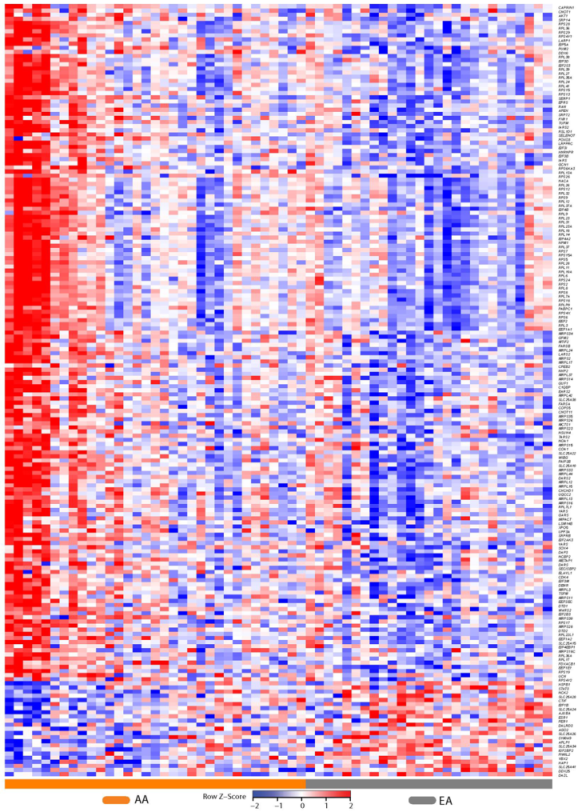
2.2. Differential Prostate Gene Expression between African American and European American Patients
2.3. Patient Characteristics and Clinical Phenotype
Sparse Principal Component Analysis
3. Discussion
4. Materials and Methods
4.1. Human Subjects
4.2. Tissue Sample Procurement and RNA Purification
4.3. RNA Sequencing and Analyses
4.4. Heat Maps
4.5. Statistical Testing of Patient Characteristics and Clinical Phenotype
4.6. Ethics Approval and Consent to Participate
4.7. Availability of Data and Materials
5. Conclusions
Supplementary Materials
Author Contributions
Funding
Institutional Review Board Statement
Informed Consent Statement
Data Availability Statement
Conflicts of Interest
References
- Reagan, L.P.; Grillo, C.A.; Piroli, G.G. The As and Ds of stress: Metabolic, morphological and behavioral consequences. Eur. J. Pharmacol. 2008, 585, 64–75. [Google Scholar] [CrossRef] [Green Version]
- Dhabhar, F.S.; Miller, A.H.; McEwen, B.S.; Spencer, R.L. Effects of stress on immune cell distribution. Dynamics and hormonal mechanisms. J. Immunol. 1995, 154, 5511–5527. [Google Scholar] [PubMed]
- Dhabhar, F.S.; McEwen, B.S. Stress-induced enhancement of antigen-specific cell-mediated immunity. J. Immunol. 1996, 156, 2608–2615. [Google Scholar] [PubMed]
- Miyashita, Y. Cognitive memory: Cellular and network machineries and their top-down control. Science 2004, 306, 435–440. [Google Scholar] [CrossRef] [PubMed] [Green Version]
- McEwen, B.S.; Stellar, E. Stress and the individual. Mechanisms leading to disease. Arch. Intern. Med. 1993, 153, 2093–2101. [Google Scholar] [CrossRef] [PubMed]
- Ogden, J. Health Psychology: A Textbook: A Textbook; McGraw-Hill Education: London, UK, 2012. [Google Scholar]
- Seeman, T.; Epel, E.; Gruenewald, T.; Karlamangla, A.; McEwen, B.S. Socio-economic differentials in peripheral biology: Cumulative allostatic load. Ann. N. Y. Acad. Sci. 2010, 1186, 223–239. [Google Scholar] [CrossRef] [PubMed]
- Szanton, S.L.; Gill, J.M.; Allen, J.K. Allostatic load: A mechanism of socioeconomic health disparities? Biol. Res. Nurs. 2005, 7, 7–15. [Google Scholar] [CrossRef] [PubMed]
- Karlamangla, A.; Gruenewald, T.; Seeman, T. Promise of biomarkers in assessing and predicting health. In The Biological Consequences of Socioeconomic Inequalities; Wolfe, B., Evans, W., Seeman, T., Eds.; Russell Sage Foundation: New York, NY, USA, 2012; pp. 38–62. [Google Scholar]
- Lu, S.; Wei, F.; Li, G. The evolution of the concept of stress and the framework of the stress system. Cell Stress 2011, 5, 76. [Google Scholar] [CrossRef]
- Burroughs Peña, M.S.; Mbassa, R.S.; Slopen, N.B.; Williams, D.R.; Buring, J.E.; Albert, M.A. Cumulative Psychosocial Stress and Ideal Cardiovascular Health in Older Women. Circulation 2019, 139, 2012–2021. [Google Scholar] [CrossRef]
- Elliott, B.; Zackery, D.L.; Eaton, V.A.; Jones, R.T.; Abebe, F.; Ragin, C.C.; Khan, S.A. Ethnic differences in TGFbeta-signaling pathway may contribute to prostate cancer health disparity. Carcinogenesis 2018, 39, 546–555. [Google Scholar] [CrossRef]
- Siegel, R.L.; Miller, K.D.; Jemal, A. Cancer statistics, 2016. CA Cancer J. Clin. 2016, 66, 7–30. [Google Scholar] [CrossRef] [Green Version]
- Bhardwaj, A.; Srivastava, S.K.; Khan, M.A.; Prajapati, V.K.; Singh, S.; Carter, J.E.; Singh, A.P. Racial disparities in prostate cancer: A molecular perspective. Front. Biosci. (Landmark Ed.) 2017, 22, 772–782. [Google Scholar] [CrossRef] [Green Version]
- Lim, L.S.; Sherin, K. Screening for prostate cancer in U.S. men ACPM position statement on preventive practice. Am. J. Prev. Med. 2008, 34, 164–170. [Google Scholar] [CrossRef]
- Freedland, S.J.; Sutter, M.E.; Naitoh, J.; Dorey, F.; Csathy, G.S.; Aronson, W.J. Clinical characteristics in black and white men with prostate cancer in an equal access medical center. Urology 2000, 55, 387–390. [Google Scholar] [CrossRef]
- Freedland, S.J.; Amling, C.L.; Dorey, F.; Kane, C.J.; Presti, J.C., Jr.; Terris, M.K.; Aronson, W.J. Race as an outcome predictor after radical prostatectomy: Results from the Shared Equal Access Regional Cancer Hospital (SEARCH) database. Urology 2002, 60, 670–674. [Google Scholar] [CrossRef]
- Waxman, A.J.; Mink, P.J.; Devesa, S.S.; Anderson, W.F.; Weiss, B.M.; Kristinsson, S.Y.; McGlynn, K.A.; Landgren, O. Racial disparities in incidence and outcome in multiple myeloma: A population-based study. Blood 2010, 116, 5501–5506. [Google Scholar] [CrossRef] [Green Version]
- Smith, C.J.; Ambs, S.; Landgren, O. Biological determinants of health disparities in multiple myeloma. Blood Cancer J. 2018, 8, 85. [Google Scholar] [CrossRef] [Green Version]
- Cui, Y.S.; Song, Y.P.; Fang, B.J. The role of long non-coding RNAs in multiple myeloma. Eur. J. Haematol. 2019, 103, 3–9. [Google Scholar] [CrossRef] [Green Version]
- Kazandjian, D. Multiple myeloma epidemiology and survival: A unique malignancy. Semin Oncol. 2016, 43, 676–681. [Google Scholar] [CrossRef] [Green Version]
- Wallace, K.; Li, H.; Brazeal, J.G.; Lewin, D.N.; Sun, S.; Ba, A.; Paulos, C.M.; Rachidi, S.; Li, Z.; Alekseyenko, A.V. Platelet and hemoglobin count at diagnosis are associated with survival in African American and Caucasian patients with colorectal cancer. Cancer Epidemiol. 2020, 67, 101746. [Google Scholar] [CrossRef]
- Chatterjee, N.A.; He, Y.; Keating, N.L. Racial differences in breast cancer stage at diagnosis in the mammography era. Am. J. Public Health 2013, 103, 170–176. [Google Scholar] [CrossRef] [PubMed]
- Gupta, V.; Haque, I.; Chakraborty, J.; Graff, S.; Banerjee, S.; Banerjee, S.K. Racial disparity in breast cancer: Can it be mattered for prognosis and therapy. J. Cell Commun. Signal. 2018, 12, 119–132. [Google Scholar] [CrossRef] [Green Version]
- DeSantis, C.E.; Miller, K.D.; Goding Sauer, A.; Jemal, A.; Siegel, R.L. Cancer statistics for African Americans, 2019. CA Cancer J. Clin. 2019, 69, 211–233. [Google Scholar] [CrossRef] [Green Version]
- Rebbeck, T.R.; Devesa, S.S.; Chang, B.L.; Bunker, C.H.; Cheng, I.; Cooney, K.; Eeles, R.; Fernandez, P.; Giri, V.N.; Gueye, S.M.; et al. Global patterns of prostate cancer incidence, aggressiveness, and mortality in men of african descent. Prostate Cancer 2013, 2013, 560857. [Google Scholar] [CrossRef] [PubMed] [Green Version]
- Jones, A.L.; Chinegwundoh, F. Update on prostate cancer in black men within the UK. Ecancermedicalscience 2014, 8, 455. [Google Scholar] [CrossRef] [PubMed]
- Hardiman, G.; Savage, S.J.; Hazard, E.S.; Wilson, R.C.; Courtney, S.M.; Smith, M.T.; Hollis, B.W.; Halbert, C.H.; Gattoni-Celli, S. Systems analysis of the prostate transcriptome in African-American men compared with European-American men. Pharmacogenomics 2016, 17, 1129–1143. [Google Scholar] [CrossRef] [PubMed]
- Richards, Z.; Batai, K.; Farhat, R.; Shah, E.; Makowski, A.; Gann, P.H.; Kittles, R.; Nonn, L. Prostatic compensation of the vitamin D axis in African American men. JCI Insight 2017, 2, e91054. [Google Scholar] [CrossRef] [PubMed] [Green Version]
- Benafif, S.; Kote-Jarai, Z.; Eeles, R.A.; Consortium, P. A Review of Prostate Cancer Genome-Wide Association Studies (GWAS). Cancer Epidemiol. Biomark. Prev. 2018, 27, 845–857. [Google Scholar] [CrossRef] [Green Version]
- Barrington, W.E.; Schenk, J.M.; Etzioni, R.; Arnold, K.B.; Neuhouser, M.L.; Thompson, I.M., Jr.; Lucia, M.S.; Kristal, A.R. Difference in Association of Obesity With Prostate Cancer Risk Between US African American and Non-Hispanic White Men in the Selenium and Vitamin E Cancer Prevention Trial (SELECT). JAMA Oncol. 2015, 1, 342–349. [Google Scholar] [CrossRef]
- Xiao, J.; Cohen, P.; Stern, M.C.; Odedina, F.; Carpten, J.; Reams, R. Mitochondrial biology and prostate cancer ethnic disparity. Carcinogenesis 2018, 39, 1311–1319. [Google Scholar] [CrossRef]
- Yuan, J.; Kensler, K.H.; Hu, Z.; Zhang, Y.; Zhang, T.; Jiang, J.; Xu, M.; Pan, Y.; Long, M.; Montone, K.T.; et al. Integrative comparison of the genomic and transcriptomic landscape between prostate cancer patients of predominantly African or European genetic ancestry. PLoS Genet. 2020, 16, e1008641. [Google Scholar] [CrossRef] [Green Version]
- Rebbeck, T.R. Prostate Cancer Genetics: Variation by Race, Ethnicity, and Geography. Semin Radiat Oncol. 2017, 27, 3–10. [Google Scholar] [CrossRef] [Green Version]
- Freedman, M.L.; Haiman, C.A.; Patterson, N.; McDonald, G.J.; Tandon, A.; Waliszewska, A.; Penney, K.; Steen, R.G.; Ardlie, K.; John, E.M.; et al. Admixture mapping identifies 8q24 as a prostate cancer risk locus in African-American men. Proc. Natl. Acad. Sci. USA 2006, 103, 14068–14073. [Google Scholar] [CrossRef] [Green Version]
- Robbins, C.M.; Hooker, S.; Kittles, R.A.; Carpten, J.D. EphB2 SNPs and sporadic prostate cancer risk in African American men. PLoS ONE 2011, 6, e19494. [Google Scholar] [CrossRef] [Green Version]
- Rawla, P. Epidemiology of Prostate Cancer. World J. Oncol. 2019, 10, 63–89. [Google Scholar] [CrossRef] [Green Version]
- Matejcic, M.; Saunders, E.J.; Dadaev, T.; Brook, M.N.; Wang, K.; Sheng, X.; Olama, A.A.A.; Schumacher, F.R.; Ingles, S.A.; Govindasami, K.; et al. Germline variation at 8q24 and prostate cancer risk in men of European ancestry. Nat. Commun. 2018, 9, 4616. [Google Scholar] [CrossRef]
- Schwartz, G.G. Vitamin D and the epidemiology of prostate cancer. Semin Dial. 2005, 18, 276–289. [Google Scholar] [CrossRef]
- Looker, A.C.; Pfeiffer, C.M.; Lacher, D.A.; Schleicher, R.L.; Picciano, M.F.; Yetley, E.A. Serum 25-hydroxyvitamin D status of the US population: 1988–1994 compared with 2000–2004. Am. J. Clin. Nutr. 2008, 88, 1519–1527. [Google Scholar] [CrossRef]
- Nesby-O’Dell, S.; Scanlon, K.S.; Cogswell, M.E.; Gillespie, C.; Hollis, B.W.; Looker, A.C.; Allen, C.; Doughertly, C.; Gunter, E.W.; Bowman, B.A. Hypovitaminosis D prevalence and determinants among African American and white women of reproductive age: Third National Health and Nutrition Examination Survey, 1988–1994. Am. J. Clin. Nutr. 2002, 76, 187–192. [Google Scholar] [CrossRef] [Green Version]
- Garrett-Mayer, E.; Wagner, C.L.; Hollis, B.W.; Kindy, M.S.; Gattoni-Celli, S. Vitamin D3 supplementation (4000 IU/d for 1 y) eliminates differences in circulating 25-hydroxyvitamin D between African American and white men. Am. J. Clin. Nutr. 2012, 96, 332–336. [Google Scholar] [CrossRef]
- Marshall, D.T.; Savage, S.J.; Garrett-Mayer, E.; Keane, T.E.; Hollis, B.W.; Horst, R.L.; Ambrose, L.H.; Kindy, M.S.; Gattoni-Celli, S. Vitamin D3 supplementation at 4000 international units per day for one year results in a decrease of positive cores at repeat biopsy in subjects with low-risk prostate cancer under active surveillance. J. Clin. Endocrinol Metab. 2012, 97, 2315–2324. [Google Scholar] [CrossRef] [Green Version]
- Hollis, B.W.; Marshall, D.T.; Savage, S.J.; Garrett-Mayer, E.; Kindy, M.S.; Gattoni-Celli, S. Vitamin D3 supplementation, low-risk prostate cancer, and health disparities. J. Steroid Biochem. Mol. Biol. 2013, 136, 233–237. [Google Scholar] [CrossRef]
- Woods-Burnham, L.; Cajigas-Du Ross, C.K.; Love, A.; Basu, A.; Sanchez-Hernandez, E.S.; Martinez, S.R.; Ortiz-Hernández, G.L.; Stiel, L.; Durán, A.M.; Wilson, C.; et al. Glucocorticoids Induce Stress Oncoproteins Associated with Therapy-Resistance in African American and European American Prostate Cancer Cells. Sci. Rep. 2018, 8, 15063. [Google Scholar] [CrossRef] [Green Version]
- Hart, S.N.; Therneau, T.M.; Zhang, Y.; Poland, G.A.; Kocher, J.P. Calculating sample size estimates for RNA sequencing data. J. Comput. Biol. 2013, 20, 970–978. [Google Scholar] [CrossRef] [Green Version]
- Anders, S.; McCarthy, D.J.; Chen, Y.; Okoniewski, M.; Smyth, G.K.; Huber, W.; Robinson, M.D. Count-based differential expression analysis of RNA sequencing data using R and Bioconductor. Nat. Protoc. 2013, 8, 1765–1786. [Google Scholar] [CrossRef]
- Anders, S.; Huber, W. Differential expression analysis for sequence count data. Genome Biol. 2010, 11, R106. [Google Scholar] [CrossRef] [Green Version]
- Love, M.I.; Huber, W.; Anders, S. Moderated estimation of fold change and dispersion for RNA-seq data with DESeq2. Genome Biol. 2014, 15, 550. [Google Scholar] [CrossRef] [Green Version]
- Draghici, S.; Khatri, P.; Tarca, A.L.; Amin, K.; Done, A.; Voichita, C.; Georgescu, C.; Romero, R. A systems biology approach for pathway level analysis. Genome Res. 2007, 17, 1537–1545. [Google Scholar] [CrossRef] [Green Version]
- Chen, J.; Bardes, E.E.; Aronow, B.J.; Jegga, A.G. ToppGene Suite for gene list enrichment analysis and candidate gene prioritization. Nucleic Acids Res. 2009, 37, W305–W311. [Google Scholar] [CrossRef] [PubMed]
- Barreiro-Alonso, A.; Lamas-Maceiras, M.; García-Díaz, R.; Rodríguez-Belmonte, E.; Yu, L.; Pardo, M.; Choudhary, J.S.; Cerdán, M.E. Delineating the HMGB1 and HMGB2 interactome in prostate and ovary epithelial cells and its relationship with cancer. Oncotarget 2018, 9, 19050–19064. [Google Scholar] [CrossRef] [PubMed] [Green Version]
- Zhao, C.B.; Bao, J.M.; Lu, Y.J.; Zhao, T.; Zhou, X.H.; Zheng, D.Y.; Zhao, S.C. Co-expression of RAGE and HMGB1 is associated with cancer progression and poor patient outcome of prostate cancer. Am. J. Cancer Res. 2014, 4, 369–377. [Google Scholar] [CrossRef] [PubMed] [Green Version]
- Cho-Vega, J.H.; Troncoso, P.; Do, K.A.; Rago, C.; Wang, X.; Tsavachidis, S.; Medeiros, L.J.; Spurgers, K.; Logothetis, C.; McDonnell, T.J. Combined laser capture microdissection and serial analysis of gene expression from human tissue samples. Mod. Pathol. 2005, 18, 577–584. [Google Scholar] [CrossRef] [PubMed] [Green Version]
- Cerami, E.; Gao, J.; Dogrusoz, U.; Gross, B.E.; Sumer, S.O.; Aksoy, B.A.; Jacobsen, A.; Byrne, C.J.; Heuer, M.L.; Larsson, E.; et al. The cBio cancer genomics portal: An open platform for exploring multidimensional cancer genomics data. Cancer Discov. 2012, 2, 401–404. [Google Scholar] [CrossRef] [PubMed] [Green Version]
- Gao, J.; Aksoy, B.A.; Dogrusoz, U.; Dresdner, G.; Gross, B.; Sumer, S.O.; Sun, Y.; Jacobsen, A.; Sinha, R.; Larsson, E.; et al. Integrative analysis of complex cancer genomics and clinical profiles using the cBioPortal. Sci. Signal. 2013, 6, pl1. [Google Scholar] [CrossRef] [PubMed] [Green Version]
- Zou, H.; Hastie, T.; Tibshirani, R. Sparse Principal Component Analysis. J. Comput. Graph. Stat. 2006, 15, 265–286. [Google Scholar] [CrossRef] [Green Version]
- Linnenbringer, E.; Gehlert, S.; Geronimus, A.T. Black-White Disparities in Breast Cancer Subtype: The Intersection of Socially Patterned Stress and Genetic Expression. AIMS Public Health 2017, 4, 526–556. [Google Scholar] [CrossRef]
- Williams, D.R.; Mohammed, S.A. Discrimination and racial disparities in health: Evidence and needed research. J. Behav. Med. 2009, 32, 20–47. [Google Scholar] [CrossRef] [Green Version]
- He, Z.; Tang, F.; Lu, Z.; Huang, Y.; Lei, H.; Li, Z.; Zeng, G. Analysis of differentially expressed genes, clinical value and biological pathways in prostate cancer. Am. J. Transl. Res. 2018, 10, 1444–1456. [Google Scholar]
- Fang, Z.Q.; Zang, W.D.; Chen, R.; Ye, B.W.; Wang, X.W.; Yi, S.H.; Chen, W.; He, F.; Ye, G. Gene expression profile and enrichment pathways in different stages of bladder cancer. Genet. Mol. Res. GMR 2013, 12, 1479–1489. [Google Scholar] [CrossRef]
- Liu, X.; Wang, J.; Sun, G. Identification of key genes and pathways in renal cell carcinoma through expression profiling data. Kidney Blood Press. Res. 2015, 40, 288–297. [Google Scholar] [CrossRef]
- Myers, J.S.; von Lersner, A.K.; Sang, Q.-X.A. Proteomic upregulation of fatty acid synthase and fatty acid binding protein 5 and identification of cancer-and race-specific pathway associations in human prostate cancer tissues. J. Cancer 2016, 7, 1452. [Google Scholar] [CrossRef] [Green Version]
- Kinseth, M.A.; Jia, Z.; Rahmatpanah, F.; Sawyers, A.; Sutton, M.; Wang-Rodriguez, J.; Mercola, D.; McGuire, K.L. Expression differences between African American and Caucasian prostate cancer tissue reveals that stroma is the site of aggressive changes. Int. J. Cancer 2014, 134, 81–91. [Google Scholar] [CrossRef] [Green Version]
- Edlind, M.P.; Hsieh, A.C. PI3K-AKT-mTOR signaling in prostate cancer progression and androgen deprivation therapy resistance. Asian J. Androl. 2014, 16, 378–386. [Google Scholar] [CrossRef]
- Crumbaker, M.; Khoja, L.; Joshua, A.M. AR Signaling and the PI3K Pathway in Prostate Cancer. Cancers 2017, 9, 34. [Google Scholar] [CrossRef]
- Dasgupta, S.; Srinidhi, S.; Vishwanatha, J.K. Oncogenic activation in prostate cancer progression and metastasis: Molecular insights and future challenges. J. Carcinog. 2012, 11, 4. [Google Scholar] [CrossRef]
- Kreisberg, J.I.; Malik, S.N.; Prihoda, T.J.; Bedolla, R.G.; Troyer, D.A.; Kreisberg, S.; Ghosh, P.M. Phosphorylation of Akt (Ser473) is an excellent predictor of poor clinical outcome in prostate cancer. Cancer Res. 2004, 64, 5232–5236. [Google Scholar] [CrossRef] [Green Version]
- Bedolla, R.; Prihoda, T.J.; Kreisberg, J.I.; Malik, S.N.; Krishnegowda, N.K.; Troyer, D.A.; Ghosh, P.M. Determining risk of biochemical recurrence in prostate cancer by immunohistochemical detection of PTEN expression and Akt activation. Clin. Cancer Res. An. Off. J. Am. Assoc. Cancer Res. 2007, 13, 3860–3867. [Google Scholar] [CrossRef] [Green Version]
- Yan, G.; Ru, Y.; Wu, K.; Yan, F.; Wang, Q.; Wang, J.; Pan, T.; Zhang, M.; Han, H.; Li, X.; et al. GOLM1 promotes prostate cancer progression through activating PI3K-AKT-mTOR signaling. Prostate 2018, 78, 166–177. [Google Scholar] [CrossRef]
- Frey, L.J.; Bernstam, E.V.; Denny, J.C. Precision medicine informatics. J. Am. Med. Inform. Assoc. JAMIA 2016, 23, 668–670. [Google Scholar] [CrossRef] [Green Version]
- Bitting, R.L.; Armstrong, A.J. Targeting the PI3K/Akt/mTOR pathway in castration-resistant prostate cancer. Endocr.-Relat. Cancer 2013, 20, R83–R99. [Google Scholar] [CrossRef] [Green Version]
- Vale, R.D. The molecular motor toolbox for intracellular transport. Cell 2003, 112, 467–480. [Google Scholar] [CrossRef] [Green Version]
- Sahlender, D.A.; Roberts, R.C.; Arden, S.D.; Spudich, G.; Taylor, M.J.; Luzio, J.P.; Kendrick-Jones, J.; Buss, F. Optineurin links myosin VI to the Golgi complex and is involved in Golgi organization and exocytosis. J. Cell Biol. 2005, 169, 285–295. [Google Scholar] [CrossRef] [PubMed]
- Rock, R.S.; Rice, S.E.; Wells, A.L.; Purcell, T.J.; Spudich, J.A.; Sweeney, H.L. Myosin VI is a processive motor with a large step size. Proc. Natl. Acad. Sci. USA 2001, 98, 13655–13659. [Google Scholar] [CrossRef] [PubMed] [Green Version]
- Wei, S.; Dunn, T.A.; Isaacs, W.B.; De Marzo, A.M.; Luo, J. GOLPH2 and MYO6: Putative prostate cancer markers localized to the Golgi apparatus. Prostate 2008, 68, 1387–1395. [Google Scholar] [CrossRef] [Green Version]
- Ye, Q.H.; Zhu, W.W.; Zhang, J.B.; Qin, Y.; Lu, M.; Lin, G.L.; Guo, L.; Zhang, B.; Lin, Z.H.; Roessler, S.; et al. GOLM1 Modulates EGFR/RTK Cell-Surface Recycling to Drive Hepatocellular Carcinoma Metastasis. Cancer Cell 2016, 30, 444–458. [Google Scholar] [CrossRef] [Green Version]
- Donato, M.; Xu, Z.; Tomoiaga, A.; Granneman, J.G.; Mackenzie, R.G.; Bao, R.; Than, N.G.; Westfall, P.H.; Romero, R.; Draghici, S. Analysis and correction of crosstalk effects in pathway analysis. Genome Res. 2013, 23, 1885–1893. [Google Scholar] [CrossRef]
- Tomoiaga, A.; Westfall, P.; Donato, M.; Draghici, S.; Hassan, S.; Romero, R.; Tellaroli, P. Pathway crosstalk effects: Shrinkage and disentanglement using a Bayesian hierarchical model. Stat. Biosci. 2016, 8, 374–394. [Google Scholar] [CrossRef]
- Neuhaus, E.M.; Zhang, W.; Gelis, L.; Deng, Y.; Noldus, J.; Hatt, H. Activation of an olfactory receptor inhibits proliferation of prostate cancer cells. J. Biol. Chem. 2009, 284, 16218–16225. [Google Scholar] [CrossRef] [Green Version]
- Liu, P.; Ramachandran, S.; Ali Seyed, M.; Scharer, C.D.; Laycock, N.; Dalton, W.B.; Williams, H.; Karanam, S.; Datta, M.W.; Jaye, D.L.; et al. Sex-determining region Y box 4 is a transforming oncogene in human prostate cancer cells. Cancer Res. 2006, 66, 4011–4019. [Google Scholar] [CrossRef] [Green Version]
- Alves, L.R.; Goldenberg, S. RNA-binding proteins related to stress response and differentiation in protozoa. World J. Biol. Chem. 2016, 7, 78–87. [Google Scholar] [CrossRef]
- De la Cruz, J.; Karbstein, K.; Woolford, J.L., Jr. Functions of ribosomal proteins in assembly of eukaryotic ribosomes in vivo. Annu. Rev. Biochem. 2015, 84, 93–129. [Google Scholar] [CrossRef] [Green Version]
- Lin, Y.; Li, Z.; Ozsolak, F.; Kim, S.W.; Arango-Argoty, G.; Liu, T.T.; Tenenbaum, S.A.; Bailey, T.; Monaghan, A.P.; Milos, P.M.; et al. An in-depth map of polyadenylation sites in cancer. Nucleic Acids Res. 2012, 40, 8460–8471. [Google Scholar] [CrossRef] [Green Version]
- Han, T.; Kim, J.K. Driving glioblastoma growth by alternative polyadenylation. Cell Res. 2014, 24, 1023. [Google Scholar] [CrossRef] [Green Version]
- Golomb, L.; Volarevic, S.; Oren, M. p53 and ribosome biogenesis stress: The essentials. FEBS Lett. 2014, 588, 2571–2579. [Google Scholar] [CrossRef]
- Vaarala, M.H.; Porvari, K.S.; Kyllönen, A.P.; Mustonen, M.V.; Lukkarinen, O.; Vihko, P.T. Several genes encoding ribosomal proteins are over-expressed in prostate-cancer cell lines: Confirmation of L7a and L37 over-expression in prostate-cancer tissue samples. Int. J. Cancer 1998, 78, 27–32. [Google Scholar] [CrossRef]
- Harvey, R.; Dezi, V.; Pizzinga, M.; Willis, A.E. Post-transcriptional control of gene expression following stress: The role of RNA-binding proteins. Biochem. Soc. Trans. 2017, 45, 1007–1014. [Google Scholar] [CrossRef]
- Buchan, J.R.; Parker, R. Eukaryotic stress granules: The ins and outs of translation. Mol. Cell 2009, 36, 932–941. [Google Scholar] [CrossRef] [Green Version]
- Pulvirenti, T.; Giannotta, M.; Capestrano, M.; Capitani, M.; Pisanu, A.; Polishchuk, R.S.; San Pietro, E.; Beznoussenko, G.V.; Mironov, A.A.; Turacchio, G.; et al. A traffic-activated Golgi-based signalling circuit coordinates the secretory pathway. Nat. Cell Biol. 2008, 10, 912–922. [Google Scholar] [CrossRef]
- Harding, H.P.; Novoa, I.; Zhang, Y.; Zeng, H.; Wek, R.; Schapira, M.; Ron, D. Regulated translation initiation controls stress-induced gene expression in mammalian cells. Mol. Cell 2000, 6, 1099–1108. [Google Scholar] [CrossRef]
- Ron, D.; Walter, P. Signal integration in the endoplasmic reticulum unfolded protein response. Nat. Rev. Mol. Cell Biol. 2007, 8, 519–529. [Google Scholar] [CrossRef]
- Lee, A.H.; Iwakoshi, N.N.; Glimcher, L.H. XBP-1 regulates a subset of endoplasmic reticulum resident chaperone genes in the unfolded protein response. Mol. Cell. Biol. 2003, 23, 7448–7459. [Google Scholar] [CrossRef] [Green Version]
- Yamaguchi, A.; Hori, O.; Stern, D.M.; Hartmann, E.; Ogawa, S.; Tohyama, M. Stress-associated endoplasmic reticulum protein 1 (SERP1)/Ribosome-associated membrane protein 4 (RAMP4) stabilizes membrane proteins during stress and facilitates subsequent glycosylation. J. Cell Biol. 1999, 147, 1195–1204. [Google Scholar] [CrossRef] [Green Version]
- Sozen, E.; Ozer, N.K. Impact of high cholesterol and endoplasmic reticulum stress on metabolic diseases: An updated mini-review. Redox Biol. 2017, 12, 456–461. [Google Scholar] [CrossRef]
- Lange, S.S.; Vasquez, K.M. HMGB1: The jack-of-all-trades protein is a master DNA repair mechanic. Mol. Carcinog 2009, 48, 571–580. [Google Scholar] [CrossRef] [PubMed] [Green Version]
- Davis-Turak, J.; Courtney, S.M.; Hazard, E.S.; Glen, W.B., Jr.; da Silveira, W.A.; Wesselman, T.; Harbin, L.P.; Wolf, B.J.; Chung, D.; Hardiman, G. Genomics pipelines and data integration: Challenges and opportunities in the research setting. Expert Rev. Mol. Diagn 2017, 17, 225–237. [Google Scholar] [CrossRef] [PubMed] [Green Version]
- Dobin, A.; Davis, C.A.; Schlesinger, F.; Drenkow, J.; Zaleski, C.; Jha, S.; Batut, P.; Chaisson, M.; Gingeras, T.R. STAR: Ultrafast universal RNA-seq aligner. Bioinformatics 2013, 29, 15–21. [Google Scholar] [CrossRef] [PubMed]
- Benjamini, Y.; Hochberg, Y. Controlling the false discovery rate: A practical and powerful approach to multiple testing. J. R. Stat. Soc. Ser. B (Methodol.) 1995, 289–300. [Google Scholar] [CrossRef]
- Kozak, I.; Sasik, R.; Freeman, W.R.; Sprague, L.J.; Gomez, M.L.; Cheng, L.; El-Emam, S.; Mojana, F.; Bartsch, D.U.; Bosten, J.; et al. A degenerative retinal process in HIV-associated non-infectious retinopathy. PLoS ONE 2013, 8, e74712. [Google Scholar] [CrossRef] [Green Version]
- Paolini, P.; Pick, D.; Lapira, J.; Sannino, G.; Pasqualini, L.; Ludka, C.; Sprague, L.J.; Zhang, X.; Bartolotta, E.A.; Vazquez-Hidalgo, E.; et al. Developmental and extracellular matrix-remodeling processes in rosiglitazone-exposed neonatal rat cardiomyocytes. Pharmacogenomics 2014, 15, 759–774. [Google Scholar] [CrossRef]
- Hulsen, T.; de Vlieg, J.; Alkema, W. BioVenn—A web application for the comparison and visualization of biological lists using area-proportional Venn diagrams. BMC Genom. 2008, 9, 488. [Google Scholar] [CrossRef] [Green Version]
- Tarca, A.L.; Draghici, S.; Khatri, P.; Hassan, S.S.; Mittal, P.; Kim, J.-S.; Kim, C.J.; Kusanovic, J.P.; Romero, R. A novel signaling pathway impact analysis. Bioinformatics 2009, 25, 75–82. [Google Scholar] [CrossRef] [Green Version]
- Khatri, P.; Sirota, M.; Butte, A.J. Ten Years of Pathway Analysis: Current Approaches and Outstanding Challenges. PLoS Comput. Biol. 2012, 8, e1002375. [Google Scholar] [CrossRef]
- Kanehisa, M.; Sato, Y.; Kawashima, M.; Furumichi, M.; Tanabe, M. KEGG as a reference resource for gene and protein annotation. Nucleic Acids Res. 2016, 44, D457–D462. [Google Scholar] [CrossRef] [Green Version]
- Kanehisa, M.; Goto, S.; Sato, Y.; Kawashima, M.; Furumichi, M.; Tanabe, M. Data, information, knowledge and principle: Back to metabolism in KEGG. Nucleic Acids Res. 2014, 42, D199–D205. [Google Scholar] [CrossRef] [Green Version]
- Kanehisa, M.; Goto, S.; Furumichi, M.; Tanabe, M.; Hirakawa, M. KEGG for representation and analysis of molecular networks involving diseases and drugs. Nucleic Acids Res. 2010, 38, D355–D360. [Google Scholar] [CrossRef] [Green Version]
- Kanehisa, M.; Goto, S. KEGG: Kyoto encyclopedia of genes and genomes. Nucleic Acids Res. 2000, 28, 27–30. [Google Scholar] [CrossRef]
- Team, R.C. R: The R Project for Statistical Computing. 2019. Available online: https://www.r-project.org/ (accessed on 30 March 2020).
- Shen, D.; Shen, H.; Marron, J.S. Consistency of sparse PCA in High Dimension, Low Sample Size contexts. J. Multivar. Anal. 2013, 115, 317–333. [Google Scholar] [CrossRef]
- Shen, H.; Huang, J.Z. Sparse principal component analysis via regularized low rank matrix approximation. J. Multivar. Anal. 2008, 99, 1015–1034. [Google Scholar] [CrossRef] [Green Version]


| Overall n = 60 | African Americans N (%) 33 (55%) | Caucasians N (%) 27 (45%) | |||||||
|---|---|---|---|---|---|---|---|---|---|
| Median (IQR) | Minimum | Maximum | Median (IQR) | Minimum | Maximum | Median (IQR) | Minimum | Maximum | |
| Age, Years | 65 (6) | 46 | 76 | 65 (5) | 46 | 76 | 65.5 (7) | 46 | 75 |
| Blood Pressure, mmHg | SBP: 135 (33) DBP: 82 (12) | 109 62 | 183 100 | SBP: 137 (23) DBP: 84 (16) | 109 66 | 183 100 | SBP:130 (34) DBP: 79.5 (12) | 112 62 | 170 98 |
| Body Mass Index, kg/m2 | 29.2 (7.6) | 17.8 | 52.1 | 29.1 (7.5) | 14.8 | 52.1 | 29.4 (7.4) | 22.1 | 37.4 |
| Vitamin D (ng/mL) | 28 (11.1) | 4.8 | 68.6 | 22.6 (18.6) | 4.8 | 63.3 | 32.5 (14.7) | 11.1 | 68.6 |
| Total cholesterol (mg/dL) | 189 (51) | 85 | 271 | 201 (42) | 85 | 271 | 174.5 (33) | 109 | 257 |
| HBA1C Level % | 5.6 (0.7) | 4.1 | 10.5 | 5.7 (0.7) | 4.1 | 10.5 | 5.45 (0.7) | 4.6 | 9.2 |
| PSA (μg/L) | 6.21 (3.27) | 0.56 | 31.5 | 6.12 (2.40) | 1.7 | 31.5 | 6.47 (3.30) | 0.56 | 20.3 |
| Grade | 6 (7) | 0 | 9 | 6 (1) | 0 | 9 | 0 (6) | 0 | 9 |
| Number Positive cores | 1 (4) | 0 | 12 | 3 (5) | 0 | 12 | 0 (1) | 0 | 4 |
| Pathway Name | pv_fdr |
|---|---|
| Nicotine addiction | 7.64 × 10⁻⁶ |
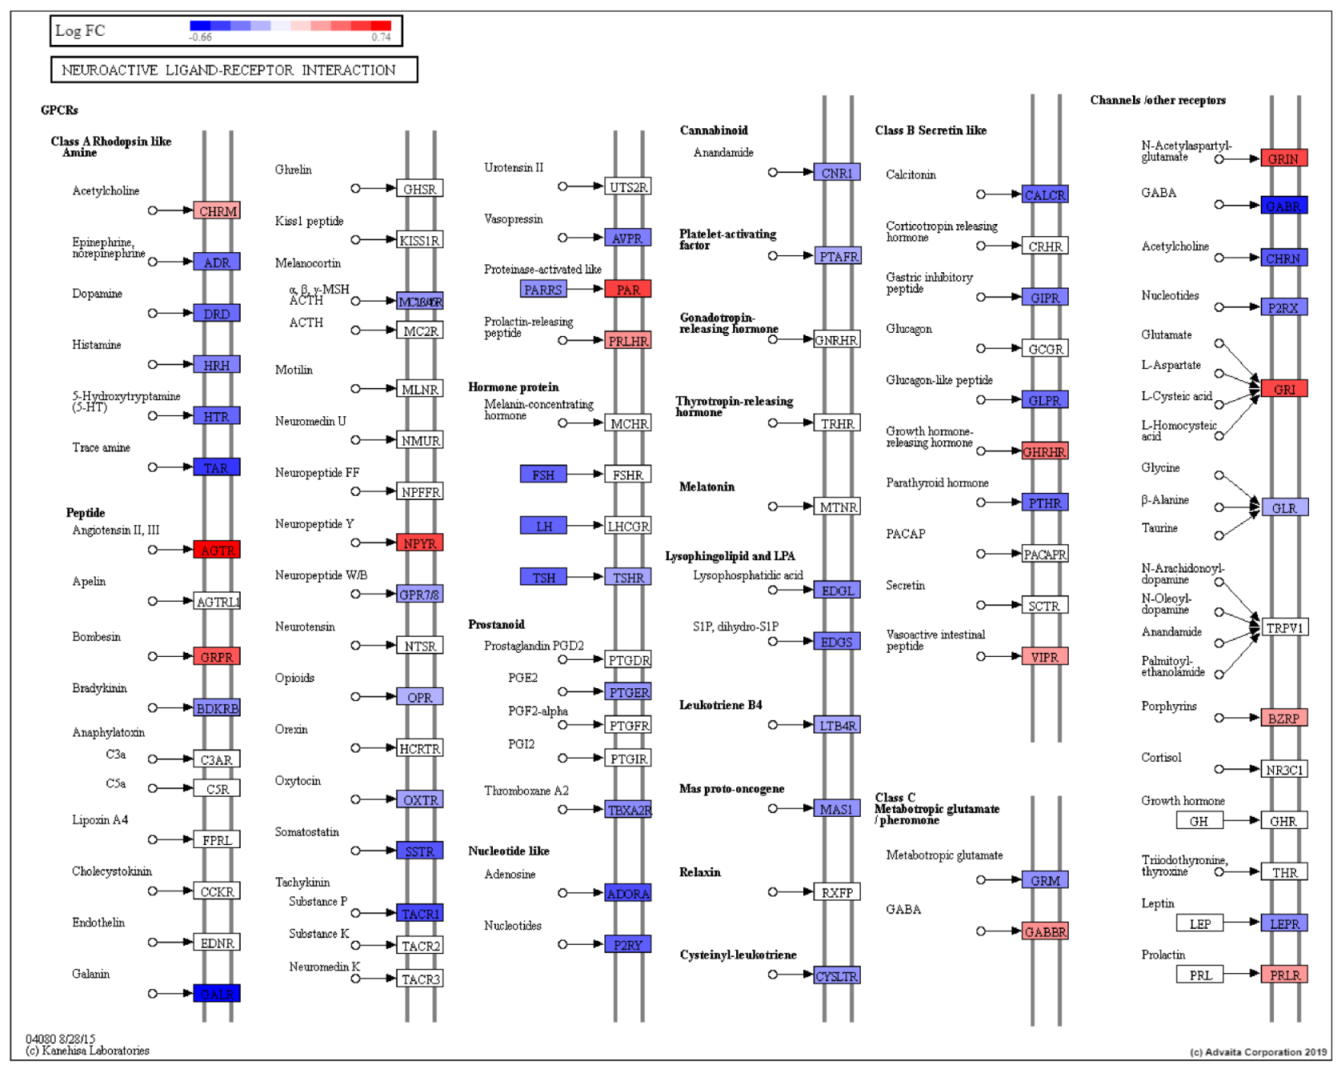
| Neuroactive ligand-receptor interaction | 1.01 × 10⁻³ |
| Taste transduction | 1.01 × 10⁻³ |
| Olfactory transduction | 1.48 × 10⁻³ |
| Arginine and proline metabolism | 1.60 × 10⁻³ |
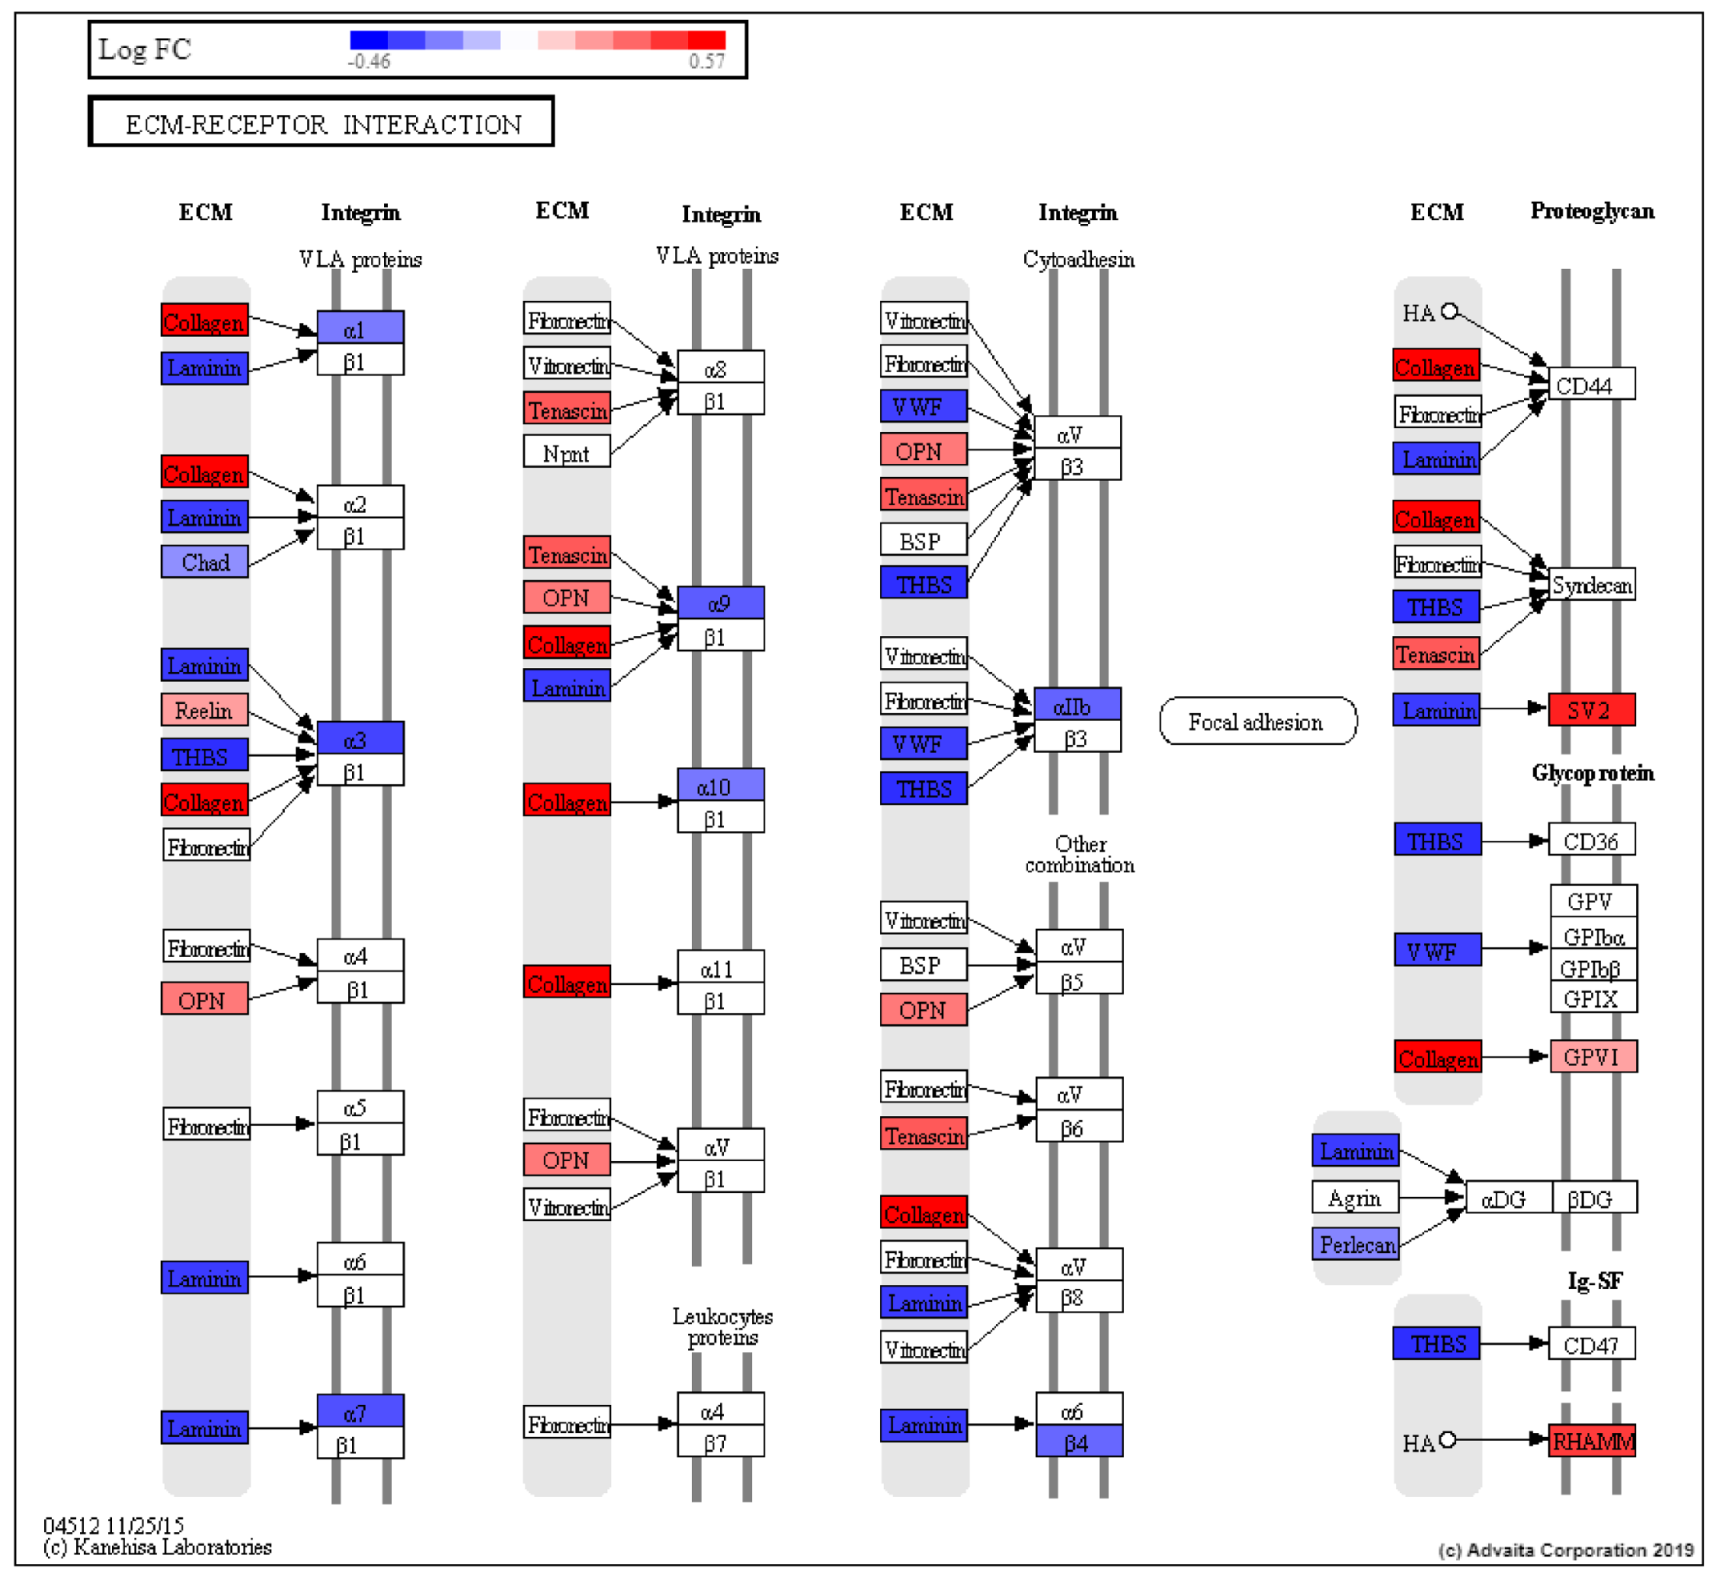
| ECM-receptor interaction | 8.33 × 10⁻³ |
| Cell adhesion molecules (CAMs) | 8.80 × 10⁻³ |
| Drug metabolism-cytochrome P450 | 1.95 × 10⁻² |
| Alcoholism | 1.95 × 10⁻² |
| PI3K-Akt signaling pathway | 1.95 × 10⁻² |
| Most Extreme AA vs. Others | Others (n = 54) | Most Extreme AA (n = 5) | p |
|---|---|---|---|
| Age, years, mean (SD) | 65.4 (6.37) | 60.0 (8.32) | 0.125 |
| Race, White, n (%) | 26 (48.1) | 0 (0.00) | 0.066 |
| BMI, kg/m2, mean (SD) | 29.4 (5.93) | 30.2 (5.77) | 0.775 |
| PSA, (μg/L), median (IQR) | 6.16 (3.40) | 6.25 (0.70) | 0.418 |
| Cancer, Yes, No (%) | 34 (63.0) | 5 (100.0) | 0.156 |
| Gleason Score, median (IQR) | 6 (7) | 7 (0) | 0.046 |
| Number Positive, median (IQR) | 1 (3) | 6 (5) | 0.010 |
| Comorbidities, Yes, n (%) | |||
| Coronary Artery Disease | 6 (11.1) | 0 (0.00) | 1.000 |
| Hypertension | 35 (64.8) | 3 (60.0) | 1.000 |
| Hypercholesterolemia | 41 (75.9) | 3 (60.0) | 0.593 |
| Diabetes mellitus | 15 (27.8) | 2 (40.0) | 0.620 |
| Depression | 8 (14.8) | 1 (20.0) | 0.577 |
| Post-Traumatic Stress Disorder | 10 (18.5) | 2 (40.0) | 0.266 |
| Patient Measures, mean (SD) | |||
| SBP | 136.0 (17.1) | 138.2 (26.6) | 0.794 |
| DBP | 81.2 (9.06) | 85.2 (7.60) | 0.349 |
| Heart Rate | 74.2 (12.6) | 80.2 (16.0) | 0.320 |
| LDL | 122.8 (36.4) | 97.0 (50.1) | 0.146 |
| Triglycerides | 111.5 (51.5) | 141.4 (31.3) | 0.073 |
| Total Cholesterol | 192.1 (39.7) | 176.2 (56.5) | 0.413 |
| WHR | 0.98 (0.074) | 1.00 (0.076) | 0.617 |
| A1c | 5.73 (0.86) | 6.02 (2.57) | 0.330 |
| DHEA-S, median (IQR) | 114 (91) | 279 (173) | 0.211 |
| Serum Creatinine | 1.04 (0.22) | 1.03 (0.28) | 0.944 |
| Serum Albumin | 3.89 (0.31) | 3.86 (0.34) | 0.855 |
| C-Reactive Protein | 0.50 (0.81) | 0.24 (0.11) | 0.035 |
| Serum D3 levels | 31.0 (14.2) | 20.3 (13.3) | 0.112 |
| Service Era, n (%) | 0.757 | ||
| Vietnam | 38 (70.4) | 3 (60.0) | |
| Post-Vietnam | 11 (20.4) | 1 (20.0) | |
| Persian Gulf War | 5 (9.26) | 1 (20.0) | |
| Agent Orange Exposure, Yes, n (%) | 10 (18.5) | 1 (20.0) | 1.000 |
| Multivitamin Supplementation, Yes, n (%) | 19 (35.2) | 0 (0.0) | 0.165 |
| Vitamin D Supplementation, Yes, n (%) | 15 (27.8) | 0 (0.0) | 0.316 |
| Treatment Decision, n (%) | 0.291 | ||
| Watchful Waiting | 3 (5.56) | 0 (0.00) | |
| PSA Screening | 18 (33.3) | 0 (0.00) | |
| Active Surveillance | 19 (35.2) | 2 (40.0) | |
| XRT | 10 (18.5) | 2 (40.0) | |
| Surgery | 4 (7.41) | 1 (20.0) |
Publisher’s Note: MDPI stays neutral with regard to jurisdictional claims in published maps and institutional affiliations. |
© 2021 by the authors. Licensee MDPI, Basel, Switzerland. This article is an open access article distributed under the terms and conditions of the Creative Commons Attribution (CC BY) license (https://creativecommons.org/licenses/by/4.0/).
Share and Cite
Hardiman, G.; Savage, S.J.; Hazard, E.S.; da Silveira, W.A.; Morgan, R.; Harris, A.; Jefferson, M.S.; Wilson, R.C.; Caulder, S.; Ambrose, L.; et al. A Systems Approach to Interrogate Gene Expression Patterns in African American Men Presenting with Clinically Localized Prostate Cancer. Cancers 2021, 13, 5143. https://doi.org/10.3390/cancers13205143
Hardiman G, Savage SJ, Hazard ES, da Silveira WA, Morgan R, Harris A, Jefferson MS, Wilson RC, Caulder S, Ambrose L, et al. A Systems Approach to Interrogate Gene Expression Patterns in African American Men Presenting with Clinically Localized Prostate Cancer. Cancers. 2021; 13(20):5143. https://doi.org/10.3390/cancers13205143
Chicago/Turabian StyleHardiman, Gary, Stephen J. Savage, E. Starr Hazard, Willian A. da Silveira, Rebecca Morgan, Adam Harris, Melanie S. Jefferson, Robert C. Wilson, Susan Caulder, Linda Ambrose, and et al. 2021. "A Systems Approach to Interrogate Gene Expression Patterns in African American Men Presenting with Clinically Localized Prostate Cancer" Cancers 13, no. 20: 5143. https://doi.org/10.3390/cancers13205143