3.1. Characterizations of the Modified Clay
The thermal stability data of the clay and Mclay are shown in
Figure 1. The thermal stability of the clay was much better than that of the Mclay. The clay had a mass loss of up to 170 °C from the evaporation of adsorbed water. A further small mass loss was observed over the region of 350–570 °C, owing to the removal of the interlayer water. Compared with the clay, the Mclay showed a sharp mass loss of adsorbed water, observed over the temperature range of 180–530 °C, which was attributed to the decomposition of CTAB in the interlayer of the clay.
The XRD patterns of the clay and Mclay are shown in
Figure 2. Diffraction peaks at 7.2° (
d = 12.2 Å) and 6.4° (
d = 13.8 Å) were detected for clay and Mclay, respectively, and were assigned to the (001) crystal plane or basal spacing of the clay, indicating that CTAB intercalated within the clay interlayer and increased the basal spacing [
16]. Thus, a monomer intercalated into the clay interlayer and assisted in the exfoliation of the clay during the polymerization process. Additional peaks were present at 19.4°, 27.5°, 33.7°, and 60.4°, corresponding to (100), (005), (110), and (330) crystal planes, respectively. Pure clay and Mclay exhibited similar patterns, except for the (005) crystal planes.
3.2. Characterizations and Properties of Nylon 66 and Nylon 66/Mclay Nanocomposites
The cross-sectional image of the nylon 66/Mclay in
Figure 3 shows a smooth fractured surface and no aggregations of Mclay sheets, indicating that the Mclay particles were well-dispersed in the PA66/Mclay composites.
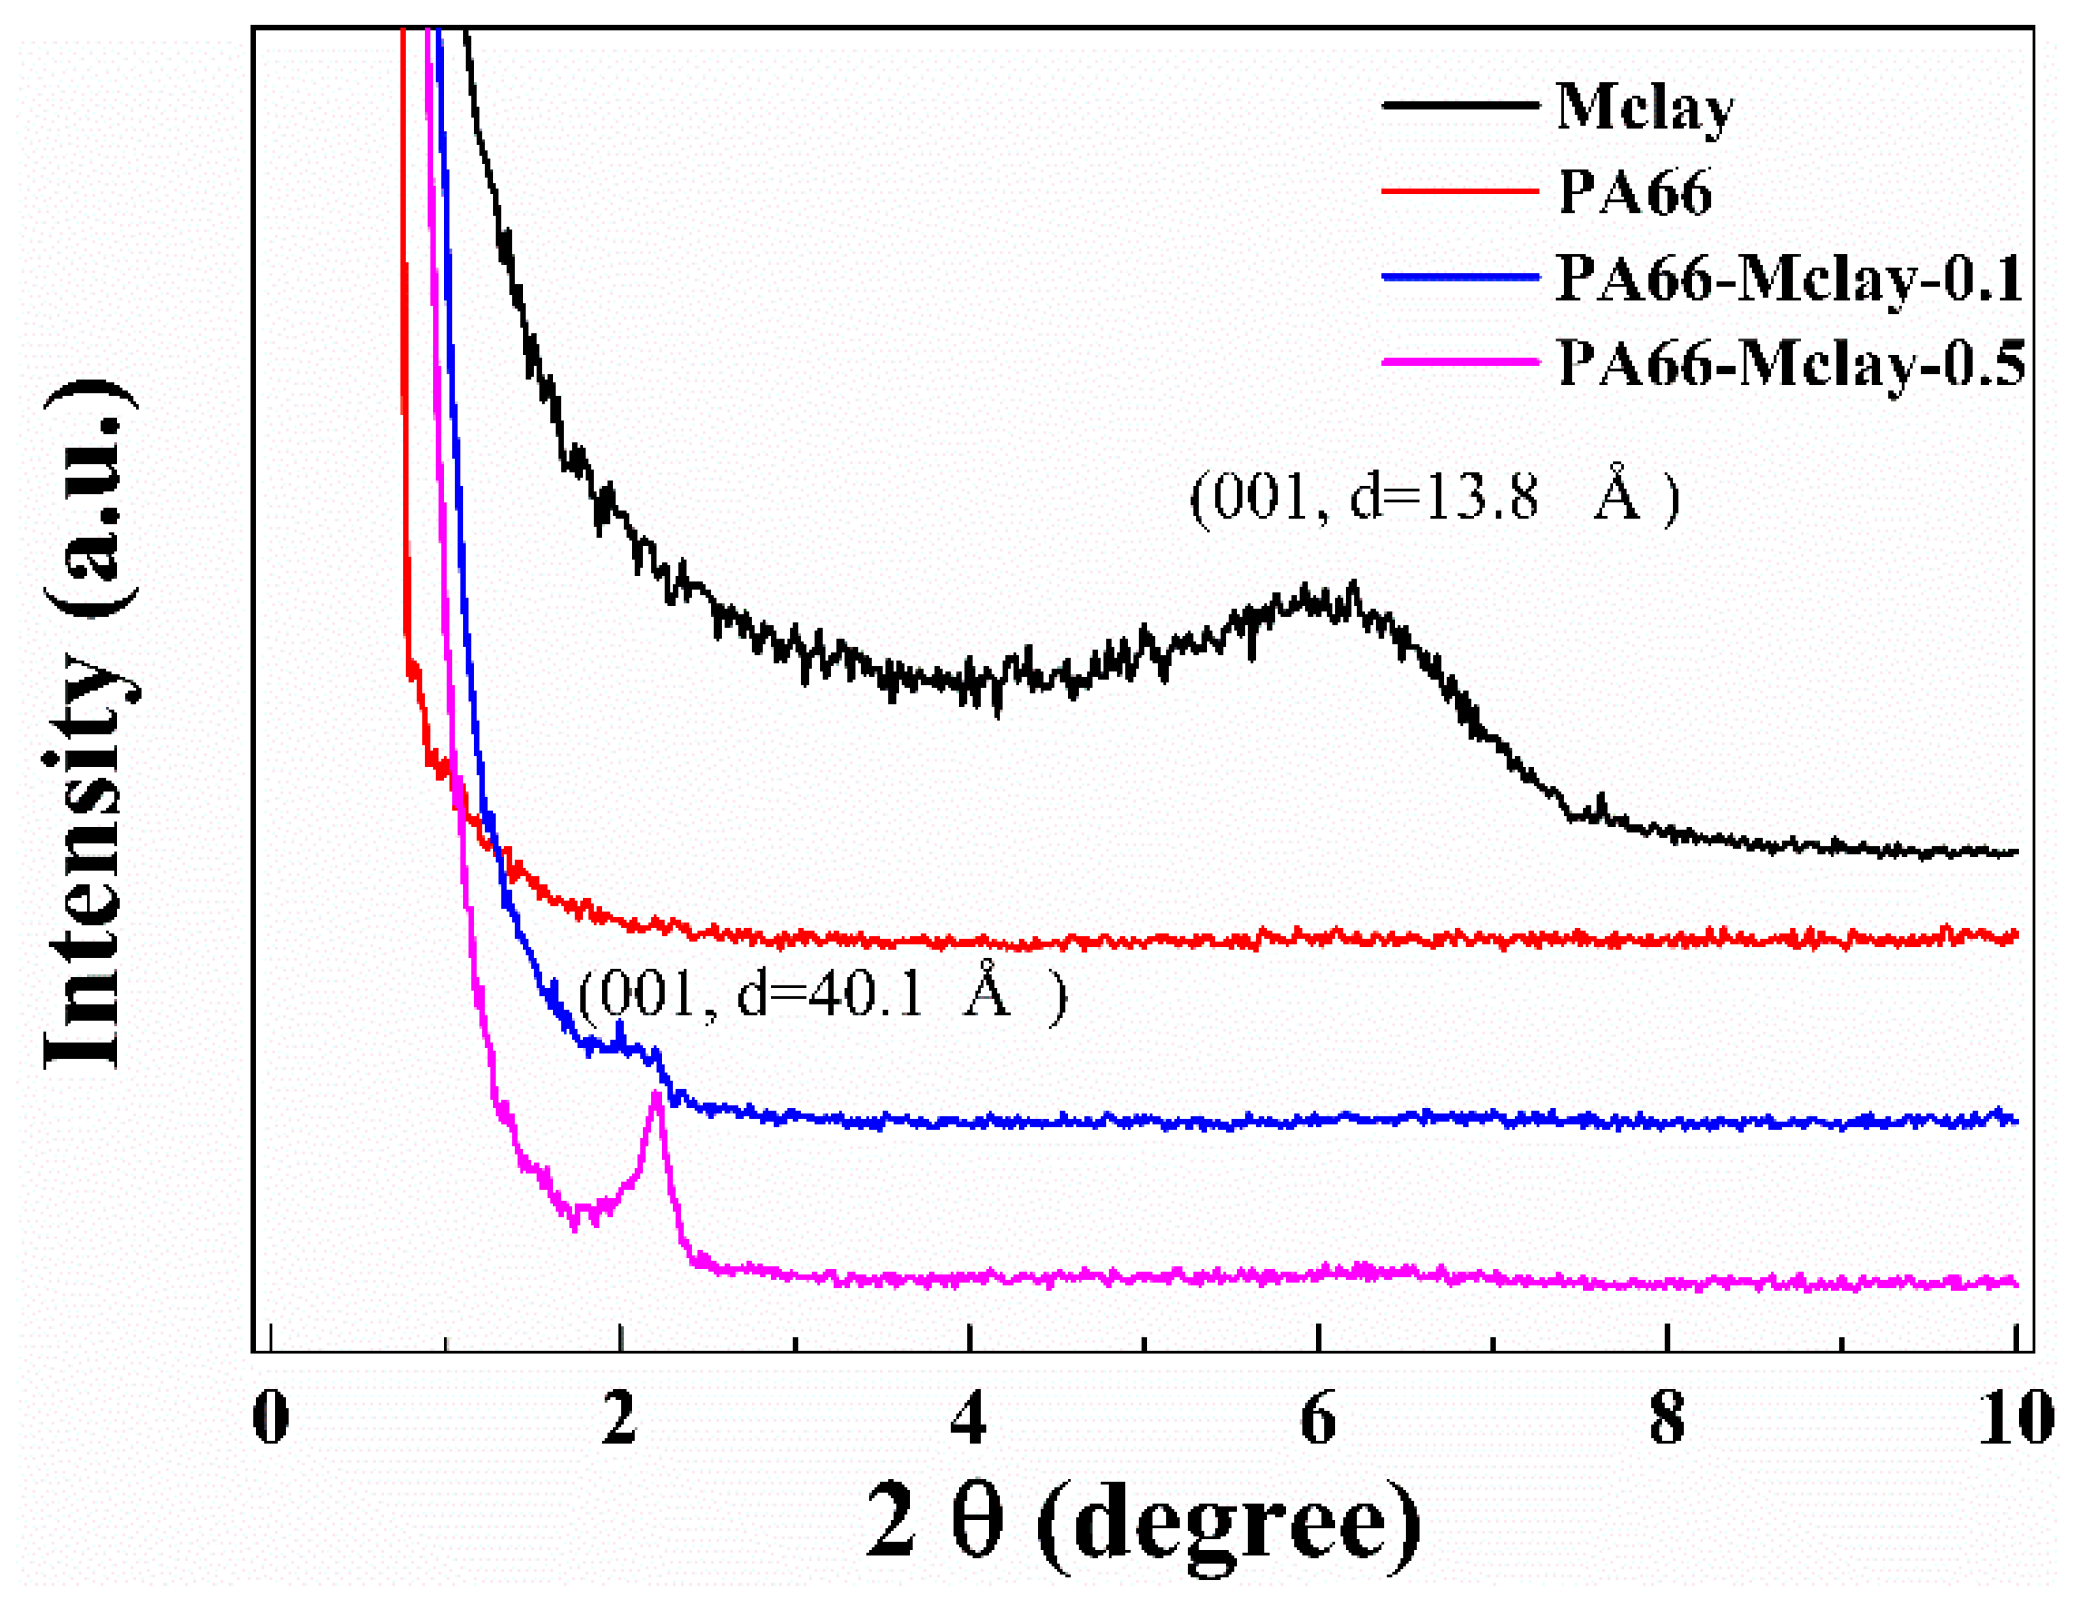
Small-angle X-ray diffraction patterns for the Mclay powder, nylon 66, and the nanocomposites are shown in
Figure 4. A diffraction peak at 2θ = 6.4° (
d = 13.8 Å) in the Mclay, which is a reflection from the clay basal spacing, disappeared in the nanocomposites, and a new diffraction peak appeared at approximately 2θ = 2.2° (
d = 44.1 Å). The new peak was likely generated from a widening of the 001 crystal plane, with the chain of nylon 66 widening the clay interlayer, but not resulting in complete exfoliation. This form of clay likely decreased the shear melt viscosity of the nanocomposites.
The melting endotherm graphs of neat nylon 66 and nylon 66/clay nanocomposites during the second heating cycle are shown in
Figure 5, and
Table 2 lists the DSC data. The melting peaks fluctuated slightly at around 261 °C. However, the pure nylon 66 in
Figure 5a exhibited only one melting peak [
17] and the nanocomposites exhibited two melting peaks, which was similar to our previous reports [
18]. The main melting temperature (
TmI) at 260 °C is attributed to a Form
I, or α-type peak [
3]. The second melting temperature (
TmII) at 252 °C was attributed to a Form
II, or γ-type peak. These results indicate that introducing clay into PA66 increased the amount of γ-form crystals and hindered the formation of perfect α nylon crystals during the heating cycle of the DSC measurements [
19]. The crystallization exotherm curves of the samples during the cooling cycle are shown in
Figure 5b. Pure PA66 had a wide crystallization peak, with a crystallization temperature (
Tc) peak at 215.0 °C. The nanocomposites with Mclay had much higher
Tc values, which were approximately 15 and 10 °C higher than those of the pure polymer, respectively. The crystallization peaks of the nanocomposites were also narrower. This result suggests that the clay acted as a nucleation agent and increased the crystallization rate of the nanocomposites, which was further confirmed by the non-isothermal crystallization analysis in
Figure 6 and
Table 3. For example, at the same cooling rate of 10 °C/min, the half crystallization times of PA66, PA66-Mclay-0.05, PA66-Mclay-0.075, PA66-Mclay-0.1, and PA66-Mclay-0.5 were 1.57, 0.72, 0.53, 0.39, and 0.48 min, respectively. The addition of Mclay greatly increased the crystallization rate of the nylon 66/Mclay nanocomposites. Moreover, the crystallization temperature increased until the Mclay content was 0.075, and then it decreased. The relative crystallinity also increased and then decreased with the increases of the Mclay content. This phenomenon will be explained later.
The evidence for the thermal stability of PA66 and PA66/Mclay nanocomposites was obtained through TGA (
Figure 7). There were no significant differences between the TGA curves of the PA66 and PA66/Mclay nanocomposites, indicating that the addition of Mclay did not affect the thermal decomposition temperature of the PA66/Mclay nanocomposites. The carbon residue of the PA66/Mclay nanocomposites slightly increased with the increase of the Mclay loadings. These results indicate that the Mclay may promote the generation of residual carbon.
Figure 8 and
Table 4 shows the XRD patterns and detailed data of the neat nylon 66 and nylon 66/Mclay nanocomposites. The positions of the diffraction peaks of the neat nylon 66 nanocomposites at 20.1° and 23.3°, respectively, are reflections of the α1 and α2 form of the nylon 66 crystals [
20], which did not change markedly, although the intensities were slightly different. The intensity of the α1 crystal decreased, and the α2 crystal increased, as the clay content increased. The α1 peak in the XRD pattern of nylon 66 was attributed to the distance between the hydrogen-bonded chains, reflecting the diffraction of the hydrogen-bonded sheets, whereas the α2 peak resulted from the separation of the hydrogen-bonded sheets. The sharp decrease in the intensity of the α1 peak in the nylon 66/Mclay nanocomposites indicates that the addition of clay disrupted the perfect arrangement of the hydrogen-bonded sheets in the α phase. As mentioned above, the crystallization temperature and the relative crystallinity from the DSC data increased and then decreased with the increase of Mclay content. The most likely reason for this outcome was the simultaneous actions of heterogeneous nucleation and the destruction of the perfect arrangement of the hydrogen-bonded sheets. Heterogeneous nucleation increases relative crystallinity and the crystallization temperature. At the same time, the relative crystallinity and the crystallization temperature are proportional to the density of the hydrogen bonds for a polyamide. Heterogeneous nucleation dominated the increase of the crystallization rate with a low Mclay content. As the content of Mclay increased, the destruction of the hydrogen bond also increased, causing the relative crystallinity and the crystallization temperature to decrease.
The viscosity number (VN) and intrinsic viscosity of bare nylon 66, and nylon 66 separated from nylon 66/Mclay nanocomposites, were determined by the Ubbelohde viscometer method. The VN and intrinsic viscosity of nylon 66 increased when clay was introduced into the nylon matrix, indicating that the molecular weight of nylon 66 increased as the content of the clay increased, as shown in
Table 5. However, the melt index (MI) of the nanocomposite increased by 117.5% and 24.7% when the clay contents were 0.1 wt % and 0.5 wt %, respectively, despite the high molecular weight of the nanocomposites. This result indicates that the clay played an effective role in reducing the viscosity of nylon 66.
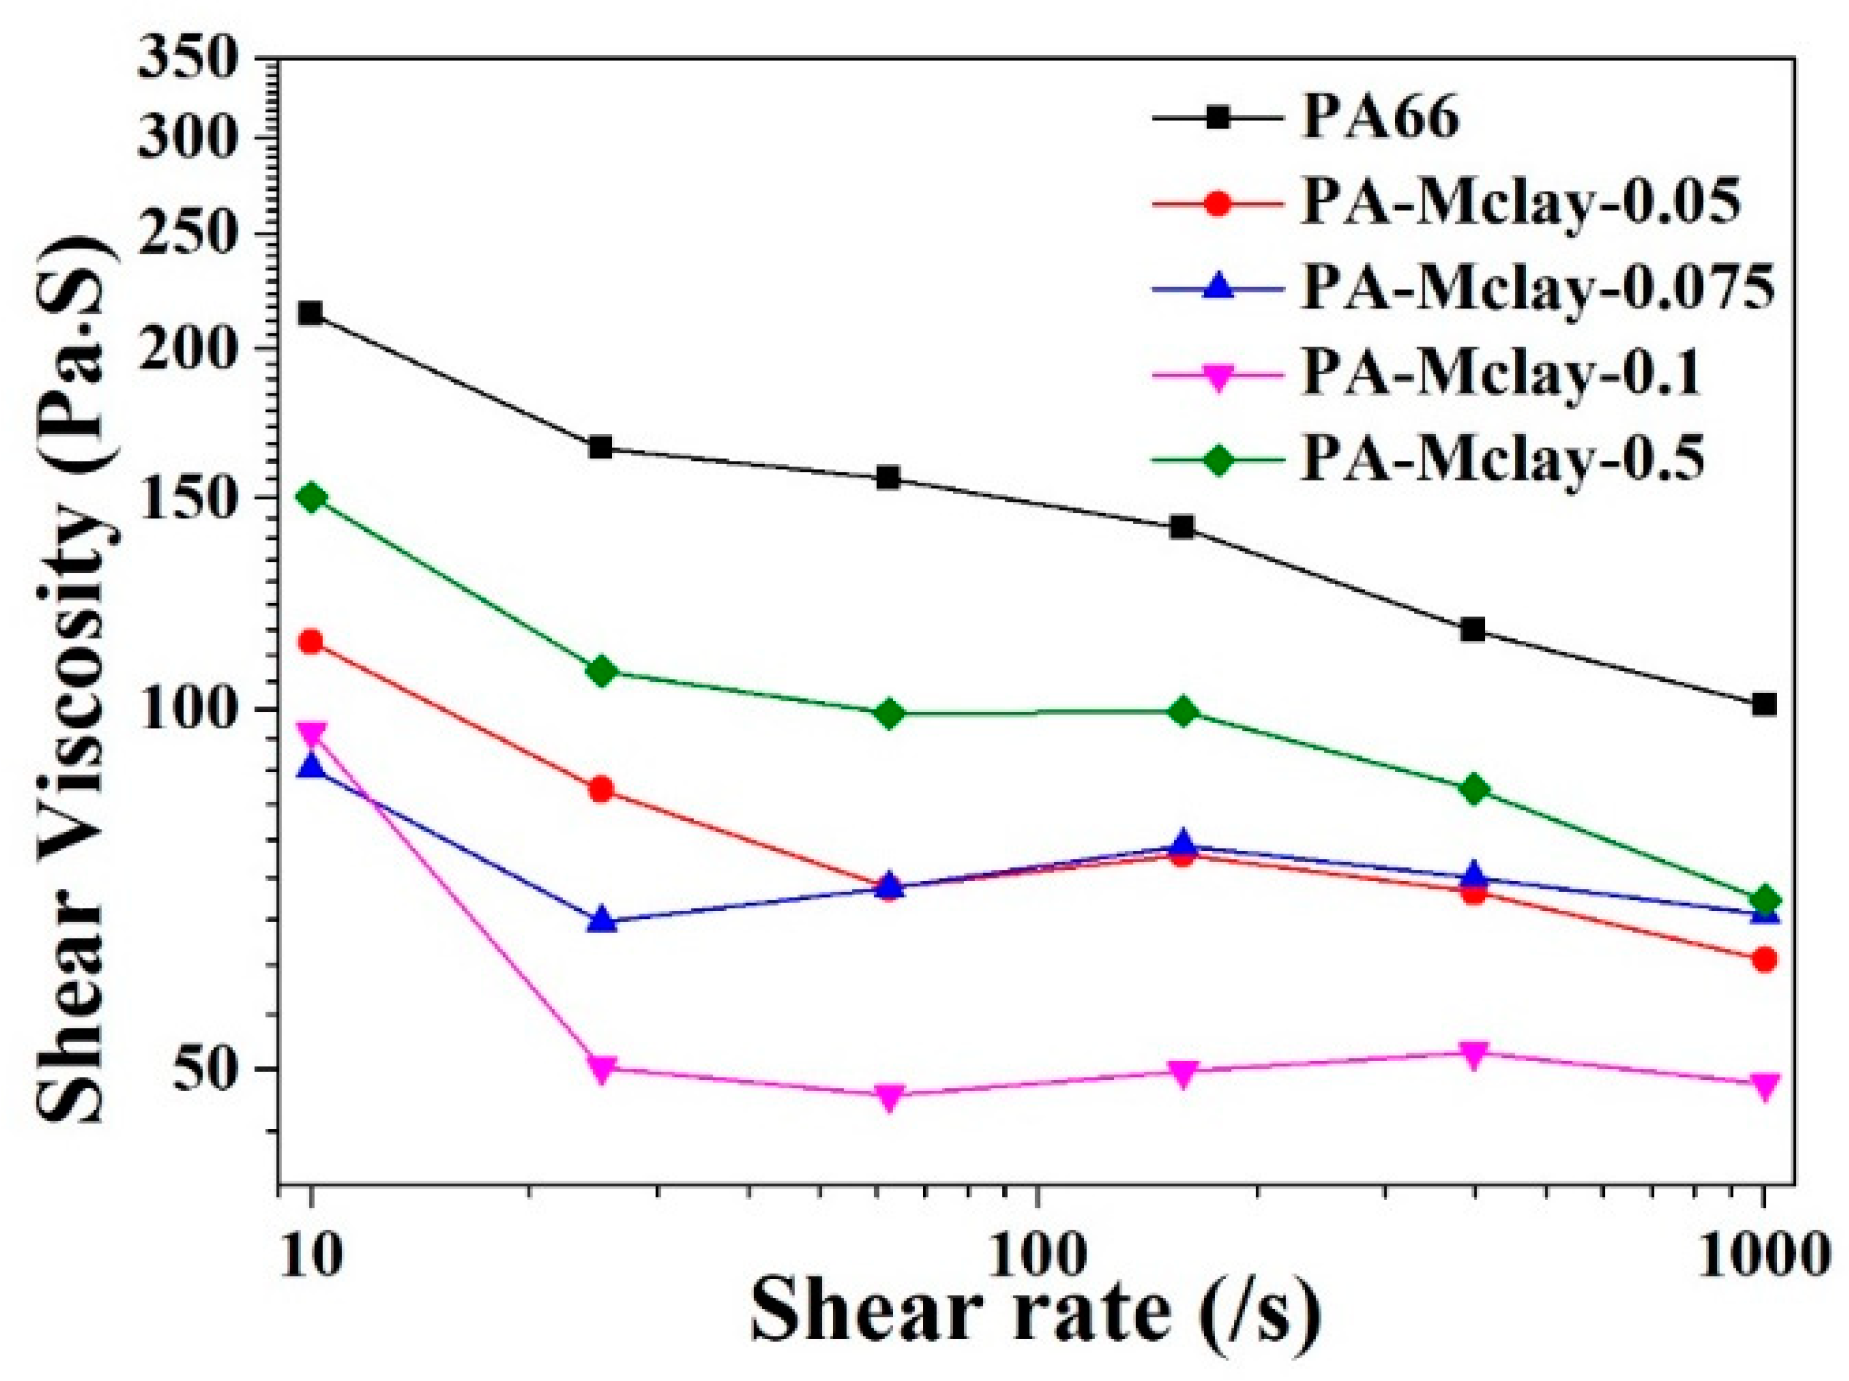
The shear viscosity behaviors of nylon 66 and the various composites at high shear rates, measured by capillary rheometry, are shown in
Figure 9. The nanocomposites exhibited a similar shear-thinning behavior to that of bare nylon 66. Notably, the absolute value of the melt viscosity of the clay nanocomposite was markedly lower than that of neat nylon 66, which is in accordance with the MI measurement. The low viscosity suggests that the nanocomposite would have good melt processability over a wide range of practical processing conditions, such as extrusion and injection molding. One possible mechanism which may have acted to reduce the melt viscosity in the nanocomposites was slippage between the nylon 66 matrix and the exfoliated clay platelets under high shear flow. When the shear rate was between 100–1000 s
−1, the degree of viscosity reduction of the nanocomposites was less than that of pure nylon 66, which showed a more stable shear viscosity with an increased shear rate. This result is useful for improving the processing properties of nanocomposites, particularly during spinning processes.
To study the effects of Mclay on the mechanical properties of nanocomposites, the properties of nanocomposites are shown in
Table 6. The properties of neat nylon 66 are also shown in this table for comparison. The tensile properties of the Mclay composites were notably higher than those of the neat nylon 66, for nanocomposites. The Mclay acts as a viscosity-reducing agent to generate nanocomposites with low melt viscosity and good mechanical properties.


