Soil Moisture Monitoring in Iran by Implementing Satellite Data into the Root-Zone SMAR Model

 , ,
, ,  ,
, 
Abstract
:
1. Introduction
2. Materials and Methods
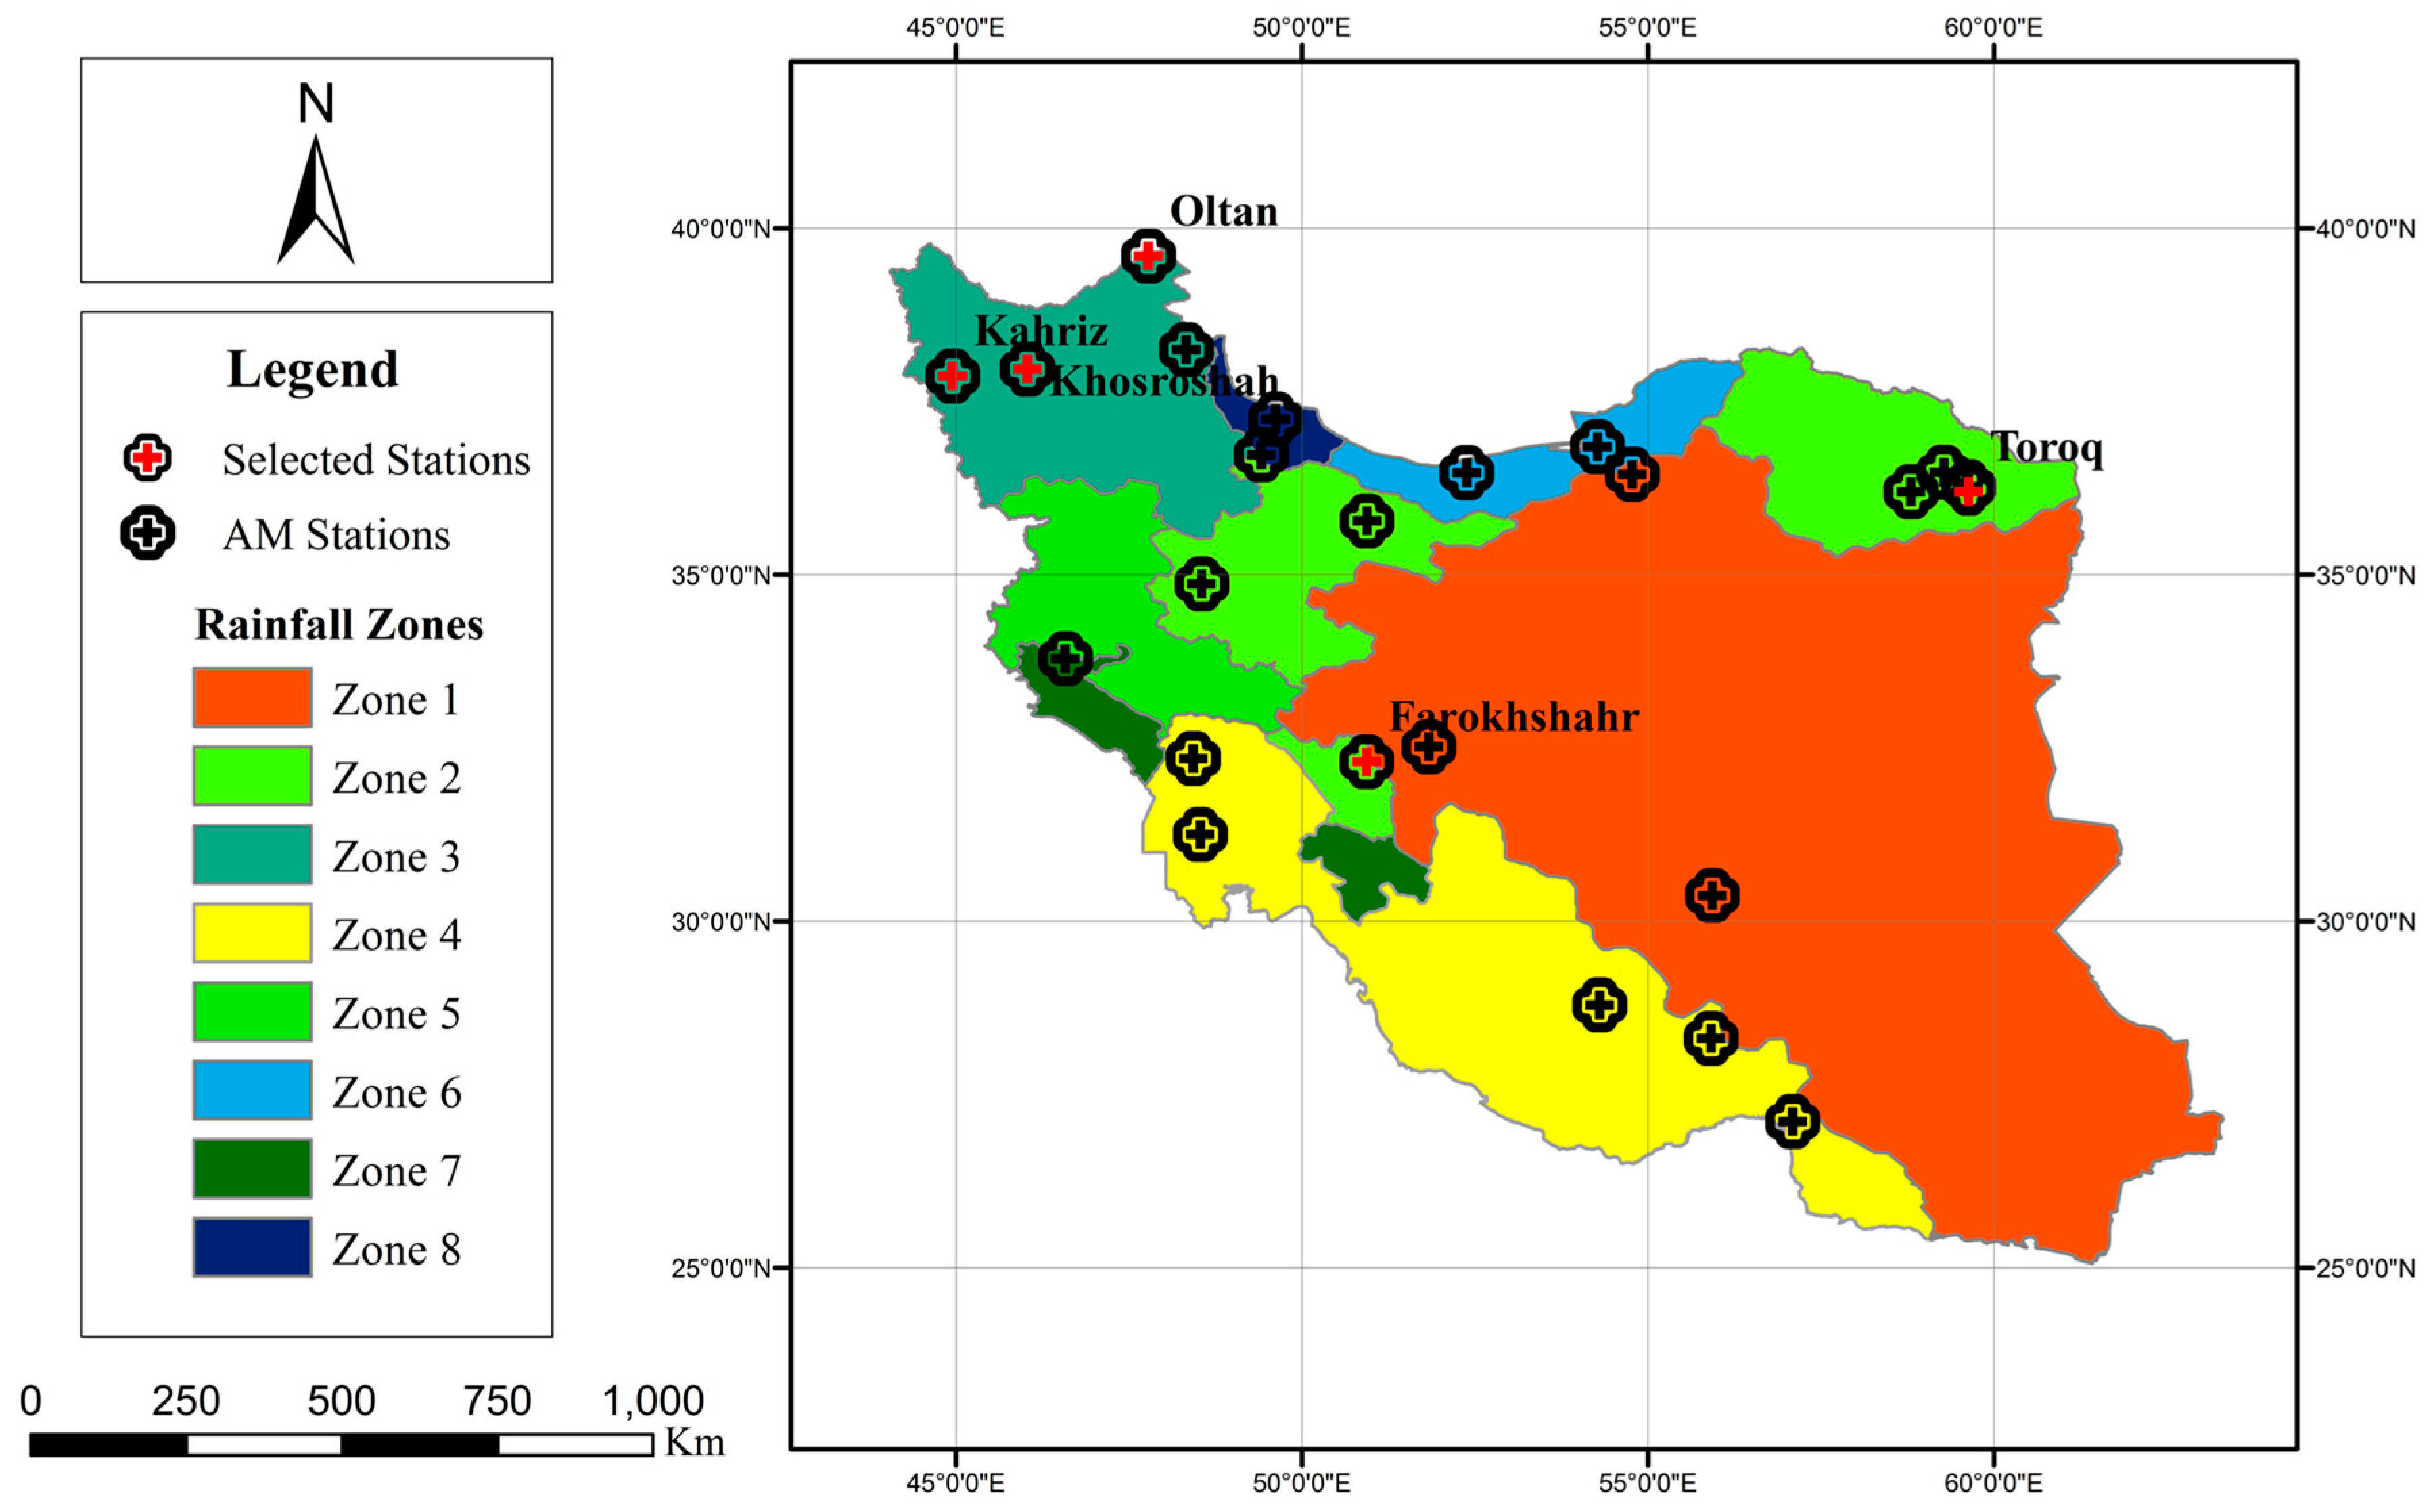
2.1. Study Area
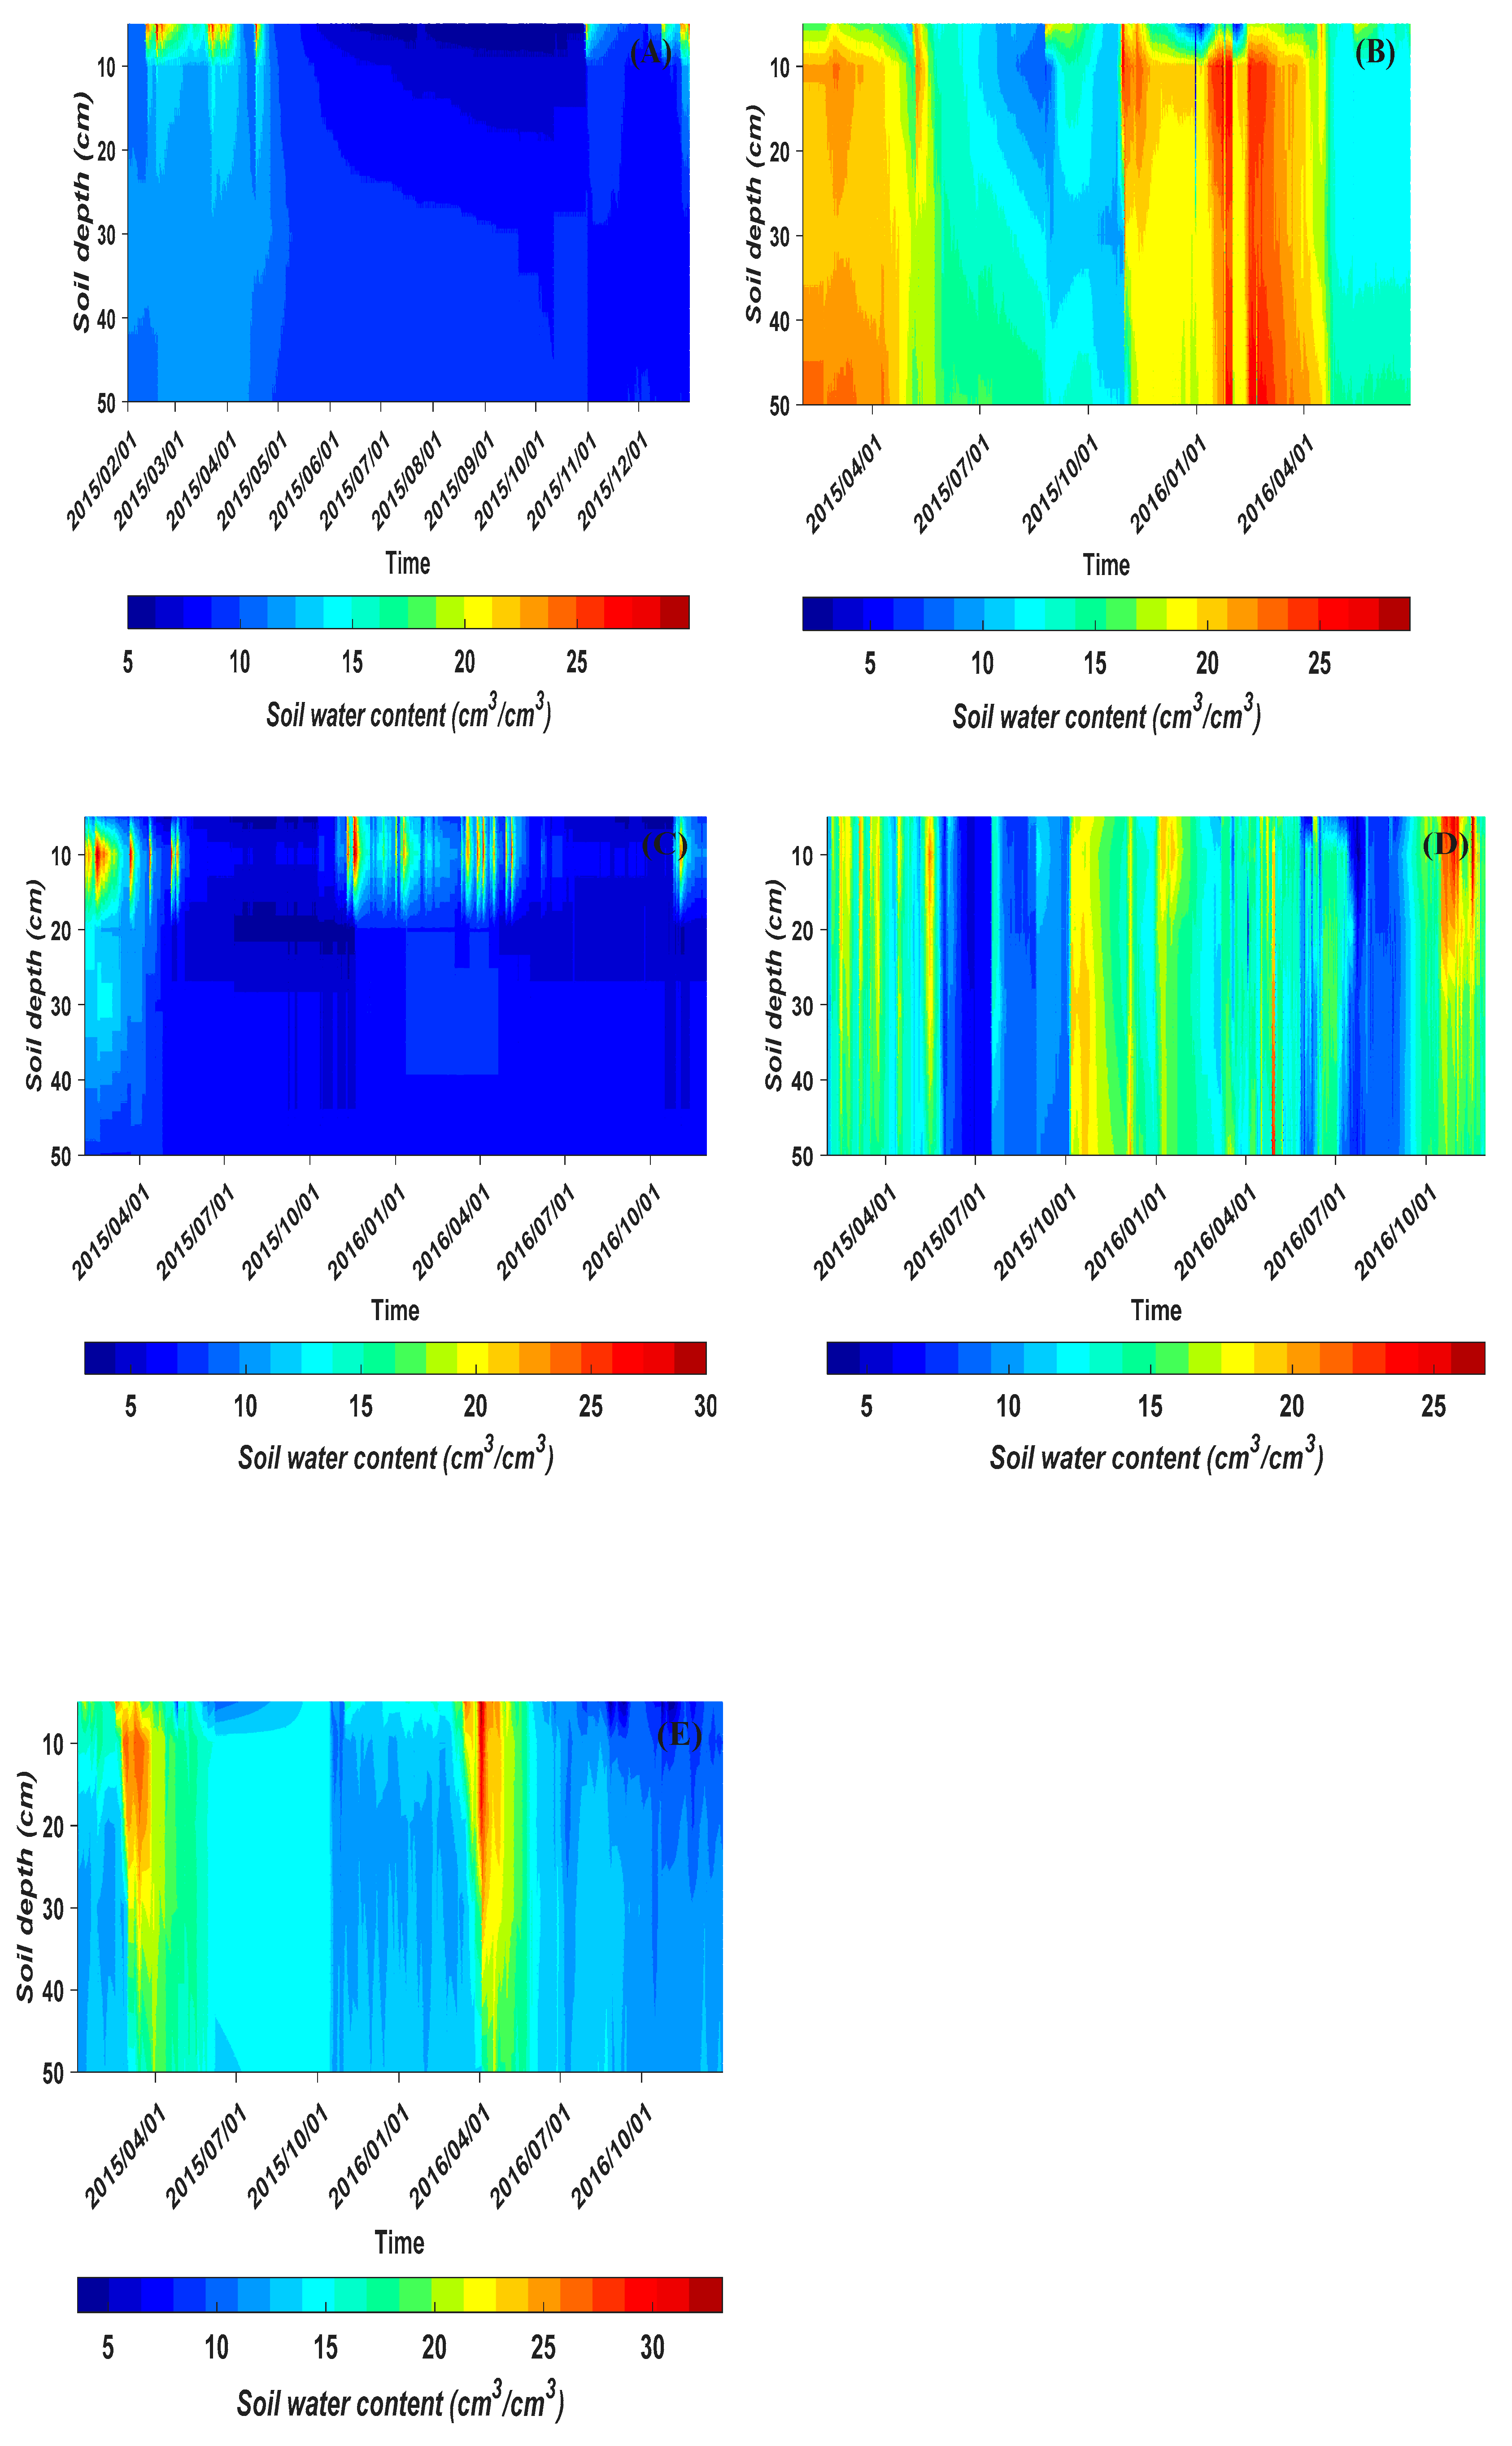
2.2. In Situ Data
2.3. Satellite Data
2.4. Soil Moisture Analytical Relationship (SMAR) Model
2.5. Root Zone Soil Moisture Estimations
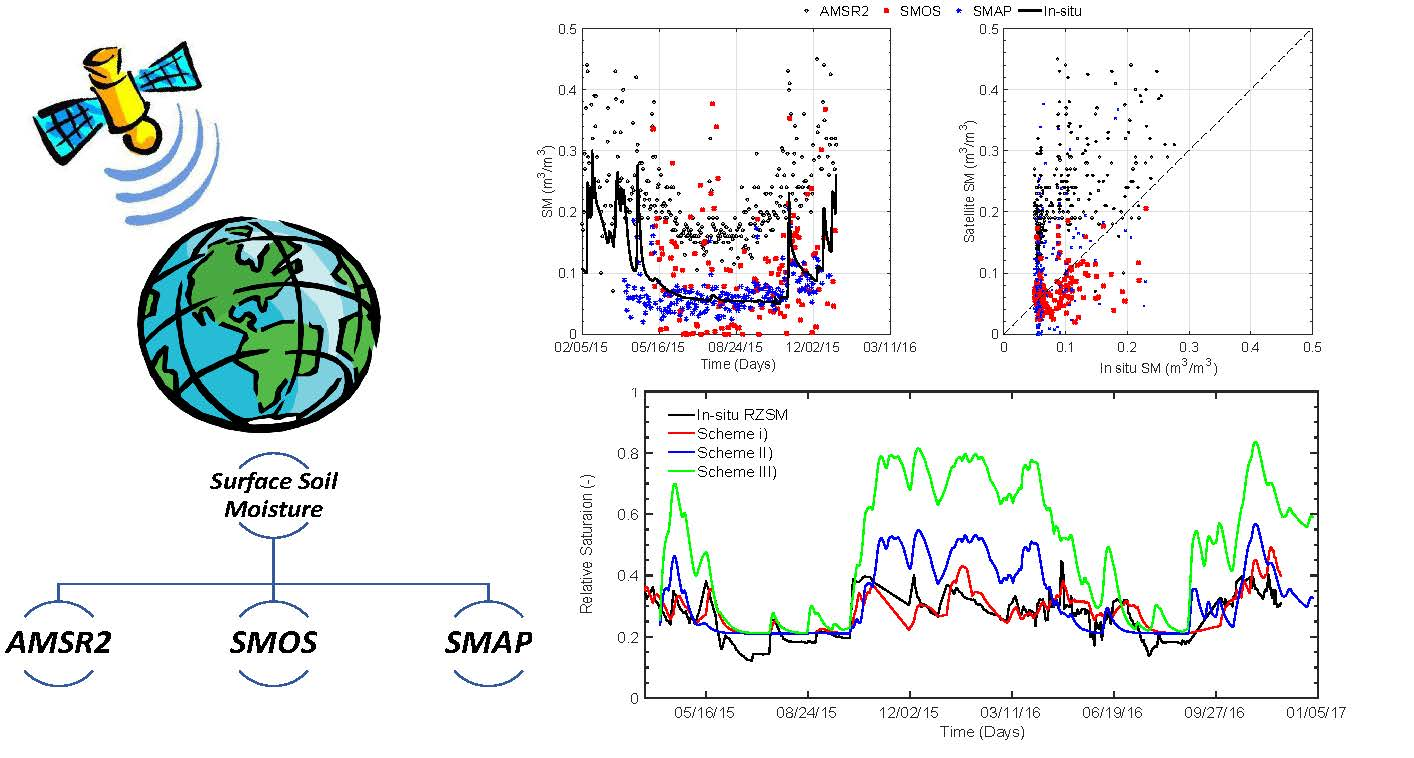
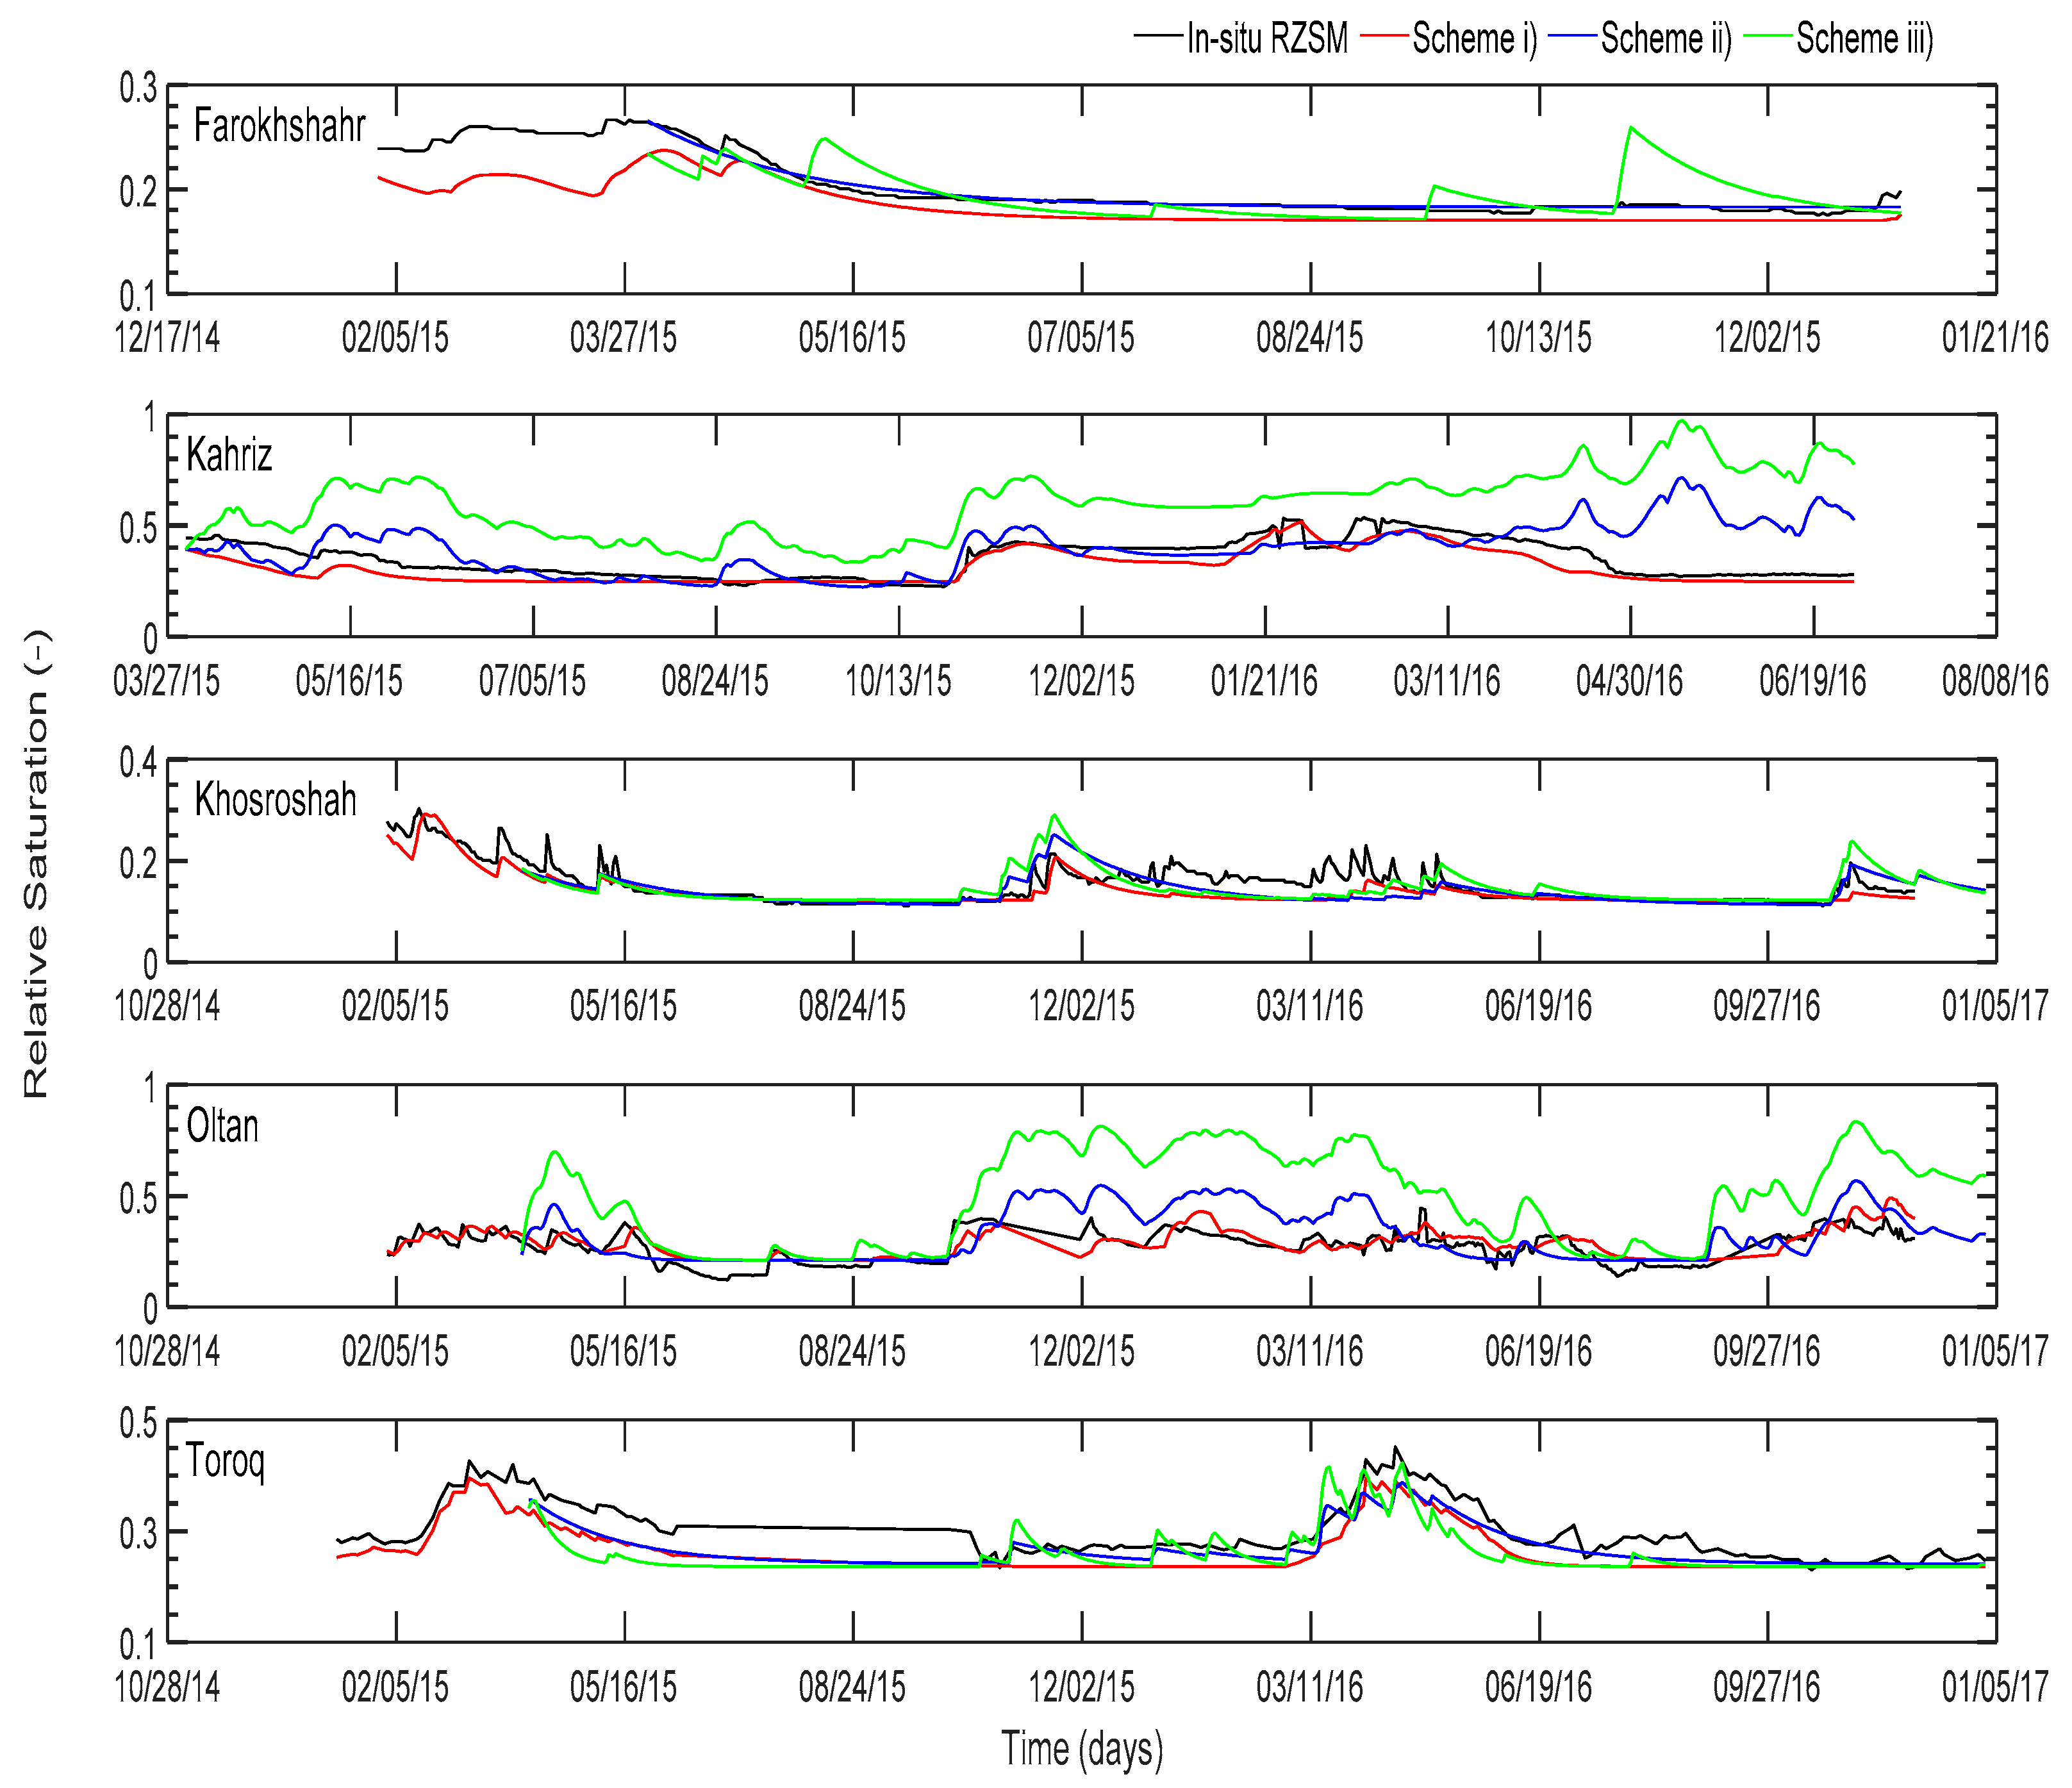
- Scheme i: SMAR model is used exploiting as input the time series of in situ SSM data and it is calibrated with the values of in situ observations of RZSM (i.e., point scale application);
- Scheme ii: SMAR model is used exploiting as input the time series of satellite SSM data and it is calibrated with the values of in situ observations of RZSM (i.e., pixel scale application);
- Scheme iii: SMAR model is used exploiting as input the time series of satellite SSM data, but parameters are assigned using the same values obtained from the point scale/scheme i (i.e., an extension of in situ point parametrization to the pixel scale.)
3. Results and Discussion
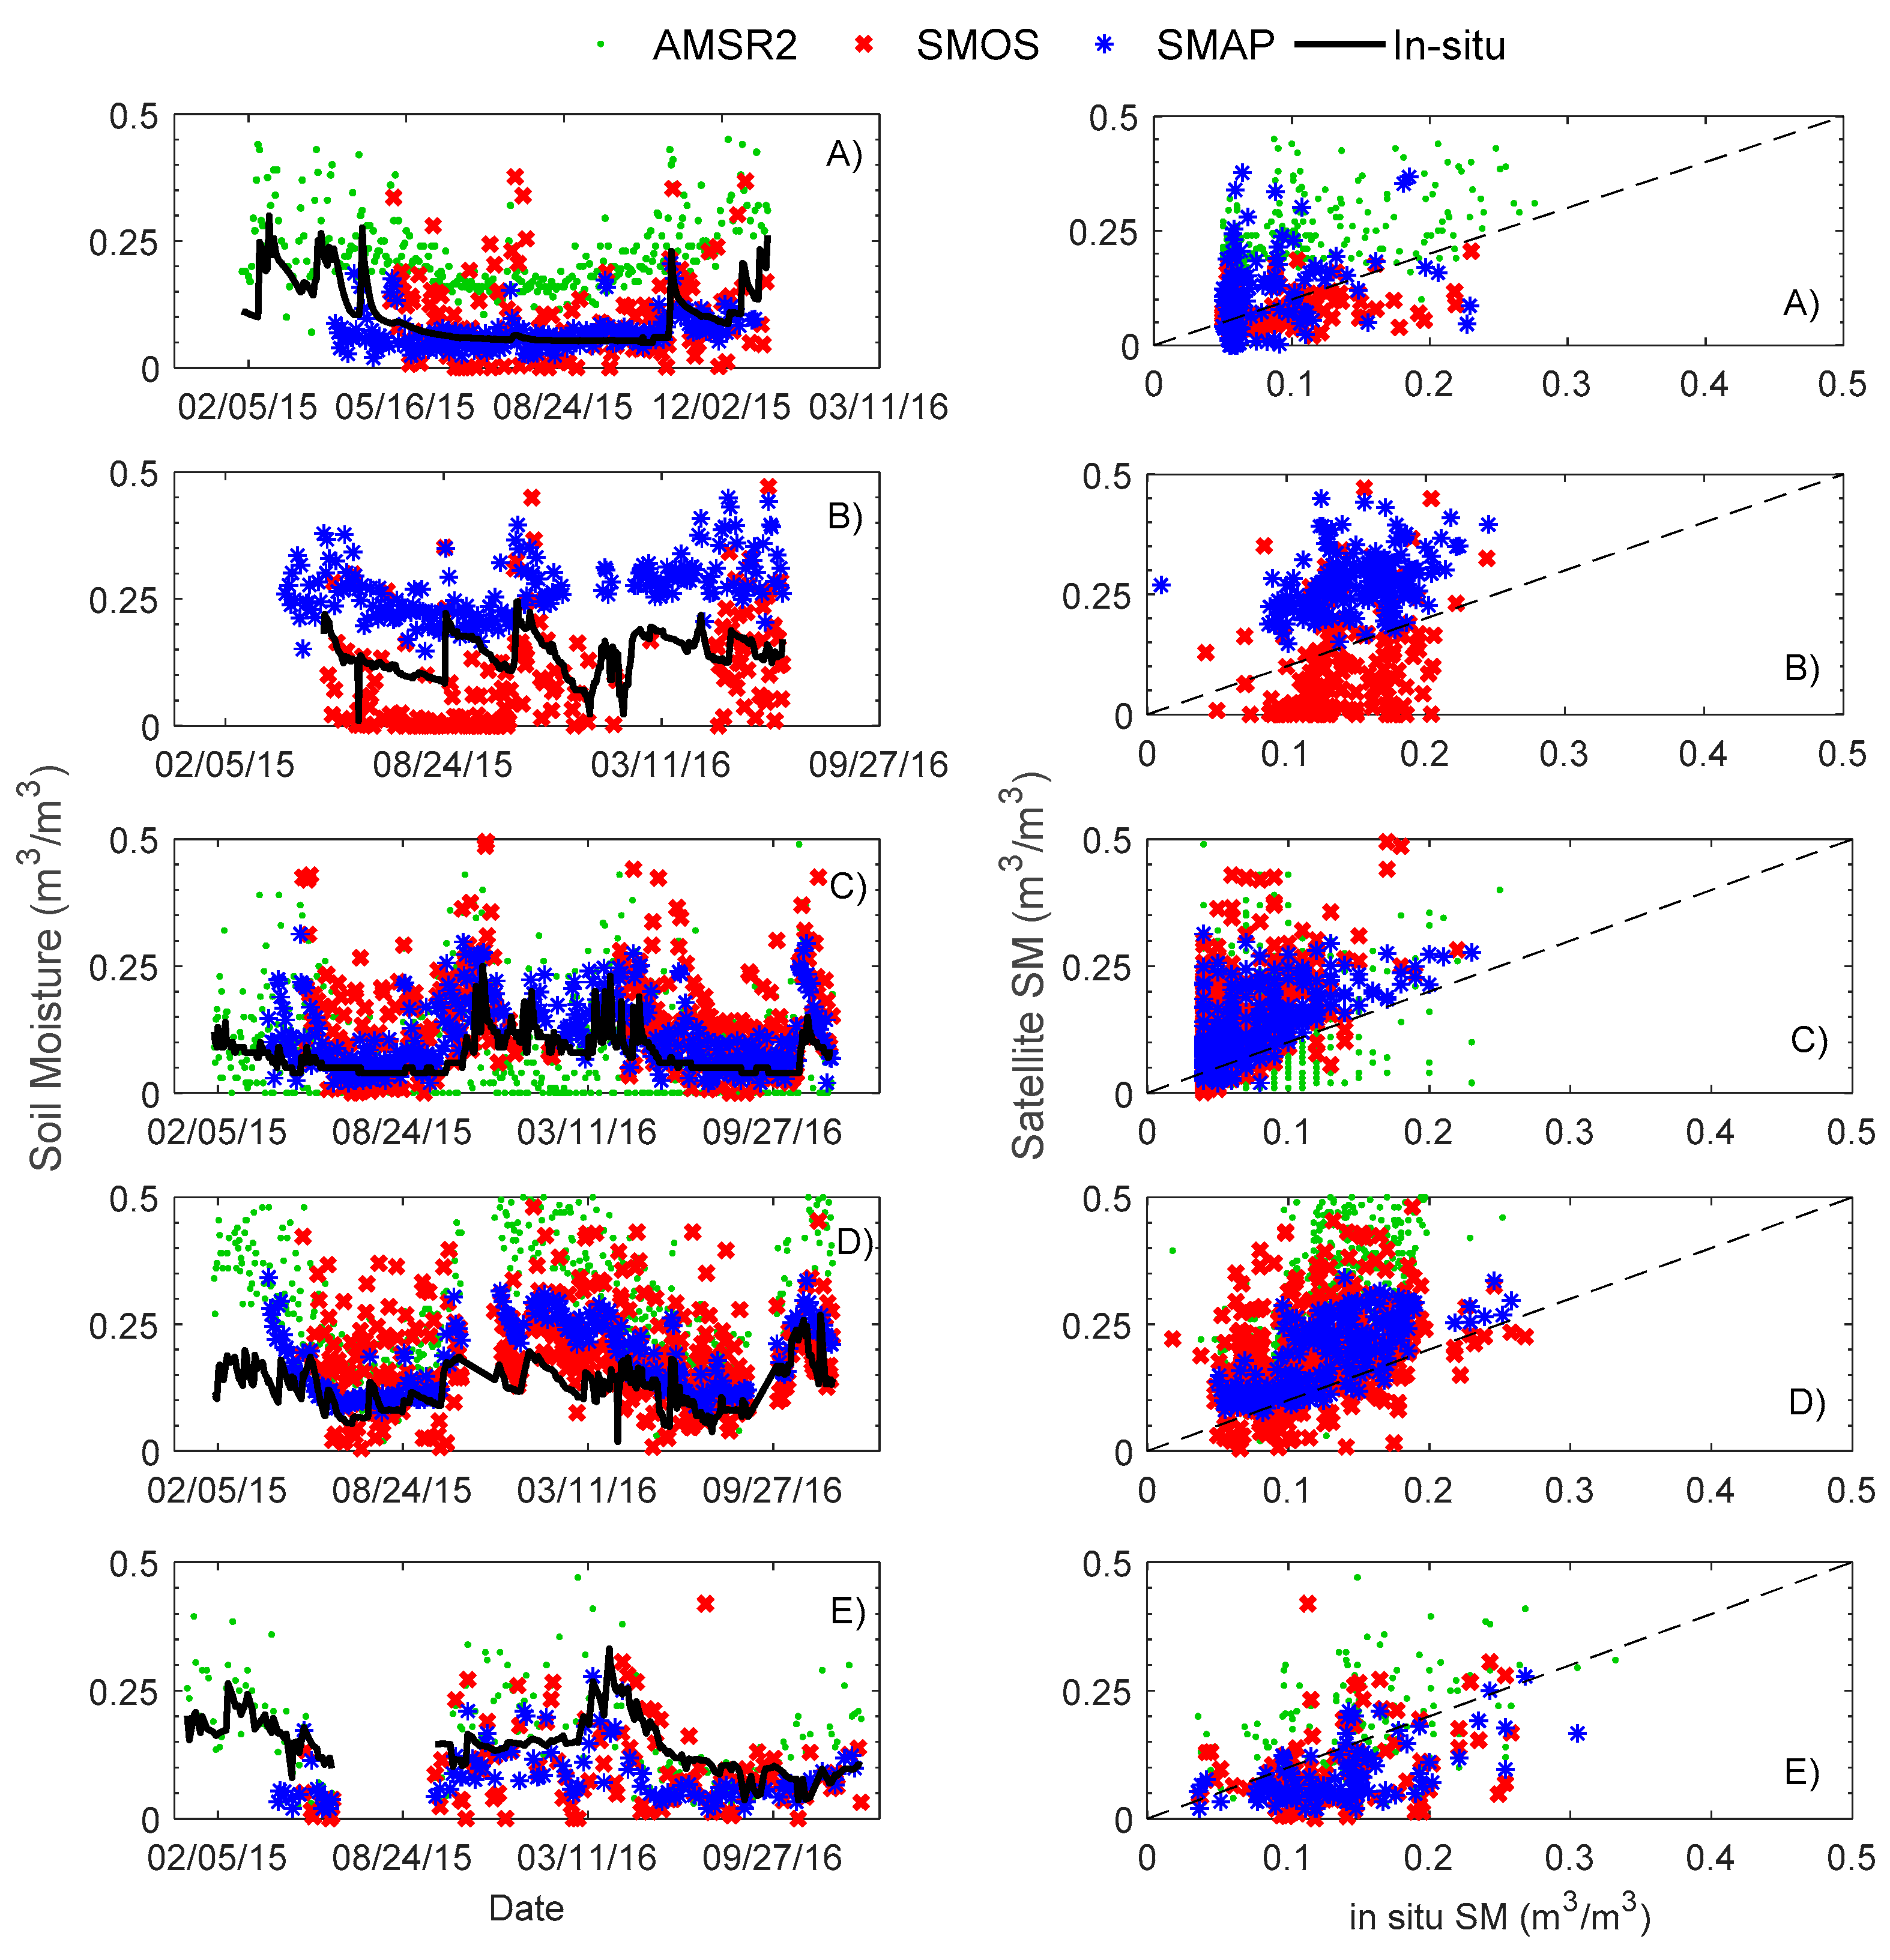
3.1. Evaluation of Remotely-Sensed Data
3.2. Application of the SMAR Model
4. Conclusions
Author Contributions
Funding
Conflicts of Interest
References
- Owe, M.; de Jeu, R.; Walker, J. A methodology for surface soil moisture and vegetation optical depth retrieval using the microwave polarization difference index. IEEE Trans. Geosci. Remote Sens. 2001, 39, 1643–1654. [Google Scholar] [CrossRef] [Green Version]
- Seneviratne, S.I.; Corti, T.; Davin, E.L.; Hirschi, M.; Jaeger, E.B.; Lehner, I.; Orlowsky, B.; Teuling, A.J. Investigating soil moisture–climate interactions in a changing climate: A review. Earth Sci. Rev. 2010, 99, 125–161. [Google Scholar] [CrossRef]
- Koster, R.D.; Dirmeyer, P.A.; Guo, Z.; Bonan, G.; Chan, E.; Cox, P.; Gordon, C.; Kanae, S.; Kowalczyk, E.; Lawrence, D. Regions of strong coupling between soil moisture and precipitation. Science 2004, 305, 1138–1140. [Google Scholar] [CrossRef] [PubMed]
- Petropoulos, G.P.; Ireland, G.; Barrett, B. Surface soil moisture retrievals from remote sensing: Current status, products & future trends. Phys. Chem. Earth 2015, 83, 36–56. [Google Scholar]
- Manfreda, S.; McCabe, M.F.; Fiorentino, M.; Rodríguez-Iturbe, I.; Wood, E.F. Scaling characteristics of spatial patterns of soil moisture from distributed modelling. Adv. Water Resour. 2007, 30, 2145–2150. [Google Scholar] [CrossRef]
- Engman, E.T. Applications of microwave remote sensing of soil moisture for water resources and agriculture. Remote Sens. Environ. 1991, 35, 213–226. [Google Scholar] [CrossRef]
- Entekhabi, D.; Nakamura, H.; Njoku, E.G. Solving the inverse problem for soil moisture and temperature profiles by sequential assimilation of multifrequency remotely sensed observations. IEEE Trans. Geosci. Remote Sens. 1994, 32, 438–448. [Google Scholar] [CrossRef]
- Bolten, J.D.; Crow, W.T.; Zhan, X.; Jackson, T.J.; Reynolds, C.A. Evaluating the utility of remotely sensed soil moisture retrievals for operational agricultural drought monitoring. IEEE J. Sel. Top. Appl. Earth Obs. Remote Sens. 2010, 3, 57–66. [Google Scholar] [CrossRef]
- Albergel, C.; Rüdiger, C.; Pellarin, T.; Calvet, J.-C.; Fritz, N.; Froissard, F.; Suquia, D.; Petitpa, A.; Piguet, B.; Martin, E. From near-surface to root-zone soil moisture using an exponential filter: An assessment of the method based on in situ observations and model simulations. Hydrol. Earth Syst. Sci. 2008, 12, 1323–1337. [Google Scholar] [CrossRef]
- Ford, T.; Harris, E.; Quiring, S. Estimating root zone soil moisture using near-surface observations from SMOS. Hydrol. Earth Syst. Sci. 2014, 18, 139–154. [Google Scholar] [CrossRef] [Green Version]
- Zhao, W.; Li, A. A comparison study on empirical microwave soil moisture downscaling methods based on the integration of microwave-optical/IR data on the Tibetan Plateau. Int. J. Remote Sens. 2015, 36, 4986–5002. [Google Scholar] [CrossRef]
- Wang, L.; Qu, J.J. Satellite remote sensing applications for surface soil moisture monitoring: A review. Front. Earth Sci. 2009, 3, 237–247. [Google Scholar] [CrossRef]
- Jackson, T.J., III. Measuring surface soil moisture using passive microwave remote sensing. Hydrol. Process 1993, 7, 139–152. [Google Scholar] [CrossRef]
- Kim, H.; Lakshmi, V. Use of Cyclone Global Navigation Satellite System (CYGNSS) observations for estimation of soil moisture. Geophys. Res. Lett. 2018, 45, 8272–8282. [Google Scholar] [CrossRef]
- Wagner, W.; Hahn, S.; Kidd, R.; Melzer, T.; Bartalis, Z.; Hasenauer, S.; Figa-Saldaña, J.; de Rosnay, P.; Jann, A.; Schneider, S. The ASCAT soil moisture product: A review of its specifications, validation results, and emerging applications. Meteorol. Z. 2013, 22, 5–33. [Google Scholar] [CrossRef]
- Burgin, M.S.; Colliander, A.; Njoku, E.G.; Chan, S.K.; Cabot, F.; Kerr, Y.H.; Bindlish, R.; Jackson, T.J.; Entekhabi, D.; Yueh, S.H. A comparative study of the SMAP passive soil moisture product with existing satellite-based soil moisture products. IEEE Trans. Geosci. Remote Sens. 2017, 55, 2959–2971. [Google Scholar] [CrossRef]
- Massari, C.; Camici, S.; Ciabatta, L.; Brocca, L. Exploiting satellite-based surface soil moisture for flood forecasting in the Mediterranean area: State update versus rainfall correction. Remote Sens. 2018, 10, 292. [Google Scholar] [CrossRef]
- Alvarez-Garreton, C.; Ryu, D.; Western, A.W.; Crow, W.T.; Su, C.H.; Robertson, D.R. Dual assimilation of satellite soil moisture to improve streamflow prediction in data-scarce catchments. Water Resour. Res. 2016, 52, 5357–5375. [Google Scholar] [CrossRef] [Green Version]
- Laiolo, P.; Gabellani, S.; Campo, L.; Silvestro, F.; Delogu, F.; Rudari, R.; Pulvirenti, L.; Boni, G.; Fascetti, F.; Pierdicca, N. Impact of different satellite soil moisture products on the predictions of a continuous distributed hydrological model. Int. J. Appl. Earth Obs. Geoinf. 2016, 48, 131–145. [Google Scholar] [CrossRef]
- Brocca, L.; Ciabatta, L.; Massari, C.; Camici, S.; Tarpanelli, A. Soil moisture for hydrological applications: Open questions and new opportunities. Water 2017, 9, 140. [Google Scholar] [CrossRef]
- Wright, A.J.; Walker, J.P.; Pauwels, V.R. Identification of Hydrologic Models, Optimized Parameters, and Rainfall Inputs Consistent with In Situ Streamflow and Rainfall and Remotely Sensed Soil Moisture. J. Hydrometeorol. 2018, 19, 1305–1320. [Google Scholar] [CrossRef]
- Koster, R.D.; Brocca, L.; Crow, W.T.; Burgin, M.S.; De Lannoy, G.J. Precipitation estimation using L-band and C-band soil moisture retrievals. Water Resour. Res. 2016, 52, 7213–7225. [Google Scholar] [CrossRef] [PubMed] [Green Version]
- Ford, T.W.; Quiring, S.M.; Thakur, B.; Jogineedi, R.; Houston, A.; Yuan, S.; Kalra, A.; Lock, N. Evaluating Soil Moisture–Precipitation Interactions Using Remote Sensing: A Sensitivity Analysis. J. Hydrometeorol. 2018, 19, 1237–1253. [Google Scholar] [CrossRef]
- Martínez-Fernández, J.; González-Zamora, A.; Sánchez, N.; Gumuzzio, A.; Herrero-Jiménez, C. Satellite soil moisture for agricultural drought monitoring: Assessment of the SMOS derived Soil Water Deficit Index. Remote Sens. Environ. 2016, 177, 277–286. [Google Scholar] [CrossRef]
- Mishra, A.; Vu, T.; Veettil, A.V.; Entekhabi, D. Drought monitoring with soil moisture active passive (SMAP) measurements. J. Hydrol. 2017, 552, 620–632. [Google Scholar] [CrossRef]
- Koster, R.; Crow, W.; Reichle, R.; Mahanama, S.P. Estimating Basin-Scale Water Budgets with SMAP Level 2 Soil Moisture Data. Water Resour. Res. 2018, 54, 4228–4244. [Google Scholar] [CrossRef] [PubMed]
- Jackson, T.J.; Schmugge, T.J. Passive microwave remote sensing system for soil moisture: Some supporting research. IEEE Trans. Geosci. Remote Sens. 1989, 27, 225–235. [Google Scholar] [CrossRef]
- Zohaib, M.; Kim, H.; Choi, M. Evaluating the patterns of spatiotemporal trends of root zone soil moisture in major climate regions in East Asia. J. Geophys. Res. Atmos. 2017, 122, 7705–7722. [Google Scholar] [CrossRef]
- Akbar, R.; Chen, R.; Tabatabaeenejad, A.; Moghaddam, M. Synergistic use of AirMOSS P-band SAR with the SMAP L-band radar-radiometer for soil moisture retrieval. In Proceedings of the 2016 International Conference on Electromagnetics in Advanced Applications (ICEAA), Cairns, QLD, Australia, 19–23 September 2016; pp. 793–795. [Google Scholar]
- Chapin, E.; Chau, A.; Chen, J.; Heavey, B.; Hensley, S.; Lou, Y.; Machuzak, R.; Moghaddam, M. AirMOSS: An Airborne P-band SAR to measure root-zone soil moisture. In Proceedings of the IEEE Radar Conference, Atlanta, GA, USA, 7–11 May 2012; pp. 0693–0698. [Google Scholar]
- Wagner, W.; Lemoine, G.; Rott, H. A method for estimating soil moisture from ERS scatterometer and soil data. Remote Sens. Environ. 1999, 70, 191–207. [Google Scholar] [CrossRef]
- Faridani, F.; Farid, A.; Ansari, H.; Manfreda, S. Estimation of the root-zone soil moisture using passive microwave remote sensing and SMAR Model. J. Irrig. Drain. Eng. 2016, 143, 04016070. [Google Scholar] [CrossRef]
- Manfreda, S.; Brocca, L.; Moramarco, T.; Melone, F.; Sheffield, J. A physically based approach for the estimation of root-zone soil moisture from surface measurements. Hydrol. Earth Syst. Sci. 2014, 18, 1199–1212. [Google Scholar] [CrossRef] [Green Version]
- Faridani, F.; Farid, A.; Ansari, H.; Manfreda, S. A modified version of the SMAR model for estimating root-zone soil moisture from time-series of surface soil moisture. Water SA 2017, 43, 492–498. [Google Scholar] [CrossRef]
- Baldwin, D.; Manfreda, S.; Keller, K.; Smithwick, E. Predicting root zone soil moisture with soil properties and satellite near-surface moisture data across the conterminous United States. J. Hydrol. 2017, 546, 393–404. [Google Scholar] [CrossRef]
- Fereidoon, M.; Koch, M.; Brocca, L. Predicting rainfall and runoff through satellite soil moisture data and SWAT modelling for a poorly gauged basin in Iran. J. Hydrol. 2018, 11, 594. [Google Scholar] [CrossRef]
- Araghi, A.; Baygi, M.M.; Adamowski, J.; Malard, J.; Nalley, D.; Hasheminia, S.M. Using wavelet transforms to estimate surface temperature trends and dominant periodicities in Iran based on gridded reanalysis data. Atmos. Res. 2015, 155, 52–72. [Google Scholar] [CrossRef]
- Golian, S.; Mazdiyasni, O.; AghaKouchak, A. Trends in meteorological and agricultural droughts in Iran. Appl. Clim. 2015, 119, 679–688. [Google Scholar] [CrossRef]
- Tabari, H.; Abghari, H.; Hosseinzadeh Talaee, P. Temporal trends and spatial characteristics of drought and rainfall in arid and semiarid regions of Iran. Hydrol. Process 2012, 26, 3351–3361. [Google Scholar] [CrossRef]
- Tabari, H.; Nikbakht, J.; Talaee, P.H. Hydrological drought assessment in Northwestern Iran based on streamflow drought index (SDI). Water Resour. Manag. 2013, 27, 137–151. [Google Scholar] [CrossRef]
- Rahmani, A.; Golian, S.; Brocca, L. Multiyear monitoring of soil moisture over Iran through satellite and reanalysis soil moisture products. Int. J. Appl. Earth Obs. Geoinf. 2016, 48, 85–95. [Google Scholar] [CrossRef]
- Modarres, R.; Sarhadi, A. Rainfall trends analysis of Iran in the last half of the twentieth century. J. Geophys. Res. Atmos 2009, 114, D03101. [Google Scholar] [CrossRef]
- Safaei-Mahroo, B.; Ghaffari, H.; Fahimi, H.; Broomand, S.; Yazdanian, M.; Najafi-Majd, E.; Hosseinian Yousefkhani, S.S.; Rezazadeh, E.; Hosseinzadeh, M.S.; Nasrabadi, R. The herpetofauna of Iran: Checklist of taxonomy, distribution and conservation status. AHR 2015, 6, 257–290. [Google Scholar]
- INSAM—The International Society for Agricultural Meteorology. Available online: http://www.agrometeorology.org/ (accessed on 29 January 2019).
- WMO—World Meteorological Organization. Available online: https://www.wmo.int/cpdb/iran-islamic-republic-of (accessed on 10 March 2018).
- Njoku, E.G.; Jackson, T.J.; Lakshmi, V.; Chan, T.K.; Nghiem, S.V. Soil moisture retrieval from AMSR-E. IEEE Trans. Geosci. Remote Sens. 2003, 41, 215–229. [Google Scholar] [CrossRef]
- Kerr, Y.H.; Waldteufel, P.; Wigneron, J.-P.; Martinuzzi, J.; Font, J.; Berger, M. Soil moisture retrieval from space: The Soil Moisture and Ocean Salinity (SMOS) mission. IEEE Trans. Geosci. Remote Sens. 2001, 39, 1729–1735. [Google Scholar] [CrossRef]
- Entekhabi, D.; Njoku, E.G.; O’Neill, P.E.; Kellogg, K.H.; Crow, W.T.; Edelstein, W.N.; Entin, J.K.; Goodman, S.D.; Jackson, T.J.; Johnson, J. The soil moisture active passive (SMAP) mission. Proc. IEEE 2010, 98, 704–716. [Google Scholar] [CrossRef]
- Imaoka, K.; Kachi, M.; Kasahara, M.; Ito, N.; Nakagawa, K.; Oki, T. Instrument performance and calibration of AMSR-E and AMSR2. Int. Arch. Photogramm. Remote Sens. Spat. Inf. Sci. 2010, 38, 13–18. [Google Scholar]
- Kim, H.; Parinussa, R.; Konings, A.G.; Wagner, W.; Cosh, M.H.; Lakshmi, V.; Zohaib, M.; Choi, M. Global-scale assessment and combination of SMAP with ASCAT (active) and AMSR2 (passive) soil moisture products. Remote Sens. Environ. 2018, 204, 260–275. [Google Scholar] [CrossRef]
- Goddard Earth Sciences Data and Information Services Center (GES Disc). Available online: https://disc.gsfc.nasa.gov (accessed on 20 April 2018).
- Monerris, A.; Schmugge, T. Soil moisture estimation using L-band radiometry. In Advances in Geoscience and Remote Sensing; IntechOpen: London, UK, 2009. [Google Scholar] [Green Version]
- Mecklenburg, S.; Drusch, M.; Kaleschke, L.; Rodriguez-Fernandez, N.; Reul, N.; Kerr, Y.; Font, J.; Martin-Neira, M.; Oliva, R.; Daganzo-Eusebio, E. ESA’s Soil Moisture and Ocean Salinity mission: From science to operational applications. Remote Sens. Environ. 2016, 180, 3–18. [Google Scholar] [CrossRef]
- Centre Aval de Traitement des Données SMOS (CATDS). Available online: https://www.catds.fr/ (accessed on 30 April 2018).
- National Snow and Ice Data Center (NSIDC). Available online: http://nsidc.org/data/SPL3SMP (accessed on 10 May 2018).
- Entekhabi, D.; Reichle, R.H.; Koster, R.D.; Crow, W.T. Performance metrics for soil moisture retrievals and application requirements. J. Hydrometeorol. 2010, 11, 832–840. [Google Scholar] [CrossRef]
- Kim, S.; Liu, Y.Y.; Johnson, F.M.; Parinussa, R.M.; Sharma, A. A global comparison of alternate AMSR2 soil moisture products: Why do they differ? Remote Sens. Environ. 2015, 161, 43–62. [Google Scholar] [CrossRef]
- Ray, R.; Fares, A.; He, Y.; Temimi, M. Evaluation and inter-comparison of satellite soil moisture products using in situ observations over Texas, US. Water 2017, 9, 372. [Google Scholar] [CrossRef]
- Oliva, R.; Daganzo, E.; Kerr, Y.H.; Mecklenburg, S.; Nieto, S.; Richaume, P.; Gruhier, C. SMOS radio frequency interference scenario: Status and actions taken to improve the RFI environment in the 1400–1427-MHz passive band. IEEE Trans. Geosci. Remote Sens. 2012, 50, 1427–1439. [Google Scholar] [CrossRef]
- Khazâal, A.; Cabot, F.; Anterrieu, E.; Soldo, Y. A kurtosis-based approach to detect RFI in SMOS image reconstruction data processor. IEEE Trans. Geosci. Remote Sens. 2014, 52, 7038–7047. [Google Scholar] [CrossRef]
- Cui, H.; Jiang, L.; Du, J.; Zhao, S.; Wang, G.; Lu, Z.; Wang, J. Evaluation and analysis of AMSR-2, SMOS, and SMAP soil moisture products in the Genhe area of China. J. Geophys. Res. Atmos 2017, 122, 8650–8666. [Google Scholar] [CrossRef]
- Chen, Y.; Yang, K.; Qin, J.; Cui, Q.; Lu, H.; La, Z.; Han, M.; Tang, W. Evaluation of SMAP, SMOS, and AMSR2 soil moisture retrievals against observations from two networks on the Tibetan Plateau. J. Geophys. Res. Atmos. 2017, 122, 5780–5792. [Google Scholar] [CrossRef]
- Zhang, X.; Zhang, T.; Zhou, P.; Shao, Y.; Gao, S. Validation analysis of SMAP and AMSR2 soil moisture products over the United States using ground-based measurements. Remote Sens. 2017, 9, 104. [Google Scholar] [CrossRef]


| Station Name | Latitude | Longitude | Elevation (m) | Soil Texture | Measurement Depths (cm) | Mean Annual Precipitation (mm/year) |
|---|---|---|---|---|---|---|
| Farokhshahr | 32.30 | 50.93 | 1636 | Loam | 5, 10, 30, 50 | 300 |
| Kahriz | 37.88 | 45.00 | 1336 | Sandy clay | 5, 10, 30, 50 | 313 |
| Khosroshah | 37.97 | 46.04 | 1338 | Sandy loam | 5, 10, 20, 30, 50 | 288 |
| Oltan | 39.60 | 47.76 | 73 | Sandy clay | 5, 10, 20, 30, 50 | 263 |
| Toroq | 36.27 | 59.63 | 990 | Loamy sand | 5, 10, 20, 30, 50 | 233 |
| AMSR2 | SMOS | SMAP | ||||||||||
|---|---|---|---|---|---|---|---|---|---|---|---|---|
| Stations | R | RMSE | BIAS | N | R | RMSE | BIAS | N | R | RMSE | BIAS | N |
| Farokhshahr | 0.57 | 0.143 | 0.128 | 306 | 0.30 | 0.093 | 0.030 | 134 | 0.40 | 0.039 | −0.010 | 191 |
| Kahriz | - | - | - | - | 0.32 | 0.115 | −0.032 | 159 | 0.39 | 0.135 | 0.123 | 195 |
| Khosroshah | 0.26 | 0.100 | 0.046 | 524 | 0.47 | 0.156 | 0.088 | 362 | 0.67 | 0.069 | 0.046 | 339 |
| Oltan | 0.70 | 0.210 | 0.178 | 533 | 0.29 | 0.148 | 0.083 | 384 | 0.74 | 0.075 | 0.058 | 243 |
| Toroq | 0.45 | 0.089 | 0.023 | 303 | 0.34 | 0.084 | −0.035 | 127 | 0.56 | 0.070 | −0.051 | 130 |
| Average | 0.49 | 0.135 | 0.094 | 417 | 0.34 | 0.119 | 0.027 | 233 | 0.55 | 0.078 | 0.033 | 220 |
| Station | Schemes | n1 | n2 | sc1 | sw2 | V2 (m/day) | R | RMSE (m3 m−3) | Bias (m3 m−3) |
|---|---|---|---|---|---|---|---|---|---|
| Farokhshahr | i | 0.497 | 0.530 | 0.247 | 0.170 | 0.0096 | 0.9254 | 0.0119 | 0.0045 |
| ii | 0.467 | 0.467 | 0.476 | 0.183 | 0.0057 | 0.9782 | 0.0045 | −0.0002 | |
| iii | 0.497 | 0.530 | 0.247 | 0.170 | 0.0096 | 0.544 | 0.0313 | 0.0247 | |
| Kahriz | i | 0.462 | 0.529 | 0.388 | 0.248 | 0.0198 | 0.9150 | 0.0303 | 0.0004 |
| ii | 0.466 | 0.530 | 0.467 | 0.219 | 0.0250 | 0.2813 | 0.1430 | 0.0871 | |
| iii | 0.462 | 0.529 | 0.388 | 0.248 | 0.0198 | 0.2920 | 0.3209 | 0.2879 | |
| Khosroshah | i | 0.500 | 0.520 | 0.430 | 0.122 | 0.0113 | 0.8524 | 0.0184 | 0.0025 |
| ii | 0.484 | 0.530 | 0.477 | 0.112 | 0.0056 | 0.5975 | 0.0257 | 0.0118 | |
| iii | 0.500 | 0.520 | 0.430 | 0.122 | 0.0113 | 0.5057 | 0.0314 | 0.0151 | |
| Oltan | i | 0.452 | 0.430 | 0.241 | 0.215 | 0.0249 | 0.8066 | 0.0459 | 0.0068 |
| ii | 0.433 | 0.470 | 0.436 | 0.211 | 0.0250 | 0.6526 | 0.1000 | 0.0487 | |
| iii | 0.452 | 0.430 | 0.241 | 0.215 | 0.0249 | 0.7677 | 0.2450 | 0.1820 | |
| Toroq | i | 0.490 | 0.530 | 0.289 | 0.237 | 0.019 | 0.9463 | 0.0146 | 0.0003 |
| ii | 0.444 | 0.508 | 0.421 | 0.241 | 0.0051 | 0.9225 | 0.0174 | 0.0006 | |
| iii | 0.490 | 0.530 | 0.289 | 0.237 | 0.019 | 0.7521 | 0.0291 | 0.0018 |
© 2019 by the authors. Licensee MDPI, Basel, Switzerland. This article is an open access article distributed under the terms and conditions of the Creative Commons Attribution (CC BY) license (http://creativecommons.org/licenses/by/4.0/).
Share and Cite
Gheybi, F.; Paridad, P.; Faridani, F.; Farid, A.; Pizarro, A.; Fiorentino, M.; Manfreda, S. Soil Moisture Monitoring in Iran by Implementing Satellite Data into the Root-Zone SMAR Model. Hydrology 2019, 6, 44. https://doi.org/10.3390/hydrology6020044
Gheybi F, Paridad P, Faridani F, Farid A, Pizarro A, Fiorentino M, Manfreda S. Soil Moisture Monitoring in Iran by Implementing Satellite Data into the Root-Zone SMAR Model. Hydrology. 2019; 6(2):44. https://doi.org/10.3390/hydrology6020044
Chicago/Turabian StyleGheybi, Fatemeh, Parivash Paridad, Farid Faridani, Ali Farid, Alonso Pizarro, Mauro Fiorentino, and Salvatore Manfreda. 2019. "Soil Moisture Monitoring in Iran by Implementing Satellite Data into the Root-Zone SMAR Model" Hydrology 6, no. 2: 44. https://doi.org/10.3390/hydrology6020044