
Calcium and Potassium Nutrition Increases the Water Use Efficiency in Coffee: A Promising Strategy to Adapt to Climate Change


Center for Plant Nutrition and Environmental Research Hanninghof, Yara International, 48249 Dülmen, Germany
*
Author to whom correspondence should be addressed.
Hydrology 2021, 8(2), 75; https://doi.org/10.3390/hydrology8020075
Submission received: 30 March 2021
/
Revised: 29 April 2021
/
Accepted: 30 April 2021
/
Published: 1 May 2021
(This article belongs to the Special Issue Hydrology in the Caribbean Basin)
Abstract
:Coffee (Coffea spp.) represents one of the most important sources of income and goods for the agricultural sector in Central America, Colombia, and the Caribbean region. The sustainability of coffee production at the global and regional scale is under threat by climate change, with a major risk of losing near to 50% of today’s suitable area for coffee by 2050. Rain-fed coffee production dominates in the region, and under increasing climate variability and climate change impacts, these production areas are under threat due to air temperature increase and changes in rainfall patterns and volumes. Identification, evaluation, and implementation of adaptation strategies for growers to cope with climate variability and change impacts are relevant and high priority. Incremental adaptation strategies, including proper soil and water management, contribute to improved water use efficiency (WUE) and should be the first line of action to adapt the coffee crop to the changing growing conditions. This research’s objective was to evaluate at field level over five years the influence of fertilization with calcium (Ca+2) and potassium (K+) on WUE in two coffee arabica varieties: cv. Castillo and cv. Caturra. Castillo has resistance against coffee leaf rust (CLR) (Hemileia vastatrix Verkeley and Brome), while Caturra is not CLR-resistant. WUE was influenced by yield changes during the years by climate variability due to El Niño–ENSO conditions and CLR incidence. Application of Ca+2 and K+ improved the WUE under such variable conditions. The highest WUE values were obtained with an application of 100 kg CaO ha−1 year−1 and between 180 to 230 kg K2O ha−1 year−1. The results indicate that adequate nutrition with Ca+2 and K+ can improve WUE in the long-term, even underwater deficit conditions and after the substantial incidence. Hence, an optimum application of Ca+2 and K+ in rain-fed coffee plantations can be regarded as an effective strategy to adapt to climate variability and climate change.
1. Introduction
Climate change is one of the most significant challenges for humanity. The global mean surface temperature (GMST) is increasing at the rate of 0.2 °C +/−0.1 °C per decade, reaching 1.0 °C above the pre-industrial period (reference period 1850–1900) in 2007 and is projected to reach 1.5 °C above the pre-industrial period between 2030 and 2052, depending on the model and assumptions regarding projected changes to atmospheric greenhouse gases (GHG) levels and climate sensitivity [1]. The most impacted regions worldwide, experiencing increasing GMST, will be those located in the low and mid-latitudes or tropical and extratropical regions [2,3], with projected increases in drought risk, dryness, precipitation deficits, air temperatures increases and heatwaves risk [1].
Climate change is considered one of the biggest challenges for the coffee food chain. The air temperature increases and exacerbates climate variability, affecting the rainfall, solar radiation and air temperature patterns in almost all the coffee regions of the world, including the Americas. Several studies remark that will be exists a reduction in the 50% of the area suitable for coffee production until the 2050s [4,5,6,7,8]. Those changes in the rainfall and air temperature patterns pose significant challenges to smallholder coffee farmers, where the coffee growth mainly in rain-fed conditions, with limited access to financial and technical support that could help them to respond to changing climate conditions [9,10].
Coffee production (Coffea spp.) in Central America, Colombia, and the Caribbean covers 29.65% of the total planted area, with nearly 2,626,949 ha and with gross revenue of USD 2.8 billion [11], providing economic sustainability near 6.6 million, mostly smallholders. Coffee exportations generate wealth and income to the produces countries, apart from its primary social functions. According to Tol [3], developing countries are more vulnerable to climate change for three main reasons: first, a higher share of their economy’s activity in agriculture like coffee, second, they tend to be hotter, and third, they tend to have poor adaptative capacity. When we searched for adaptative strategies for the coffee sector, we found several initiatives, for example, migration of coffee areas that are located below 1000 m above sea level (masl), as both species of coffee lose a large share of total sustainability in low altitudes [5]. The migration of coffee areas is not a sustainable adaptation strategy for some farmers and regions. This means that the farmers need to explore and implement other strategies. Some adaptation options may require incremental modifications in current farming practices like tree windbreaks, new crop varieties, on-farm soil and water management; others may need radical changes in production systems structure known as system adaptation and transformation adaptation [12].
Rain-fed crops like coffee are subject to several intermittent stress factors like water stress, heat stress, and nutrient deficit stress, decreasing the yield potential. The K+ depletion, for example, is one of the primary reasons for the degradation of arable land in southeast Asia, Latin America, and the Caribbean [13]. Potassium (K+) and calcium (Ca+2) are considered the first and third most demanded nutrients, respectably, by coffee and cherries [14,15]. K+ is a necessary nutrient in coffee to buildup resistance against especially fungal diseases, aside from preventing water stress by regulating turgor pressure, by influencing stomatal opening and closing, directly affect the cherry and bean formation and quality by stimulating enzyme activities, as well carbohydrates synthesis and translocation [16]. In addition, K+ is a critical intracellular agent known to influence osmotic pressures; if the supply of K+ is adequate, cells maintain their turgor within an optimal range, and metabolic processes can occur uninhibited [17].
Waraich et al. [18] described the possible mechanisms to enhance WUE by improving K+ nutrition in crop plants by three main processes (i) maintain the high pH in stoma that reduces photo-oxidative damage and maintain chloroplast membrane; (ii) enhance root growth and decrease the loss of soil moisture that allows the root to explore the soil moisture and maintains turgidity, and (iii) decrease transpiration that increases retention of water in plants and maintains the osmotic potential. According to Grzebisz et al. [19], the uptake of nutrients from the soil solution is governed by two main processes: (i) the transport of ions from the soil solution to the root surfaces and (ii) root growth into the soil patches that are rich in nutrients. The rate of K-ion diffusion towards the root depends on the K-concentration gradient between the root surfaces and the soil solution. As a consequence of the low mobility of the K-ions in soil solution, K+ concentration near roots decreases very quickly. Hence, the application of K fertilizer is important to guarantee an optimum K+ concentration in the soil solution, which in turn ensures a sufficient K uptake by the roots.
The physiological and structural role of Ca+2 in alleviating stress conditions has been widely documented [20]. Ca+2 plays a vital role in regulating many physiological processes that influence crop growth and response to environmental stress [17]. Ca+2 has been recognized as a universal signaling nutrient that allows a proper response of the plants to stress conditions. A recent publication described how Ca+2 enhances the development, growth, and photosynthesis under abiotic stress conditions, such as heat and drought in coffee plants [21]. Ca+2 acts as a sensor of environmental signals, including the soil–water gradient affecting the processes responsible for plant water management. K+ deficiency in the root growth medium also triggers the Ca+2 sensors, which in turn activate the high-affinity K+ transporters in cells within the root cortex [19].
The water use efficiency (WUE) is a valuable index to compare the water productivity in different regions for the same crop, of different crops in the same region, and for other possible uses; integrate crop yield and water used to achieve that yield; provides a valuable index for optimizing water uses among different agricultural sectors in water-scarce regions [19,22], or climate change and variability scenarios. A proper understanding and knowledge of the crop management effects on WUE may provide researchers and farmers with opportunities to identify and select appropriate practices for improving in-field WUE [18]. According to Ritchie and Basso [23], increased crop yield in a particular environment is accompanied by a simultaneous increase in the WUE. This research aimed to evaluate the influence of the K+ and Ca+2 fertilization in coffee on the WUE in rain-fed conditions and its contribution as an incremental adaptation strategy to climate change and variability.
2. Materials and Methods
2.1. Trial Location
During five years from July 2014 to June 2019, two trials were carried out under field conditions in the southeast region of Colombia, in El Pital-Huila in a farm located at 02°20.1’62” N–75°50.1’41” W and 1700 m elevation, the meteorological data during the experiments were recorded (Table 1) and data available in https://www.cenicafe.org/es/index.php/nuestras_publicaciones/anuarios_meteorologicos accessed on 3 March 2021. The soil was a biotite–granite classified as a Typic Tropothents and Typic Dystrudepts [24], containing 70% sand, 24% silt and 6% clay, with a volumetric soil moisture at saturation level (θs) = 0.69 cm3.cm−3; volumetric soil moisture at field capacity (θFC) = 0.476 cm3.cm−3, and a soil humidity at wilting point of (θwp) = 0.294 cm3.cm−3 at 40 cm depth.
Two trials were installed in this location in two coffee varieties. Trial 1 was established in the Coffea arabica L. variety Castillo® with resistance to the coffee leaf rust (CLR) disease generated by the fungi Hemileia vastatrix Verkeley and Brome [25]. The plantation was established in 2012 without shade, and the coffee was planted with a plant density of 5100 plants ha−1 at 1.4 m distance between plants and 1.4 m distance between rows. Trial 2 was established in Coffea arabica L. variety Caturra susceptible to CLR, without shade. The Caturra trial plantation was stem trimmed at 30 cm height in August of 2014 to initiate a new productive cycle, and this plantation was planted with a plant density of 6600 plants ha−1 at 1.5 m distance between plants and 1.0 m distance between rows. Soil samples for soil fertility analysis before starting the treatment application were collected at 0–30 cm depth, the pH was determined in CaCl2, organic matter by Walkley–Black, P by Bray-II, and the exchangeable fraction of K, Mg, and Ca with 1 N ammonium acetate extraction (1 N NH4C2H3O2, pH 7.0). The cations in the extracts were detected using an ICP (PerkinElmer, Optima 8300), soil texture analyses using the hygrometer–Bouyoucos method (Table 2).
To evaluate the effect of the Ca+2 and K+ rates on yield, four Ca+2 and three K+ rates were evaluated in each of the trials: 150, 100, 50, 0 kg CaO ha−1 year−1 and 230, 180, 100 kg. K2O.ha−1 year−1, respectively. The fertilizer sources used in the trial were ammonium nitrate-based NPK fertilizers of different grades and calcium nitrate (15 N-26% CaO) to supply the required K+ and Ca+2 rates. The other nutrients’ average rates were 260, 110, 77, and 66 kg ha−1 year−1 of N, P2O5, MgO, and S, respectively.
Both experiments were set up in a randomized complete block design with four replications. For the Castillo variety, each plot in the blocks had 54.88 m2 with 28 plants and 10 effective yield evaluation plants. For the Caturra variety, each plot in the blocks had 42 m2 with 28 plants and 10 effective plants for yield evaluation. In the Castillo variety, the harvest data were collected monthly from January 2015 to July 2018 and for the Caturra variety from January 2016 to June 2019.
2.2. Water Use Efficiency Calculation
In agronomy, according to Viets [26], the water use efficiency (WUE) is generally defined as an index that is calculated as the yield of the main crop product (Ya) per unit of water uses (ETact):
Yield (Ya, in kg ha−1) is defined as the quantity of the actual harvestable crop part (in this study, coffee cherries) per given area during a fixed period. The actual seasonal crop water consumption-ETact, in mm or m3 ha−1 [19,22,27].
In this study, the coffee cherry yield was taken during a monthly harvest from January to December from 2015 to 2018, with a higher proportion of the harvest from April to June. From a coffee physiology perspective, eight months pass from flowering to harvest [28], for this reason, the ETact was calculated from May to December of the harvest year because the flowers that open in May correspond to harvestable coffee in January, the flowers from June result in the coffee harvest in February, and so on.
The ETact was estimated following the FAO-56 approach [29] adjusted for coffee by Ramirez et al. [30] as follows:
where: ETo is the reference evapotranspiration, Kc is the crop coefficient, and is the adjustment to the crop evapotranspiration as a function of the soil moisture and is calculated as follows:
where: θi−1 is the volumetric moisture content of the day before, and θs is the volumetric soil moisture at saturation level. According to the FAO-56 approach, if <= 0.35, the coffee crop is the underwater deficit, which reduces the actual crop evapotranspiration; if > 0.35, there is no limitation to the crop evapotranspiration.
The volumetric soil moisture in Equation (3) was calculated daily using the water balance model as follows:
where θi is the volumetric soil moisture for day I, Ri is a runoff for day i, and Pei is the effective rainfall for day i.
The equation of the water balance was estimated as follows:
where θ0 is the volumetric soil moisture for day zero, θfc is the volumetric soil moisture at field capacity, Ro is runoff, and Peo is the effective rainfall on day zero, respectively.
The runoff (R) and effective rainfall (Pe) were estimated based on the daily rainfall (P) on the models developed for coffee by Jaramillo y Cháves [31] and Ramirez and Jaramillo [32] as follows:
For runoff:
If the rainfall (P) > 6.0 mm
If the rainfall (P) <= 6.0 mm; R = 0
For effective rainfall (Pe)
If the rainfall (P) > 6.0 mm
If the rainfall (P) <= 6.0 mm; Pe = 0
2.3. Statistical Analysis
According to the experimental design, all data were submitted to their respective analysis of variance (ANOVA) test. Statistical analysis was conducted using the Statgraphics Centurion software package (Statgraphics Technologies, Inc.). The Shapiro–Wilk modified test was applied for normality and carried out using the heterogeneity of variances using the residuals vs. prediction test for each variable. The Fisher’s LSD test was used to detect the treatments that significantly affected the ANOVA.
3. Results
3.1. Soil Moisture and Water Balance Distribution
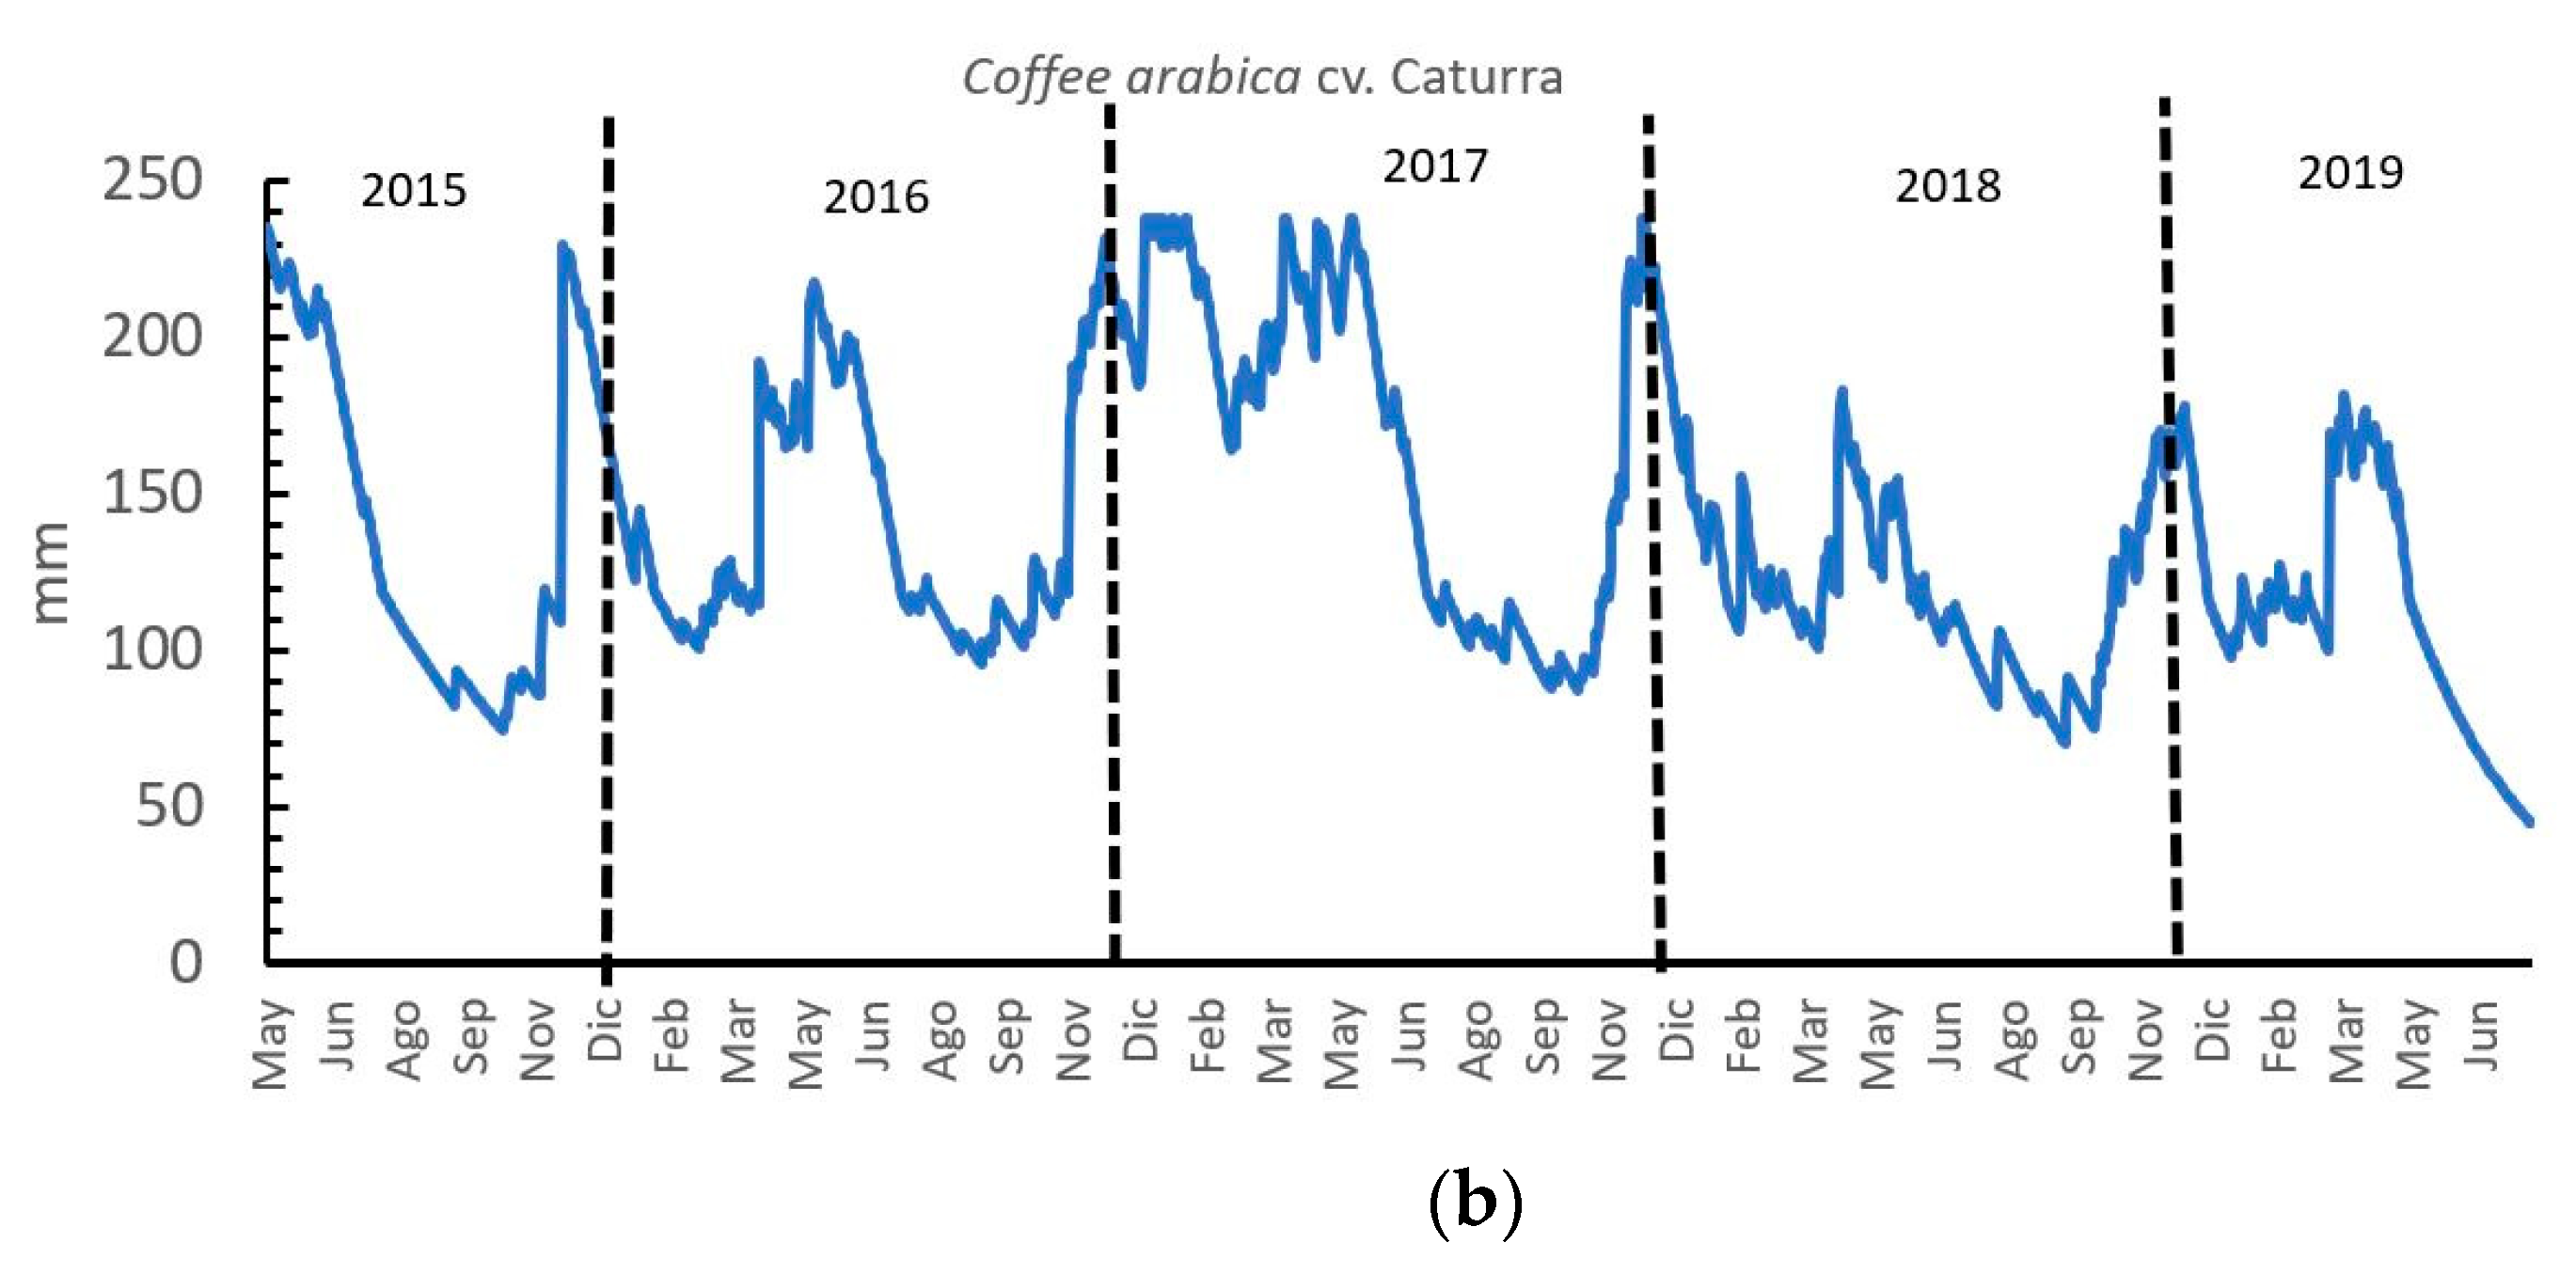
The soil moisture shows a monthly and yearly variation, mainly correlated with the region’s rainfall patterns (Figure 1 and Table 4-data available in the sumplementary material sesion). In the study area, the rainfall’ monthly variation can be explained by the intertropical convergence zone-ITCZ movement in the region. The ITCZ brings the rainy season from September to May and the drying season from June to August.
3.2. Influence of the Potassium and Calcium Nutrition on Water Use Efficiency
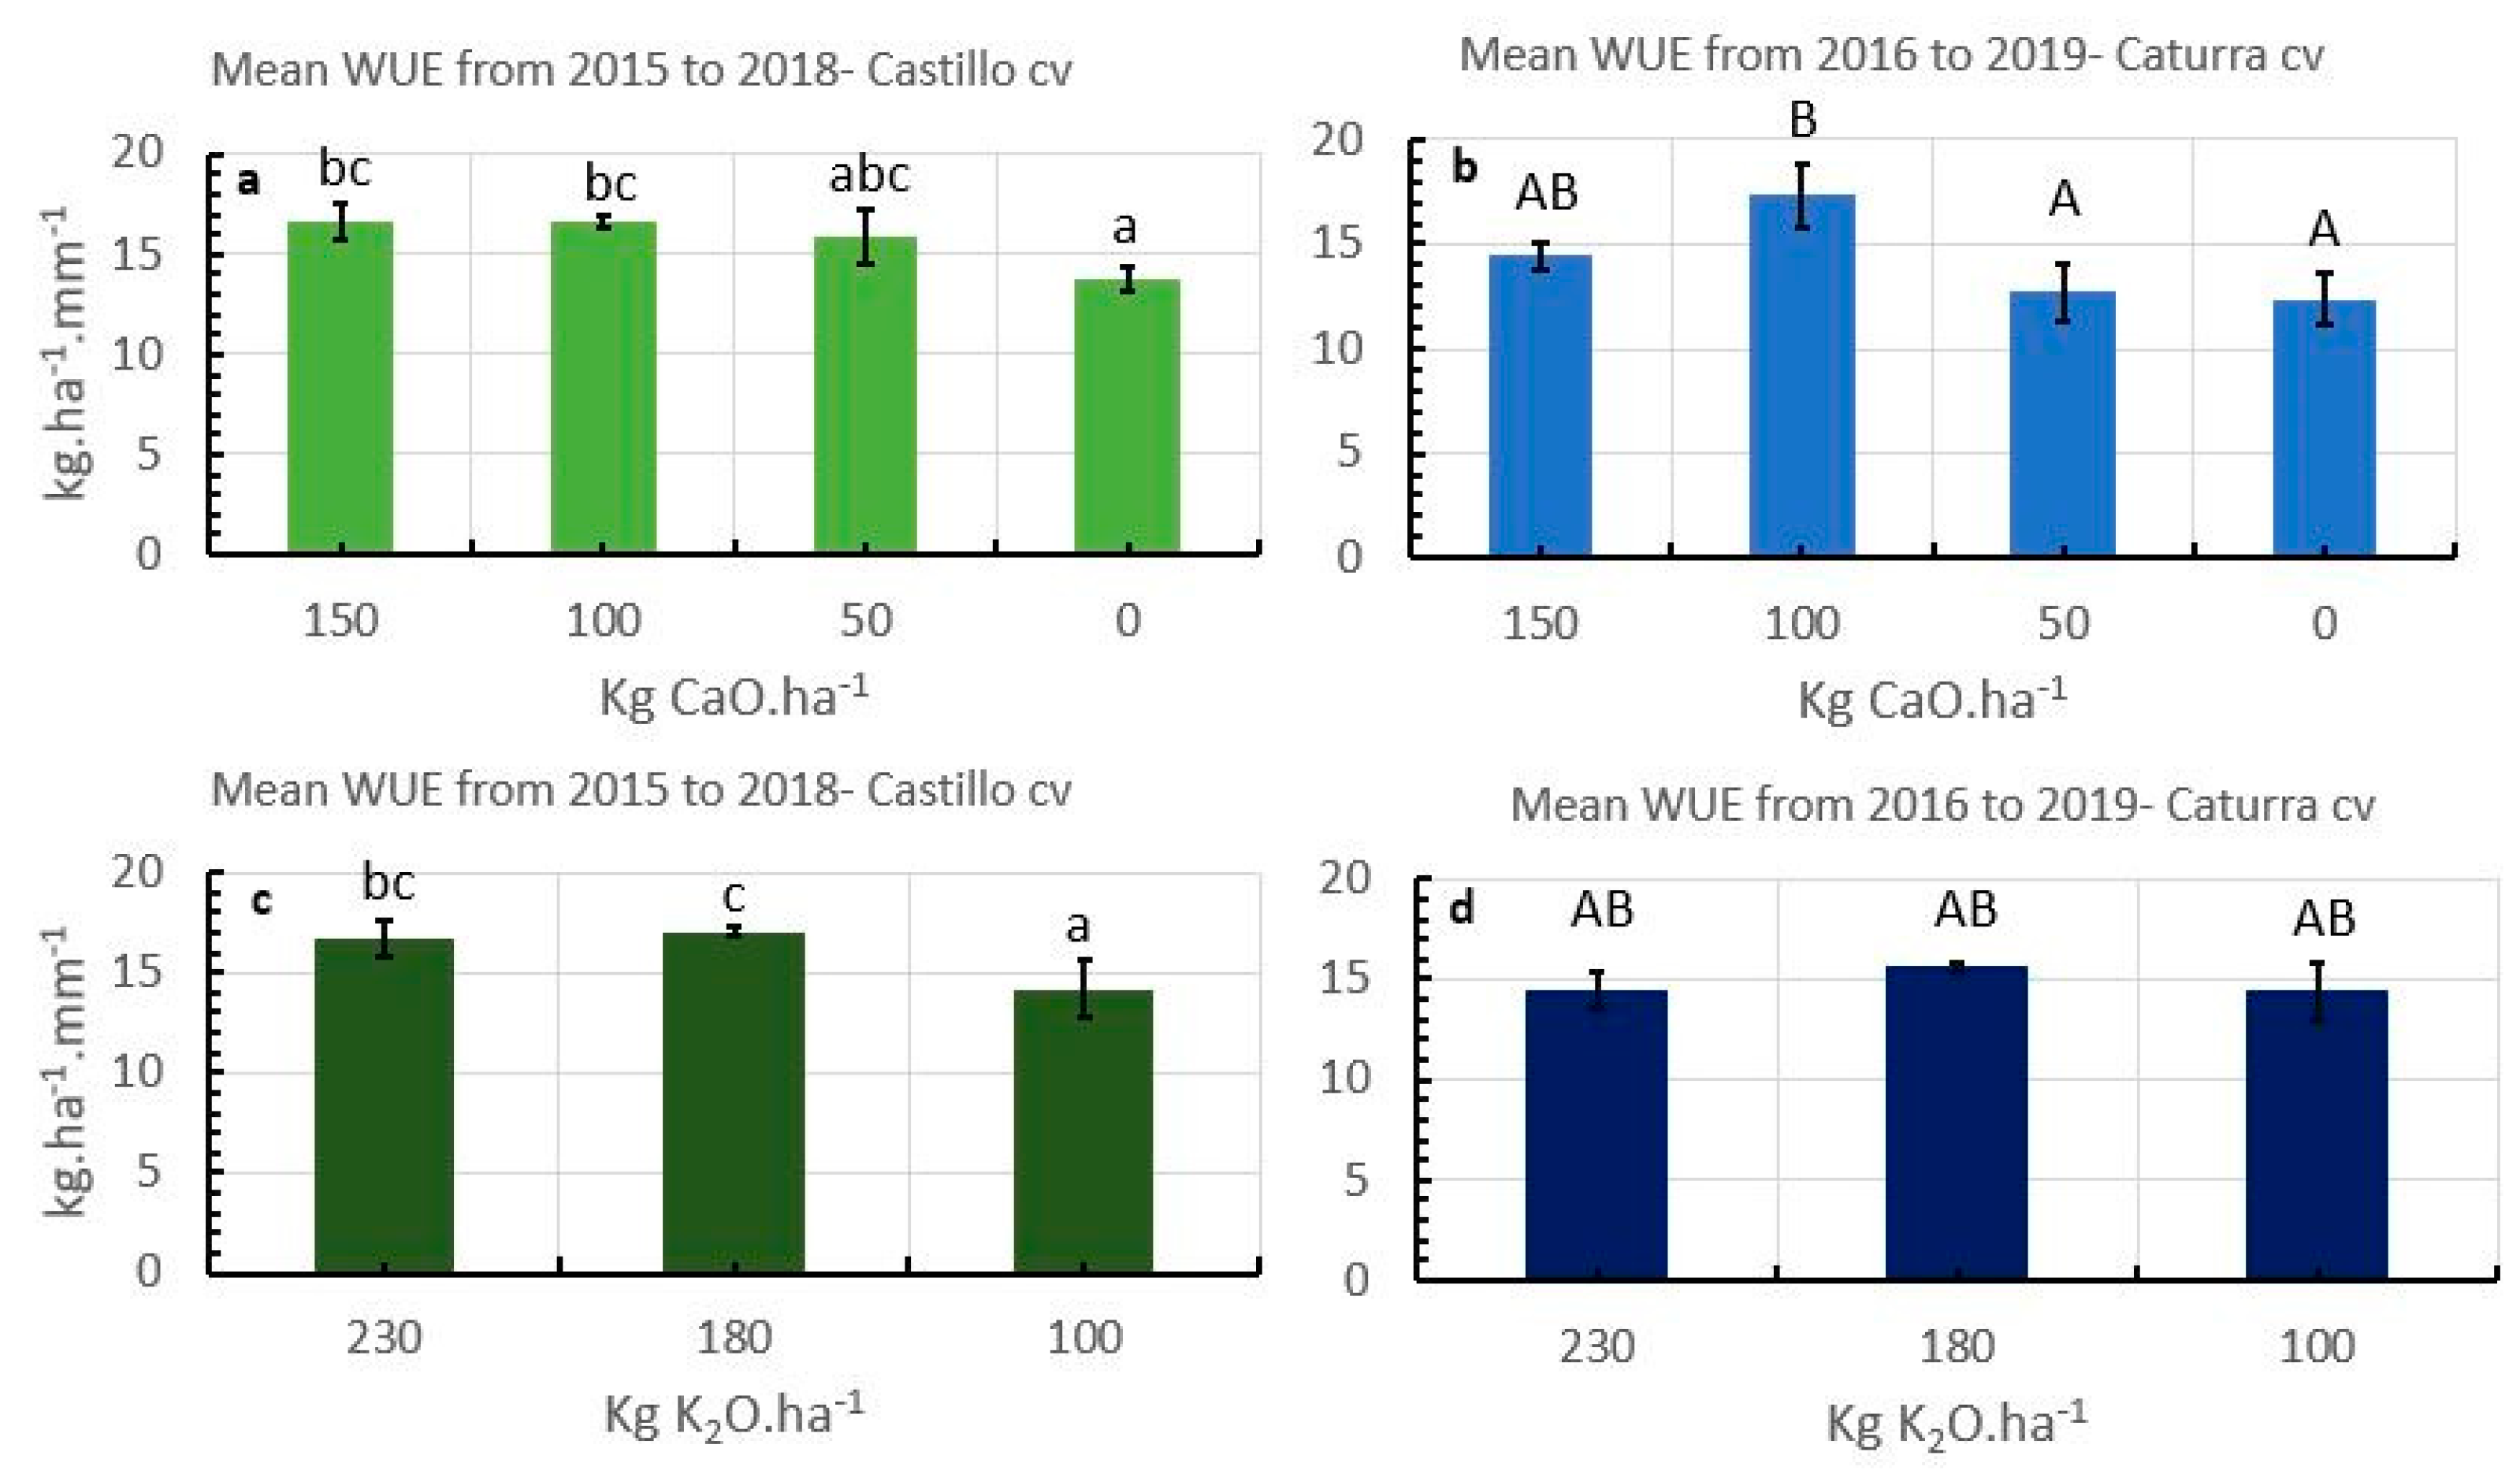
The coffee crop productivity is influenced by multiple variables like plant density, age of the plantation, nutrition, and climatic conditions, including water availability in the soil. In this paper, we focused on the effect of Ca+2 and K+ nutrition on WUE in two coffee varieties. The Ca+2 nutrition increases the WUE significantly for both varieties, reaching the highest WUE at 100 kg CaO ha−1 year−1 (Figure 2a,b, details please refer to supplementary). In both trials, the positive influence of Ca+2 fertilization on the increase of the WUE in coffee is apparent. Several authors report that the coffee plantation responds to the Ca+2 fertilization. Some authors even found a response at high Ca+2 levels in the soil of 1000 to 2300 mg kg−1 [35,36]. In the two trials analyzed in this paper, the Ca+2 levels in the soils were low, which explains the significant increase in WUE due to applying soluble Ca+2 fertilizers (Table 2).
In the case of the K+, statistical differences in the WUE were observed in the Castillo trial but not in the Caturra trial (Figure 2c,d, details please refer to supplementary). Higher WUE was achieved with K+ rates between 230 to 180 kg of K2O ha−1 year−1. The K+ rates in the Caturra trial had no statistically significant effect on the WUE because the K+ level in the soil was higher than 160 mg kg−1 (Table 2). At this K+ soil content, the probability of response to the K+ fertilization is lower than 5%. The recommended rate is 113 kg of K2O ha−1 year−1 [35].
The results indicate that the WUE in coffee is not constant and is affected by climate variability, yield curve, and disease incidence (Table 5). In 2016 the climate variability due to the positive phase of the El Niño–ENSO conditions increased the water deficit during the growing season up to 408 mm (Table 4); under these conditions, the WUE in coffee increases, compared to years with lower water deficit, such as 2015 and 2016. In the case of the Caturra variety, the WUE in 2016 was low (Table 5) because the first harvest took place in that year and usually in the first harvest year, coffee yields are low due to lower leaf area index and lower evapotranspiration rates, resulting in a rather low water deficit in the crop. The climate variability generated by the El Niño–ENSO conditions during 2015–2016 shows a positive influence on the Caturra variety yield in 2017, which in turn increased the WUE. This positive effect is mainly associated with an increased mean air temperature of 0.5 °C (Table 1), with a positive influence on vegetative growth that produced an excellent harvest during the third year after stem trimming, with a consequent increase in WUE (Table 5). After a very good harvest in 2017, yield and WUE in Caturra in 2018 and 2019 decreased, mainly associated with a substantial coffee leaf rust (CLR) incidence. CLR is a critical coffee disease generated by fungi (Hemileia vastatrix Verkeley and Brome). The disease incidence and severity developed in parallel to the coffee harvests [37]. Reductions in WUE were not observed in the Castillo variety because this variety is resistant to CLR.
For both varieties, a long-term effect of K+ and Ca+2 fertilization was observed with a significant impact of both nutrient applications at the end of the trial period (2018 for Castillo and 2019 for Caturra), which together show a considerable effect when analyzing the average value of WUE during the production cycle (Figure 2), applying 100 kg of CaO ha−1 year−1 of increasing the WUE from 13.7 to 16.7 kg ha−1 mm−1 in Castillo cv. and from 12.4 to 17.3 kg ha−1 mm−1 in Caturra cv. 21% and 40% more WUE, respectively, and in the case of K, increase the rates from 100 to 180 kg K2O ha−1 year−1 of increasing the WUE from 14.1 to 17.0 kg ha−1 mm−1 in Castillo cv. and from 14.4 to 15.6 kg ha−1 mm−1 in Caturra cv. 20% and 8% more WUE, respectively.
4. Discussion
The movement of the intertropical convergence zone (ITCZ) in the study region influences the seasonality of the rains with direct impacts on the coffee production cycle, especially on the pre-flowering stage in the dry season, flowering stage at the beginning of the rainy season, and cherry development during the rainy season [38,39]. However, in some years, the rainfall patterns change mainly associated with ENSO conditions. For the region where the research was carried out, it means that the positive phase of the ENSO known as “El Niño” reduces rainfall, increases solar radiation and air temperature. During the negative phase of the ENSO, known as “La Niña”, the rainfall increases, and solar radiation and air temperature decrease [40,41,42].
These two climatic variability sources (ITCZ and ENSO) explain the variation in the soil moisture distribution during the five years of the study (Figure 1). For example, the soil moisture reduction between May 2015 to April 2016 was directly associated with the positive ENSO described by Ocean Niño Index (ONI) [43]. The ONI index describes the variations of the superficial Pacific sea temperature in region 3.4 [44]. The ONI index during this period showed positive values (>1.0 °C), indicating warmer conditions that resulted in a reduction in rainfall by 28.5% in the period May 2015 to April 2016 compared to the same period in 2016 to 2017. The reduction in rainfall increased the water deficit in the coffee plantations at 50 cm of root depth to 408 mm for the Castillo trial and 361 mm for the Caturra trial, compared with the same period 2016 to 2017, where the water deficit was 299 mm and 296 mm for the Castillo and Caturra trial, respectively. The increasing water deficits, in turn, resulted in a subsequent reduction of the crop evapotranspiration ETact in 2015 and 2016 (Table 4).
As a perennial crop with a lifespan of 20 to 30 years, coffee is subjected to the impact of climate change and climate variability [9]. In this work, a 49% variation in rainfall was observed between 2015, 2016, and 2017. This variation was caused by El Niño–ENSO conditions altering the amount and distribution of rainfall. A water deficit in coffee is required around flowering, mainly to break the dormancy of flower buds [38,45,46]. The coffee plantations can compensate between 15 and 30 days of water deficit, depending on soil type and crop water demand [47]. However, the coffee yield is strongly determined by climatic conditions, i.e., a water deficit during cherry and bean development or vegetative growth drastically reduces the productivity and quality of coffee [47,48,49]. These dependencies make the smallholder coffee farmers highly vulnerable, especially as an adaptation to climate variabilities in perennial crops like coffee may take several years [10]. This research shows that improved management practices, such as optimized nutrition solutions, including targeted K+ and Ca+2 nutrient applications, enhance the adaptation of coffee to climate impacts. Such incremental adaptation strategies [12] ensure sufficiently high productivity and farmer profitability under climate stress conditions. Adequate crop nutrition also helps to improve WUE (Figure 2). This has been shown explicitly in the trial with cv. Castillo in 2016, a year with increased water deficit due to El Niño–ENSO conditions. In this year, the treatments with 100 kg of CaO ha−1 year−1 and 100 to 180 kg K2O. ha−1 year−1 resulted in a 12% and 28% increase in WUE, respectively, compared to the treatment without Ca+2 or K+ fertilization.
Ritchie and Basso [23] demonstrate that under most conditions, increases in yield due to improved fertilizer practices also result in increases in WUE. Studies on the influence of the K+ and Ca+2 fertilization on WUE in coffee at field conditions are rare, but Salamanca et al. [50] studied the impact of nitrogen supply on the water deficit of nursery coffee plants under greenhouse conditions and reported a significant reduction in the WUE in the treatment without N application. Grzebisz et al. [19] report in spring triticale and Maize increases in the WUE due to the K+ fertilizer application and highlight the importance of K+ fertilizer applications under rain-fed conditions, a measure to alleviate water-deficit stress at least partially.
From a socioeconomic perspective, understanding the extent of climate-driven impacts on coffee production and the benefits of potential adaptation strategies will be vital to maintain and improve coffee productivity and profitability and sustain the livelihoods of smallholder producers all over the world [9]. This research shows that coffee farmers are subject to reduced water availability and an increase of disease severity under the current climate variability scenarios, such as coffee leaf rust (CLR). CLR promotes substantial yield reductions in the years following the infection, especially in susceptible varieties like Caturra cv. However, this paper shows that implementing incremental adaptation strategies, such as optimized K+ and Ca+2 fertilizers applications, helps alleviate the disease incidence on the coffee crop in the longer term.
5. Conclusions
This study is a pioneer study conducted to understand the influence of specific nutrient management practices on yield and WUE in rain-fed coffee at the field level during a whole production cycle. It is shown that optimized nutrition practices in coffee help improve yield and farmer profitability under climate stress conditions and ensure efficient use of the increasingly scarce water resource. These results indicate that proper nutrient management, in this case, an adequate K+ and Ca+2 application, effectively contributes to sustaining the productivity and improve the WUE under climate variability conditions, disease incidences, like coffee leaf rust (CLR) and tree aging, and mainly contributing positively as an incremental strategy to climate variability and change adaptation.
Supplementary Materials
The following are available online at https://www.mdpi.com/article/10.3390/hydrology8020075/s1, Figure S1: Soil moisture variation over five years for two coffee trials. C. arabica cv. Castillo a, and C. arabica cv. Caturra b, Figure S2: Influence of the calcium and potassium fertilization on water use efficiency in two coffee varieties, Castillo cv (a,c) and Caturra cv (b,d). Different letters indicate statistically significant differences in the LSD test p < 0.05.
Author Contributions
V.H.R.-B. contributed to the field trial implementation, data acquisition, data analysis and manuscript preparation. J.K. contributes to the field trial setup, data analysis, and manuscript preparation. Both authors have read and agreed to the published version of the manuscript.
Funding
The authors declare that this research received funding from Yara International. The funder was not involved in the study design, collection, analysis, interpretation of the data, the writing of this article or the decision to submit it for publication.
Conflicts of Interest
The authors declare that the research was conducted in the absence of any commercial or financial relationship that could be constructed as a potential conflict of interest.
References
- Hoegh-Guldberg, O.; Jacob, O.; Taylor, M.; Guillén Bolaños, T.; Bindi, M.; Brown, S.; Camilloni, I.A.; Diedhiou, S.; Djalante, R.; Ebi, E.; et al. The Human Imperative of Stabilizing Global Climate Change at 1.5 °C. Science 2019, 365, 1263. [Google Scholar] [CrossRef] [Green Version]
- Ruane, C.A.; Phillips, M.M.; Rosenzweig, C. Climate Shifts within Mayor Agricultural Seasons for +1.5 and 2.0 °C Worlds: HAPPI Projections and AgMIP Modeling Scenarios. Agric. For. Meteorol. 2018, 259, 329–344. [Google Scholar] [CrossRef] [PubMed]
- Tol, R.S.J. The Distributional Impact of the Climate Change. Ann. N. Y. Acad. Sci. 2020, 1, 13. [Google Scholar] [CrossRef] [PubMed]
- Bunn, C.; Läderach, P.; Ovalle, R.O.; Kirschke, D. A Bitter Cup: Climate Change Profile of Global Production of Arabica and Robusta Coffee. Clim. Chang. 2015, 129, 89–101. [Google Scholar] [CrossRef] [Green Version]
- Bunn, C.; Läderach, P.; Perez, J.J.G.; Christophe, M.; Schilling, T. Multiclass Classification of Agro-Ecological Zones for Arabica Coffee: An Improved Understanding of the Impacts of the Climate Change. PLoS ONE 2015, 10, e0140490. [Google Scholar] [CrossRef]
- Davis, A.P.; Gole, T.W.; Baena, S.; Moat, J. The Impact of Climate Change on Indigenous Arabica Coffee (Coffea Arabica): Predicting Future Trends and Identifying Priorities. PLoS ONE 2012, 7, e47981. [Google Scholar] [CrossRef] [PubMed]
- Garcia, G.C.; Estrada, F.; Conde, D.; Eakin, H.; Villers, L. Potential Impacts of Climate Change on Agriculture: A Case of Study of Coffee Production in Veracruz, Mexico. Clim. Chang. 2006, 79, 259–288. [Google Scholar] [CrossRef]
- Ovalle, R.O.; Läderech, P.; Bunn, D.; Oberteiner, M.; Schrith, G. Projected shifth in Coffea arabica sustainability among major global production regions due to climate change. PloS ONE 2015, 10, e0124155. [Google Scholar] [CrossRef] [Green Version]
- Phan, Y.; Reardon, S.K.; Mushtaq, S.; Cockfield, G. The Impact of the Climate Change and Variability on Coffee Production: A Systematic Review. Clim. Chang. 2019, 159, 609–630. [Google Scholar] [CrossRef]
- Läderach, P.; Ramirez, V.J.; Narro, R.C.; Zelaya, C.; Martinez, V.A.; Jarvis, A. Climate Change Adaptation of Coffee Production in Space and Time. Clim. Chang. 2017, 141, 47–62. [Google Scholar] [CrossRef] [Green Version]
- FAOSTAT. Food and Agriculture Organization of the United Nations. Available online: http://www.fao.org/faostat/en/#data (accessed on 1 April 2021).
- Verburg, R.; Rahn, E.; Verwij, P.; van Kuijik, M.; Ghazoul, J. An Innovation Perspective to Climate Change Adaptation in Coffee Systems. Environ. Sci. Policy 2019, 97, 16–24. [Google Scholar] [CrossRef]
- Wood, S.; Sebastian, K.; Scherr, S.J. Soil Resources Conditions. In Pilot Analysis of Global Ecosystems: Agroecosystems; World Resources Institute: Washinghton, DC, USA, 2000; pp. 45–54. [Google Scholar]
- Laviola, G.B.; Prieto, M.G.; Bartolomeu de Souza, R.; Alvarez, V.H. Dinámica de cálcio e magnésio en folhas e frutos de Caffea arabica. Rev. Bras. Ciência Solo 2007, 31, 319–329. [Google Scholar] [CrossRef] [Green Version]
- Ramírez, F.; Bertsch, F.; Mora, L. Nutrient Consumption by Caturra Coffee Fruits and Bandolas during a Development and Maturation Cycle in Aquiares, Turrialba, Costa Rica (in Spanish). Agron. Costarricense. 2002, 26, 33–42. [Google Scholar]
- Cuzato, M.M.A.; Peres, S.R.; Alexandre, C.C.; Spadotti, A.C.G. Effect of the Potassium Sources and Rates on Arabica Coffee Yield, Nutrition and Macronutrient Export. Rev. Bras. Ciência Solo 2014, 38, 1448–1456. [Google Scholar]
- Bergmann, W. Nutritional Disorders of Plants: Visual and Analytical Diagnosis (English, French, Spanish); Gustav Fisher Verlag Jena: Stuttgart, Germany, 1992; 741p. [Google Scholar]
- Waraich, A.E.; Ahmad, R.; Ashra, Y.M.; Saifullah; Ahmad, M. Improving Agricultural Water Uses Efficiency by Nutrient Management in Crop Plants. Acta Agric. Scand. Sect. B Soil Plant Sci. 2011, 61, 291–304. [Google Scholar] [CrossRef]
- Grzebisz, W.; Gransee, A.; Szczepaniak, W.; Diatta, J. The Effect of Potassium Fertilization on Water-Uses Efficiency in Crop Plants. J. Plant Nutr. Soil Sci. 2013, 176, 355–374. [Google Scholar] [CrossRef]
- White, P.J.; Broadley, M.R. Calcium in Plants. Rev. Artic. Ann. Bot. 2003, 92, 487–511. [Google Scholar] [CrossRef] [PubMed]
- Ramirez, B.V.H.; Küsters, J.; de Souza, R.T.; Simmes, C. Calcium Nutrition in Coffee and Its Influence on Growth, Stress Tolerance, Cations Uptake, and Productivity. Fron. Agron. 2020, 2, 590892. [Google Scholar] [CrossRef]
- Liu, J.; Williams, J.R.; Zehnder, J.B.A.; Yang, H. GEPIC-Modelling Wheat Yield and Crop Water Productivity with High Resolution on a Global Scale. Agric. Syst. 2007, 94, 478–493. [Google Scholar] [CrossRef]
- Ritchie, T.J.; Bosso, B. Water Uses Efficiency is Not a Constant When Crop Water Supply is Adequate or Fixed: The Role of the Agronomic Management. Eur. J. Agron. 2008, 28, 273–281. [Google Scholar] [CrossRef]
- González, O.H.; Salamanca, J.A. Representative Soil Units of the Colombian Coffee Zone; Chinchiná Cenicafé: Caldas, CO, USA, 2008; 25p. [Google Scholar]
- Alvarado, G.; Posada, H.E.; Cortina, H.A. CASTILLO a New Coffee Variety with Rust Resistance. Av. Tec. Cenicafe 2005, 337, 1–8. [Google Scholar]
- Viets, F.G., Jr. Fertilizers and the Efficient Use of Water. Adv. Agron. 1962, 14, 223–264. [Google Scholar]
- Howell, T.A. Enhancing Water Use Efficiency in Irrigated Agriculture. Agron. J. 2001, 93, 281–289. [Google Scholar] [CrossRef] [Green Version]
- Arcila, P.J.; Buhr, L.; Bleiholder, H.; Hack, H.; Meier, U.; Wicke, H. Application of the Extended BBCH Scale for the Description of the Growing Stages of Coffee (Coffea spp.). Ann. Appl. Biol. 2002, 141, 19–27. [Google Scholar] [CrossRef]
- Allen, G.R.; Pereira, S.L.; Raes, D.; Smith, M. Crop Evapotranspiration: Guidelines for Computing Crop Water Requirements; Food and Agricultural Organization of the United Nations (FAO): Rome, Italy, 1998; Publication No. 56; 300p. [Google Scholar]
- Ramirez, B.V.H.; Jaramillo, R.A.; Arcila, P.J.; Montoya, R.E.C. Estimation of the Soil Moisture in Full Sunshine Coffee Production Systems (in Spanish). Cenicafé 2010, 61, 251–259. [Google Scholar]
- Jaramillo, R.A.; Cháves, C.B. Hydrological Aspects of a Forest and Coffee Plantations (Coffea Arabica L.) with and without Shade (in Spanish). Cenicafé 1999, 50, 97–105. [Google Scholar]
- Ramirez, B.V.H.; Jaramillo, R.A. Rainfall Distribution into Four Crops Coverages in the Andean Region (in Spanish). Inves. Unisarc. Bol. 2007, 5, 19–33. [Google Scholar]
- Ramirez, B.V.H.; Mejia, A.; Marin, E.V.; Arango, R. Evaluation of Models for Estimating the Reference Evapotranspiration in Colombia Coffee Zone. Agron. Colomb. 2011, 29, 107–114. [Google Scholar]
- da Silva, A.L. Variability of Water Balance Components: A Case State in a Coffee Crop (Coffea Arabica L.) in Brazil (in Portuguese). Ph.D. Thesis, Universidad de Sao Pablo-Escuela Superior de Agricultura Luiz do Queiroz, Piracicaba, Brazil, 2005; 73p. [Google Scholar]
- Sadeghian, K.S.; Diaz, M.C. Soil Acidity Correction: Effects on the Initial Coffee Growth. Cenicafé 2020, 71, 21–31. [Google Scholar] [CrossRef]
- Silva, S.J.; Lima, N.J.C.; Prieto, M.H.E.; Alvarez, V.V.H. Relationship between Coffee Leaf Analysis and Soil Chemical Analysis. Rev. Bras. Ciência Solo 2018, 42, 13p. [Google Scholar] [CrossRef]
- Cerda, R.; Avelino, J.; Gary, C.; Tixier, P.; Lechevallier, E.; Allinne, C. Primary and Secondary Yield Losses Caused by Pest and Disease: Assessment and Modeling in Coffee. PLoS ONE 2017, 12, e0169133. [Google Scholar] [CrossRef] [Green Version]
- Arcila, P.J.; Jaramillo, R.A. Relation between Soil Moisture, Flowering and Fruit Development in Coffee Plantations (in Spanish). Av. Tec. Cenicafé 2003, 397, 1–4. [Google Scholar]
- Jaramillo, R.A. The Climate of the Coffee Regions in Colombia (In Spanish); Coffee Growers Federation-National Coffee Research Center, FNC-Cenicafé: Chinchiná, Caldas, CO, USA, 2018; 205p, ISBN 978-958-8490-21-1. [Google Scholar]
- Peña, Q.A.J.; Ramirez, B.V.H.; Valencia, A.J.; Jaramillo, R.A. The Rainfall as a Threat Factor for the Coffee Crop in Colombia. Av. Tec. Cenicafé 2012, 415, 1–8. [Google Scholar]
- Ramirez, B.V.H.; Jaramillo, R.A. Relationship between the Ocean Niño Index and the Rainfall in the Colombia Central Coffee Zone (in Spanish). Cenicafé 2009, 60, 161–172. [Google Scholar]
- Ramirez, B.V.H.; Jaramillo, R.A. Relationship between the El Niño/La Niña (ENSO) and the Solar Radiation in the Colombia Coffee Zone (in Spanish). Cenicafé 2012, 63, 90–97. [Google Scholar]
- National Oceanic and Atmospheric Administration-NOAA/National Weather Service/Climate Prediction Center. ONI Data Base. Available online: https://origin.cpc.ncep.noaa.gov/products/analysis_monitoring/ensostuff/ONI_v5.php (accessed on 1 April 2021).
- Trenberth, E.K. The Definition of El Niño. Bull. Am. Meteorol. Soc. 1997, 78, 2771–2777. [Google Scholar] [CrossRef] [Green Version]
- Pagotto, R.C.; Rodrigues, M.F. Flowering Percentage in Arabica Coffee Crop Respond on the Water Deficit Level Applied during the Pre-Flowering Stage. Rev. Caatinga. 2020, 33, 195–204. [Google Scholar] [CrossRef] [Green Version]
- Crisosto, C.H.; Grantz, D.A.; Meizer, F.C. Effect of the Water Deficit on Flower Opening in Coffee (Coffea Arabica L.). Tree Physiol. 1992, 10, 127–139. [Google Scholar] [CrossRef]
- Ramirez, B.V.H. Vulnerability of some Soils of the Colombian Coffee Zone to Water Deficit (in Spanish). Av. Tec. Cenicafé 2014, 449, 8p. [Google Scholar]
- DaMatta, M.F.; Ronchi, P.C.; Maestri, M.; Barros, S.R. Ecophysiology of the Coffee Growth and Production. Braz. J. Plant. Physiol. 2007, 19, 485–519. [Google Scholar]
- Ramirez, B.V.H.; Jaramillo, R.A.; Arcila, P.J. Climatic Factors that Influence on the Coffee Crop Production in Colombia (in Spanish). In Manual del Cafetero Colombiano Tom II; National Coffee Research Center-Cenicafé: Chinchiná, Caldas, CO, USA, 2013; Volume 205, p. 237. [Google Scholar]
- Salamanca, J.A.; Doane, A.T.; Horwath, R.W. Coffee Response to Nitrogen and Soil Water Content during the Early Growth Stage. J. Plant Nutr. Soil. Sci. 2017, 180, 614–623. [Google Scholar] [CrossRef]
Figure 1.
Soil moisture variation over five years for two coffee trials. C. arabica cv. Castillo (a), and C. arabica cv. Caturra (b).
Figure 1.
Soil moisture variation over five years for two coffee trials. C. arabica cv. Castillo (a), and C. arabica cv. Caturra (b).


Figure 2.
Influence of the calcium and potassium fertilization on water use efficiency in two coffee varieties, Castillo cv (a,c) and Caturra cv (b,d). Different letters indicate statistically significant differences in LSD test p < 0.05.
Figure 2.
Influence of the calcium and potassium fertilization on water use efficiency in two coffee varieties, Castillo cv (a,c) and Caturra cv (b,d). Different letters indicate statistically significant differences in LSD test p < 0.05.


Table 1.
Climatic conditions obtained from the weather station. Simon Campos weather station 02°21´ N–75°53 W provided by the National Coffee Research Centre-Meteorological Network.
Table 1.
Climatic conditions obtained from the weather station. Simon Campos weather station 02°21´ N–75°53 W provided by the National Coffee Research Centre-Meteorological Network.
| Year | T. Min (°C) | T. Max (°C) | T. Med (°C) | R.H (%) | Rainfall (mm) | Sunshine (hours) |
|---|---|---|---|---|---|---|
| 2014 | 15.7 | 23.6 | 19.1 | 74.6 | 1741.3 | 1233.1 |
| 2015 | 15.8 | 24.2 | 19.5 | 72.3 | 1319.6 | 1243.1 |
| 2016 | 16.1 | 24.1 | 19.6 | 73.4 | 1625.3 | 1241.4 |
| 2017 | 15.7 | 23.6 | 19.1 | 70.5 | 1976.3 | 1211.2 |
| 2018 | 15.7 | 23.5 | 19.0 | 75.3 | 1761.9 | |
| 2019 | 1482.1 | |||||
| Mean | 15.8 | 23.8 | 19.3 | 73.2 | 1651.1 | 1231.2 |
Table 2.
Soil fertility properties for the experimental sites.
| Trial | PH CaCl2 | C.org | P | K | Ca | Mg | Al |
|---|---|---|---|---|---|---|---|
| % | mg.kg−1 | ||||||
| Castillo | 4.0 (low) | 1.38 (low) | 1.8 (low) | 141 (med) | 448 (low) | 150 (high) | 196 (high) |
| Caturra | 4.4 (low) | 2.14 (low) | 5.0 (low) | 254 (high) | 274 (low) | 98 (med) | 244 (high) |
Table 3.
Crop coefficients were used for both coffee trials during the study (adapted from Da Silva, [34]).
Table 3.
Crop coefficients were used for both coffee trials during the study (adapted from Da Silva, [34]).
| Variety | Year | Kc |
|---|---|---|
| Coffea arabica cv. Castillo | 2014 | 0.9 |
| 2015 | 0.9 | |
| 2016 | 1.0 | |
| 2017 | 1.1 | |
| 2018 | 1.1 | |
| Coffea arabica cv. Caturra | 2014 | 0.6 |
| 2015 | 0.7 | |
| 2016 | 0.8 | |
| 2017 | 1.0 | |
| 2018 | 1.2 | |
| 2019 | 1.2 |
Table 4.
Water balance components for two coffee varieties during four harvest periods.
| Variety | Period | Harvest Year | P | Pe | R | ETact | Deficit + |
|---|---|---|---|---|---|---|---|
| mm | |||||||
| Castillo | May 2014–December 2015 | 2015 | 2.293 | 1.234 | 108 | 1.119 | 362 |
| May 2015–December 2016 | 2016 | 2.234 | 1.191 | 105 | 1.058 | 408 | |
| May 2016–December 2017 | 2017 | 3.126 | 1.703 | 159 | 1.382 | 299 | |
| May 2017–July 2018 | 2018 | 2.053 | 1.117 | 102 | 1.067 | 393 | |
| Caturra | May 2015–December 2016 | 2016 | 2.234 | 1.191 | 105 | 1.021 | 361 |
| May 2016–December 2017 | 2017 | 3.126 | 1.703 | 159 | 1.310 | 296 | |
| May 2017–December 2018 | 2018 | 2.826 | 1.471 | 140 | 1.366 | 636 | |
| May 2018–July 2019 | 2019 | 1.806 | 888 | 89 | 988 | 438 | |
+ Water deficit was calculated using the ρ index from Equation (3); when ρ <= 0.4 water deficit = ETact and when ρ > 0.4 water deficit = 0.0.
Table 5.
Yearly water use efficiency for both coffee varieties under variable Ca+2 and K+ rates.
| Variety | Harvest Year | kg CaO ha−1 | kg K2O ha−1 | |||||
|---|---|---|---|---|---|---|---|---|
| 0 | 50 | 100 | 150 | 100 | 180 | 230 | ||
| WUE kg ha−1 mm−1 | ||||||||
| Castillo | 2015 | 12.9 | 11.6 | 12.6 | 13.2 | 11.8 | 13.5 | 13.2 |
| 2016 | 18.9 | 19.2 | 21.0 | 21.2 | 17.2 | 22.1 | 21.2 | |
| 2017 | 12.6 | 15.4 | 16.5 | 15.6 | 13.9 | 15.1 | 15.6 | |
| 2018 + | 9.2 a | 17.2 b | 16.3 c | 16.6 c | 13.6 A | 17.2 B | 16.6 B | |
| Caturra | 2016 | 9.7 | 8.4 | 12.9 | 9.3 | 9.7 | 14.3 | 9.3 |
| 2017 | 24.5 | 25.3 | 29.1 | 27.3 | 25.6 | 23.0 | 27.3 | |
| 2018 | 5.4 | 6.8 | 8.4 | 8.6 | 8.7 | 7.3 | 8.6 | |
| 2019 + | 9.7a | 10.1 b | 18.8 c | 12.4 b | 13.5 A | 17.6 B | 12.4 C | |
+ Different letters indicate statistically significant differences LSD test p < 0.05.
Publisher’s Note: MDPI stays neutral with regard to jurisdictional claims in published maps and institutional affiliations. |
© 2021 by the authors. Licensee MDPI, Basel, Switzerland. This article is an open access article distributed under the terms and conditions of the Creative Commons Attribution (CC BY) license (https://creativecommons.org/licenses/by/4.0/).
Share and Cite
MDPI and ACS Style
Ramírez-Builes, V.H.; Küsters, J. Calcium and Potassium Nutrition Increases the Water Use Efficiency in Coffee: A Promising Strategy to Adapt to Climate Change. Hydrology 2021, 8, 75. https://doi.org/10.3390/hydrology8020075
AMA Style
Ramírez-Builes VH, Küsters J. Calcium and Potassium Nutrition Increases the Water Use Efficiency in Coffee: A Promising Strategy to Adapt to Climate Change. Hydrology. 2021; 8(2):75. https://doi.org/10.3390/hydrology8020075
Chicago/Turabian StyleRamírez-Builes, Victor Hugo, and Jürgen Küsters. 2021. "Calcium and Potassium Nutrition Increases the Water Use Efficiency in Coffee: A Promising Strategy to Adapt to Climate Change" Hydrology 8, no. 2: 75. https://doi.org/10.3390/hydrology8020075
Note that from the first issue of 2016, this journal uses article numbers instead of page numbers. See further details here.