Article

A Catalogue of Tropical Cyclone Induced Instantaneous Peak Flows Recorded in Puerto Rico and a Comparison with the World’s Maxima

by
Carlos E. Ramos-Scharrón
*,
Caroline T. Garnett
and
Eugenio Y. Arima
Department of Geography and the Environment, The University of Texas at Austin, Austin, TX 78748, USA
*
Author to whom correspondence should be addressed.
Hydrology 2021, 8(2), 84; https://doi.org/10.3390/hydrology8020084
Submission received: 5 May 2021 / Revised: 19 May 2021 / Accepted: 19 May 2021 / Published: 21 May 2021
(This article belongs to the Special Issue Hydrology in the Caribbean Basin)

Abstract

:
Peak streamflow rates from the Insular Caribbean have received limited attention in worldwide catalogues in spite of their potential for exceptionality given many of the islands’ steep topographic relief and proneness to high rainfall rates associated with tropical cyclones. This study compiled 1922 area-normalized peak streamflow rates recorded during tropical cyclones in Puerto Rico from 1899 to 2020. The results show that the highest peak flow values recorded on the island were within the range of the world’s maxima for watersheds with drainage areas from 10 to 619 km2. Although higher tropical cyclone rainfall and streamflow rates were observed on average for the central–eastern half of Puerto Rico, the highest of all cyclone-related peaks occurred throughout the entire island and were caused by tropical depressions, tropical storms, or hurricanes. Improving our understanding of instantaneous peak flow rates in Puerto Rico and other islands of the Caribbean is locally important due to their significance in terms of flooding extent and its associated impacts, but also because these could serve as indicators of the implications of a changing climate on tropical cyclone intensity and the associated hydrologic response.

1. Introduction

1.1. Background

River flooding constitutes about a third of all geophysical hazards that annually occur throughout the world and it affects more people than any other type of natural hazard [1,2]. Between 1995 and 2004, floods were responsible for 20% of all worldwide natural hazard induced fatalities and for one-third of all economic damages [3]. Throughout the 1990s and the early 2000s, the annual number of flood disasters in the world doubled in relation to the period between the 1950s and 1980s [4]. Most flood-related deaths in the world are related to flash floods induced by tropical cyclones (TC) impacting landmasses along the western Pacific and Atlantic Oceans [5]. Although TCs also cause much harm and destruction due to high winds, waves, storm surges, and landslides [6,7], river flooding is the leading cause of TC-related deaths and economic loss [8,9]. TC-related river flooding occurs as a result of severe hourly rainfall intensities that can reach up to ~150 mm h−1 [10,11,12], causing rivers to overflow [8].
River flooding impacts are expected to increase further due to human encroachment on flood-prone areas and to climate change-driven increases in rain intensities projected for many parts of the world [13,14]. This is particularly true for areas affected by TCs where largely unplanned development to accommodate rural to urban migration has been predominant [15] and where climate change-associated ocean temperature anomalies have already been linked to increased TC rain intensities [16,17]. In addition to increased rainfall rates, the weakening of summertime tropical circulation associated to climate change is potentially capable of slowing down TC translational speeds which can also lead to a greater likelihood of flooding [18]. These already noticeable manifestations of climate change reinforce the need for a better understanding of previously observed TC flooding magnitudes to aid in prescribing adequate adaptive measures [19].
This study concentrates on instantaneous peak flow rates (Qp) which refer to the absolute maximum streamflow rates reached during rainstorms. Qp values considered in this study exclusively represent meteorological river flows as defined by O’Connor, et al. [20] in that they are “… notable flows of channelized water… induced by rainfall”. Several Qp catalogues have been developed for different regions including the United States (U.S.), India, and China [21,22,23], as well as for the entire world [24,25]. Catalogues are used to define the extent of previously observed Qp maxima and encapsulate these in what is known as the flood envelope [26]. These datasets demonstrate an inverse relationship between area-normalized Qp (hereafter referred to as Qpa in units of m3 s−1 km−2) and drainage area, as captured by the following equation:
ln Q p a = a + b ln A
where a and b are fitted linear regression parameters, and A is area in km2 [27]. Fitted values for b are always negative and greater than −0.66 for most regions [26,28] with a value of −0.4 found fitting to Mediterranean and inland continental settings in Europe, for example [28]. The decline in Qpa as a function of increasing drainage area is due to the area-scaling effect of precipitation and the attenuation of flow waves as they route through the fluvial network [20]. Flow wave attenuation is dependent on the physiographic factors related to stream channel hydraulic efficiency, channel slope, and the geometric configuration of the stream network [29,30]. Figure 1 shows a world envelope curve representing the maximum observed values based on the following equations developed by Herschy [24]:
ln Q p a = 6.21 0.57 ln A         f o r   A < 100   km 2 4.61 0.20 ln A           f o r   A 100   km 2
River flooding in the Insular Caribbean (IC) can be induced by a variety of rainstorm types including localized convective cells enhanced by orographic effects [33,34], cold fronts, troughs [35,36], and TCs. In fact, IC is one of the world’s natural disaster hotspots [37,38] and river flooding is particularly important in terms of mortality, infrastructure damage, increased incidence of water-borne diseases, and for their lasting micro- and macro-economic impacts [39,40,41,42]. Climate change projections suggest a greater frequency and magnitude of extreme events for most of the IC [43,44]. In fact, climate records suggests a rise in the frequency of heavy rainfall events throughout the 20th century [45] and climate change is projected to induce a further increase in the number and intensity of major hurricanes for the region [46]. However, only a few Qp observations from the IC are included in worldwide catalogues of Qp maxima [25]. In the latest attempt to capture worldwide Qp maxima, out of hundreds of values, the IC was represented only by 10 entries from Cuba (only five TC related); six from the Dominican Republic (all related to Hurricane David in 1979), one non-TC related value for Jamaica, and four TC-related values for Puerto Rico (PR) (for a total of 21 values from the IC) [24]. Additional IC Qp values associated with TCs that merit recognition in worldwide catalogues include those provoked by TC Erika (2015) in Dominica [31] and several recorded in the U.S. Virgin Islands during TCs Hugo (1989) and Marilyn (1995) (Figure 1) [32], in addition to several more from PR.
The island of PR is no exception to the high propensity of TC rains, high peak flows, and impacts that typifies the IC [47,48]. In fact, many of the highest Qp values reported by the U.S. Geological Survey throughout the entire U.S. for watersheds smaller than ~2000 km2 have been recorded in PR [21]. The reasons why PR figures as a high peak flow magnitude hotspot include the relatively high density of stream gaging stations (e.g., ~55 active stations throughout the 1970s; 62 stations in 2017), the abundance of short and steep watersheds that can quickly transfer rainfall as runoff from hillslopes to streams [49,50,51], the high density and flow routing efficiency of its fluvial network [52,53], and the propensity of the island’s precipitation regime to be heavily controlled by intense TC rainfall [34].
Even though non-TC storms can trigger significant peak flows [54,55,56], the individual intense rain cell lifetime of non-TC related extreme storms in PR is only about 20 min [57] and this is shorter than the time to concentration of most of the island’s watersheds (i.e., ~1 h for 102 km2 watersheds, respectively) [58]. Therefore, TCs are presumed to provide the sufficient rainfall intensity-duration characteristics to generate some of the island’s highest peak flows. However, other than describing the streamflow response of individual storms [58] and assessing peak flow rates from an average daily flow rate perspective [59], no study has catalogued the historical TC-related Qp values recorded on the island, nor compared them to worldwide maxima. Not all TCs generate extreme floods as rain intensities and totals are associated with the availability of abundant atmospheric moisture, proximity to the low-pressure center, TC translational speeds, and complex interactions with island topography [48,58]. Qp values are essential in understanding flood impacts in the type of flashy response that characterizes high-standing tropical islands like PR [60]. This became evident in 2017 during Hurricane María as instantaneous peak flow rates demarcated the extent of damaging flooding [61] and exerted a control on the stream channel geometric adjustments [62].

1.2. Objectives

This study intends to provide some context on the magnitude of TC-related Qpa values in PR. The specific objectives were to:
(1)
Develop a catalogue of instantaneous Qpa values and daily average rainfall rates for a selected group of TCs that affected PR from 1899 to 2020;
(2)
Compare the island’s TC-related Qpa values to the world’s flood envelope; and
(3)
Compare TC Qpa values and the associated 24 h rainfall rates for different regions of PR.
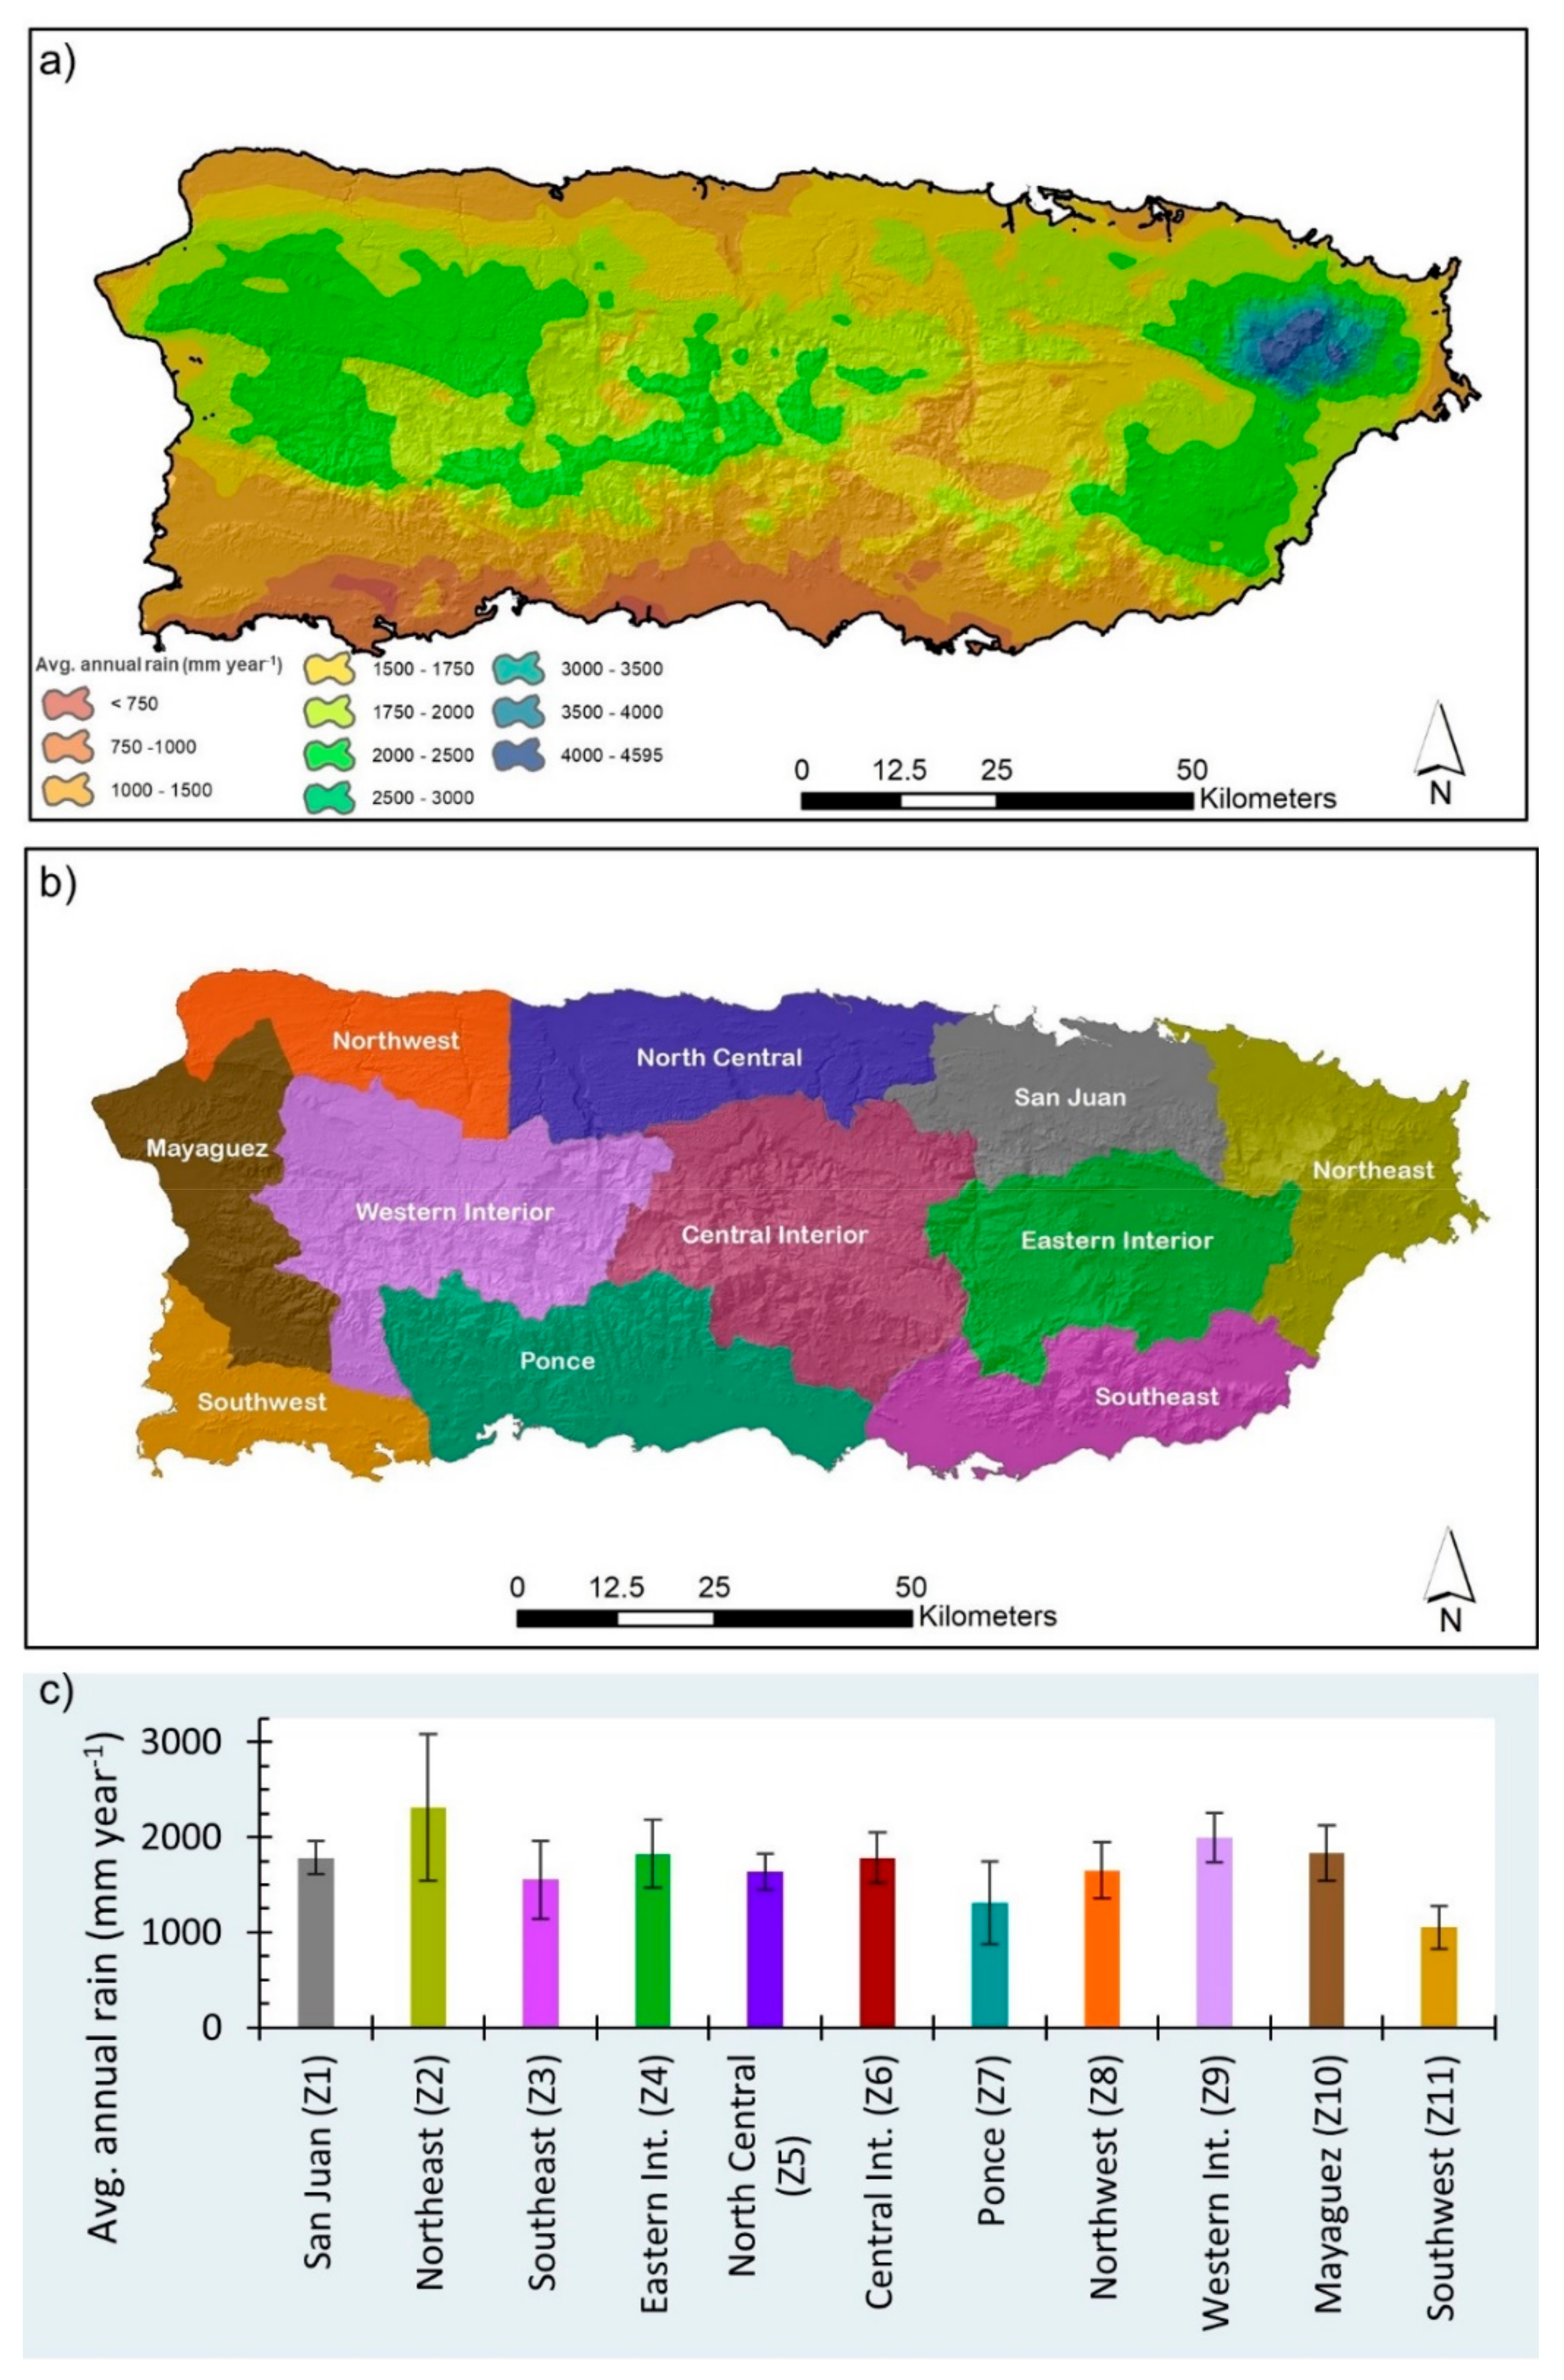
TC-related peak flows in PR are some of the highest recorded on the island (Ramos-Ginés, 1999), but also worldwide for watersheds with drainage areas ranging between 10−1 and 102 km2 [21,24]. Improving our knowledge of streamflow responses to TCs for the island is essential given that the projected increase in the frequency and magnitude of extreme events will undoubtedly have consequences on PR’s future peak flow rates and associated flood damage [57]. However, it is not our intention here to develop an equation predicting Qpa as a function of explanatory variables.

1.3. Study Area

With a landmass area of about 8690 km2 and located at roughly 18.25° N and 66.50° W, PR is the smallest and easternmost island of the Greater Antilles (Figure 2). The island’s physiography has been classified into three main provinces (i.e., upland, northern karst, and coastal plains) [63], which combined with the island’s six subtropical life zones (i.e., from tropical dry forests to montane wet and rain forests) [64] and its wide variety of geologic terranes [65] has led to the recognition of a dozen distinct landscape units [66]. The Cordillera Central is the main topographic feature of the island’s upland province traversing about two-thirds of its length before yielding into two northeast- and southeast-trending ranges (Sierra de Luquillo and Sierra de Cayey, respectively). Alluvial valleys typify the approach of most rivers towards all four coastlines, but the Caguas Valley is the only significant inland valley [66]. Even though forests currently cover about >40% of the island [67,68], most of these are secondary due to the widespread abandonment of sugar cane, coffee, tobacco, and cattle grazing lands that started during the second half of the 20th century [69,70]. Agricultural land presently covers only ~11% of the island [71].
PR has a spatially varied yet consistently maritime tropical climate that is similar to other parts of the IC [72]. The island-wide mean annual temperature is ~30 °C. PR-wide mean annual rainfall is 1690 mm year−1 and ranges from ~700 mm year−1 in the southwest to ~4600 mm year−1 in the northeast with ~45% occurring during the peak of the TC season from August to October (Daly et al., 2003) (Figure 3a). Although not all of the largest rainstorms in PR are TC-related [73,74], TCs yielding an excess of 50 mm in mean island-wide rainfall occur on average 5–6 times per decade [48]. Major TC landfalls (>3 in the Saffir-Sampson TC scale) have occurred every five to six decades [50]. However, TC rainfall does not depend only on proximity to the low-pressure center, but also on the amount of precipitable water in the atmosphere, ground elevation, translational speed, and event duration [48]. Even though the largest amounts of TC rainfall have typically occurred in the eastern, southeastern, and central interior portions of the island [34,75], rainfall intensity and totals are largely dependent on the specific interactions of internal TC moisture, and TC wind direction with topographical features [58].
Runoff generation in PR is preferentially controlled by subsurface stormflow and saturation overland flow mechanisms for forested areas due to the high infiltration rates [76] and abundance of macropores [77] however, it is prone to the occurrence of excess precipitation overland flow on disturbed areas [78]. However, studies conducted elsewhere show that dramatic changes in land cover are typically undetectable by empirical flow data even in small watersheds (e.g., 35 ha watershed under controlled experiment conditions described by Birkinshaw, et al. [79]) and its effects dramatically diminish with both increasing drainage area and storm size [80]. Although PR underwent dramatic land cover changes during the 20th century [70], this study did not attempt to consider the effects of land cover changes because its focus is on Qps induced by TCs for which land cover likely plays a minor role. Evapotranspiration occurring during the individual TCs is expected to play a minimal role in controlling Qps given that the average daily evapotranspiration rates for the portion of the year when TCs predominantly affect PR (i.e., from August to November) ranges between 0.10 and 0.25 mm h−1 [81] and this equals only 3–7% and 0.8–2% of the average and maximum daily TC rainfall rates reported for the island, respectively, (3.5 and 12.7 mm h−1, respectively [82]).

2. Methods

2.1. Development of TC Qp and 24 h Rainfall Rate Database

The USGS and other local government agencies have been operating stage-recording stream gauging stations in PR since 1958 with 10 and eventually 63 continuous recording stations in 1960 and 1970, respectively [83]. Automated gages have measured flow rates at 5–15 min intervals at stream reaches with drainage areas ranging from 10−1 to 1.8 × 10³ km2 [84]. This study relied on data stored in the USGS’ repository [32] and in USGS published reports (e.g., [85,86]) to construct a TC-associated Qp catalogue for PR. In this study, we included Qp values for 40 TCs that occurred between 1899 (i.e., TC San Ciriaco) and 2020 (i.e., TCs Isaías and Laura). For periods when recording stage-level equipment was active, Qp values rely on rating curves established at each station for flows that do not exceed stream channel capacities [87]. However, for flows that exceed the stream channel capacity and for those that occur when instruments were either not available or not operational, Qp values rely on field-checked high water marks and an application of the slope-area method [88] with these values prone to the highest errors [89,90].
We relied on the GIS-ready watershed polygons available through the USGS database to define the size and extent of the source area for each stream gauging station. However, these polygons are only available for the currently active stations (n = 67). For inactive stations, we developed a point-based GIS layer based on each station’s coordinates and used that to define their drainage area using ArcGIS 10.7′s Flow Direction and Watershed tools on a sinkless, 90 m resolution DEM. Drainage areas were used to convert Qp (in m3 s−1) into Qpa units (m3 s−1 km−2).
The new catalogue allowed us to compare the various TCs with regard to their Qpa values. Since Qpa is strongly dependent on the drainage area (Equation (1) and Figure 1) and because the database represents observations from a variable collection of stream gaging stations with different drainage areas, a simple difference of mean Qpa values is not an appropriate comparison metric. Therefore, our comparisons rely on the criteria used by O’Connor et al. [20] to identify significant flows:
Q p   s i g > 15 A 2 3           f o r   A < 2590   km 2
where Qp sig is the cutoff value to declare a flow as significant in units of m3 s−1 and A is in km2.
The area-normalized version of this equation is:
Q p a   s i g > 15 A 0.33
where Qpa sig is in m3 s−1 km−2. Two metrics were used to assess the overall Qpa magnitude of every TC in our record. The first consisted of calculating the proportion of observations recorded during each storm that exceeded their respective Qpa sig values. The second assessed each TC based on its average Q p a / Q q p a   s i g ratio. It is important to emphasize that this is not meant to be a formal comparison of TCs but simply an aid to identify TCs with particularly high Qpa responses.
Rainfall associated with each peak flow rate was also captured to further characterize every Qpa value and TC. Rainfall data relied on the interpolated rasters of maximum daily rainfalls for each TC calculated as the average 24 h rainfall intensities in mm h−1 (hereafter referred to as R24h) and developed by Ramos-Scharrón and Arima [82]. We relied on R24h as rasterized hourly rain data were not available and because hourly rain data did not cover the entire period of interest since recording rain gauges were first installed on the island in the 1970s. The collection of storms with rasterized data included all TCs with direct hits on the island since 1899, TCs for which historical accounts and reports described significant rainfall and flooding, and TCs from 1970 onwards that produced more than 50 mm of rainfall [82].
We relied on the upstream drainage area polygon of each stream gauging station to calculate the average daily rainfall ( R 24 h ¯ ) corresponding to each Qpa value. This was calculated using the mean option of the Zonal Statistics as Table tool on the rasterized daily rainfall dataset [82]. Matching R 24 h ¯ estimates were not calculated for all Qpa values because we lacked the coordinates for some inactive stream gaging stations or because of an inability of the GIS tools to define a source drainage area for some stations. R 24 h ¯ values were used to identify TCs with exceptional daily rainfall. A value of 2.8 mm h−1 was chosen as a R 24 h ¯ threshold to define exceptional storms as this represented the median island-wide daily rain intensity of 61 TCs for which this information was readily available [82]. We informally compared TCs based on the proportion of the R 24 h ¯ values that exceeded 2.8 mm h−1 and on the average of all R 24 h ¯ / 2.8   mm   h 1 ratios for each storm.

2.2. Comparison of PR’s TC Related Instantaneous Peak Flows with the World’s Envelope

We assembled a world instantaneous peak flow maxima database combining four existing catalogues. The database included values compiled by Costa [22] for the U.S., Li, et al. [91] for China, Rakhecha [23] for India, and Herschy [24] for the world (Supplementary Materials). The database considers only rain-associated flows and also contains drainage area information for every measurement location. Only values for drainage areas within 6.5 × 10⁻³ and 2450 km2 were considered for our analyses as these values span the drainage areas represented by flow rates values recorded in PR. Qpa and drainage area values were transformed into their natural logarithms before conducting linear regression analyses to calculate the best fit coefficients for both parameters a and b following Equation (1).
The PR peak flow envelope was estimated through a quantile regression model. Whereas ordinary least squares (i.e., linear regression) applied to the world envelope estimates the average relationship between peak flow conditional on area, quantile regressions can identify such relationships for different quantiles in the distribution. In our case, we estimated this relationship at the 95% quantile. This is similar to finding a linear model that splits the top 5% peak flows, conditional on upstream drainage area, from the bottom 95%. Following Cameron and Trivedi [92], the quantile regression estimator Q( β q ) finds the β coefficients that minimize the sum of the absolute deviation of the error according to the objective function:
Q b q , a q = i : ln Q p a i ln A b q + a q N q ln Q p a i ln A b q a q + i : ln Q p a i < ln A β q + a q N 1 q ln Q p a i ln A b q a q
where q is the quantile (0.95), which pre-multiplies the absolute deviations in the formulation, placing more weight on predictions for portions where ln Q p a ln A b q + a q ; and a q is the intercept coefficient. The coefficients are subscripted with q to emphasize that each quantile has its own set of coefficients. This objective function is not differentiable, meaning that gradient-based algorithms cannot be used, and the solution (i.e., coefficients b q , a q ) that minimizes the function is found via linear programing. The standard errors of this regression were estimated using 1000 bootstrap resamples of the original set of observations with replacement. For each resample, the method runs a quantile regression and stores the coefficients of interest. Once all 1000 regressions are calculated, the final coefficients estimates are the average of all estimates and the standard errors are the square root of the variance of the bootstrapped estimators [93]. For this particular analysis, we only used those peak flows that were classified as significant according to O’Connor’s Equation (3b), yielding 569 peak flow observations.
Quantile regressions (QR) offer several advantages over ordinary least squares for this particular application. First, as described above, we can find the relationship between peak flow and watershed area for only the top 5% of our dataset. Second, the method is more robust to outliers (both positive or negative) because it minimizes the sum of absolute deviations instead of the sum of squared deviations. Third, QR is found to be more robust to non-normal errors, which is an important factor when the sample size is small. QR is also less parsimonious in the selection of what observations of peak flow are included in the regression. For instance, in our subsample, we included all peak flows that were “significant”, including multiple entries for certain watersheds. Had we used standard OLS to model Qpa as a function of area, we would have to make an arbitrary decision on what observations from this subset to include in the regression. One option would be to only keep the highest values for each watershed and use OLS, however, questions remain as to whether, for example, two watersheds of similar size exhibit maximum values that are disparate, i.e., one with a high maximum value and one with a much lower maximum value. An arbitrary decision here would have to be made to either include the lower maximum value, which would lower the predicted fitted line, or bin the two watersheds into one single watershed class and only use the highest value of the two. This arbitrary selection problem was avoided with the use of QR because the method is less sensitive to outliers (low values in this case). An additional benefit of including more observations is the higher degrees of freedom. Finally, QR is invariant to monotonic transformations such as our case where the peak and area were log-transformed [94]. This means that all statistical results can be translated back to Qpa, which is not the case of OLS because the expectation operator does not “pass through” non-linear transformations (e.g., E[ L n Q p a | L n a r e a ] L n ( E [ Q p a | a r e a ] ) ).

2.3. Regional Qpa and R 24 h ¯ Tendencies within PR

Previous work has identified a propensity for some regions of the island to receive greater TC rainfall than others and is therefore logical to assume that these could lead to higher Qpa values. In fact, peak flow magnitude frequency analyses conducted for the island have established a positive relationship between Qp and the mean annual rainfall [84,95]. Annual rainfall on the island is highest in the vicinity of the Sierra de Luquillo in the Northeast and near the southeast hills marking the eastern end of the Sierra de Cayey, with some localized areas close to the highest peaks of the Cordillera Central [96] (Figure 2). These regions mostly coincide with those where TC rainfall tends to be most abundant [34,48]. Here, we evaluated differences in both Qpa and R 24 h ¯ for watersheds within different regions in PR. Some studies have zoned PR’s climate into sub-areas based on convective storm hourly precipitation intensities [97,98] while others have divided the island based on both daily temperature and rainfall [99]. However, here we rely on the National Weather Service climate forecast zones (NWS zones; Figure 3b) [100], as these account for regional differences in rain patterns while also adhering to topographic boundaries to fulfill its streamflow forecasting purpose [101]. The expectation was that the northeastern, southeastern, eastern interior, and central interior zones (NWS zones 2, 3, 4, 5, and 6) should display higher Qpa and R 24 h ¯ values than others.
Source areas represented by each peak flow and daily rain observation were assigned to a single NWS zone using the majority option of ArcGIS’ Zonal Statistics tool. Qpa and R 24 h ¯ observations were grouped into their corresponding zones. Qpa observations for the different NWS zones were compared based on the overall average Q p a / Q p a   s i g ratio described above. After testing for normality (Shapiro Test) and equal variance (Levene’s Test) we relied on one-way Kruskal–Wallis and Dunn’s non-parametric tests [102] to compare the peak flow responses within each of the different NWS zones represented in our dataset. Given that average precipitation falling over a zone is not as strongly dependent on the drainage area as it is for Qpa ( A v e r a g e   r a i n   o v e r   a n   a r e a = f A 0 / 05 [20], we simply relied on the raw R 24 h ¯ values to compare the differences among the zones also based on one-way Kruskal–Wallis and Dunn’s tests after testing for normality and equal variance.

3. Results and Discussion

3.1. The PR Tropical Cyclone Instantaneous Peak Flow Catalogue

3.1.1. General Comments on the Catalogue

The PR TC peak flow catalogue contains 1922 individual Qpa values from 167 stream gauging stations and for 41 different TCs (Table 1) (Supplementary Materials). A total of 1904 of these peak flow observations have associated R 24 h ¯ values. Individual TCs are represented by 3–80 individual observations with an average of 47 per storm (n = 3 to 73 for R 24 h ¯ with an average of 46 per TC). Drainage areas span from 0.1 to 619 km2. Qpa values range from 7.0 × 10⁻⁵ to 82 m3 s−1 km−2 and R 24 h ¯ from 0.02 to 19.0 mm h−1. The watershed scale R 24 h ¯ values are all lower than the maximum reported for a TC in PR between 1899 and 2020 at an individual rain gauge (28.4 mm h−1 during Hurricane María) [82].
A total of seven out of the 11 NWS zones are represented by Qpa and R 24 h ¯ values (Table 2) (i.e., Zones 1, 2, 3, 4, 6, 7, and 9). Each zone has between 40 and just over 600 Qpa and R 24 h ¯ entries, with the lowest number of observations being for Zone 1 (San Juan) and the highest for Zone 4 (eastern interior). Historically, Zone 4 has contained the densest network of stream gaging stations due to the importance of its largest watershed (i.e., Río Grande de Loíza) in supplying much of the water needs of the San Juan Metropolitan area [103,104]. With the exception of Zone 1, all of these seven zones have observations from watersheds with drainage areas spanning over two to three orders of magnitude.

3.1.2. TCs with Exceptional Qpa and R 24 h ¯ Values

Among all Qpa observations, about 30% exceeded the exceptional flow criteria established by Equation (3b) [20] (Figure 4a) and about 61% of the R 24 h ¯ observations exceeded the 2.8 mm h−1 daily rainfall criteria (Figure 4b). The overall average Q p a / Q q p a   s i g and R 24 h ¯ / 2.8   mm   h 1 ratios were 0.96 and 1.74, respectively. Notable TCs based on normalized instantaneous peak flows and daily rainfall include San Ciriaco, San Ciprián, and San Felipe II (Figure 5a–d). However, it is important to note that these three TCs are represented by only 3–9 observations (Table 1) and that these values most likely only exemplify the most extreme conditions that occurred on the island during each storm. Out of those three, Hurricane San Ciriaco is definitely a notable TC that still holds record rainfall records for portions of PR [82]. Other TCs with significant Qpa and R 24 h ¯ values include Hurricane Donna (1960), tropical depression #15 (TD-15 in 1970), tropical storm Eloísa (1975), tropical storm Isabel (1985), and Hurricanes Hortense (1996), Georges (1998), and María (2017).

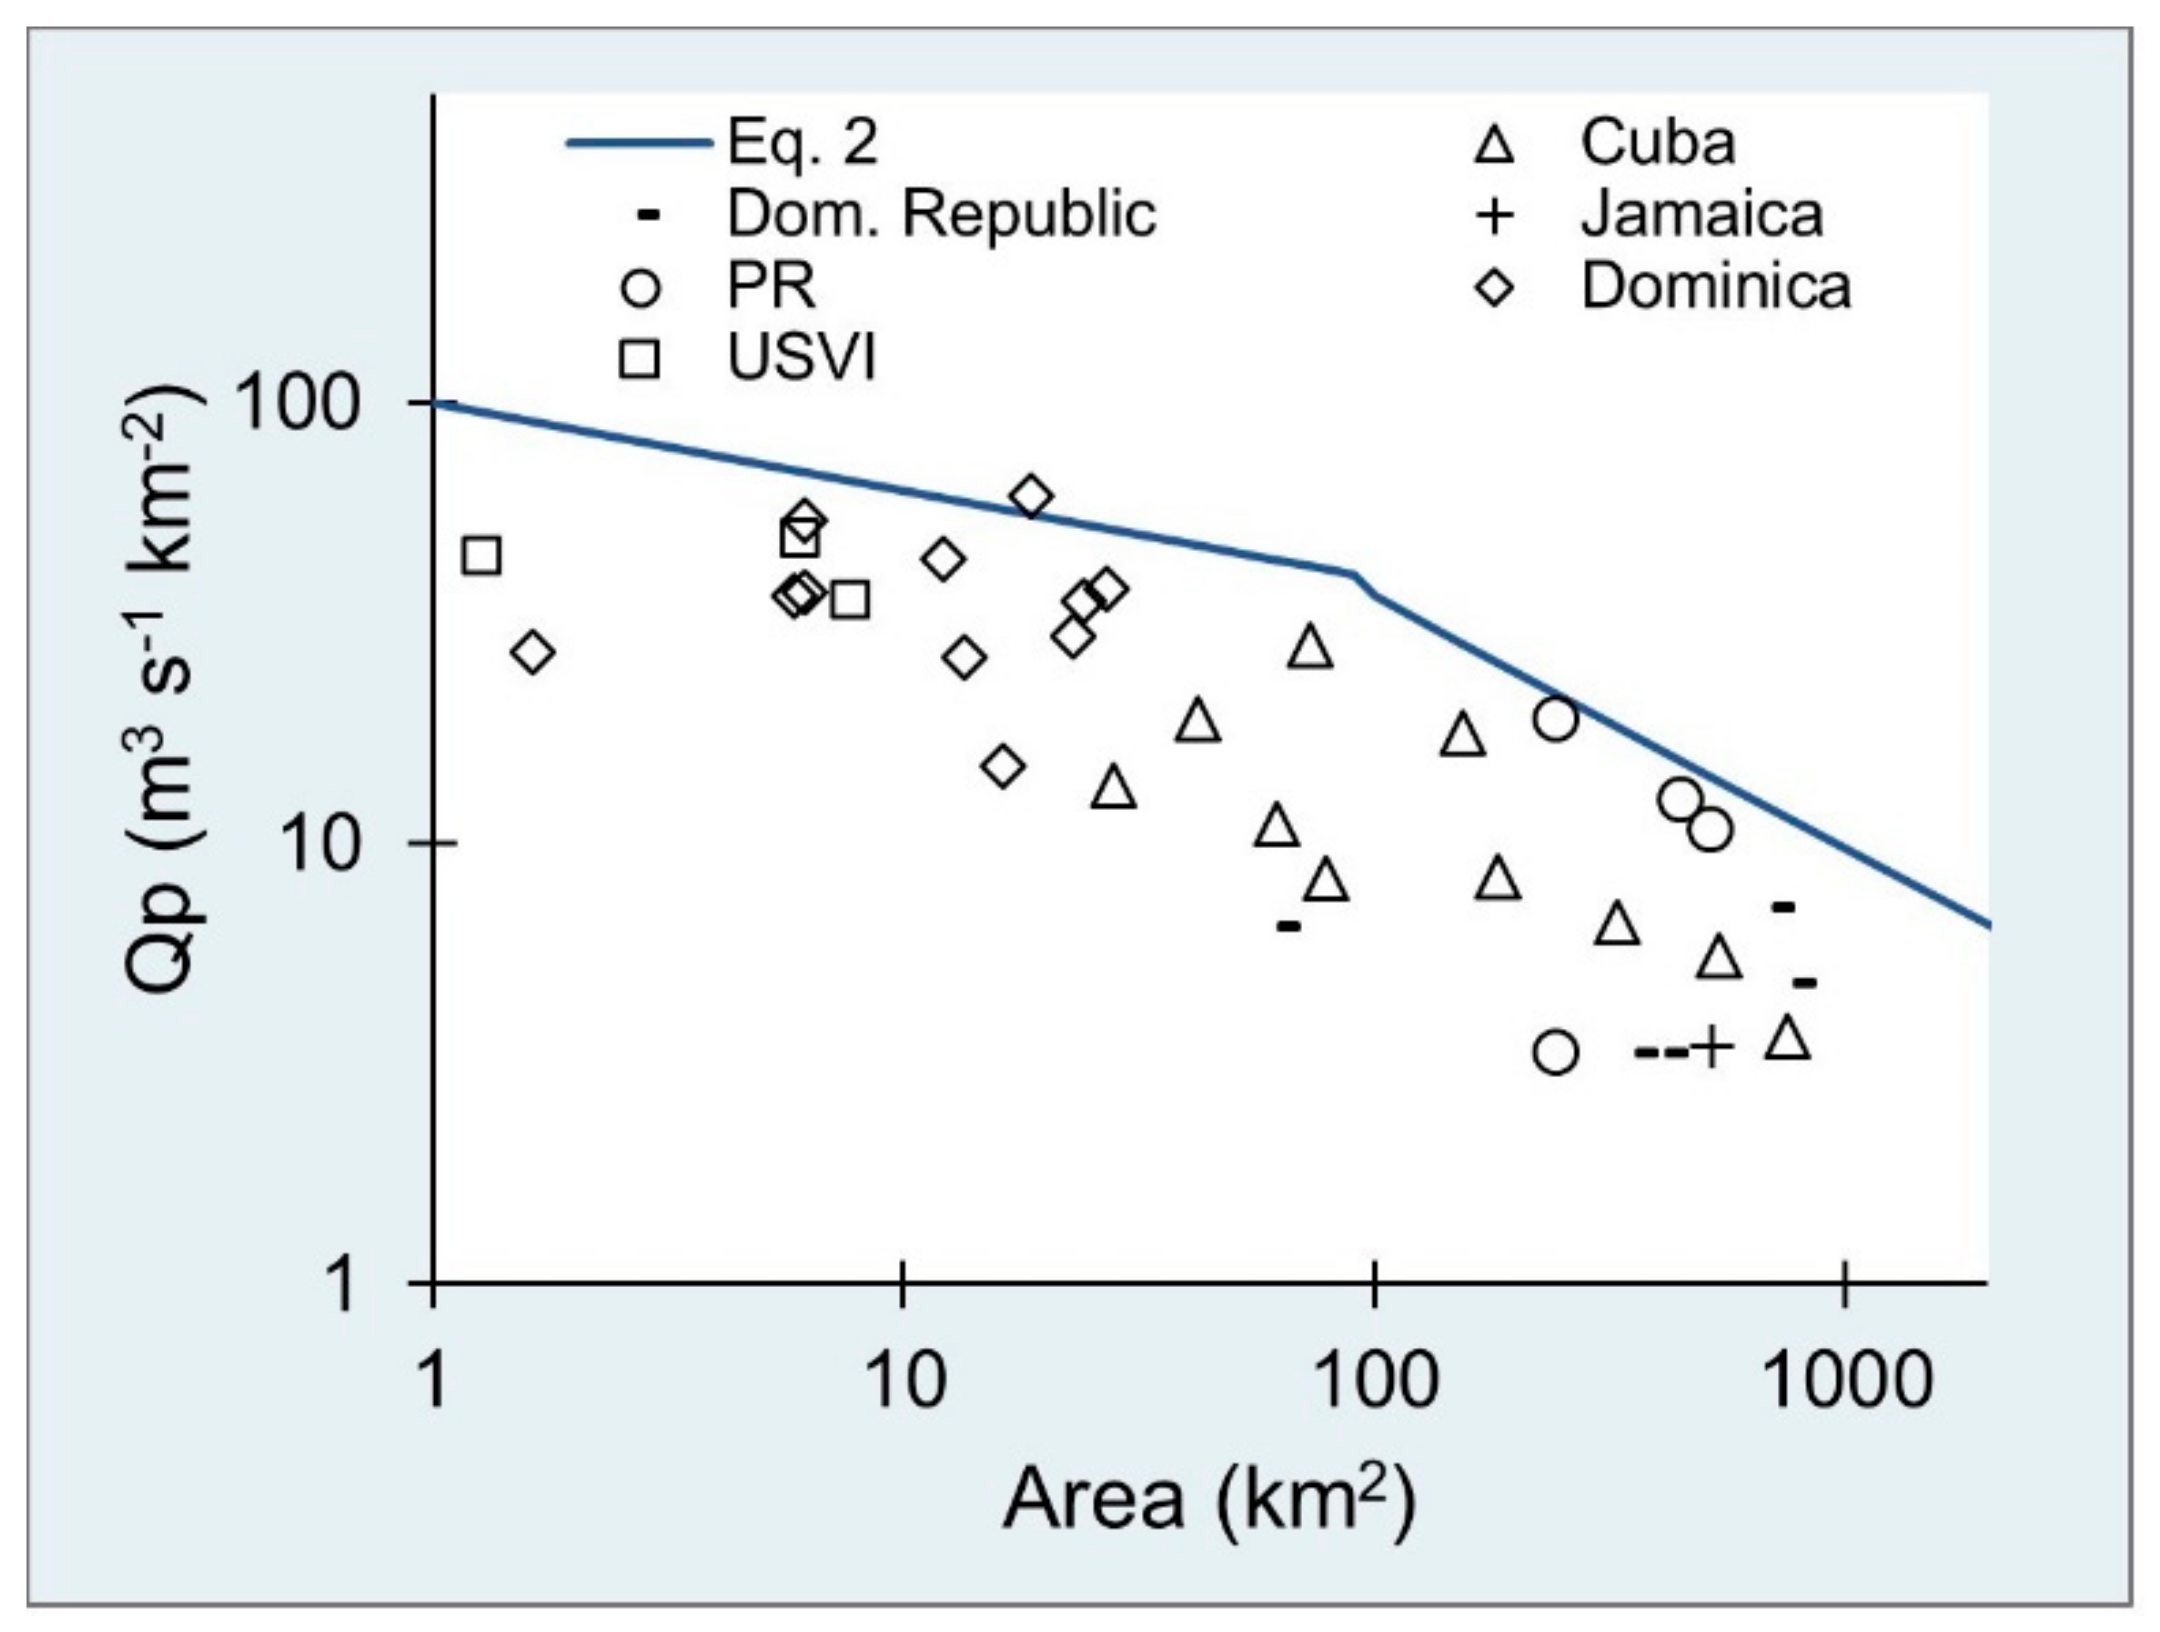
3.2. Worldwide and PR Qpa Envelopes

Linear regression analyses of the world’s Qpa maxima (Figure 4a) led to the following result (Figure 6):
ln Q p a = 4.824 0.336 ln A
The 95% confidence intervals for coefficients a and b were 4.659 to 4.988 and −0.367 to −0.304, respectively. The b coefficient is only slightly greater than both the −0.4 calculated for Europe [28] and the values developed by combining values from the continental U.S., Hawaii, and PR [21] (−0.47 to −0.43). Trends in the data did not justify having separate regression curves for watersheds with drainage areas less and greater than 100 km2 as performed by Herschy [24].
Application of the 95% quantile regression method to the PR database yielded this equation (Figure 6):
ln Q p a = 4.249 0.289 ln A
Resulting a and b coefficients had 95% confidence intervals of 3.908 to 4.589 and from −0.358 to −0.219, respectively. A comparison of the world and PR peak flow envelopes suggest that recorded Qpa values in PR are below the low end of the world envelope for watersheds smaller than ~10 km2 (ln A = ~2.3). This could be in part because only ~5% of PR’s database comes from watersheds smaller than 10 km2 and the likelihood of recording the most extreme conditions is therefore restricted. The PR envelope is closer to the range of the 95% confidence interval of the world envelope for watersheds greater than 10 km2.
A total of 20 Qpa observations for PR are within the 95% confidence interval of the world envelope (Table 3). Out of these, values range from 10.5 to 47.3 m3 s−1 km−2. This subset of observations represents drainage areas ranging from 17.7 to 468 km2 and R 24 h ¯ values from 8.7 to 19 mm h−1. These were recorded during eight different TCs spanning from hurricanes San Ciriaco in 1899 (n = 2) to María in 2017 (n = 4). Other TCs include Donna (n = 3), TD-15 (n = 1), Eloísa (n = 1), Hortense (n = 5), Georges (n = 3), and Hurricane Kyle in 2008 while it was still a tropical depression (n = 1). These flows represent five different NWS zones with individual TCs inducing these extreme Qpas within only one or at most two different zones.

3.3. Qpa and R 24 h ¯ Values by Region

When grouped into the seven NWS forecast regions represented by the PR catalogue, Zones 2 and 4 displayed the highest average Q p a / Q q p a   s i g ratios among all zones. These were followed by Zones 1, 6, and 3, successively (Figure 7a,b). Zones 7 and 9 had the overall lowest values. However, the only statistically significant differences in average Q p a / Q q p a   s i g ratios were between Zone 9 and Zones 2, 3, 4, 6, and 7.
When ranked according to the average R 24 h ¯ , Zones 3 and 4 displayed the highest values followed by Zones 2, 6, and 7 (Figure 7e,f). Statistically significant differences in average R 24 h ¯ occurred only between Zone 9 and Zones 2, 3, 4, 6, and 7. These findings are in general agreement with previous studies that have suggested that higher TC rainfalls are typically experienced in the north–, south–, and central–eastern regions of the island due to the general westward approach of TCs towards the island and the depletion of precipitation potential as the storms move over PR due to the orographic effects of the Sierra de Luquillo, Sierra de Cayey, and the eastern end of the Cordillera Central [34,75]. However, most differences were not statistically significant.
Our findings also confirm the tendency for higher Qpa values to occur in areas with higher average annual precipitation (Figure 7c) [84,95]. However, Zone 9 displayed relatively low average Q p a / Q q p a   s i g values relative to its high annual rainfall. Annual rainfall for this zone is less controlled by TC rainfall than other parts of the island due to the greater relevance of localized convective storms in controlling rainfall patterns in the western parts of PR [73]. In contrast to the spatial pattern of Qpa observations, the highest average R 24 h ¯ values were not consistently found in areas with a higher annual rainfall (Figure 7e–g). The highest average R 24 h ¯ values occurred in Zones 3 and 4. The average R 24 h ¯ in Zones 1 and 9 was relatively low in relation to all other zones.
Observed Q p a / Q q p a   s i g and R 24 h ¯ maximum values in the PR catalogue showed a different spatial pattern than that based on average values, with Zone 6 (i.e., central interior) having the highest overall value. From this perspective, the central western, interior, and eastern zones as well as the southeast regions are the ones that recorded the most intense R 24 h ¯ and the highest Qpa values on the island. The overall highest Q p a / Q q p a   s i g value in our database was registered in the central interior region (Zone 6) at the Río Grande de Manatí at Ciales station during the passing of Hurricane María in 2017 (Table 3). Another notable flow was registered in the southeastern region (Zone 3) during Hurricane Georges at the Río Grande de Patillas near Patillas station. The Río Valenciano, located in the eastern interior region (Zone 4) registered an extreme flow event during the passing of Hurricane Donna. Finally, TC San Ciriaco provoked a very high Qpa at the Río Grande de Arecibo-Dos Bocas dam station (i.e., prior to the establishment of the dam) located in the western interior region (Zone 9). Even though there is a clear propensity for TCs to provoke higher flows in the eastern half of the island than elsewhere, maximum Qpa values that are comparable to the most extreme values reported in the world have occurred within various regions of the island.

3.4. Implications on Flood Management for Puerto Rico

Flood management decisions somewhat rely on the expected frequency of instantaneous peak flows of a given magnitude [105]. This is true in PR where instantaneous peak flows with an expected recurrence interval of 100 years and 500 years are used to define the flood risk areas for the purposes of planning and insurance [106]. Calculating the magnitude of these events depends on the accuracy and completeness of past records [107]. Peak flow recurrence interval equations used to develop advisory information to the Federal Emergency Management Administration and the PR Government after the passing of Hurricanes Irma and María in 2017 [108] were those developed by Ramos-Ginés [95]. These equations presume a higher propensity for larger floods in watershed areas with a higher average annual rainfall and for those with relatively shallower soils. Since the depth-to-rock estimates are unavailable for most watersheds in PR [108], we simply relied on a depth-to-rock value of 111 cm (43.6 inches) as this was the average value of watersheds included in the original report [95]. Converted to Qpa units (m3 s−1 km−2), these equations equal:
ln Q p a   100 ^ = 3.61 0.24 ln A   f o r   R ¯ = 1600   mm   year 1 4.99 0.24 ln A   f o r   R ¯ = 3340   mm   year 1
ln Q p a   500 ^ = 3.89 0.22 ln A   f o r   R ¯ = 1600   mm   year 1 4.26 0.22 ln A   f o r   R ¯ = 3340   mm   year 1
where Q p a   100 ^ and Q p a   500 ^ refer to the 100-year and 500-year predicted area-normalized peak flow rate and R ¯ is the watershed-scale average annual rainfall with the low and high values being representative of relatively dry and wet portions of the island, respectively.
Equations (7) and (8) relied on streamflow data collected only until 1994 (Ramos-Ginés, 1999). Our TC Qpa PR catalogue shows that between 1899 and 1994, there were 24 and 20 observations within the 100-year and 500-year peak flow range, respectively (Figure 8a,b). From 1994 to 2020, there were a total of 45 and 15 TC Qpa observations within and exceeding the 100-year and 500-year range predicted by Equations (7) and (8). These include observations during Hurricanes Hortense (n = 13 and 5 for Qpa 100 and Qpa 500, respectively), Georges (n = 10 and 3), María (n = 10 and 5), and five other TCs (Kyle, Olga, Jeanne, Dean, and Grace; n = 5 and 0). In fact, the highest Qpa values in the entire record for watersheds larger than 100 km2 have all been recorded since 1996. Therefore, the rather recent occurrence of flows with magnitudes matching these extreme recurrence interval values suggest the need for an updated version of these equations as it has been done in parts of the U.S. (e.g., Maurer, et al. [109]). This is particularly needed in PR because localized climate change projections suggest an increase in the frequency of the most extreme rainstorms [43]. In fact, studies claim that these projections already have become a reality as Hurricane María’s intensity while in the vicinity of PR appears to have been enhanced by climate change [110]. The call for an update on PR’s flood frequency curves echoes those that have already been made with regard to rainfall [111].

4. Conclusions

The highest area-normalized instantaneous peak streamflow maxima (Qpa) recorded during tropical cyclones in Puerto Rico from 1899 to 2020 was relatively lower than the world’s maximum envelope for watersheds smaller than 10 km2, yet within its span for those in the 10 to 619 km2 range. The lack of much representation of watersheds < 10 km2 in our catalogue likely led to limited opportunities to measure their most extreme conditions. A total of 20 Qpa values from watersheds in Puerto Rico ranging in drainage areas from 14 to 540 km2 and induced by rainfall during eight different tropical cyclones were within the 95% confidence interval of the world’s peak streamflow envelope. Some tropical cyclones with exceptionally high peak values in Puerto Rico include tropical depressions TD-15 (1970) and the meteorological system that later developed into Hurricane Kyle (2008), tropical storm Eloísa (1975), and Hurricanes San Ciriaco (1899), Donna (1960), Hortense (1996), Georges (1998), and María (2017). Findings presented here support previous studies indicating that higher rainfall and peak streamflow values tend to be recorded near the central-eastern end of Puerto Rico. This is likely due to the predominant westward translation of most cyclones which tends to induce the most copious rainfall on the eastern end of the island as the storm interacts with the island’s topography. However, the overall highest Qpa values in the catalogue were recorded throughout the entire island.
In terms of methods, we showed that quantile regressions hold promise in determining peak flow envelopes. This method is less parsimonious than ordinary least squares because the results of the latter method heavily rely on what observations are included in the regression. Should only the maximum peak flow for every arbitrarily selected watershed area bin be used or should more be included? These concerns are not as relevant in quantile regressions because the method is less sensitive to extreme values. Further work should compare both methods in terms of selection bias (i.e., what observations are included in the analysis) and overall performance in bounding the upper values of peak flow events.
The findings presented here highlight the importance of improving our quantitative understanding of peak flow rates observed in Puerto Rico, as well as throughout the Insular Caribbean. Peak rates observed in islands of the Caribbean have proven to be some of the most extreme values in the world for the size of the islands’ watersheds and are likely to continue to display exceptional values due to projected regional manifestations of global climate change. Some of the most extreme events to have ever been recorded in Puerto Rico have occurred since the last update of the currently used flood frequency curves. Our findings therefore highlight the need for a revision given that these curves represent an essential component of flood hazard management for the island.

Supplementary Materials

The following are available online at https://www.mdpi.com/article/10.3390/hydrology8020084/s1, Table S1: World and Caribbean Qpa Catalogue, Table S2: Puerto Rico Qpa Catalogue.

Author Contributions

Conceptualization, C.E.R.-S.; Methodology, C.E.R.-S. and E.Y.A.; Formal Analysis, C.E.R.-S. and E.Y.A.; Investigation, C.E.R.-S.; Resources, C.E.R.-S. and C.T.G.; Data Curation, C.E.R.-S. and C.T.G.; Writing—Original Draft Preparation, C.E.R.-S.; Writing—Review and Editing, C.E.R.-S., C.T.G. and E.Y.A.; Visualization, C.E.R.-S. and E.Y.A.; Supervision, C.E.R.-S.; Project Administration, C.E.R.-S.; Funding Acquisition, C.T.G. All authors have read and agreed to the published version of the manuscript.

Funding

No external funding was solicited nor required for the completion of this research. Publication fees were covered by an Undergraduate Research Fellowship grant awarded to C. Garnett by the School of Undergraduate Studies at UT-Austin.

Institutional Review Board Statement

Not applicable.

Informed Consent Statement

Not applicable.

Data Availability Statement

Data are contained within the article or Supplementary Materials.

Conflicts of Interest

The authors declare no conflict of interest.

References

  1. Alexander, D. Natural Disasters; Routledge: London, UK, 2020. [Google Scholar]
  2. Smith, K.; Ward, R. Floods: Physical Processes and Human Impacts; John Wiley & Sons: New York, NY, USA, 1998. [Google Scholar]
  3. Adhikari, P.; Hong, Y.; Douglas, K.R.; Kirschbaum, D.B.; Gourley, J.; Adler, R.; Robert Brakenridge, G. A digitized global flood inventory (1998–2008): Compilation and preliminary results. Nat. Hazards 2010, 55, 405–422. [Google Scholar] [CrossRef]
  4. Kron, W.; Berz, G. Flood disasters and climate change, trends and options, a (Re-)Insurer’s view. In Global Change, Enough Water for All? Lozin, H.G.J.L., Hupfer, P., Menzel, L., Schonwiese, C.D., Eds.; University of Hamburg: Hamburg, Germany, 2007; pp. 268–273. [Google Scholar]
  5. Hu, P.; Zhang, Q.; Shi, P.; Chen, B.; Fang, J. Flood-induced mortality across the globe: Spatiotemporal pattern and influencing factors. Sci. Total Environ. 2018, 643, 171–182. [Google Scholar] [CrossRef] [PubMed]
  6. Baradaranshoraka, M.; Pinelli, J.-P.; Gurley, K.; Peng, X.; Zhao, M. Hurricane Wind versus Storm Surge Damage in the Context of a Risk Prediction Model. J. Struct. Eng. 2017, 143, 04017103. [Google Scholar] [CrossRef]
  7. Liao, Z.; Hong, Y.; Kirschbaum, D.; Liu, C. Assessment of shallow landslides from Hurricane Mitch in central America using a physically based model. Environ. Earth Sci. 2012, 66, 1697–1705. [Google Scholar] [CrossRef]
  8. Negri, A.J.; Burkardt, N.; Golden, J.H.; Halverson, J.B.; Huffman, G.J.; Larsen, M.C.; McGinley, J.A.; Updike, R.G.; Verdin, J.P.; Wieczorek, G.F. The hurricane-flood-landslide continuum. Bull. Am. Meteorol. Soc. 2005, 86, 1241–1247. [Google Scholar] [CrossRef]
  9. Rappaport, E.N. Fatalities in the United States from Atlantic Tropical Cyclones: New Data and Interpretation. Bull. Am. Meteorol. Soc. 2014, 95, 341–346. [Google Scholar] [CrossRef]
  10. Geerts, B.; Heymsfield, G.M.; Tian, L.; Halverson, J.B.; Guillory, A.; Mejia, M.I. Hurricane Georges’s Landfall in the Dominican Republic: Detailed Airborne Doppler Radar Imagery. Bull. Am. Meteorol. Soc. 2000, 81, 999–1018. [Google Scholar] [CrossRef] [Green Version]
  11. Lee, C.-S.; Huang, L.-R.; Shen, H.-S.; Wang, S.-T. A climatology model for forecasting typhoon rainfall in Taiwan. Nat. Hazards 2006, 37, 87–105. [Google Scholar] [CrossRef]
  12. Saito, H.; Korup, O.; Uchida, T.; Hayashi, S.; Oguchi, T. Rainfall conditions, typhoon frequency, and contemporary landslide erosion in Japan. Geology 2014, 42, 999–1002. [Google Scholar] [CrossRef] [Green Version]
  13. Whitfield, P.H. Floods in future climates: A review. J. Flood Risk Manag. 2012, 5, 336–365. [Google Scholar] [CrossRef]
  14. Arnell, N.W.; Gosling, S.N. The impacts of climate change on river flood risk at the global scale. Clim. Chang. 2016, 134, 387–401. [Google Scholar] [CrossRef] [Green Version]
  15. Kaenzig, R.; Piguet, E. Migration and climate change in Latin America and the Caribbean. In People on the Move in a Changing Climate; Piguet, E., Laczko, F., Eds.; Spinger: Dordrecht, The Netherlands, 2014; pp. 155–176. [Google Scholar]
  16. Lau, W.K.M.; Zhou, Y.P. Observed recent trends in tropical cyclone rainfall over the North Atlantic and the North Pacific. J. Geophys. Res. Atmos. 2012, 117. [Google Scholar] [CrossRef]
  17. Patricola, C.M.; Wehner, M.F. Anthropogenic influences on major tropical cyclone events. Nature 2018, 563, 339–346. [Google Scholar] [CrossRef] [Green Version]
  18. Kossin, J.P. A global slowdown of tropical-cyclone translation speed. Nature 2018, 558, 104–107. [Google Scholar] [CrossRef]
  19. Wilby, R.L.; Keenan, R. Adapting to flood risk under climate change. Prog. Phys. Geogr. 2012, 36, 348–378. [Google Scholar] [CrossRef]
  20. O’Connor, J.E.; Grant, G.E.; Costa, J.E. The geology and geography of floods. Anc. Floods Mod. Hazards Appl. Paleoflood Hydrol. Water Sci. Appl. Am. Geophys. Union 2002, 5, 359–395. [Google Scholar]
  21. O’Connor, J.E.; Costa, J.E. Spatial distribution of the largest rainfall-runoff floods from basins between 2.6 and 26,000 km2 in the United States and Puerto Rico. Water Resour. Res. 2004, 40, W01107. [Google Scholar] [CrossRef] [Green Version]
  22. Costa, J.E. A comparison of the largest rainfall-runoff floods in the United States with those of the People’s Republic of China and the world. J. Hydrol. 1987, 96, 101–115. [Google Scholar] [CrossRef]
  23. Rakhecha, P. Highest floods in India. Iahs Publ. 2002, 271, 167–172. [Google Scholar]
  24. Herschy, R. World Catalogue of Maximum Observed Floods; Issue 284; IAHS-AISH Publication: Oxfordshire, UK, 2003. [Google Scholar]
  25. Rodier, J.A.; Roche, M. World Catalogue of Maximum Observed Floods; IAHS-AISH Publication: Oxfordshire, UK, 1984; p. 354. [Google Scholar]
  26. Herschy, R. The world’s maximum observed floods. Flow Meas. Instrum. 2002, 13, 231–235. [Google Scholar] [CrossRef]
  27. Castellarin, A. Probabilistic envelope curves for design flood estimation at ungauged sites. Water Resour. Res. 2007, 43. [Google Scholar] [CrossRef]
  28. Gaume, E.; Bain, V.; Bernardara, P.; Newinger, O.; Barbuc, M.; Bateman, A.; Blaškovičová, L.; Blöschl, G.; Borga, M.; Dumitrescu, A. A compilation of data on European flash floods. J. Hydrol. 2009, 367, 70–78. [Google Scholar] [CrossRef] [Green Version]
  29. Pitlick, J. Relation between peak flows, precipitation, and physiography for five mountainous regions in the western USA. J. Hydrol. 1994, 158, 219–240. [Google Scholar] [CrossRef]
  30. Costa, J.E. Hydraulics and basin morphometry of the largest flash floods in the conterminous United States. J. Hydrol. 1987, 93, 313–338. [Google Scholar] [CrossRef]
  31. Ogden, F.L. Evidence of equilibrium peak runoff rates in steep tropical terrain on the island of Dominica during Tropical Storm Erika, August 27, 2015. J. Hydrol. 2016, 542, 35–46. [Google Scholar] [CrossRef] [Green Version]
  32. US-Geological-Survey. National Water Information System Data Available on the World Wide Web; US Geological Survey: Reston, VA, USA, 2021. [CrossRef]
  33. Smith, R.B.; Minder, J.R.; Nugent, A.D.; Storelvmo, T.; Kirshbaum, D.J.; Warren, R.; Lareau, N.; Palany, P.; James, A.; French, J. Orographic precipitation in the tropics: The Dominica Experiment. Bull. Am. Meteorol. Soc. 2012, 93, 1567–1579. [Google Scholar] [CrossRef] [Green Version]
  34. Vélez, A.; Martin-Vide, J.; Royé, D.; Santaella, O. Spatial analysis of daily precipitation concentration in Puerto Rico. Theor. Appl. Climatol. 2019, 136, 1347–1355. [Google Scholar] [CrossRef]
  35. Laing, A.G. Cases of Heavy Precipitation and Flash Floods in the Caribbean during El Niño Winters. J. Hydrometeorol. 2004, 5, 577–594. [Google Scholar] [CrossRef]
  36. Jury, M.R.; Sanchez, D.M. Composite Meteorological Forcing of Puerto Rican Springtime Flood Events. Weather Forecast. 2009, 24, 262–271. [Google Scholar] [CrossRef]
  37. Rasmussen, T. Natural disasters and their macroeconomic implications. In The Caribbean: From Vulnerability to Sustained Growth; International Monetary Fund: Washington, DC, USA, 2006; pp. 181–205. [Google Scholar]
  38. Kossin, J.P.; Camargo, S.J.; Sitkowski, M. Climate Modulation of North Atlantic Hurricane Tracks. J. Clim. 2010, 23, 3057–3076. [Google Scholar] [CrossRef]
  39. Pielke, R.A.; Rubiera, J.; Landsea, C.; Fernández, M.L.; Klein, R. Hurricane Vulnerability in Latin America and The Caribbean: Normalized Damage and Loss Potentials. Nat. Hazards Rev. 2003, 4, 101–114. [Google Scholar] [CrossRef] [Green Version]
  40. López-Marrero, T. An integrative approach to study and promote natural hazards adaptive capacity: A case study of two flood-prone communities in Puerto Rico. Geogr. J. 2010, 176, 150–163. [Google Scholar] [CrossRef]
  41. López-Marrero, T.; Hampton, J.; Vergara, E.; Quiroz, J.; Simovic, K.; Arevalo, H. Hazards and Disasters in the Insular Caribbean: A systematic literature review. Caribb. Geogr 2013, 18, 84–104. [Google Scholar]
  42. Chery, G.; Francis, L.; Hunte, S.-A.; Leon, P. Epidemiology of human leptospirosis in Saint Lucia, 2010–2017. Rev Panam Salud Publica 2020, 44, e160. [Google Scholar] [CrossRef]
  43. Hayhoe, K. Quantifying Key Drivers of Climate Variability and Change for Puerto Rico and the Caribbean: Final Report. 2013, p. 52. Available online: http://www.pr-ccc.org/wp-content/uploads/2014/08/PP_1-52_Hayhoe_Caribbean_Final_Report.pdf (accessed on 31 January 2021).
  44. Khalyani, A.H.; Gould, W.A.; Harmsen, E.; Terando, A.; Quinones, M.; Collazo, J.A. Climate change implications for tropical islands: Interpolating and interpreting statistically downscaled GCM projections for management and planning. J. Appl. Meteorol. Climatol. 2016, 55, 265–282. [Google Scholar] [CrossRef]
  45. Peterson, T.C.; Taylor, M.A.; Demeritte, R.; Duncombe, D.L.; Burton, S.; Thompson, F.; Porter, A.; Mercedes, M.; Villegas, E.; Semexant Fils, R.; et al. Recent changes in climate extremes in the Caribbean region. J. Geophys. Res. Atmos. 2002, 107, ACL 16-1–ACL 16-9. [Google Scholar] [CrossRef]
  46. Taylor, M.A.; Stephenson, T.S.; Chen, A.A.; Stephenson, K.A. Climate change and the Caribbean: Review and response. Caribb. Stud. 2012, 40, 169–200. [Google Scholar] [CrossRef]
  47. Dittmann, R.H. Annual Flood Death Statistics Per State Per Capita for the United States and Puerto Rico during the Period 1959–1991 (NOAA Technical Memorandum NWS SR-153, Issue; National Weather Service: Silver Spring, MD, USA, 1994. [Google Scholar]
  48. Hernández Ayala, J.J.; Matyas, C.J. Tropical cyclone rainfall over Puerto Rico and its relations to environmental and storm-specific factors. Int. J. Climatol. 2016, 36, 2223–2237. [Google Scholar] [CrossRef]
  49. Ramírez, A.; De Jesús-Crespo, R.; Martinó-Cardona, D.M.; Martínez-Rivera, N.; Burgos-Caraballo, S. Urban streams in Puerto Rico: What can we learn from the tropics? J. North Am. Benthol. Soc. 2009, 28, 1070–1079. [Google Scholar] [CrossRef]
  50. Scatena, F.; Larsen, M.C. Physical aspects of hurricane Hugo in Puerto Rico. Biotropica 1991, 317–323. [Google Scholar] [CrossRef] [Green Version]
  51. Schellekens, J.; Scatena, F.N.; Bruijnzeel, L.A.; van Dijk, A.I.J.M.; Groen, M.M.A.; van Hogezand, R.J.P. Stormflow generation in a small rainforest catchment in the Luquillo Experimental Forest, Puerto Rico. Hydrol. Process. 2004, 18, 505–530. [Google Scholar] [CrossRef]
  52. Ahmad, R.; Scatena, F.; Gupta, A. Morphology and sedimentation in Caribbean montane streams: Examples from Jamaica and Puerto Rico. Sediment. Geol. 1993, 85, 157–169. [Google Scholar] [CrossRef]
  53. Pike, A.S.; Scatena, F.N.; Wohl, E.E. Lithological and fluvial controls on the geomorphology of tropical montane stream channels in Puerto Rico. Earth Surf. Process. Landf. 2010, 35, 1402–1417. [Google Scholar] [CrossRef]
  54. Staes, C.; Orengo, J.C.; Malilay, J.; Rullán, J.; Noji, E. Deaths due to flash floods in Puerto Rico, January 1992: Implications for prevention. Int. J. Epidemiol. 1994, 23, 968–975. [Google Scholar] [CrossRef]
  55. Torres-Sierra, H. Flood of January 5–6, 1992, in Puerto Rico; US Department of the Interior: Washington, DC, USA; U.S. Geological Survey: Reston, VA, USA, 1996.
  56. Palm, R.; Hodgson, M.E. Natural Hazards in Puerto Rico. Geogr. Rev. 1993, 280–289. [Google Scholar] [CrossRef] [Green Version]
  57. Torres Molina, L.E. Floods Forecast in the Caribbean. In Flood Risk Management; InTech: London, UK, 2017; pp. 55–77. [Google Scholar]
  58. Smith, J.A.; Sturdevant-Rees, P.; Baeck, M.L.; Larsen, M.C. Tropical cyclones and the flood hydrology of Puerto Rico. Water Resour. Res. 2005, 41. [Google Scholar] [CrossRef]
  59. Hernández Ayala, J.J.; Keellings, D.; Waylen, P.R.; Matyas, C.J. Extreme floods and their relationship with tropical cyclones in Puerto Rico. Hydrol. Sci. J. 2017, 62, 2103–2119. [Google Scholar] [CrossRef] [Green Version]
  60. Terry, J.P.; Kostaschuk, R.A.; Wotling, G. Features of tropical cyclone-induced flood peaks on Grande Terre, New Caledonia. Water Environ. J. 2008, 22, 177–183. [Google Scholar] [CrossRef]
  61. Byrne Sr, M.J. Monitoring Storm Tide, Flooding, and Precipitation from Hurricane Maria in Puerto Rico and the US Virgin Islands, September 2017; Open-File Report 2331-1258; US Geological Survey: Reston, VA, USA, 2019.
  62. Li, Y.; Wright, D.B.; Byrne, P.K. The Influence of tropical cyclones on the evolution of river conveyance capacity in Puerto Rico. Water Resour. Res. 2020, 56, e2020WR027971. [Google Scholar] [CrossRef]
  63. Monroe, W.H. Some Tropical Landforms of Puerto Rico; Professional Paper 1159; US Geological Survey: Reston, VA, USA, 1980.
  64. Ewel, J.J.; Whitmore, J.L. The Ecological Life Zones of Puerto Rico and the U.S. Virgin Islands; Research Paper, Issue; United States Department of Agriculture: Washington, DC, USA, 1973.
  65. Bawiec, W.J. Geologic Terranes of Puerto Rico; U.S. Geological Survey: Reston, VA, USA, 1998; pp. 59–71.
  66. Soto, S.; Pintó, J. Delineation of natural landscape units for Puerto Rico. Appl. Geogr. 2010, 30, 720–730. [Google Scholar] [CrossRef]
  67. Parés-Ramos, I.K.; Gould, W.A.; Aide, T.M. Agricultural abandonment, suburban growth, and forest expansion in Puerto Rico between 1991 and 2000. Ecol. Soc. 2008, 13. [Google Scholar] [CrossRef] [Green Version]
  68. Helmer, E.; Ramos, O.; López, T.d.M.; Quinones, M.; Diaz, W. Mapping the forest type and land cover of Puerto Rico, a component of the Caribbean biodiversity hotspot. Caribb. J. Sci. 2002, 38, 165–183. [Google Scholar]
  69. Grau, H.R.; Aide, T.M.; Zimmerman, J.K.; Thomlinson, J.R.; Helmer, E.; Zou, X. The ecological consequences of socioeconomic and land-use changes in postagriculture Puerto Rico. BioScience 2003, 53, 1159–1168. [Google Scholar] [CrossRef]
  70. Rudel, T.K.; Perez-Lugo, M.; Zichal, H. When fields revert to forest: Development and spontaneous reforestation in post-war Puerto Rico. Prof. Geogr. 2000, 52, 386–397. [Google Scholar] [CrossRef]
  71. Gould, W.A.; Alarcón, C.; Fevold, B.; Jiménez, M.E.; Martinuzzi, S.; Potts, G.; Quiñones, M.; Solórzano, M.; Ventosa, E. The Puerto Rico Gap Analysis Project Volume 1: Land Cover, Vertebrate Species Distributions, and Land Stewardship; General Technical Report. IITF-39, 1; United States Department of Agriculture: Washington, DC, USA, 2008.
  72. Jury, M.; Malmgren, B.A.; Winter, A. Subregional precipitation climate of the Caribbean and relationships with ENSO and NAO. J. Geophys. Res. Atmos. 2007, 112. [Google Scholar] [CrossRef]
  73. Hosannah, N.; González, J.; Lunger, C.; Niyogi, D. Impacts of local convective processes on rain on the Caribbean Island of Puerto Rico. J. Geophys. Res. Atmos. 2019, 124, 6009–6026. [Google Scholar] [CrossRef] [Green Version]
  74. Méndez-Lázaro, P.A.; Nieves-Santiango, A.; Miranda-Bermúdez, J. Trends in total rainfall, heavy rain events, and number of dry days in San Juan, Puerto Rico, 1955-2009. Ecol. Soc. 2014, 19. [Google Scholar] [CrossRef] [Green Version]
  75. Hernández Ayala, J.J.; Matyas, C.J. Spatial distribution of tropical cyclone rainfall and its contribution to the climatology of Puerto Rico. Phys. Geogr. 2018, 39, 1–20. [Google Scholar] [CrossRef]
  76. Thomas, M.A.; Mirus, B.B.; Smith, J.B. Hillslopes in humid-tropical climates aren’t always wet: Implications for hydrologic response and landslide initiation in Puerto Rico. Hydrol. Process. 2020, 34, 4307–4318. [Google Scholar] [CrossRef]
  77. Schellekens, J. The interception and runoff generating processes in the Bisley catchment, Luquillo Experimental Forest, Puerto Rico. Phys. Chem. Earthpart B Hydrol. Ocean. Atmos. 2000, 25, 659–664. [Google Scholar] [CrossRef]
  78. Ramos-Scharrón, C.E.; Thomaz, E.L. Runoff development and soil erosion in a wet tropical montane setting under coffee cultivation. Land Degrad. Dev. 2017, 28, 936–945. [Google Scholar] [CrossRef]
  79. Birkinshaw, S.J.; Bathurst, J.C.; Iroumé, A.; Palacios, H. The effect of forest cover on peak flow and sediment discharge—an integrated field and modelling study in central–southern Chile. Hydrol. Process. 2011, 25, 1284–1297. [Google Scholar] [CrossRef]
  80. Beschta, R.; Pyles, M.; Skaugset, A.; Surfleet, C. Peakflow responses to forest practices in the western cascades of Oregon, USA. J. Hydrol. 2000, 233, 102–120. [Google Scholar] [CrossRef] [Green Version]
  81. Harmsen, E.W.; Goyal, M.R.; Torres-Justiniano, S. Estimating evapotranspiration in Puerto Rico. J. Agric. Univ. Puerto Rico 2002, 86, 35–54. [Google Scholar] [CrossRef]
  82. Ramos-Scharrón, C.E.; Arima, E. Hurricane Maria’s Precipitation Signature in Puerto Rico: A Conceivable Presage of Rains to Come. Sci. Rep. 2019, 9, 15612. [Google Scholar] [CrossRef]
  83. López, M.A.; Fields, F.K. A Proposed Streamflow-Data Program for Puerto Rico; Caribbean District, Open File Report, Issue; US Geological Survey: Reston, VA, USA, 1970.
  84. López, M.A.; Colón-Dieppa, E.; Cobb, E.D. Floods in Puerto Rico, Magnitude and Frequency; Issue 78–141; US Geological Survey, Water Resources Investigations: Reston, VA, USA, 1979.
  85. Haire, W.J. Flood of October 5–10, 1970 in Puerto Rico; Water-Resources Bulletin, Issue; National Weather Service: Silver Spring, MD, USA, 1972. [Google Scholar]
  86. Barnes, H.H.; Bogart, D.B. Floods of September 6, 1960, in Eastern Puerto Rico; US Government Printing Office: Washington, DC, USA, 1961; Volume 451.
  87. Turnipseed, D.P.; Sauer, V.B. Discharge Measurements at Gaging Stations; US Geological Survey, Chapter 8 of Book 3, Section A, Techniques and Methods 3; US Geological Survey: Reston, VA, USA, 2010; p. 87.
  88. Dalrymple, T.; Benson, M. Measurement of Peak Discharge by the Slope-Area Method; US Geological Survey: Reston, VA, USA, 1968.
  89. Jarrett, R.D. Errors in slope-area computations of peak discharges in mountain streams. J. Hydrol. 1987, 96, 53–67. [Google Scholar] [CrossRef]
  90. Cook, J.L. Quantifying peak discharges for historical floods. J. Hydrol. 1987, 96, 29–40. [Google Scholar] [CrossRef]
  91. Li, C.; Wang, G.; Li, R. Maximum observed floods in China. Hydrol. Sci. J. 2013, 58, 728–735. [Google Scholar] [CrossRef]
  92. Cameron, A.C.; Trivedi, P.K. Microeconometrics: Methods and Applications; Cambridge University Press: Cambridge, UK, 2005. [Google Scholar]
  93. Wooldridge, J.M. Econometric Analysis of Cross Section and Panel Data; MIT Press: Cambridge, MA, USA, 2010. [Google Scholar]
  94. Waldmann, E. Quantile regression: A short story on how and why. Stat. Model. 2018, 18, 203–218. [Google Scholar] [CrossRef]
  95. Ramos-Ginés, O. Estimation of magnitude and frequency of floods for streams in Puerto Rico: New empirical models. Water Resour. Investig. Rep. 1999, 99, 4142. [Google Scholar]
  96. Daly, C.; Helmer, E.H.; Quiñones, M. Mapping the climate of Puerto Rico, Vieques, and Culebra. Int. J. Climatol. A J. R. Meteorol. Soc. 2003, 23, 1359–1381. [Google Scholar] [CrossRef]
  97. Carter, M.; Elsner, J. A statistical method for forecasting rainfall over Puerto Rico. Weather Forecast. 1997, 12, 515–525. [Google Scholar] [CrossRef] [Green Version]
  98. Carter, M.M.; Elsner, J. Convective rainfall regions of Puerto Rico. Int. J. Climatol. A J. R. Meteorol. Soc. 1996, 16, 1033–1043. [Google Scholar] [CrossRef]
  99. Malmgren, B.A.; Winter, A. Climate zonation in Puerto Rico based on principal components analysis and an artificial neural network. J. Clim. 1999, 12, 977–985. [Google Scholar] [CrossRef]
  100. National-Weather-Service. Public geographic areas of responsibility. In National Weather Service Manual 10-507; Department of Commerce, National Oceanic & Atmospheric Administration: Washington, DC, USA, 2018. [Google Scholar]
  101. López-Trujillo, D. Real Time Flood Alert System (RTFAS) for Puerto Rico; US Department of the Interior, US Geological Survey: Reston, VA, USA, 2010.
  102. Zar, J.H. Biostatistical Analysis; Pearson Education India: Delhi, India, 1999. [Google Scholar]
  103. Soler-López, L.R.; Gómez-Gómez, F. Sedimentation Survey of Lago Loíza, Puerto Rico, January 2004; Scientific Investigations Report, 2005-5239; US Department of the Interior: Washington, DC, USA; U.S. Geological Survey: Reston, VA, USA, 2005.
  104. Gellis, A.C.; Webb, R.M.; McIntyre, S.C.; Wolfe, W.J. Land-use effects on erosion, sediment yields, and reservoir sedimentation: A case study in the Lago Loiza basin, Puerto Rico. Phys. Geogr. 2006, 27, 39–69. [Google Scholar] [CrossRef]
  105. Pralle, S. Drawing lines: FEMA and the politics of mapping flood zones. Clim. Chang. 2019, 152, 227–237. [Google Scholar] [CrossRef]
  106. FEMA. Mitigation Assessment Team Report—Hurricanes Irma and Maria in Puerto Rico, Building Performance Observations, Recommendations, and Technical Guidance; FEMA P-2020: Washington, DC, USA, 2018. [Google Scholar]
  107. England, J.F., Jr.; Cohn, T.A.; Faber, B.A.; Stedinger, J.R.; Thomas, W.O., Jr.; Veilleux, A.G.; Kiang, J.E.; Mason, R.R., Jr. Guidelines for Determining Flood Flow Frequency—Bulletin 17C (1411342232); US Geological Survey: Reston, VA, USA, 2019.
  108. STARR-II. Puerto Rico Advisory Data and Products Post-Hurricanes Irma and Maria; FEMA Contract No. HSFE60-15-D-0005. 2018; p. 109. Available online: http://cedd.pr.gov/fema/wp-content/uploads/2018/06/Puerto_Rico_Advisory_Report_2018.05.23_Final_English.pdf (accessed on 31 March 2021).
  109. Maurer, E.P.; Kayser, G.; Doyle, L.; Wood, A.W. Adjusting flood peak frequency changes to account for climate change impacts in the western United States. J. Water Resour. Plan. Manag. 2018, 144, 05017025. [Google Scholar] [CrossRef]
  110. Lim, Y.-K.; Schubert, S.D.; Kovach, R.; Molod, A.M.; Pawson, S. The roles of climate change and climate variability in the 2017 Atlantic hurricane season. Sci. Rep. 2018, 8, 1–10. [Google Scholar] [CrossRef]
  111. Keellings, D.; Ayala, J.J.H. Extreme rainfall associated with Hurricane Maria over Puerto Rico and its connections to climate variability and change. Geophys. Res. Lett. 2019, 46, 2964–2973. [Google Scholar] [CrossRef]
Figure 1. Relationship between area-normalized peak flow (Qpa) and watershed drainage area (Area) according to the world envelope defined by Equation (2) [24] and for a selection of values from the Insular Caribbean. Values for Cuba, the Dominican Republic, Jamaica, and Puerto Rico (PR) are included in Herschy’s (2003) catalogue. Values for Dominica are reported in Ogden [31] and those for the U.S. Virgin Islands (USVI) are from the U.S. Geological Survey’s online database [32].
Hydrology 08 00084 g001
Figure 2. Relief map of Puerto Rico displaying the location of the main physiographic regions of the island including the Cordillera Central, the Sierra de Cayey, the Caguas Valley, and the Sierra de Luquillo. Map also shows the location of 95 out of the 167 stream gauging stations used to develop the Puerto Rico tropical cyclone instantaneous peak streamflow catalogue.
Hydrology 08 00084 g002
Figure 3. (a) Map showing the average annual precipitation for Puerto Rico in mm year−1. (b) Map showing the eleven National Weather Service forecast zones for Puerto Rico (https://www.weather.gov/gis/PublicZones (accessed on 31 March 2021)). (c) Average annual rainfall of each of the eleven NWS forecast zones and standard errors as error bars.
Hydrology 08 00084 g003
Figure 4. (a) Relationship between drainage area and area-normalized instantaneous peak streamflow (Qpa) for the world envelope (n = 83), the Puerto Rico catalogue (n = 1922), and the criteria used to identify exceptional flows (Equation (3b)). (b) Relationship between drainage area and average daily rainfall intensity ( R 24 h ¯ ) within drainage areas represented by instantaneous peak flow rates (n = 1904). Dashed line represents the value used to identify exceptional average rain intensities (2.8 mm h−1).
Hydrology 08 00084 g004
Figure 5. (a) The proportion of the number of instantaneous peak flow observations in the Puerto Rico catalogue (Qpa) that exceeded the criteria established by Equation (3b) for exceptional flows (Qpa sig) for the top fifteen ranked tropical cyclones. (b) Average Q p a / Q q p a   s i g ratios for the fifteen tropical cyclones with the highest values (error bars indicate standard errors). (c) The proportion of the number of average daily rainfall rates ( R 24 h ¯ ) exceeding 2.8 mm h−1 for the top fifteen ranked tropical cyclones. (d) Average R 24 h ¯ for the fifteen tropical cyclones with the highest values (error bars represent standard errors).
Hydrology 08 00084 g005
Figure 6. (a) The world envelope regression results (Equation (5)) and its 95% confidence interval. (b) The Puerto Rico instantaneous peak flow regression results based on 95% quantile regression (Equation (6)) and its 95% confidence interval. (c) The world and Puerto Rico peak flow envelopes (Equations (5) and (6)).
Hydrology 08 00084 g006
Figure 7. (a) Box-plot of the ratio of instantaneous peak flows to the critical peak flow value (Equation (3b)) ( Q p a / Q q p a   s i g ) for the seven National Weather Service (NWS) zones represented in the catalogue (the ‘X’ is the mean, the line inside the box is the median, box tops and bottoms are the 25th and 75th quartiles, respectively, error bars are the quartiles ±1.5 the interquartile range, and points are outliers). (b) Map-based representation of the average Q p a / Q q p a   s i g ratios per zone. (c) Relationship between average annual rainfall and average Q p a / Q q p a   s i g ratios per zone. (d) A map-based representation of the maximum Q p a / Q q p a   s i g . (e) Box-plot of average daily rainfall rates ( R 24 h ¯ ) for the seven NWS zones. (f) A map-based representation of the average R 24 h ¯ per zone. (g) Relationship between the average annual rainfall and the average R 24 h ¯ per zone. (h) A map-based representation of the maximum R 24 h ¯ per zone.
Hydrology 08 00084 g007
Figure 8. (a) Relationship between the drainage area and area-normalized instantaneous peak streamflow (Qpa) for the 100-year flow estimate (Qpa 100) for both dry and wet areas of Puerto Rico based on Equation (7) [95] and individual Qpa observations within the range of values contained within the range of Qpa 100 estimates. (b) Relationship between drainage area and area-normalized instantaneous peak streamflow for the 500-year peak flow estimate (Qpa 500) for both dry and wet areas of Puerto Rico based on Equation (8) [95] and individual Qpa observations within or exceeding the range of Qpa 500 estimates.
Hydrology 08 00084 g008
Table 1. Summary of the instantaneous peak flow catalogue for Puerto Rico by tropical cyclone.
TC NameYearArea Range (km2)# Qpa ValuesRange of Qpa Values
(m3 s−1 km−2)
#   R 24 h ¯ Values Range   of   R 24 h ¯ Values   ( mm   h 1 )
San Ciriaco189948.2–54098.2–20.698.7–18.6
San Felipe II192853.9–54094.3–15.892.0–10.9
San Ciprián193253.9–42938.8–14.734.0–7.1
Santa Clara195639.9–34731.8–6.534.3–6.6
Donna19602.0–619390.57–45.8342.0–12.5
TD-1519701.4–540800.56–39.1733.1–17.6
Eloisa19755.9–540420.99–30.8423.2–16.2
David19797.1–540401.0–16.0403.7–9.1
Fredric197912.2–540150.28–11.0150.9–9.3
Debbie198213.9–358121.0–16.7121.8–9.9
Isabel19850.2–540441.4–38.8424.6–16.3
Emily1987113–54060.006–0.160.3–0.8
Hugo19890.2–540350.01–32.6341.8–8.4
Cindy19933.3–540380.007–1.7380.4–2.3
Luis19953.3–540400.0004–5.1401.0–2.6
Marilyn19953.3–540450.013–4.0441.8–4.6
Hortense19960.1–540660.15–80.4652.5–13.3
Grace19972.1–540520.014–16.7521.4–6.3
Georges19980.1–540580.57–82.2577.2–18.9
Lenny19992.1–540570.006–7.5571.0–5.8
Jose19993.3–540470.007–2.2470.5–2.6
Debby20002.1–540570.06–17.3571.6–9.6
Dean20011.2–540500.003–22.0500.9–7.4
Mindy20031.2–540570.05–9.1571.3–3.9
Odette20031.2–540550.04–12.6551.0–3.5
Frances20041.2–540580.003–2.5580.4–1.8
Jeanne20040.1–540620.13–32.8622.5–10.3
Chris20061.2–540570.002–2.3570.02–1.6
Noel20071.2–540600.019–24.5601.0–7.0
Olga20071.2–540590.028–21.8591.6–5.9
Fay20081.2–540560.0001–2.6561.1–3.1
Kyle20081.2–540590.12–47.3591.2–16.9
Erika20093.3–540570.01–5.2570.30–2.5
Earl 20101.2–540550.06–5.5551.3–4.0
Otto20101.2–540570.06–8.0572.0–10.5
Irene20110.1–540610.23–18.7611.8–11.3
Erika20151.2–540610.0001–3.5610.2–2.5
Irma20171.2–540620.31–10.8621.7–7.0
Maria20171.2–540670.81–29.6677.7–19.0
Isaias20201.2–540660.005–10.8662.7–8.6
Laura20201.2–540660.005–5.9660.02–0.6
Table 2. Summary of the instantaneous peak flow catalogue for Puerto Rico by National Weather Service forecast zone.
NWS Zone# Qpa Values #   R 24 h ¯   Values Area Range (km2)
1404019.4–186
22402370.1–45.6
31641623.8–94.8
46136081.2–619
63593571.4–429
72172121.4–118
92892888.2–524
Table 3. A compilation of area-normalized instantaneous peak flow values for Puerto Rico that lie within the world envelope’s 95% confidence interval (Equation (5)).
TCYearStation NameStation IDArea (km2)NWS ZoneQpa
(m3 s−1 km−2)
R 24 h ¯ ( mm   h 1 )
San Ciriaco1899RG Arecibo at Dos Bocas Dam50027100438915.718.6
San Ciriaco1899RG Arecibo at Cambalache50029000524910.514.8
Donna1960R Turabo near La Plaza5005300017.7438.411.0
Donna1960R Valenciano near las Piedras5005600017.8445.88.5
Donna1960R Humacao at HumacaoNone25.9234.5--
TD-151970R Turabo near La Plaza5005300017.7438.412.6
Eloisa1975R Blanco at Florida5007550028.5230.88.6
Hortense1996RG Manatí at Manatí50038100429613.19.7
Hortense1996R de La Plata below La Plata Dam50045010468411.99.5
Hortense1996RG Loíza at Quebrada Arenas5005090015.5438.410.6
Hortense1996RG Loíza at 183 San Lorenzo5005180064.7424.911.5
Hortense1996RG Loíza below dam50059050540411.712.5
Georges1998RG Loíza at Quebrada Arenas5005090015.5438.410.1
Georges1998RG de Patillas near Patillas5009200047.4333.67.8
Georges1998RG Añasco near San Sebastián50144000358912.814.9
Kyle2008R Maunabo at Lizas5009050013.9347.316.1
Maria2017RG Manatí near Morovis50031200143618.719.0
Maria2017RG Manatí at Ciales50035000347623.218.2
Maria2017RG Manatí at Manatí50038100429612.918.3
Maria2017RG Añasco near San Sebastián50144000358914.68.7
Publisher’s Note: MDPI stays neutral with regard to jurisdictional claims in published maps and institutional affiliations.

