
Smart Farming Tool for Monitoring Nutrients in Soil and Plants for Precise Fertilization


1
Department of Agriculture and Food Sciences, University of Bologna, Viale G. Fanin, 46, 40127 Bologna, Italy
2
IBF Servizi Agronica Spa, Via Cavicchini, 2, 44037 Jolanda di Savoia (FE), Italy
*
Author to whom correspondence should be addressed.
Horticulturae 2023, 9(9), 1011; https://doi.org/10.3390/horticulturae9091011
Submission received: 10 August 2023
/
Revised: 4 September 2023
/
Accepted: 6 September 2023
/
Published: 8 September 2023
(This article belongs to the Special Issue Sustainable Strategies and Practices for Soil Fertility Management)
Abstract
:The current political, social, and economic conditions place, more than ever, the need to sustainably supply nutrients for plants, integrating low-impact, crop-adapted, variable-rate-application fertilizer solutions, at the center of attention. Fertilization plans should be based on the monitoring of soil fertility to address the proper rate of fertilizer application along with the development of techniques able to increase nutrient uptake efficiency. Monitoring and modelling analysis of the effects of agronomic management in different pedoclimatic conditions can provide several advantages, that include higher nutrient efficiency, increase in plant growth and yield, decreased fertilization costs, increased profit, reduced environmental impact. This approach should enter into a framework of precision farming methodologies for the distribution of nutrients adopted at different levels (region, farm, field, plot), to obtain the maximum efficiency of inputs.
1. Overview on Precision Agriculture
Precision agriculture (PA) or ‘smart agriculture’, defined as ‘a management strategy that gathers, processes and analyzes temporal, spatial and individual data and combines it with other information to support management decisions according to estimated variability for improved resource use efficiency, productivity, quality, profitability and sustainability of agricultural production’ [1], is required in order to decrease chemical input and improve plant yield. In other words, PA consists of the use of technologies able to manage field spatial and temporal variability, in order to optimize crop performance and environmental health [2]. The introduction of PA techniques through the monitoring of soil and plant conditions will improve fertilizer use efficiency, maximize farming profit, and reduce the potential for pollution. Precision agriculture offers innovative solutions for improving crop production; however, it requires reliable tools able to provide correct, real-time information on soil nutrient availability and plant nutritional status along with the possibility to build up a site-specific database of the relationships between plant and soil [3].
The agricultural sector plays a key role in the Italian and European economies due to the extension of cultivated area and to the importance of agri-food supply chains. For this reason, strategic support of the sector with the use of approaches and methods able to meet the new Common Agricultural Policy (CAP) objectives is fundamental. Examples of CAP objectives include ensuring adequate income for farmers, increasing company competitiveness, climate change adaptation and mitigation, landscape protection, biodiversity conservation, development of rural areas, knowledge transfer, innovation promotion, and efficient management of production factors. Thus, agricultural companies must rely on management strategies based on a solid knowledge of agroecosystem and the possible interactions between its components. Even though the first implementations of PA practices were developed for arable and dairy farming, these technologies can also be applied to other sectors like vegetable or fruit production, that, despite their small scales, have high economical value. The use of PA in small-scale farming could also be a valuable strategy to reduce costs (less use of resources) and reduce environmental damage.
This is useful in developing agronomic management practices more sustainable in terms of economic profitability and environmental protection. Scientific and technological progress that has occurred in the last few decades has produced innovative tools and instruments that are now available on the market. These novel tools can be implemented in productive processes to increase efficiency and sustainability, yet they must be placed in a context of the respectful management of agroecosystems and their related components (soil, plants, and atmosphere). In this scenario, PA represents an effective strategy to pursue these goals, thanks to the use of multi-source data on soil fertility and plants’ nutritional status.
The most important pillar of PA is the study of spatial variability, which is the attitude of a specific parameter being subject to change depending on time or space (i.e., plant vigor, crop yield, soil texture, soil chemical characteristics, etc.). By monitoring and studying the evolution of the selected variables, it is possible to identify areas with homogeneous characteristics, called Management Unit Zones (MUZ). These areas represent the base units for site-specific agronomic management, namely sowing, irrigation, fertilization, and crop protection against weeds and diseases.
One of the most important agronomic practices is fertilization, as it greatly affects productivity and costs in cropping systems. For instance, in the US, fertilizers account for 36% of farmers’ production costs for corn and 35% for wheat. The intensification of agricultural production has led to a dramatic increase in inputs [4] like nitrogen (N)-based fertilizers, whose use, from 2002 to 2017, increased worldwide from 83 Mt to 109 Mt [5]. Although nutrients are fundamental to optimizing yields, their excessive use can cause water and air contamination. The EU has launched several directives in order to reduce water pollution connected to N use in agriculture (EC-Council Directive, 1991) that have led to the stabilization of N consumption at around 11 Mt yr−1. Commonly, conventional fertilization strategies consider the uniform distribution of fertilizer without considering the complexity of soil-plant-atmosphere interactions. Instead, according to numerous scientific studies, these interactions can greatly affect the availability of macro- and micronutrients. For this reason, rational crop nutrition strategies must consider such aspects. This is possible by studying the spatial and temporal variability of each section of a field, considering all physical, chemical, and biological processes occurring during a crop cycle. An example of soil-plant-atmosphere interaction involves N, which is the most important nutrient in plants along with phosphorus (P) and potassium (K). For instance, N is very dynamic in the agroecosystem because it is subjected to several phenomena like leaching, runoff, volatilization, and ammonification, which make the element unavailable for plant uptake [6]. Such phenomena are affected by several factors like soil texture, organic matter (OM) content, pH, soil temperature, air temperature, precipitation, crop genotype, and crop vigor. All these factors act alone and also in conjunction with each other. Hence, it- is difficult to determine to what extent they affect the N cycle in quantitative terms. The same consideration can also be made for other nutrients and their dynamics in the soil-plant-atmosphere system. In this regard, the tools and technologies utilized in PA could be a solution to the issues mentioned above, thanks to innovative methods for monitoring and collecting crop data.
2. Field Monitoring
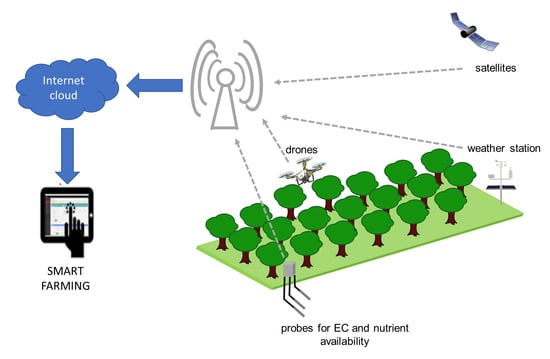
Field monitoring is the measurement of specific parameters affecting the soil-plant-atmosphere system as a function of crop development during the biological cycle. Regarding soil, the use of suitable tools to rapidly identify and measure the main properties linked to crop development is a strategic key. Some examples include OM, nutrient concentration, soil texture, water availability, temperature, and electrical conductivity. Regarding plants, it is possible to monitor vegetative vigor and nutritional status through proximal or remote-sensing techniques (i.e., satellite or drone imagery). Finally, the monitoring of atmosphere, by using appropriate weather stations, is necessary to keep the most important agrometeorological variables under control and generate long-term forecasts with climate modelling.
Currently, the techniques used for detecting these parameters are based on the use of sensors classified into two distinct categories: remote sensing and proximal sensing. The most frequently utilized remote-sensing platforms in PA are satellites and drones. On the other hand, proximal sensing relies on a wide range of sensors that can be classified into two categories: static and dynamic. Static sensors include agrometeorological stations and soil sensors. The former can record climate trend data over time, making it possible to determine agrometeorological factors useful for planning agronomic operations. Soil sensors represent the evolution of soil physical variable determination like moisture, temperature, and electrical conductivity. Dynamic sensors are used to characterize soil or crops and their relative characteristics in terms of space (different points in plots) and in terms of time (during the season). Therefore, it is possible to define appropriate management strategies or to calibrate/validate models for variable-rate fertilization. There are several proximal sensors able to detect soil properties. Some examples include geophysical sensors based on the measurements of apparent electrical conductivity, which is correlated with the most important physical properties of soil, thus enabling rapid mapping.
2.1. Remote Sensing
Remote sensing is based on the measurement of the reflected or emitted electromagnetic radiation of an object placed at a given distance [7]. Depending on the radiation wavelength detected, there are sensors operating in the optical domain (0.4–2.5 µm), in the thermal infrared (4–10 µm), or in the microwave (3–10 mm). However, most sensors cannot identify the entire spectrum and the details included therein; they measure the average reflectance over a range of wavelength, called a band. The ability to discriminate between different objects, such as soil and leaves with different chlorophyll contents, depends on the number of bands and their distribution. The sensors installed on most satellites have a limited number of bands (from 3 to 10) and are called multispectral. Conversely, sensors with many more bands (up to a few hundred) are known as hyperspectral and can completely define the spectral signatures of objects.
Whatever a sensor is used for, remote sensing is based on relating the detected reflectance measured by the sensors with agronomic variables, such as vegetative vigor, crop canopy development, and chlorophyll content. For this purpose, one of the most valid approaches is the determination of vegetation indices (VI), namely mathematical functions combining two or more spectral bands. There are several vegetation indices, yet the most important are used to measure bio-physical parameters (yield, stress conditions, presence of diseases, etc.) for crop monitoring, with the aim of determining the effects of different agronomical management strategies [8]. One of the most useful bio-physical parameters for PA applications is the Leaf Area Index (LAI), which measures total leaf surface per unit area, and the chlorophyll content of leaves, both providing indications on crop vegetative status (i.e., the presence of sub-optimal plant development). Two vegetation indices are widely used to analyze crop development and phenological stage: the NDVI (Normalized Difference Vegetation Index) [9,10] and the MSAVI (Modified Soil-Adjusted Vegetation Index) [11]. These can be easily visualized as maps on IT platforms. The selection of platforms is related to their resolution and should be evaluated according to the crops and the aim of the measurements. For instance, for defining the fertilization strategy for extensive crops, a lower resolution is necessary compared with horticultural crops. Centimeter spatial resolution is provided by Unmanned Aerial Vehicles (UAV) and could be used for monitoring weeds or pathogens, since high spatial and spectral resolution is essential.
2.1.1. Satellites
Precision agriculture needs systems with a high spatial resolution and high acquisition frequency to monitor crop conditions at different moments during biological cycles. Such needs are met thanks to numerous satellite systems that government agencies and private companies have put into orbit over the last few decades. These entities often run missions made up of several satellites of the same type, namely constellations. Every satellite usually has one or more sensors on board, the transmitted data of which are received by stations and processed to correct the main distortions (atmospheric effects, geometric distortions, etc.). Thereafter, the images generated by the system are provided to users through web solutions, making data available online. Such data can be automatically processed using specific algorithms to extract vegetative vigor indices, or to estimate crop bio-physical variables. Satellite images can give precise information with in-field variability; in fact, since they are able to discriminate between different wavelengths (green at 520–600 nm, red at 630 nm, and NIR bands at 760–900 nm), they give important information on water and N deficiency [12].
2.1.2. Unmanned Aerial Vehicles
Unmanned Aerial Vehicles, commonly also called drones, are remotely piloted flying platforms guided by an operator with remote control devices supported by navigation systems (Figure 1). In PA, UAVs are used for several operations, such as taking pictures or detecting images. From a technical point of view, UAVs can integrate different technological components like flight sensors, cameras, robotic arms of radio receivers. From an operational point of view, the main benefits of using UAVs are their high spatial resolution, availability of a wide selection of cameras or sensors (multispectral and hyperspectral sensors, laser scanners, thermal and RGB cameras), the possibility to select when to acquire images. On the other hand, there are some drawbacks to using drones. For instance, images must be corrected, as crop reflectance is affected by daylight brightness and water vapor content in the air. In addition, flights must be performed by qualified professionals who are specifically trained for this purpose.
2.2. Proximal Sensing
Proximal sensing refers to a set of technologies where sensors are in direct contact with the object to be measured or a short distance (typically less than 2 m) from it [13]. Proximal sensing can be performed with a fixed sensor (agrometeorological station, soil sensors) or installed on moving machinery like a tractor or a quadbike. There are numerous types of sensors which differ in terms of variables detected and technologies implemented.
2.2.1. Agrometeorological Stations
Agrometeorological stations (Figure 2) are generally composed of a single module integrating all sensors needed to measure atmospheric parameters. The “base”-type stations integrate sensors for detecting air temperature, air moisture, rainfall, and leaf wetness. These parameters are sufficient to support agriculture management; precipitation and temperature data can be used in remote weather monitoring to schedule field operations. For instance, leaf wetness, along with the previous parameters can be used to feed crop protection models simulating pathogen or parasite development [14].
For some crops, data collected from weather stations can feed forecasting phenological models able to estimate the evolution of plant phenological stages. In the most advanced weather stations, sensors measuring solar radiation and wind speed are also implemented. These sensors can calculate reference evapotranspiration, allowing the implementation of crop water balance for planning irrigation.
2.2.2. Soil Moisture Sensors
Soil moisture sensors are widely used in precision irrigation. Soil water availability can be expressed as water content and is generated from the ratio between the water volume and total volume of soil, or as soil matric potential, that is, the adhesion and cohesion forces that hold water within the soil. Soil moisture sensors are equipped with one or more probes for detecting water content at different soil depths and can be positioned in relation to root depth. The most widespread sensors used for measuring matric potential are the tensiometers (Figure 3), which consists of a porous ceramic cup filled with distilled water and which are buried in the soil. Once in the soil, the water inside the porous cup equilibrates with the soil moisture through the pores in the ceramic cup; the loss of water causes a drop in its hydrostatic pressure that will be indicated by the pressure gauge [15].
A chalk potentiometric probe (Figure 4) consists of a pair of highly corrosion-resistant electrodes that are included inside a piece of chalk; electricity is applied to the probes to obtain a resistance value, which is correlated to soil water content.
Other techniques that can be used involve soil resistivity sensors, infrared moisture balance, dielectric techniques viz., Time Domain Reflectometry, the Frequency Domain Reflectometry and Capacitance technique, heat flux soil moisture sensors, micro-electro mechanical systems, and optical techniques [15], as well as the literature cited here. Once sensors are installed, it is possible to analyze the soil–moisture curve. At this stage, in case of some irrigation event or precipitation, it is possible to identify volumetric content, field capacity, and the soil recharging point.
2.2.3. Sensors for Detecting Plant Nutritional Status
Regarding smart scouting activities, it is possible to use portable tools to assess crop nutritional status. The most widespread devices are chlorophyll meters, based on spectral measurements for the determination of leaf pigment concentration, such as the chlorophyll meter [16] that can estimate chlorophyll content in plant tissues, thus indirectly estimating their photosynthetic efficiency and verifying nutritional deficiencies (Figure 5). In fact, since chlorophyll is correlated with N concentration, these devices could give rapid information for the definition of the amount and timing of fertilizer supply [17]. For example, as a consequence of low nutrient availability, reactive oxygen species would rapidly increase; thus, the analysis of plants metabolic and morphological responses can measure the N variation due to the addition or deprivation of nitrate [18]. In this way, digital imaging for crop N estimation was developed to detect some stress and biophysical plant parameters such as insect damage, and nutrient and water deficiencies [19].
Plant N status could also be evaluated via non-invasive remote-sensing methods able to evaluate the canopy reflectance of a specific area or of the entire crop field. In relation to a light source, these sensors can be classified as passive or active. The former are reflectance sensors that measure the light emission of a canopy once it is under sunlight radiation [12]; on the other hand, active sensors provide high-intensity, multispectral light that can measure and record crop reflectance in a waveband ranging from 450 nm to 900 nm depending on the model [12]. This technique does not require sophisticated instruments (spectroradiometers, crop canopy reflectance meters) since a commercial digital camera and an image processing system are enough [12]. However, plant N determination with the above-mentioned techniques has some limitations due to their susceptibility to several sources of interference (sunlight variation, soil conditions, and chlorophyll saturation, for example) that do not enable the identification of overfertilized plants [12]. In addition, chlorophyll meter readings are not able to give rapid information on increased N availability. Thus, an alternative could be the measurement of plant nitrate sap concentration that is closely correlated to plant N status [12].
Plant biological tissues can behave as electrical circuits made with passive elements such as resistors and capacitors [20]. It was reported in [21] that there is a correlation between electrical impedance and the concentration of Ca, P, and K in plants; moreover, a nutrition index was applied to tomatoes to detect a lack of mineral nutrients [22]. Even if few studies have reported on this method, since electrical impedance can respond to changes in cellular structure, membrane potential, and sap ionic concentration, it could be used to provide useful information on plant physiological and nutritional status [12].
2.3. Sensors for Detecting Soil Nutrients
In soils characterized by aeration and mild temperature, the most important fraction of N is nitrate (NO3−), which is dissolved in soil–water solutions, not adsorbed by the colloids, and is continuously at risk of leaching if soil moisture exceeds field capacity. Soil nitrate concentration varies considerably due to the complex interaction between microbiological, chemical, and physical processes, and it fluctuates during the vegetative season as a consequence of mineralization, immobilization, absorption, and other turnover processes. Often, attempts to set a modelling process to minimize problems related to a lack of homogeneity in soil and increase the precision in fertilization management have not succeeded. A similar trend can be observed in sulfur (S), mainly present in soil as SO42- (sulfate anion), although much less attention has been paid to this nutrient. If the behaviors of N and S are common in all soils, the mobility of the other nutrients depends on soil conditions. Soils with a neutral to sub-alkaline pH, a clay, clay–loam, silt, silt–loam texture, high OM content are characterized by a high cation exchange capacity (CEC), which decreases the number of cations in a solution and prevents them from leaching. In soils with a low pH, sand texture, and low OM, the low CEC increases the risk of the leaching of cations in a water solution. No matter the soil conditions, P usually has low mobility, since it aggregates in hydroxylic molecules such as Ca(OH)2, Al(OH)3, Fe(OH)3 in sub-alkaline, neutral, and sub-acid soils, respectively. Within this scenario, before making a decision regarding fertilization, it is crucial to carefully evaluate the nutrient concentrations in a soil solution, as well as soil humidity; ideally, nutrients should be applied only to areas with adequate soil moisture [10].
As noted, among the macro and micronutrients, soil N is mainly in organic form, not available for root uptake, until it is mineralized by soil microbiota to ammonium (NH4+) and then oxidized to nitrite (NO2−) and NO3−. Traditionally, mineral N can be measured via soil sampling and offsite laboratory or on-site measurements. Laboratory analyses are accurate, cheap, and easy to carry out; however, they are time-consuming and provide results within days after the sampling. On the other hand, on-site measurements have the capacity to provide real-time information on the trends of N at root level and can provide a prompt answer on what is the best condition for the application of smart and precise fertilizer input. The technologies currently available for on-site nutrient determination [3] can be divided according to the sensors employed therein: optical/radiometric, electrical/electromagnetic, electrochemical, and mechanical [23].
2.3.1. Electrical/Electromagnetic Sensors
Electrical and electromagnetic sensors have been used for decades for continuous non-invasive measurements of soil solution nutrient concentration. They are based on the determination of apparent electric conductivity (ECa) of a soil solution [23] and measure the capability of soil to accumulate or conduct an electrical charge (Figure 6). The most common sensors measure electromagnetic induction or electrical resistivity. The former sensors include a transmitter and a receiver which are not in direct contact with the soil, and produce a variable magnetic field to induce an electrical current in the soil, linearly related to soil conductivity. On the other hand, the probes that measure electrical resistivity are in contact with the soil and consist of two electrodes, one that produce current, and the other that measure the resulting potential difference that reflect the soil resistivity, that is the opposite of the conductivity [23]. Electric conductivity has been found to respond mainly to soil texture and soil moisture; consequently, these two characteristics should be considered when ECa is used to estimate soil nutrient availability. The placement of probes near water emitters, where soil moisture is kept constant, would prevent misinterpretation of the results related to the soil humidity. In the acidic soils of Brazil, a strong relationship between ECa and K+ and Ca2+ was demonstrated [23], while a significant correlation between soil extract, ECa, and nitrate, with a coefficient of determination (R2) of 0.98, was observed [24] so that the information obtained via ECa measurements is equivalent to that obtained via nitrate analysis [25,26,27]. In calcareous Italian soils, a satisfactory relationship between ECa and NO3- was found only in clay soils, with an R2 of 0.64, while in loam soil, the relationship was not significant [28]. The different response can be related to the effect of soil texture on soil CEC, mainly related to the abundance of clay. Since ECa measures the presence of soluble and readily dissolvable salts, including cations (e.g., Na+, K+, Mg2+, Ca2+) and anion species (Cl−, HCO3−, NO3− and SO42−) and nonionic solutes [29], the decreased activity of cations in a soil solution (adsorbed by the negative electrical charges of the clay) can improve the accuracy of NO3− (the main anion) determination.
2.3.2. Electrochemical Sensors (Ion-Selective Membrane)
The most common electrochemical sensors are ion-selective electrodes and ion-sensitive field effect transistors (ISFET) [23]. Both sensors respond to a specific ion, according to the logarithmic relationship between the ion and its electric potential, as described by the Nernst equation. Electrochemical sensors require an ion recognition element, such as an ion-selective membrane, along with a reference electrode that allows the measurement of the electrical potential difference (in mV) between the soil solution and the standard solution inside the probe [30]. An ion-selective membrane (or ion selective electrode) is a two-electrode system made of a reference electrode and a soil solution, with the relationship between the electric potential and ion concentration that can be converted into the ion concentration in the solution. Consequently, the use of ion-selective membranes can be useful in building electrodes used as detectors in portable field analyses to estimate nutrients in soil. One of the first ion-selective electrodes (ISEs) was based on a liquid–ion exchange sensor trapped in poly vinyl chloride (PVC) matrix membranes [31]. Recently, the combination of poly(3-octyl-thiophene) and nanocomposite molybdenum sulfate has been shown to be a promising membrane-based, solid-state nitrate sensor [32]. The combination of the two molecules was found to be a good means of ion-to-electron transduction for NO3− detection. The limit of this technology is the short time (4 weeks) of effectiveness, which makes it a strategy not suitable for a perennial crop like it is for fruit trees.
Ito and coworkers [33] proposed the use the natural oriental lacquer, Uruschi, to build a solid-state nitrate-ion-selective electrode membrane. The sensing membrane, beside Uruschi (45%), consisted of nitropheniyl octyl ether (27.5%) and tri-n-octymethylammonium nitrate (27.5%), plated with two layers of Ag/AgCl and Cu to make a 0.5-mm-thick coating [34]. This Uruschi matrix membrane electrode showed a performance similar to a PVC membrane in terms of selectivity and detection range (0 and 400 mg N L−1), in regard to measure NO3--N directly in the soil [33]. An ultraviolet, laser-induced graphene (LIG) electrode, for electrochemical ion-selective sensing of plant-available nitrogen (NH4+ and NO3−) is another electrochemical solid-state contact ion-selective probe that has been employed for mineral N determination in soil samples [34]. It includes two specific sensors for NH4+ and NO3− with a detection limits of 28.2 and 20.6 μM, respectively, and a linear sensing range from 10−5 M for NH4+ and 10−1 M for NO3−, a wide range (0.14 mg L−1–1400 mg L−1) that fits the normal concentration of the two ions in soil solution. The main problems with this technique are related to a relatively complex fabrication process, although alternative scalable manufacturing protocols for graphene-based electrical circuits are potentially available [34]. Although the increase in soil humidity decreases the mV response, in the common moisture ranges, this effect is negligible [23]. Field trials conducted in North America, showed a good relationship (R2 > 0.9) for pH but a poorer relationship (R2 = 0.6) for K and NO3− (R2 = 0.5) [35].
Artigas and coworkers [36] developed an in situ, real-time probe for NO3- based on a potentiometric system, which employs a current follower circuit, connected to a sensor placed inside a PVC tube. The sensor is made with a thick-film sensor built up from standard photolithographic process equipment and a screen-printing apparatus, with the employment of a polymer, graphite, and cyclohexanone (as a solvent) to produce the transducer and featuring a copper plate as a reference electrode. The electrical potential of the sensor is expected to decrease with the increase in NO3- concentration with a promptness of response lower than 1 h.
Ion-selective membranes have also been developed for P-selective sensors, with potential for use in real-time soil fertility monitoring. Some examples include P-selective PVC probes [37], or disposable on-chip microsensors with a planar cobalt (Co) microelectrode and an Ag/AgCl reference electrode on a polymer substrate [38]. The potential response of this technique covers a range between 10−5 and 10−2 M at a soil pH of 5, with the ability to determine both inorganic and organic P compounds showing high selectivity and sensitivity but with a lifetime of 30 min only.
2.3.3. Optical/Radiometric
Many attempts to estimate physical and chemical soil characteristics using optical methods involving different wavelengths, including ultraviolet (UV), visible, and near infrared (NIR) spectra have been made. In general, the determinations of organic and total C, total N, and clay are the most reliable, since clay minerals and OM are spectrally active components of soil, with the main absorbance falling in the visible and near-infrared spectra. However, some exceptions include available magnesium (Mg) and K in Brazilian tropical soils [39] and P in temperate soils [39]. In the latter case, a wavelength of 305–2200 nm was employed in the UK [40], while near Lake Okeechobee in Florida, P was measured, in the range of 1 mg P kg−1 to 2.71 mg P kg−1, using a wavelength of 400–2500 nm [41]. Often, spectrophotometric determinations are not precise because of the presence of interferences in the soil solution, such as dissolved ions, organic material, bacteria, colloids, etc. For example, the NIR region of nitrate absorbance is between 1300 nm and 1550 nm, while carbonate absorbs at 1450 nm; therefore, in calcareous soil, the precision of nitrate determination is reduced. If UV light is used, nitrate N absorbance is near 220 nm [42]; however, to eliminate interference from soluble organic material, absorbance should also be taken at 275 nm [43]. A monitoring system based on absorbance spectrometry techniques for direct determination of NO3− was recently proposed by [43], who eliminated the interference caused by dissolved organic C via automatic scanning of the absorption spectrum (between 190 and 850 nm), followed by the identification of the best wavelength in a flow cell located in the basal tip of the probe. The flow cell is directly connected to a customized suction cup which enables continuous sampling of the soil porewater at a pressure between −60 and −80 kPa. The continuous flux of solution from the soil to the flow cell (few mL-volume) allows a real-time determination of the concentration of NO3−. A compact optical sensor based on the photometric detection of soil nutrients, including NH4+, NO3−, available P and iron (Fe), exchangeable Mg, and Ca was developed by [44], by choosing the wavelength of light-emitting diode (LED) to fit the absorption band of chemical reagents whose color was developed by reaction with soil nutrients. Although the optical sensor allows in situ measurements, it cannot provide real-time data, since the soil solution must be prepared for color development at each detector reading. Another approach to measure soil N concentration, with a potential to be used for real-time data collection, involves gas-sensing technologies, in particular, the generation of ammonia gas (NH3) through a denitrification process [45]. Optical sensors and single-walled, carbon-nanotube-based chemiresistive sensors [46], widely used in other scientific fields because of their high sensitivity at ppb level, can also be applied in agriculture.
3. Modelling
Prediction of the evolution of nutrient in the soil is a helpful approach that can drive the determination of a correct fertilization management. However, only a few nutrients (i.e., N and P) have been studied deeply enough to build an equation to predict their development in the soil. For example, the P cycle considers 3 different dynamics for labile, adsorbed and strongly adsorbed P in soil that are characterized by a different C:P ratio [47]. Net P mineralization is the difference between gross microbial P mineralization and P fixation, with the former that was found to increase with the need of bacteria for C [48], for example when a low C:N ratio OM is added to the soil, and a priming effect is expected.
In the case of N, its development in the soil is predicted by the equation that includes the N deposition rate, fixation rate, fertilization rate, mineralization rate, and loss rate [49]. However, this model does not make explicit the processes of nitrification and consequently, it is incomplete, since mineral N is the only fraction of N taken up by plants and the one to be known for fertilization rate establishment. Net N mineralization (the difference between N mineralization and N fixation) is associated with the C:N ratio; considering organic material added to the soil (i.e., an organic fertilizer, such as neemcake), N mineralization depends on C:N ratio, so that if the C:N ratio is <24, a net N mineralization would be expected, whereas with a C/N ratio of ≥24, net N immobilization would be observed [49]. At the same time, if net N mineralization is negative (N fixation > N mineralization) and N fertilization is not enough to cover this difference, then the decomposition of OM and the C release rate are also reduced [47].
The prediction of the evolution of mineral N is crucial, and it mainly depends on soil humidity, temperature and OM; it can be achieved by involving both empirical models (i.e., those supported by experimental data) that ignore underlying processes, and mechanistic models that reproduce system behavior by simulating underlying processes, based on theory [50]. These models are usually accurate within the range of conditions for which they are constructed but become less reliable when extended beyond these limits. Mechanistic models (i.e., logistic and exponential models) that consider time (days), mineralization potential, concentration of mineralized N at zero time, and mineralization rate constant [51] were successfully employed to predict N availability in lowland soils.
4. Conclusions
Precision agriculture makes use of tools and technologies for collecting a large amount of data from multiple sources, whether proximal or remote. Technological progress has made cutting-edge instruments available on the market, which are highly accurate and reliable. Although this is a positive aspect, collected data must flow into scientifically solid criteria and rationales to transform into agronomic models, building up decision support systems. Regarding crop nutrition, these models must simulate nutrient dynamics considering the interactions between the main agroecosystem components, i.e., soil, crop genetics, weather trends, and agronomic management. However, at present, two main drawbacks exist: (1) Reliability/accuracy. Although some agronomic models have been solidly generated based on the scientific literature, they still need to be validated in multiple contexts and areas, as well to be replicated over multiple years to ensure robustness and replicability. Regarding the most important crops, this workflow is in the preparation stage. (2) Input data to feed agronomic models must be readily available and usable for generating decision support system outputs to ensure sufficient time margins for planning field operations. In some cases, this is possible thanks to the tools used. Despite the aspects described above, it is expected that scientific progress and technological development will soon make instruments, tools, and devices mitigating such issues available on the market.
Author Contributions
Conceptualization, M.T. and D.C.; writing—original draft preparation, M.T.; writing—review and editing, E.B., F.F., S.R. and D.C. All authors have read and agreed to the published version of the manuscript.
Funding
This study was carried out within the Agritech National Research Center and received funding from the European Union Next-Generation EUGeneration EU (PIANO NAZIONALE DI RIPRESA E RESILIENZA (PNRR)—MISSIONE 4 COMPONENTE 2, INVESTIMENTO 1.4—D.D. 1032 17 June 2022, CN00000022). This manuscript reflects only the authors’ views and opinions, and neither the European Union nor the European Commission can be considered responsible for them.
Data Availability Statement
Not applicable.
Conflicts of Interest
The authors declare no conflict of interest.
References
- International Society of Precise Agriculture. Available online: https://www.ispag.org/icpa (accessed on 1 September 2023).
- Pierce, F.J.; Novak, P. Aspects of Precision Agriculture. Adv. Agron. 1999, 67, 1–85. [Google Scholar]
- Yin, H.; Cao, Y.; Marelli, B.; Zang, X.; Mason, A.J.; Cao, C. Soil sensors and plant wearables for smart and precision agriculture. Adv. Mater. 2022, 33, 1–24. [Google Scholar] [CrossRef] [PubMed]
- FAOSTAT. Food and Agriculture Organization of the United Nations; FAOSTAT: Rome, Italy, 2020. [Google Scholar]
- Yu, C.; Huang, X.; Chen, H.; Yu, C.Q.; Godfray, H.G.J.; Wright, S.J.; Hall, W.J.; Gong, P.; Ni, S.Q.; Huang, G.R.; et al. Managing nitrogen to restore water quality in China. Nature 2019, 567, 516–520. [Google Scholar] [CrossRef]
- Cassman, K.G.; Dobermann, A.; Walters, D.T. Agroecosystems, nitrogen-use efficiency, and nitrogen management. AMBIO J. Hum. Environ. 2002, 31, 132–140. [Google Scholar] [CrossRef]
- Lillesand, T.M.; Kiefer, R.W. Remote Sensing and Image Interpretation, 3rd ed.; John Wiley and Sons, Inc.: Hoboken, NJ, USA, 1994; Volume 750. [Google Scholar]
- Wiegand, C.L.; Richardson, A.J.; Escobar, D.E.; Gerbermann, A.H. Vegetation indices in crop assessments. Remote Sens. Environ. 1991, 35, 105–119. [Google Scholar] [CrossRef]
- Rouse, J.; Haas, R.H.; Schell, J.A.; Deering, D.W. Monitoring vegetation systems in the Great Plains with ERTS. J. Water Res. Prot. 1974, 351, 309–317. [Google Scholar]
- Tilling, A.K.; O’Leary, G.J.; Ferwerda, J.G.; Jones, S.D.; Fitzgerald, G.J.; Rodriguez, D.; Belford, R. Remote sensing of nitrogen and water stress in wheat. Field Crops Res. 2007, 104, 77–85. [Google Scholar] [CrossRef]
- Qi, J.; Chehbouni, A.; Huete, A.R.; Kerr, Y.H. Modified Soil Adjusted Vegetation Index (MSAVI). Remote Sens. Environ. 1994, 48, 119–126. [Google Scholar] [CrossRef]
- Muñoz-Huerta, R.F.; Guevara-Gonzalez, R.G.; Contreras-Medina, L.M.; Torres-Pacheco, I.; Prado-Olivarez, J.; Ocampo-Velazquez, R.V. A review of methods for sensing the nitrogen status in plants: Advantages; disadvantages and recent advances. Sensors 2013, 13, 10823–10843. [Google Scholar] [CrossRef]
- Viscarra Rossel, R.A.; Adamchuk, V.I.; Sudduth, K.A.; McKenzie, N.J.; Lobsey, C. Proximal soil sensing: An effective approach for soil measurements in space and time. Adv. Agron. 2011, 113, 237–283. [Google Scholar]
- Huber, L.; Gillespie, T.J. Modelling Leaf Wetness in Relation to Plant Disease Epidemiology. Annu. Rev. Phytopathol. 1992, 30, 553–577. [Google Scholar] [CrossRef]
- Susha Lekhmi, S.L.; Singh, D.N.; Baghini, M.S. A critical review of soil moisture measurement. Measurement 2014, 54, 92–105. [Google Scholar]
- Wood, C.W.; Reeves, D.W.; Himelrick, D.G. Relationships between chlorophyll meter readings and leaf chlorophyll concentration; N status; and crop yield: A review. Proc. Agron. Soc. N. Z. 1993, 23, 1–9. [Google Scholar]
- Wang, N.; Fu, F.; Wang, H.; Wang, P.; He, S.; Shao, H.; Ni, Z.; Zhang, X. Effects of irrigation and nitrogen on chlorophyll content; dry matter and nitrogen accumulation in sugar beet (Beta vulgaris L.). Sci. Rep. 2021, 11, 16651. [Google Scholar] [CrossRef]
- Schachtman, D.P.; Shin, R. Nutrient sensing and signaling: NPKS. Annu. Rev. Plant Biol. 2007, 58, 47–69. [Google Scholar] [CrossRef] [PubMed]
- Graeff, S.; Pfenning, J.; Claupein, W.; Liebig, H.P. Evaluation of image analysis to determine the N-fertilizer demand of broccoli plants (Brassica oleracea convar. botrytis var. italica). Adv. Opt. Technol. 2008, 2008, 359760. [Google Scholar] [CrossRef]
- Azzarello, E.; Masi, E.; Mancuso, S. Electrochemical impedance spectroscopy. In Plant Electrophysiology: Methods and Cell Electrophysiology; Springer: Berlin/Heidelberg, Germany, 2021; pp. 205–223. [Google Scholar]
- Greenham, C.G.; Randall, P.J.; Müller, W.J. Studies of phosphorus and potassium deficiencies in Trifolium subterraneum based on electrical measurements. Can. J. Botany 1982, 60, 634–644. [Google Scholar] [CrossRef]
- Tomkiewicz, D.; Piskier, T. A plant based sensing method for nutrition stress monitoring. Prec. Agric. 2012, 13, 370–383. [Google Scholar] [CrossRef]
- Molin, J.P.; Tavares, T.R. Sensor systems for mapping soil fertility attributes: Challenges; advances; and perspectives in Brazilian tropical soils. Eng. Agrícola 2019, 39, 126–147. [Google Scholar] [CrossRef]
- Patriquin, D.G.; Blaikie, H.; Patriquin, M.J.; Yang, C. On-farm measurements of pH; electrical conductivity and nitrate in soil extracts for monitoring coupling and decoupling of nutrient cycles. Biol. Agric. Hortic. 1993, 9, 231–272. [Google Scholar] [CrossRef]
- Miyamoto, T.; Kameyama, K.; Iwata, Y. Monitoring electrical conductivity and nitrate concentrations in an Andisol field using time domain reflectometry. JPN Agric. Res. Q. 2015, 49, 261–267. [Google Scholar] [CrossRef]
- De Neve, S.; Van de Steene, J.; Hartmann, R.; Hofman, G. Using time domain reflectometry for monitoring mineralization of nitrogen from soil organic matter. Eur. J. Soil Sci. 2000, 51, 295–304. [Google Scholar] [CrossRef]
- Nissen, H.H.; Moldrup, P.; Henriksen, K. Time domain reflectometry measurements of nitrate transport in manure-amended soil. Soil Sci. Soc. Am. J. 1998, 62, 99–109. [Google Scholar] [CrossRef]
- Baldi, E.; Quartieri, M.; Muzzi, E.; Noferini, M.; Toselli, M. Use of in situ soil solution electric conductivity to evaluate mineral n in commercial orchards: Preliminary results. Horticulturae 2020, 6, 39. [Google Scholar] [CrossRef]
- Corwin, D.L.; Lesch, S.M. Application of soil electrical conductivity to precision agriculture. Agron. J. 2003, 95, 455–471. [Google Scholar]
- Kim, H.J.; Sudduth, K.A.; Hummel, J.W. Soil macronutrient sensing for precision agriculture. J. Environ. Monitor. 2009, 11, 1810–1824. [Google Scholar] [CrossRef] [PubMed]
- Craggs, A.; Moody, G.J.; Thomas, J.D.R. PVC matrix membrane ion-selective electrodes. Construction and laboratory experiments. J. Chem. Educ. 1974, 51, 541. [Google Scholar] [CrossRef]
- Ali, M.A.; Wang, X.; Chen, Y.; Jiao, Y.; Castellano, M.J.; Schnable, J.C.; Dong, L. Novel all-solid-state soil nutrient sensor using nanocomposite of poly (3-octyl-thiophene) and molybdenum sulfate. In Proceedings of the IEEE 2019 20th International Conference on Solid-State Sensors; Actuators and Microsystems & Eurosensors XXXIII (TRANSDUCERS & EUROSENSORS XXXIII), Berlin, Germany, 23–27 June 2019; pp. 170–173. [Google Scholar]
- Ito, S.; Baba, K.; Asano, Y.; Takesako, H.; Wada, H. Development of a nitrate ion-selective electrode based on an Urushi matrix membrane and its application to the direct measurement of nitrate-nitrogen in upland soils. Talanta 1996, 43, 1869–1881. [Google Scholar] [CrossRef]
- Garland, N.T.; McLamore, E.S.; Cavallaro, N.D.; Mendivelso-Perez, D.; Smith, E.A.; Jing, D.; Claussen, J.C. Flexible laser-induced graphene for nitrogen sensing in soil. ACS Appl. Mater. Interfaces 2018, 10, 39124–39133. [Google Scholar] [CrossRef]
- Adamchuk, V.I.; Lund, E.D.; Sethuramasamyraja, B.; Morgan, M.T.; Dobermann, A.; Marx, D.B. Direct measurement of soil chemical properties on-the-go using ion-selective electrodes. Comput. Electron. Agric. 2005, 48, 272–294. [Google Scholar] [CrossRef]
- Artigas, J.; Jimenez, C.; Lemos, S.G.; Nogueira, A.R.A.; Torre-Neto, A.; Alonso, J. Development of a screen-printed thick-film nitrate sensor based on a graphite-epoxy composite for agricultural applications. Sens. Actuator 2003, 88, 337–344. [Google Scholar] [CrossRef]
- Lemos, S.G.; Menezes, E.A.; Chaves, F.S.; Nogueira, A.R.A.; Torre-Neto, A.; Parra, A.; Alonso, J. In situ soil phosphorus monitoring probe compared with conventional extraction procedures. Commun. Soil Sci. Plant Anal. 2009, 40, 1282–1294. [Google Scholar] [CrossRef]
- Zou, Z.; Kai, J.; Rust, M.J.; Han, J.; Ahn, C.H. Functionalized nano interdigitated electrodes arrays on polymer with integrated microfluidics for direct bio-affinity sensing using impedimetric measurement. Sens. Actuator A Phys. 2007, 136, 518–526. [Google Scholar] [CrossRef]
- Demattê, J.A.M.; Horák-Terra, I.; Beirigo, R.M.; da Silva Terra, F.; Marques, K.P.P.; Fongaro, C.T.; Silva, A.C.; Vidal-Torrado, P. Genesis and properties of wetland soils by VIS-NIR-SWIR as a technique for environmental monitoring. J. Environ. Manag. 2017, 197, 50–62. [Google Scholar] [CrossRef] [PubMed]
- Mouazen, A.M.; Kuang, B. On-line visible and near infrared spectroscopy for in-field phosphorous management. Soil Till. Res. 2016, 155, 471–477. [Google Scholar] [CrossRef]
- Bogrekci, I.; Lee, W.S.; Jordan, J.D. Airborne hyperspectral imaging for sensing phosphorus concentration in the Lake Okeechobee drainage basin. Chem. Biol. Sens. 2005, 5795, 106–112. [Google Scholar]
- Norman, R.J.; Stucki, J.W. The determination of nitrate and nitrite in soil extracts by ultraviolet spectrophotometry. Soil Sci. Soc. Am. J. 1981, 45, 347–353. [Google Scholar] [CrossRef]
- Yeshno, E.; Arnon, S.; Dahan, O. Real-time monitoring of nitrate in soils as a key for optimization of agricultural productivity and prevention of groundwater pollution. Hydrol. Earth Syst. Sci. 2019, 23, 3997–4010. [Google Scholar] [CrossRef]
- Yokota, M.; Okada, T.; Yamaguchi, I. An optical sensor for analysis of soil nutrients by using LED light sources. Meas. Sci. Technol. 2007, 18, 2197. [Google Scholar] [CrossRef]
- Hartmann, P.; Leiner, M.J.; Lippitsch, M.E. Response characteristics of luminescent oxygen sensors. Sens. Actuator B Chem. 1995, 29, 251–257. [Google Scholar] [CrossRef]
- Panes-Ruiz, L.A.; Shaygan, M.; Fu, Y.; Liu, Y.; Khavrus, V.; Oswald, S.; Gemming, T.; Barban, L.; Bezugly, V.; Cuniberti, G. Toward highly sensitive and energy efficient ammonia gas detection with modified single-walled carbon nanotubes at room temperature. ACS Sens. 2018, 3, 79–86. [Google Scholar] [CrossRef]
- Wang, Y.P.; Law, R.M.; Pak, B. A global model of carbon; nitrogen; and phosphorus cycles for the terrestrial biosphere. Biogeosciences 2010, 7, 2261–2282. [Google Scholar] [CrossRef]
- Spohn, M.; Kuzyakov, Y. Distribution of microbial-and root-derived phosphatase activities in the rhizosphere depending on P availability and C allocation–Coupling soil zymography with 14C imaging. Soil Biol. Biochem. 2013, 67, 106–113. [Google Scholar] [CrossRef]
- Marcolini, G.; Toselli, M.; Quartieri, M.; Gioacchini, P.; Baldi, E.; Sorrenti, G.; Mariani, S. Nitrogen and carbon mineralisation of different Meliaceae derivatives. Plant Soil Environ. 2016, 62, 122–127. [Google Scholar] [CrossRef]
- Moorhead, D.L.; Sinsabaugh, R.L.; Linkins, A.E.; Reynolds, J.F. Decomposition processes: Modelling approaches and applications. Sci. Total Environ. 1996, 183, 137–149. [Google Scholar] [CrossRef]
- Manguiat, I.J.; Mascarina, G.B.; Ladha, J.K.; Buresh, R.J.; Tallada, J. Prediction of nitrogen availability and rice yield in lowland soils: Nitrogen mineralization parameters. Plant Soil 1994, 160, 131–137. [Google Scholar] [CrossRef]
Figure 1.
Hexacopter UAV equipped with multispectral camera composed of an array of nine sensors to acquire images in the VIS-NIR spectrum (photo: IBF Servizi-Agronica).
Figure 1.
Hexacopter UAV equipped with multispectral camera composed of an array of nine sensors to acquire images in the VIS-NIR spectrum (photo: IBF Servizi-Agronica).

Figure 2.
Weather station for collecting data on the main climatic parameters (e.g., temperature, rainfall, relative humidity, solar radiation, wind speed).
Figure 2.
Weather station for collecting data on the main climatic parameters (e.g., temperature, rainfall, relative humidity, solar radiation, wind speed).

Figure 3.
Tensiometer for measuring soil water potential.

Figure 4.
Experimental setup of chalk potentiometric probe (Watermark, Irrometer, Riverside, CA, USA) for soil water potential measurements (photo: iFarming).
Figure 4.
Experimental setup of chalk potentiometric probe (Watermark, Irrometer, Riverside, CA, USA) for soil water potential measurements (photo: iFarming).

Figure 5.
Chlorophyll meter for non-destructive detection of leaf chlorophyll concentration.

Figure 6.
Volumetric probe for electrical conductivity measurements (EC Moisture sensor, Digi-Key, Italy) equipped with three separated electrodes and used to measure values from 0 to 10,000 μS/cm with a resolution of 10 μS/cm (photo: iFarming s.r.l).
Figure 6.
Volumetric probe for electrical conductivity measurements (EC Moisture sensor, Digi-Key, Italy) equipped with three separated electrodes and used to measure values from 0 to 10,000 μS/cm with a resolution of 10 μS/cm (photo: iFarming s.r.l).

Disclaimer/Publisher’s Note: The statements, opinions and data contained in all publications are solely those of the individual author(s) and contributor(s) and not of MDPI and/or the editor(s). MDPI and/or the editor(s) disclaim responsibility for any injury to people or property resulting from any ideas, methods, instructions or products referred to in the content. |
© 2023 by the authors. Licensee MDPI, Basel, Switzerland. This article is an open access article distributed under the terms and conditions of the Creative Commons Attribution (CC BY) license (https://creativecommons.org/licenses/by/4.0/).
Share and Cite
MDPI and ACS Style
Toselli, M.; Baldi, E.; Ferro, F.; Rossi, S.; Cillis, D. Smart Farming Tool for Monitoring Nutrients in Soil and Plants for Precise Fertilization. Horticulturae 2023, 9, 1011. https://doi.org/10.3390/horticulturae9091011
AMA Style
Toselli M, Baldi E, Ferro F, Rossi S, Cillis D. Smart Farming Tool for Monitoring Nutrients in Soil and Plants for Precise Fertilization. Horticulturae. 2023; 9(9):1011. https://doi.org/10.3390/horticulturae9091011
Chicago/Turabian StyleToselli, Moreno, Elena Baldi, Filippo Ferro, Simone Rossi, and Donato Cillis. 2023. "Smart Farming Tool for Monitoring Nutrients in Soil and Plants for Precise Fertilization" Horticulturae 9, no. 9: 1011. https://doi.org/10.3390/horticulturae9091011
Note that from the first issue of 2016, this journal uses article numbers instead of page numbers. See further details here.