Colorimetric Assay for Determination of Lead (II) Based on Its Incorporation into Gold Nanoparticles during Their Synthesis

Abstract
: In this report, we present a new method for visual detection of Pb2+. Gold nanoparticles (Au-NPs) were synthesized in one step at room temperature, using gallic acid (GA) as reducer and stabilizer. Pb2+ is added during the gold nanoparticle formation. Analysis of Pb2+ is conducted by a dual strategy, namely, colorimetry and spectrometry. During Au-NPs synthesis, addition of Pb2+ would lead to formation of Pb-GA complex, which can induce the aggregation of newly-formed small unstable gold nanoclusters. Consequently, colorimetric detection of trace Pb2+ can be realized. As the Pb2+ concentration increases, the color turns from red-wine to purple, and finally blue. This method offers a sensitive linear correlation between the shift of the absorption band (Δλ) and logarithm of Pb2+ concentration ranging from 5.0 × 10⁻⁸ to 1.0 × 10⁻⁶ M with a linear fit coefficient of 0.998, and a high selectivity for Pb2+ detection with a low detection limit down to 2.5 × 10⁻⁸ M.1. Introduction
Lead pollution is a serious danger to the environment and human health [1,2]. Intake of lead by human body can damage the kidneys, liver, and the gastrointestinal tract; besides, the nervous system and hemoglobin production will also be affected [3–7]. The maximum contamination level (MCL) for lead in drinking water is defined by the U.S. Environmental Protection Agency (EPA) to be 72 nM [8]. However, even at levels lower than 72 nM the presence of lead in children is associated with brain and neuro-developmental deficiencies [9–11]. Therefore, it is essential to develop sensors for ultrasensitive detection of Pb2+.
Several methods for Pb2+ analysis have been developed in the past decade, including ones based on atomic absorption spectrometry (AAS), atomic emission spectrometry (AES), inductively coupled plasma mass spectrometry (ICP-MS), anodic stripping voltammetry, and reversed-phase high-performance liquid chromatography coupled with UV-vis or fluorescence detection [12–17]. With regard to sensitivity and accuracy, these methods are all efficient tools for Pb2+ detection, but they are time-consuming, expensive, and/or require sophisticated equipment. Therefore, the development of simple, inexpensive, reliable and rapid methods for measuring Pb2+ with high sensitivity and selectivity is highly desirable.
In this respect, colorimetric methods based on functionalized gold nanoparticles (Au-NPs) are convenient, attractive, and also can satisfactorily meet these requirements. Au-NPs exhibit high extinction coefficients, strongly distance-dependent optical properties, and colors arising from Au-NPs at nanomolar concentrations allow them to be easily monitored by the naked eye without the aid of any advanced instruments. A number of Au-NP-based assays have been developed for virus [18–20], nucleic acids [21], protein [22], glucose [23], melamine [24,25], TNT [26], and heavy metal ions such as Hg2+, Cu2+, Cr3+ [27–29].
Recently, Au-NPs have also shown their power in the detection of lead ions [30–36]. Liu et al. have reported a series of pioneering experiments utilizing DNAzyme to detect Pb2+ in water [30,36]. The so-called DNAzyme underwent a self-cleavage process when exposed to Pb2+, thus inducing Au-NPs agglomeration, which could be monitored by the naked eye. A label-free DNAzyme-based sensor for Pb2+ detection using unmodified Au-NPs was reported [31,33]. Double-stranded DNA was not able to stabilize unmodified gold nanoparticles in the presence high concentrations of salt. With the addition of Pb2+, double-stranded DNA was cleaved into single-stranded fragments, which could be absorbed onto gold nanoparticles and thus prevent aggregation. The Pb2+ detection could be realized by the color change of the Au-NPs. Guan et al. investigated the pH-dependent response of citrate capped Au-NPs to Pb2+ ion, indicating the citrate capped Au-NPs are sensitive to Pb2+ ion under the pH of 11.2 [32]. Li et al. coated the surface of Au-NPs with a cysteine-alanine-leacine-asparagine-asparagine (CALNN) pentapeptide [33], and Pb2+ could be recognized by the C-terminal of the oligopeptide, thus leading to aggregation of Au-NPs. This made the detection of Pb2+ visible by the color change of the solution. However, the preparation of Au-NPs using citrate required heating, which is complicated and time consuming. A much milder and faster method was proposed by Yoosaf et al. [37], wherein gallic acid was employed to simultaneously reduce HAuCl4 and stabilize as-prepared Au-NPs. Then addition of Pb2+ caused a visual color change through “crosslinking” of Au-NPs based on Pb-GA complexation. However, the detection limit was relatively high, 5 μM, far beyond the requirements of practical applications. Tseng et al. further developed this method to lower the limit of detection [38]. They discovered that a narrower size distribution and minimized particle repulsion that could help to enhance Pb2+ detection sensitivity could be achieved by tuning the pH value of precursor solution and adding NaClO4 salt as destabilizer, respectively.
However, in all these experiments researchers have to make Au-NPs first, and then modify the Au-NPs or change the environment, both adding to the operational complexity. Therefore, we propose a novel way to realize lead ion detection: adding Pb2+ during Au-NPs synthesis. There are three steps in gold nanoparticle formation: nucleation, growth and saturation [37,39–41]. Initially, Au3+ is reduced to Au0 by gallic acid [42]. Small nuclei are formed which later aggregate into gold nanoclusters (gold seeds). During this process, gallic acid acts not only as a reducing agent, but also a stabilizer surrounding the surface of gold nanoparticles. In the growth stage, the newly-formed small gold nanoclusters are unstable and tend to agglomerate easily upon the interaction with Pb2+, via Pb-GA complexation. Based on this strategy, even the presence of trace Pb2+ results in a visual color change, therefore facilitating the colorimetric detection of trace Pb2+. With increasing Pb2+ concentration, interparticle aggregation increases, and the color would change from red to purple, and finally blue. To the best of our knowledge, this is the first report of the use of this method, that is to say adding Pb2+ during Au-NPs synthesis, to realize Pb2+ detection. Previous methods for the preparation of Au-NPs and detection of Pb2+ are time-consuming or expensive; while our method combines the Au-NPs synthesis and Pb2+ detection into one step, the Pb2+ detection time is greatly shortened at ambient temperature. The proposed method shows great potential as a fast, simple, and economic Pb2+ colorimetric sensor.
2. Experimental Section
2.1. Chemicals
Gallic acid was obtained from J&K Chemical Ltd. (Beijing, China). HAuCl4·4H2O was purchased from Sinopharm Chemical Reagent Co., Ltd. (Shanghai, China). Pb(NO3)2 and other metal ions were bought from Beijing Chemical Company (Beijing, China). The pH of the aqueous solution was adjusted to 4.5 with HCl. All reagents were of analytical grade and prepared using high pure water with a resistivity of 18 MΩ·cm.
2.2. Apparatus
The UV-vis spectra and kinetics were recorded on a UV-2550 spectrophotometer (Shimadzu, Japan), using 1-cm path length quartz cuvettes for measurements. The pH of the solution was measured with a PB-10 pH meter (Sartorius, Germany). The fluorescence measurement was carried out at room temperature using an LS55 fluorescence spectrometer (Perkin Elmer, USA). Transmission electron microscopy (TEM) measurements were performed with an H-7500 (Hitachi, Japan) at 80 kV. The particle size was determined by dynamic light scattering (DLS) measurements (Nano ZS). Flame atomic absorption spectroscopy (FAAS) experiment was implemented by using an AA-6800 spectrometer (Shimadzu, Japan).
2.3. Methods
Au-NPs were prepared by reducing HAuCl4 with gallic adic [37]. In contrast to previous reports, Pb2+ was added during the synthesis of Au-NPs. That is to say, Pb2+ was introduced into the system before HAuCl4 reacts with gallic acid. Briefly, 30 μL Pb2+ solutions of different concentration, 24 μL gallic acid (5.0 × 10⁻² M), 30 μL HAuCl4 (2.7 × 10⁻² M) were added in sequence to 2,916 μL deionized water (adjusted to pH 4.5 with HCl) and shaked gently for a few seconds. The solution started to change color within 20 seconds (Figure S1, Supplementary Information). Results were recorded by photographs and UV-Vis spectrophotometry. TEM samples were prepared by dropping Au-NPs solution on a carbon-coated copper grid and drying at ambient temperature. Common univalent and divalent metal ions were chosen to investigate their interference in Pb2+ detection, and the concentrations of metal ions studied were 5.0 × 10⁻⁸ M, 1.0 × 10⁻⁷ M, 5.0 × 10⁻⁷ M, and 1.0 × 10⁻⁶ M.
The applicability of our method in the detection of Pb2+ in drinking water was verified. Water samples were from our own laboratory and no pretreatment was made. We spiked the samples with standard solution containing 1.0 × 10⁻⁵ M to 1.0 × 10⁻⁴ M Pb2+. FAAS was then conducted to calculate recovery rate. To solve the discrepancy between the detection limits of traditional FAAS and our method, each sample was diluted 100-fold and the recovery rate recalculated using the proposed method.
3. Results and Discussion
3.1. Effect of pH
According to previous reports, the first ionization constant of gallic acid is 4.2 [43]. When pH < 4.2, electrostatic repulsion between gallic acid coated Au-NPs decreases, and the whole system is unstable. When the pH is adjusted to 4.5–5.0, gallic acid exists as monoanion, which adds to the interparticle electrostatic interaction, thus endowing the nanoparticles with good stability, so pH 4.5–5.0 is suitable for synthesizing Au-NPs. Meanwhile, Pb2+, compared to other metal ions, coordinates more favorably with gallic acid at pH 4.5 [37,38]. For this reason, we chose pH = 4.5 to conduct our subsequent studies.
3.2. Effect of Gallic Acid Concentration
The effect of the concentration of gallic acid on the preparation of Au-NPs was investigated. The Au-NPs formed using different concentrations of gallic acid were characterized by UV-vis spectrophotometry. As shown in Figure 1(a), the absorbance and the position of the plasmon band of the formed Au-NPs vary with the concentration of gallic acid. When the concentration of gallic acid was low (below 2.5 × 10⁻⁵ M), the solution possessed a broad absorption at around 550 nm. As the gallic acid concentration increased from 5.0 × 10⁻⁵ M to 8.0 × 10⁻⁴ M, the absorption band intensified and sharpened at c.a. 540 nm. When the concentration of gallic acid is higher (1.0 × 10⁻³ M), it is clearly observed that the absorption band became broad and further red-shifted, due to the hydrogen bonding between the interparticles [37]. As shown in Figure 1(b), an obvious color change of the solution is observed. A well dispersed Au-NPs solution with red-wine color could be made from 4.0 × 10⁻⁴ M gallic acid, and a little mulberry color emerged at 6.0 × 10⁻⁴ M and 8.0 × 10⁻⁴ M gallic acid. In the subsequent Pb2+ detection, there was an obvious color change of the formed Au-NPs mixed with 5.0 × 10⁻⁷ M Pb2+ when the concentration of gallic acid was 4.0 × 10⁻⁴ M, while 6.0 × 10⁻⁴ M or 8.0 × 10⁻⁴ M gallic acid could not induce such a visible change. Therefore, 4.0 × 10⁻⁴ M gallic acid was adopted in our subsequent assays. Then DLS was used for measuring the size of as-prepared Au-NPs in the solution. The average hydrodynamic diameter of the Au-NPs capped with gallic acid was determined to be 35 nm.
3.3. The Colorimetric Detection of Pb2+
We monitored Pb2+ using a dual strategy of colorimetry and spectrometry. Provided that Pb2+ is introduced into the system before HAuCl4 is reduced by gallic acid, a Pb-GA complex would be formed by coordination between Pb2+ and the carboxylic acid group of the gallic acid [43]. Interaction between Pb2+ and gallic acid was confirmed by the fluorescence spectra (Figure S2, Supplementary Information), in which the addition of Pb2+ induced a decline of the emission at 350 nm.
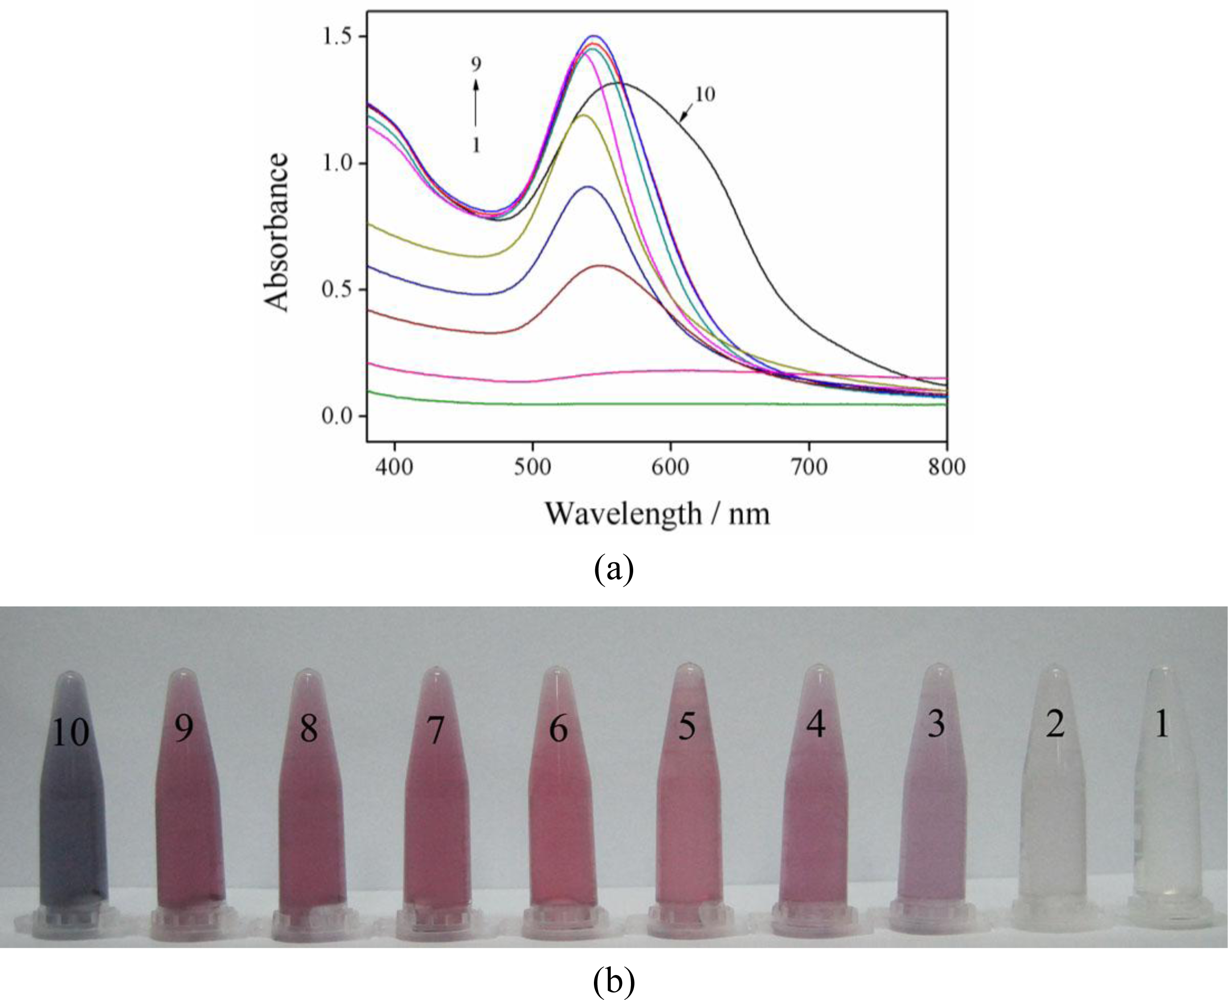
Addition of different amounts of Pb2+ to the system would result in a significant change of color (Figure 2(a)), from a red-wine color to purple, and finally to blue. This can be easily judged by the naked eye, even when the concentration is as low as 5.0 × 10⁻⁸ M. The color of the solution would perdure for a long time (Figure S3, Supplementary Information), and the difference of the colors could still be distinguished two weeks later. Quantification was realized via UV-Vis spectroscopy. From Figure 2(b), it is observed that the surface plasmon resonance (SPR) band of gallic acid capped Au-NPs without Pb2+ was intense at 541 nm, and the increase of Pb2+ concentration would induce a decrease and red shift of Au-NPs’ maximal absorption band. Figure S4 (Supplementary Information) shows the absorbance ratios (A600/A541) plot of Au-NPs against the Pb2+ concentration ranging from 0 to 1.0 × 10⁻⁶ M. The increased dotted line illustrates that Pb2+ can sensitively induce Au-NPs aggregation. The bathochromic shift in the plasmon resonance band (Δλ) induced by aggregation has been utilized to determine the Pb2+ detection limit. A good linear correlation between Δλ and logarithm of Pb2+ concentration was obtained in the range from 5.0 × 10⁻⁸ to 1.0 × 10⁻⁶ M, with a linear fit coefficient of 0.998, making it suitable for the quantitative determination of Pb2+ in aqueous solutions (Figure 2(c)). The linear equation was as follows: Δλ = 153.30018 + 20.49104 log C. The detection limit obtained in this method is 2.5 × 10⁻⁸ M. A concentration of Pb2+ of 5.0 × 10⁻⁷ M was chosen to conduct a reproducibility study. The relative standard deviation (RSD) was 0.44% for ten independent experiments, indicating the good reproducibility of our method.
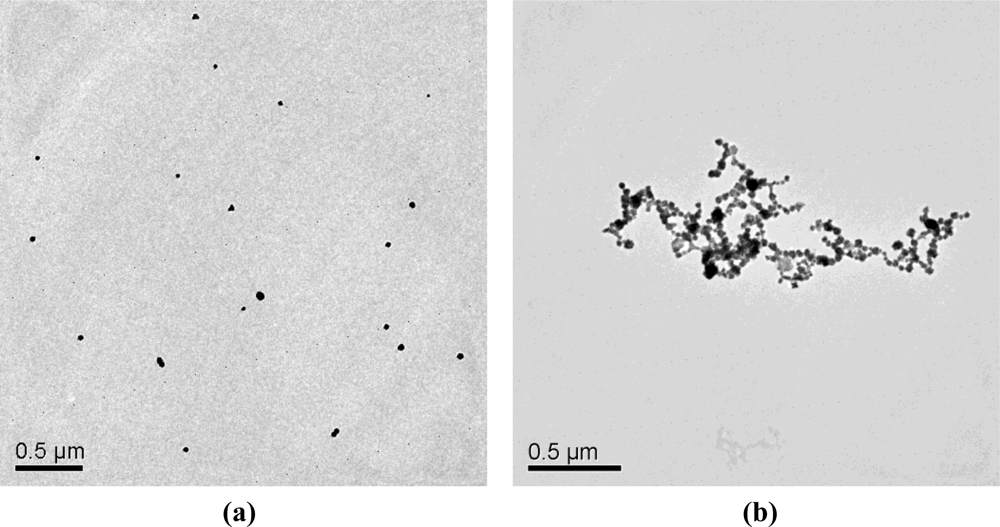
Then transmission electron microscopy (TEM) of the generated Au-NPs was performed. The features of the resulting Au-NPs were directly observed from the TEM images. Figure 3 shows the TEM images of the Au-NPs in the absence and presence of 5.0 × 10⁻⁷ M Pb2+. In the absence of Pb2+ the Au-NPs were dispersed (Figure 3(a)), whereas the Au-NPs obviously aggregated in the presence of 5.0 × 10⁻⁷ M Pb2+ (Figure 3(b)). These results clearly indicate that the addition of trace Pb2+ could readily lead to aggregation of Au-NPs.
3.4. The Selectivity for Pb2+ Detection
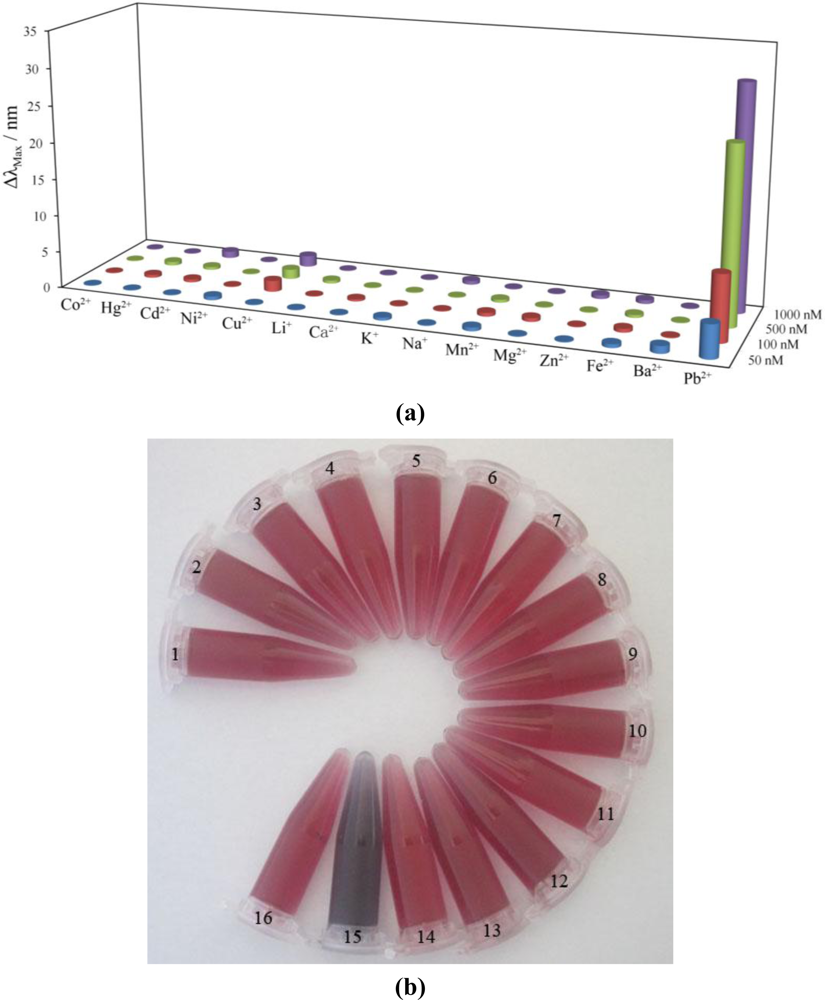
In further experiments, the selectivity of the proposed method was evaluated using other metallic cations (Li+, K+, Na+, Co2+, Hg2+, Cd2+, Ni2+, Cu2+, Ca2+, Mn2+, Mg2+, Zn2+, Fe2+, Ba2+). For comparison, different concentrations of these metallic cations were separately added in substitution of Pb2+ under identical conditions. The changes in the plasmon resonance band of the as-prepared Au-NPs within addition of metallic cations at the concentrations of 5.0 × 10⁻⁸ M, 1.0 × 10⁻⁷ M, 5.0 × 10⁻⁷ M, and 1.0 × 10⁻⁶ M were investigated. As shown in Figure 4(a), in the presence of Pb2+, a significant change in the plasmon resonance band was clearly observed, whereas no obvious change of the formed Au-NPs was detected when other metallic cations were added at the same concentration. According to Figure 4(b), it is obvious that the color of Au-NPs solution changed with the addition of 5.0 × 10⁻⁷ M Pb2+, while the Au-NPs solution remains the same red-wine color when the same amount of other metallic cations was introduced. This result was probably due to the fact that Pb2+ has a variable coordination number (up to 12) and flexible coordination geometry compared to other metallic ions [43–45]. Thus, one Pb2+ can coordinate with two or more gallic acids, but other metallic ions which possess lesser coordination numbers cannot interaction with many more phenolic hydroxyl groups because of their rigid coordination geometry [39]. This experimental result indicates the high selectivity of this Au-NPs-based assay for the detection of Pb2+ in aqueous solution.
3.5. Analytical Application in Drinking Water
To assess its applicability, the proposed method was used in the analysis of Pb2+ in drinking water. The sample was directly spiked with certain amounts of Pb2+ standard solution. The concentration of Pb2+ was calculated to be 6.0 × 10⁻⁵ M. The recovery rate was 101.4%, coinciding nicely with the result obtained by traditional FAAS, which is 102.9%, demonstrating the accuracy of the proposed method.
4. Conclusions
In this paper, the detection of Pb2+ is realized at room temperature during the synthesis of Au-NPs. That is to say, addition of Pb2+ leads to the formation of a Pb-GA complex, which can induce the aggregation of newly-formed small unstable gold nanoclusters. Compared with previous reports, the proposed method needs no complicated pretreatment work, such as preparation of Au-NPs of a proper size or modification of Au-NPs with certain functional groups. In particular, 5.0 × 10⁻⁸ M Pb2+ can be detected by the naked eye. A good linear correlation between the shift of the absorption band (Δλ) and logarithm of Pb2+ concentration was obtained in the range from 5.0 × 10⁻⁸ to 1.0 × 10⁻⁶ M, with a linear fit coefficient of 0.998. This simple, fast, and efficient method offers great potential in future onsite monitoring of Pb2+.
Supplemental Information
sensors-10-11144-s001.pdfAcknowledgments
This work was supported by the State Key Laboratory of Environmental Chemistry and Ecotoxicology (No. KF2010-23), the National Natural Science Foundation of China (Grant Nos. 20877099 and 20972183), the Major State Basic Research Development Program of China (973 Program) (Grant No. 2011CB933200), National Sci-Tech Major Special Item for Water Pollution Control and Management (Grant No. 2009ZX07527-007-03), the State Key Laboratory of Natural and Biomimetic Drugs (Grant No. 20080208), the State Key Laboratory of Electroanalytical Chemistry (Grant No. SKLEAC2010005), Hunan High Education Research Fund (06C068), President Fund of GUCAS (A & B) and the 863 project of Ministry of Science and Technology of China (Grant No. 2008AA100801).
References and Notes
- Lead, Available online: http://www.osha.gov/SLTC/lead/index.html (accessed on 30 May 2008).
- Rizescu, C; Cirstea, E. Lead poisoning. Metal Int 2008, 13, 56–61. [Google Scholar]
- He, QW; Miller, EW; Wong, AP; Chang, CJ. A selective fluorescent sensor for detecting lead in living cells. J Am Chem Soc 2006, 128, 9316–9317. [Google Scholar]
- Guo, LQ; Hong, SC; Lin, XC; Xie, ZH; Chen, GN. An organically modified sol-gel membrane for detection of lead ion by using 2-hydroxy-1-naphthaldehydene-8-aminoquinoline as fluorescence probe. Sens Actuat B-Chem 2008, 130, 789–794. [Google Scholar]
- Guedes, DFC; Silva, RS; da Veiga, MAMS; Pecora, JD. First detection of lead in black paper from intraoral film an environmental concern. J Hazard Mater 2009, 170, 855–860. [Google Scholar]
- Steenland, K; Boffetta, P. Lead and cancer in humans: Where are we now? Am J Ind Med 2000, 38, 295–299. [Google Scholar]
- Li, YH; Wang, SG; Wei, JQ; Zhang, XF; Xu, CL; Luan, ZK; Wu, DH; Wei, BQ. Lead adsorption on carbon nanotubes. Chem Phys Lett 2002, 357, 263–266. [Google Scholar]
- Drinking Water Contaminants, Available online: http://www.epa.gov/safewater/contaminants/index.html#1 (accessed on 4 November 2010).
- Chow, E; Hibbert, DB; Gooding, JJ. Electrochemical detection of lead ions via the covalent attachment of human angiotensin I to mercaptopropionic acid and thioctic acid self-assembled monolayers. Anal Chim Acta 2005, 543, 167–176. [Google Scholar]
- Mesquita, RBR; Fernandes, SMV; Rangel, AOSS. A flow system for the spectrophotometric determination of lead in different types of waters using ion-exchange for pre-concentration and elimination of interferences. Talanta 2004, 62, 395–401. [Google Scholar]
- Jarup, L. Hazards of heavy metal contamination. Brit Med Bull 2003, 68, 167–182. [Google Scholar]
- Tang, Y; Zhai, YF; Xiang, JJ; Wang, H; Liu, B; Guo, CW. Colloidal gold probe-based immunochromatographic assay for the rapid detection of lead ions in water samples. Environ Pollut 2010, 158, 2074–2077. [Google Scholar]
- Luconi, MO; Olsina, RA; Fernandez, LP; Silva, MF. Determination of lead in human saliva by combined cloud point extraction-capillary zone electrophoresis with indirect UV detection. J Hazard Mate B 2006, 128, 240–246. [Google Scholar]
- Yanaz, Z; Filik, H; Apak, R. Development of an optical fibre reflectance sensor for lead detection based on immobilised arsenazo III. Sens Actuat B 2010, 147, 15–22. [Google Scholar]
- Zhang, HL; Ye, YK; Xu, B. Determination of trace lead by anodic stripping voltammetry using acid chrome blue K modified solid paraffin wax carbon paste electrode. Chin J Anal Chem 2000, 28, 194–196. [Google Scholar]
- Saito, S; Danzaka, N; Hoshi, S. Direct fluorescence detection of Pb2+ and Cd2+ by high-performance liquid chromatography using 1-(4-aminobenzyl)ethylenediamine-N,N,N’,N-tetraacetate as a pre-column derivatizing agent. J Chromatogr A 2006, 1104, 140–144. [Google Scholar]
- Huang, ZJ; Yang, GY; Hu, QF; Yin, JY. Determination of lead, cadmium and mercury in microwave-digested foodstuffs by RP-HPLC with an on-line enrichment technique. Anal Sci 2003, 19, 255–258. [Google Scholar]
- Halfpenny, KC; Wright, DW. Nanoparticle detection of respiratory infection. Wires Nanomed Nanobi 2010, 2, 277–290. [Google Scholar]
- Griffin, J; Singh, AK; Senapati, D; Lee, E; Gaylor, K; Jones-Boone, J; Ray, PC. Sequence-specific HCV RNA quantification using the size-dependent nonlinear optical properties of gold nanoparticles. Small 2009, 5, 839–845. [Google Scholar]
- White, KA; Rosi, NL. Gold nanoparticle-based assays for the detection of biologically relevant molecules. Nanomedicine 2008, 3, 543–553. [Google Scholar]
- Li, HX; Rothberg, LJ. Label-free colorimetric detection of specific sequences in genomic DNA amplified by the polymerase chain reaction. J Am Chem Soc 2004, 126, 10958–10961. [Google Scholar]
- Chen, CK; Huang, CC; Chang, HT. Label-free colorimetric detection of picomolar thrombin in blood plasma using a gold nanoparticle-based assay. Biosens Bioelectron 2010, 25, 1922–1927. [Google Scholar]
- Jiang, Y; Zhao, H; Lin, YQ; Zhu, NN; Ma, YR; Mao, LQ. Colorimetric detection of glucose in rat brain using gold nanoparticles. Angew Chem Int Ed 2010, 49, 4800–4804. [Google Scholar]
- Cao, Q; Zhao, H; He, YJ; Li, XJ; Zeng, LX; Ding, N; Wang, J; Yang, J. Hydrogen-bonding-induced colorimetric detection of melamine by non aggregation-based Au-NPs as a probe. Biosens Bioelectron 2010, 25, 2680–2685. [Google Scholar]
- Ai, KL; Liu, YL; Lu, LH. Hydrogen-bonding recognition-induced color change of gold nanoparticles for visual detection of melamine in raw milk and infant formula. J Am Chem Soc 2009, 131, 9496–9497. [Google Scholar]
- Jiang, Y; Zhao, H; Zhu, NN; Lin, YQ; Yu, P; Mao, LQ. A simple assay for direct colorimetric visualization of trinitrotoluene at picomolar levels using gold nanoparticles. Angew Chem Int Ed 2008, 47, 8601–8604. [Google Scholar]
- Lee, JS; Han, MS; Mirkin, CA. Colorimetric detection of mercuric ion (Hg2+) in aqueous media using DNA-functionalized gold nanoparticles. Angew Chem Int Edit 2007, 46, 4093–4096. [Google Scholar]
- Yang, WR; Gooding, JJ; He, ZC; Li, Q; Chen, GN. Fast colorimetric detection of copper ions using L-cysteine functionalized gold nanoparticles. J Nanosci Nanotechno 2007, 7, 712–716. [Google Scholar]
- Dang, YQ; Li, HW; Wang, B; Li, L; Wu, YQ. Selective detection of trace Cr3+ in aqueous solution by using 5,5′-Dithiobis(2-Nitrobenzoicacid)-modified gold nanoparticles. ACS Appl Mater Inter 2009, 1, 1533–1538. [Google Scholar]
- Liu, JW; Lu, Y. Accelerated color change of gold nanoparticles assembled by DNAzymes for simple and fast colorimetric Pb2+ detection. J Am Chem Soc 2004, 126, 12298–12305. [Google Scholar]
- Wang, ZD; Lee, JH; Lu, Y. Label-free colorimetric detection of lead ions with a nanomolar detection limit and tunable dynamic range by using gold nanoparticles and DNAzyme. Adv Mater 2008, 20, 3263–3267. [Google Scholar]
- Guan, J; Jiang, L; Zhao, LL; Li, J; Yang, WS. pH-dependent response of citrate capped Au nanoparticle to Pb2+ ion. Colloid Surface A 2008, 325, 194–197. [Google Scholar]
- Wei, H; Li, BL; Li, J; Dong, SJ; Wang, EK. DNAzyme-based colorimetric sensing of lead (Pb2+) using unmodified gold nanoparticle probes. Nanotechnology 2008, 19, 95501–99505. [Google Scholar]
- Li, XK; Wang, ZX. Gold nanoparticle-based colorimetric assay for determination of lead(II) in aqueous media. Chem Res Chin Univ 2010, 26, 194–197. [Google Scholar]
- Yin, BC; Zuo, P; Huo, H; Zhong, XH; Ye, BC. DNAzyme self-assembled gold nanoparticles for determination of metal ions using fluorescence anisotropy assay. Anal Biochem 2010, 401, 47–52. [Google Scholar]
- Liu, JW; Lu, Y. A colorimetric lead biosensor using DNAzyme-directed assembly of gold nanoparticles. J Am Chem Soc 2003, 125, 6642–6643. [Google Scholar]
- Yoosaf, K; Ipe, BI; Suresh, CH; Thomas, KG. In situ synthesis of metal nanoparticles and selective naked-eye detection of lead ions from aqueous media. J Phys Chem C 2007, 111, 12839–12847. [Google Scholar]
- Huang, KW; Yu, CJ; Tseng, WL. Sensitivity enhancement in the colorimetric detection of lead(II) ion using gallic acid-capped gold nanoparticles: Improving size distribution and minimizing interparticle repulsion. Biosens Bioelectron 2010, 25, 984–989. [Google Scholar]
- Qi, ZM; Zhou, HS; Matsuda, N; Honma, I; Shimada, K; Takatsu, A; Kato, KJ. Characterization of gold nanoparticles synthesized using sucrose by seeding formation in the solid phase and seeding growth in aqueous solution. Phys Chem B 2004, 108, 7006–7011. [Google Scholar]
- Gachard, E; Remita, H; Khatouri, J; Keita, B; Nadjo, L; Belloni, J. Radiation-induced and chemical formation of gold clusters. New J Chem 1998, 22, 1257–1265. [Google Scholar]
- Finney, EE; Finke, RG. Nanocluster nucleation and growth kinetic and mechanistic studies: A review emphasizing transition-metal nanoclusters. J Colloid Interface Sci 2008, 317, 351–374. [Google Scholar]
- Wang, WX; Chen, QF; Jiang, C; Yang, DZ; Liu, XM; Xu, SK. One-step synthesis of biocompatible gold nanoparticles using gallic acid in the presence of poly-(N-vinyl-2-pyrrolidone). Colloid Surface A 2007, 301, 73–79. [Google Scholar]
- Giannakopoulos, E; Christoforidis, KC; Tsipis, A; Jerzykiewicz, M; Deligiannakis, Y. Influence of Pb(II) on the radical properties of humic substances and model compounds. J Phys Chem A 2005, 109, 2223–2232. [Google Scholar]
- Witwicki, M; Jerzykiewicz, M; Jaszewski, AR; Jezierska, J; Ozarowski, A. Influence of Pb(II) ions on the EPR properties of the semiquinone radicals of humic acids and model compounds: High field EPR and relativistic DFT studies. J Phys Chem A 2009, 113, 14115–14122. [Google Scholar]
- Harrowfield, JM; Shahverdizadeh, GH; Soudi, AA. Supramolecular influences on metal ion coordination: Lead (II) under eight-coordination. Supramol Chem 2003, 15, 367–373. [Google Scholar]


© 2010 by the authors; licensee MDPI, Basel, Switzerland. This article is an open access article distributed under the terms and conditions of the Creative Commons Attribution license ( http://creativecommons.org/licenses/by/3.0/).
Share and Cite
Ding, N.; Cao, Q.; Zhao, H.; Yang, Y.; Zeng, L.; He, Y.; Xiang, K.; Wang, G. Colorimetric Assay for Determination of Lead (II) Based on Its Incorporation into Gold Nanoparticles during Their Synthesis. Sensors 2010, 10, 11144-11155. https://doi.org/10.3390/s101211144
Ding N, Cao Q, Zhao H, Yang Y, Zeng L, He Y, Xiang K, Wang G. Colorimetric Assay for Determination of Lead (II) Based on Its Incorporation into Gold Nanoparticles during Their Synthesis. Sensors. 2010; 10(12):11144-11155. https://doi.org/10.3390/s101211144
Chicago/Turabian StyleDing, Nan, Qian Cao, Hong Zhao, Yimin Yang, Lixi Zeng, Yujian He, Kaixiang Xiang, and Guangwei Wang. 2010. "Colorimetric Assay for Determination of Lead (II) Based on Its Incorporation into Gold Nanoparticles during Their Synthesis" Sensors 10, no. 12: 11144-11155. https://doi.org/10.3390/s101211144