TNF as Biomarker for Rapid Quantification of Active Staphylococcus Enterotoxin A in Food

Abstract
: Staphylococcus aureus is a major bacterial pathogen which causes clinical infections and food poisoning. This bacterium produces a group of twenty-one enterotoxins (SEs). These enterotoxins have two separate but related biological activities. They cause gastroenteritis and function as superantigens that activate large numbers of T cells. The current method for detection of enterotoxins activity is an in vivo monkey or kitten bioassay; however, this method is not practical to test on a large number of samples. Several immunological assays have been developed however, but these assays cannot distinguish between active toxin which causes food poisoning and inactive toxin, which can bind antibody, but shows no toxicity. The current study demonstrates that short term ex vivo exposure of primary naïve CD4+ T-cells or splenocytes to SEA induces differential expression and secretion of tumor necrosis factor (TNF) protein. We used immunomagnetic beads coated with anti-SEA antibody to specifically isolate SEA from food. After the eluted toxin was added to the cells SEA biological activity was measured by quantifying TNF protein expression or secretion.1. Introduction
Staphylococcus aureus is one of the major bacterial pathogens causing clinical infections and foodborne illnesses [1]. This bacterium produces about 50 virulence factors that have a wide range of biological activities [2], including a group of twenty-one known enterotoxins (SEs) that act at very low concentrations and have two different, but related, biological activities; emetic activity and superantigenic activity [3–5]. SEs act on the gastrointestinal tract, and as a superantigen (SAg) on the immune system. Unlike normal antigens, SAg can bind to MHC class II molecules, which are expressed on the surface of a subtype of CD4+ T cells [6,7], which perform the role of both antigen presenting cell (APC) and T cell receptor (TCR). Therefore CD4+ T cells are able to present SAg to themselves or to neighboring CD4+ T cells without a safety mechanism which requires interaction between two types of cells [7]. This stimulates ∼20% of the naïve T-cell population which all share particular sequences within the variable region of the β chain (V-β) of the T cell receptor (TCR) [8]. The current test to detect active SEs is an in vivo monkey or kitten bioassay [9,10]. This procedure has low sensitivity and poor reproducibility and requires many experimental animals. Immunological assays have been developed for several SEs, but these methods cannot distinguish between active and inactive toxin. Recent contamination with SEA causing an extensive outbreak with 13,420 cases in Japan [11,12], emphasizes the need to develop better methods to detect active SEs. In this work we used three complimentary approaches for measuring tumor necrosis factor (TNF). Differential expression of TNF was secreted in large quantities following short term ex vivo exposure to SEA therefore; TNF can be used as a biomarker for early detection of biologically active SEA in food.
2. Experimental Section
2.1. Splenocyte Isolation
Spleen cells from C57BL/6 female mice were prepared aseptically and disrupted using a syringe and needle in Russ-10 cell culture medium [made by combining 450 mL of RPMI 1,640 medium without glutamine (Gibco, Carlsbad, CA, USA), 50 mL Fetal bovine serum (Hyclone, Logan, UT, USA), 5 mL 200 mM glutamine (Gibco), 5 mL antibiotic-antimycotic (Gibco—containing penicillin, streptomycin, and fungizone), 5 mL non-essential amino acid mix (Gibco), 5 mL sodium pyruvate (Gibco), and 0.25 ml of 100 mM β-mercaptoethanol (Sigma, St. Louis, MO, USA). Cells were centrifuged at 200 × g at 4 °C for 10 min. Red blood cells were then lysed by adding red cell lysis buffer (0.15 M NH4Cl, 10 mM KHCO3, 0.1 mM Na2EDTA). Cells were again centrifuged and resuspended in Russ-10 medium, and viable cells were counted using trypan blue and a hemocytometer.
2.2. Splenocyte Proliferation Assay
Cells were placed in 96-well plates (1 × 10⁶/mL, 0.2 mL) in Russ-10 medium and treated with various concentrations of SEA followed by incubation at 37 °C in a 5% CO2 incubator. After incubation at various time points, cell proliferation was measured by adding 5-bromo-2-deoxyuridine (BrdU)-labeled DNA to each well 4 h before fixation as described by manufacturer's instructions (Calbiochem, San Diego, CA, USA). Spectroscopic measurements were made of optical density at 620 nm and 450 nm.
2.3. Positive Isolation of Murine CD4+ T cells
Murine CD4+ T cells were isolated using a positive selection (Dynabeads Mouse CD4 L3T4), according to the manufacturer's instructions. Briefly, Splenocytes were resuspended in isolation buffer (PBS supplemented with 0.1% BSA and 2 mM EDTA) at a concentration of 1 × 10⁷/mL and incubated with washed Dynabeads (25 μL of Dynabeads per 107 cells) for 20 min on ice with gentle rotation. After incubation, cells and Dynabeads were placed on a magnet for 2 min. The supernatant was removed and the bead-bound cells were washed 3 times with isolation buffer. The bead-bound cells were resuspended in RUSS-10 media (107 cells per 100 μL of media) and DETACHaBEAD mouse CD4 was added (10 μL per 107 cells) and incubated for 45 min with gentle rotation at room temperature. The detached beads were washed 3 times and resuspended in media.
2.4. Coating Magnetic Beads with Anti-SEA Antibody
One hundred μL of Dynabeads M-280 tosylactivated (Invitrogen, Carlsbad, CA, USA) were washed twice with 600 μL of 0.1 M sodium borate buffer, pH 9.5, and diluted in the same buffer to 2 × 10⁹ beads/mL. Purified anti-SEA antibody (30 μg) was added to 1 × 10⁸ beads (50 μL). The antibody and beads were incubated for 24 h at 37 °C on a slow shaker to facilitate covalent binding. The coated beads were washed twice for 5 min at 4 °C with 1 mL phosphate-buffered saline (PBS), pH 7.4, containing 0.1% bovine serum albumin (BSA), washed once for 4 h at 37 °C with 0.2 M Tris-HCl, pH 8.5, containing 0.1% BSA, and washed once more for 5 min at 4 °C with PBS, pH 7.4, containing 0.1% BSA. The beads were resuspended in 50 μL of the Tris-BSA buffer.
2.5. Sample Preparation of Food
Our preliminary result suggested that the food matrices themselves are somewhat cytotoxic, thus interferes with analytical outcomes. To overcome this obstacle the food were diluted; 20 g of each preserved chicken or green beans peas (Gerber) were added to 20 mL of PBS. Then the foods were spiked with 5 μg/mL, 1 μg/mL, 200 ng/mL, 5 ng/mL or 1 ng/mL of SEA.
2.6. Sample Binding and Disassociation of SEA from Beads
Fifteen μL of the immunomagnetic beads were incubated with a tilting motion at 4 °C with 1 mL of spiked green bean or chicken. After 24 h, the tube was placed on a magnet for 2 min to collect the beads. The beads were washed twice with PBS, pH 7.4, containing 0.1% BSA. Toxin was eluted with 7.5 μL of 100 mM glycine HCl (pH 2.5) then neutralized with 7.5 μL of 2X tris buffered saline (TBS) (pH 8.3).
2.7. Measurement of TNF by Cytometric Bead Array
TNF concentration in cellular supernatant was assayed using Mouse Cytometric Bead kit (BD Biosciences, San Diego, CA, USA), following manufacturer's protocol.
2.8. Measurement of Intracellular TNF Protein Levels
Cells were fixed and permeabilized following the procedure of BD kit Cat # 555028. Intracellular staining of TNF with an APC anti-TNF antibody was performed following manufacture's protocol (BD Pharmingen, San Diego, CA, USA).
2.9. Measurement of TNF by ELISA
TNF concentration in cellular supernatant was measured using BD OptEIA mouse TNF ELISA Set (BD Biosciences), following manufacture's protocol.
3. Results
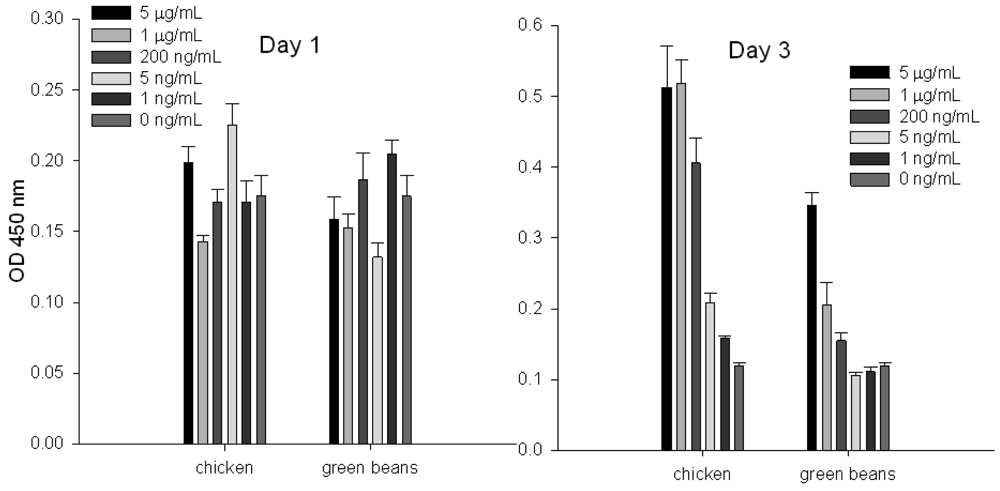
3.1. Measuring Biologically Active SEA in Food by Splenocyte Proliferation Assay
To evaluate the ability of the splenocyte proliferation assay to quantify specific SEs in chicken and green beans, we spiked these food products with increasing concentrations of SEA and then extracted the toxin by using immunomagnetic beads coated with anti-SEA antibody. Our result (Figure 1) shows that by measurement of incorporated BrdU into cellular DNA, toxin cannot be detected at day 1; it can be detected at day 3. We also noticed that at day 3 there is a correlation between eluted SEA concentrations and cell proliferation.
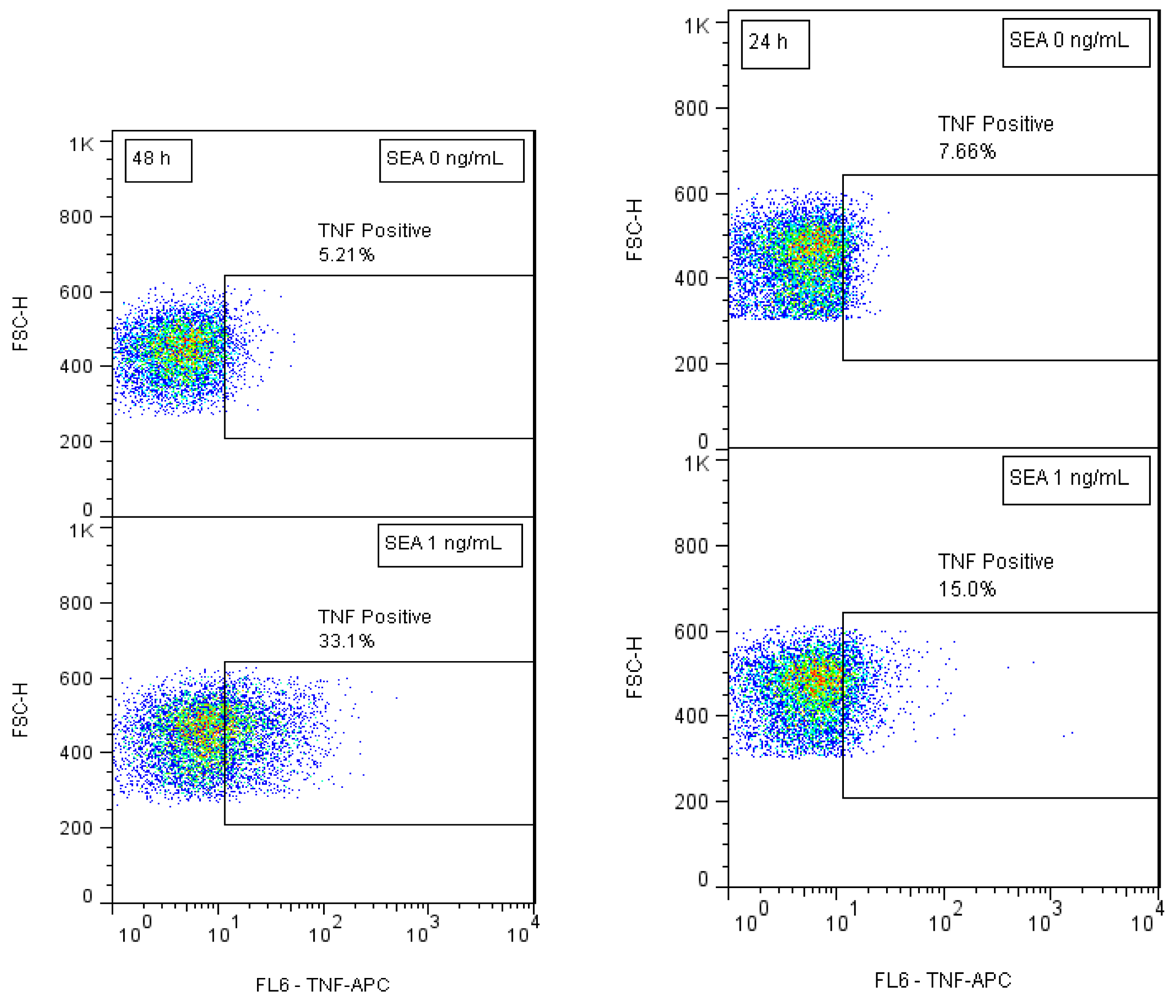
3.2. Intracellular TNF Protein Expression for Detection of Biologically Active SEA
Our preliminary results suggested that short term SEA stimulation of primary naïve CD4+ T-cells increases TNF expression. In order to develop biomarkers for early detection of active SEA we stimulated naïve CD4+ T-cells with SEA for 24 h and 48 h. After intracellular staining, kinetic TNF production was assessed by flow cytometry. Our flow cytometric analysis shows (Figure 2) that SEA exposure increases the percent of cells that expressed TNF. The data also show that the production of TNF increased over time and that SEA can be detected at a concentration of 1 ng/mL after 24 h.
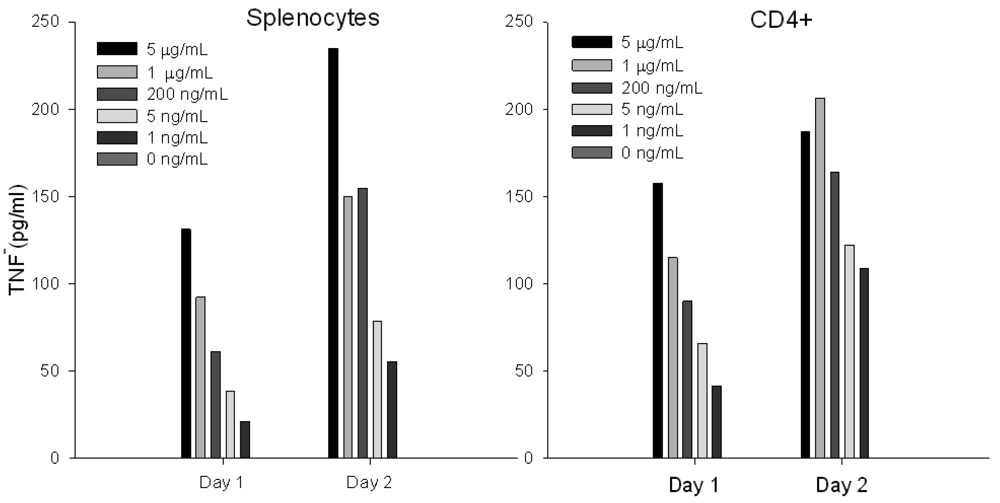
3.3. Stimulation with SEA Induces Differential Protein Expression of TNF
To assess whether short term stimulation will induce differential secreted TNF following SEA treatment, we incubated primary naïve CD4+ T-cells or splenocytes with increasing concentrations of SEA. TNF protein secretion was analyzed on a FACSVantage SE Flow Cytometer. Our results (Figure 3) show that ex vivo SEA stimulation of primary naïve CD4+ T-cells or splenocytes induces TNF protein secretion in a dose dependent response after 24 h.
3.4. Early Detection of Biologically Active SEA in Food by ELISA
To evaluate if TNF protein secretion from splenocyte cells can be used for early detection and quantification of specific SEs in food, chicken and green beans were spiked with increasing concentrations of SEA. The toxin was extracted with immunomagnetic beads coated with anti-SEA antibody. The eluted toxin was incubated with splenocyte cells for 24 h. The ELISA data show (Figure 4) that toxin extracted from food can be detected after 24 h.
4. Discussion
In the present study, we evaluated a potential alternative method to the complex monkey or kitten bioassays for measuring biological activity of SEs. Here, we combined several approaches to detect and to quantify specific active SEs. We used SEA, which is associated with 75% of food borne staphylococcal outbreaks [13] and immunomagnetic beads coated with anti-SEA antibody to extract specific SEs from food. The cell proliferation assay, which measures incorporated BrdU into cellular DNA, is very sensitive with good reproducibility. However, the assay is time-consuming requiring several days of treatment with the toxin. In this work, we found that TNF represents an early molecular response or biomarker to SEA. TNF expression and secretion can be detected in less than 24 h. We used two different flow cytometric analyses for quantitative measurement of TNF: cytometric bead array that quantifies TNF protein secretion and quantitative intracellular TNF accumulation. To detect TNF protein accumulation within CD4+ T-cells, Brefeldin A was added to prevent TNF secretion. The cells were then fixed, permeabilized, stained with APC- conjugated anti-TNF antibody and analyzed by flow cytometry. Although our flow cytometric results were rapid and sensitive, using this analysis requires expensive equipment and skilled personnel. To overcome this aspect, we used an ELISA test that is relatively simple, inexpensive and practical for testing a large number of samples. The results demonstrated that the immunology techniques tested; bead array, intracellular TNF accumulation, and the ELISA test can detect active SEA with the same sensitivity as the cell proliferation assay. Induction of TNF secretion by SEA is 48h faster than by cell proliferation. By using three independent approaches to measure TNF, the cited data suggest that TNF is an early molecular response to SEA and is differentially expressed after a short term exposure. Therefore TNF can be used for early toxin detection in food.
Acknowledgments
We deeply thank Daphne Tamar and Sharon Abigail for helpful discussions.
References
- Dinges, M.M.; Orwin, P.M.; Schlievert, P.M. Exotoxins of staphylococcus aureus. Clin. Microbiol. Rev. 2000, 13, 16–34. [Google Scholar]
- Cheung, A.L.; Projan, S.J.; Gresham, H. The Genomic aspect of virulence, sepsis, and resistance to killing mechanisms in staphylococcus aureus. Curr. Infect. Dis. Rep. 2002, 4, 400–410. [Google Scholar]
- Hui, J.; Cao, Y.; Xiao, F.; Zhang, J.; Li, H.; Hu, F. Staphylococcus aureus enterotoxin C2 mutants: Biological activity assay in vitro. J. Ind. Microbiol. Biotechnol. 2008, 35, 975–980. [Google Scholar]
- Hu, D.L.; Omoe, K.; Sashinami, H.; Shinagawa, K.; Nakane, A. Immunization with a nontoxic mutant of staphylococcal enterotoxin A, SEAD227A, protects against enterotoxin-induced emesis in house musk shrews. J. Infect. Dis. 2009, 199, 302–310. [Google Scholar]
- Harris, T.O.; Grossman, D.; Kappler, J.W.; Marrack, P.; Rich, R.R.; Betley, M.J. Lack of complete correlation between emetic and T-cell-stimulatory activities of staphylococcal enterotoxins. Infect. Immun. 1993, 61, 3175–3183. [Google Scholar]
- Reizis, B.; Schramm, C.; Cohen, I.R.; Mor, F. Expression of major histocompatibility complex class II molecules in rat T cells. Eur. J. Immunol. 1994, 24, 2796–2802. [Google Scholar]
- Rasooly, R.; Do, P.M.; Hernlem, B.J. Auto-presentation of Staphylococcal enterotoxin A by mouse CD4+ T cells. Open J. Immunol. 2011, 1, 8–14. [Google Scholar]
- Rasooly, R.; Do, P.M. In vitro cell-based assay for activity analysis of staphylococcal enterotoxin A in food. FEMS Immunol Med. Microbiol. 2009, 56, 172–178. [Google Scholar]
- Bergdoll, M.S. Monkey feeding test for staphylococcal enterotoxin. Meth. Enzymol 1988, 165, 324–333. [Google Scholar]
- Bennett, R.W. Staphylococcal enterotoxin and its rapid identification in foods by enzyme-linked immunosorbent assay-based methodology. J. Food Prot. 2005, 68, 1264–1270. [Google Scholar]
- Asao, T.; Kumeda, Y.; Kawai, T.; Shibata, T.; Oda, H.; Haruki, K.; Nakazawa, H.; Kozaki, S. An extensive outbreak of staphylococcal food poisoning due to low-fat milk in Japan: estimation of enterotoxin A in the incriminated milk and powdered skim milk. Epidemiol. Infect. 2003, 130, 33–40. [Google Scholar]
- Ikeda, T.; Tamate, N.; Yamaguchi, K.; Makino, S. Mass outbreak of food poisoning disease caused by small amounts of staphylococcal enterotoxins A and H. Appl. Environ. Microbiol. 2005, 71, 2793–2795. [Google Scholar]
- Vernozy-Rozand, C.; Mazuy-Cruchaudet, C.; Bavai, C.; Richard, Y. Comparison of three immunological methods for detecting staphylococcal enterotoxins from food. Lett. Appl. Microbiol. 2004, 39, 490–494. [Google Scholar]


© 2012 by the authors; licensee MDPI, Basel, Switzerland. This article is an open access article distributed under the terms and conditions of the Creative Commons Attribution license (http://creativecommons.org/licenses/by/3.0/).
Share and Cite
Rasooly, R.; Hernlem, B. TNF as Biomarker for Rapid Quantification of Active Staphylococcus Enterotoxin A in Food. Sensors 2012, 12, 5978-5985. https://doi.org/10.3390/s120505978
Rasooly R, Hernlem B. TNF as Biomarker for Rapid Quantification of Active Staphylococcus Enterotoxin A in Food. Sensors. 2012; 12(5):5978-5985. https://doi.org/10.3390/s120505978
Chicago/Turabian StyleRasooly, Reuven, and Bradley Hernlem. 2012. "TNF as Biomarker for Rapid Quantification of Active Staphylococcus Enterotoxin A in Food" Sensors 12, no. 5: 5978-5985. https://doi.org/10.3390/s120505978