Analysis of Detection Enhancement Using Microcantilevers with Long-Slit-Based Sensors

Abstract
:
1. Introduction
2. Theoretical Analysis
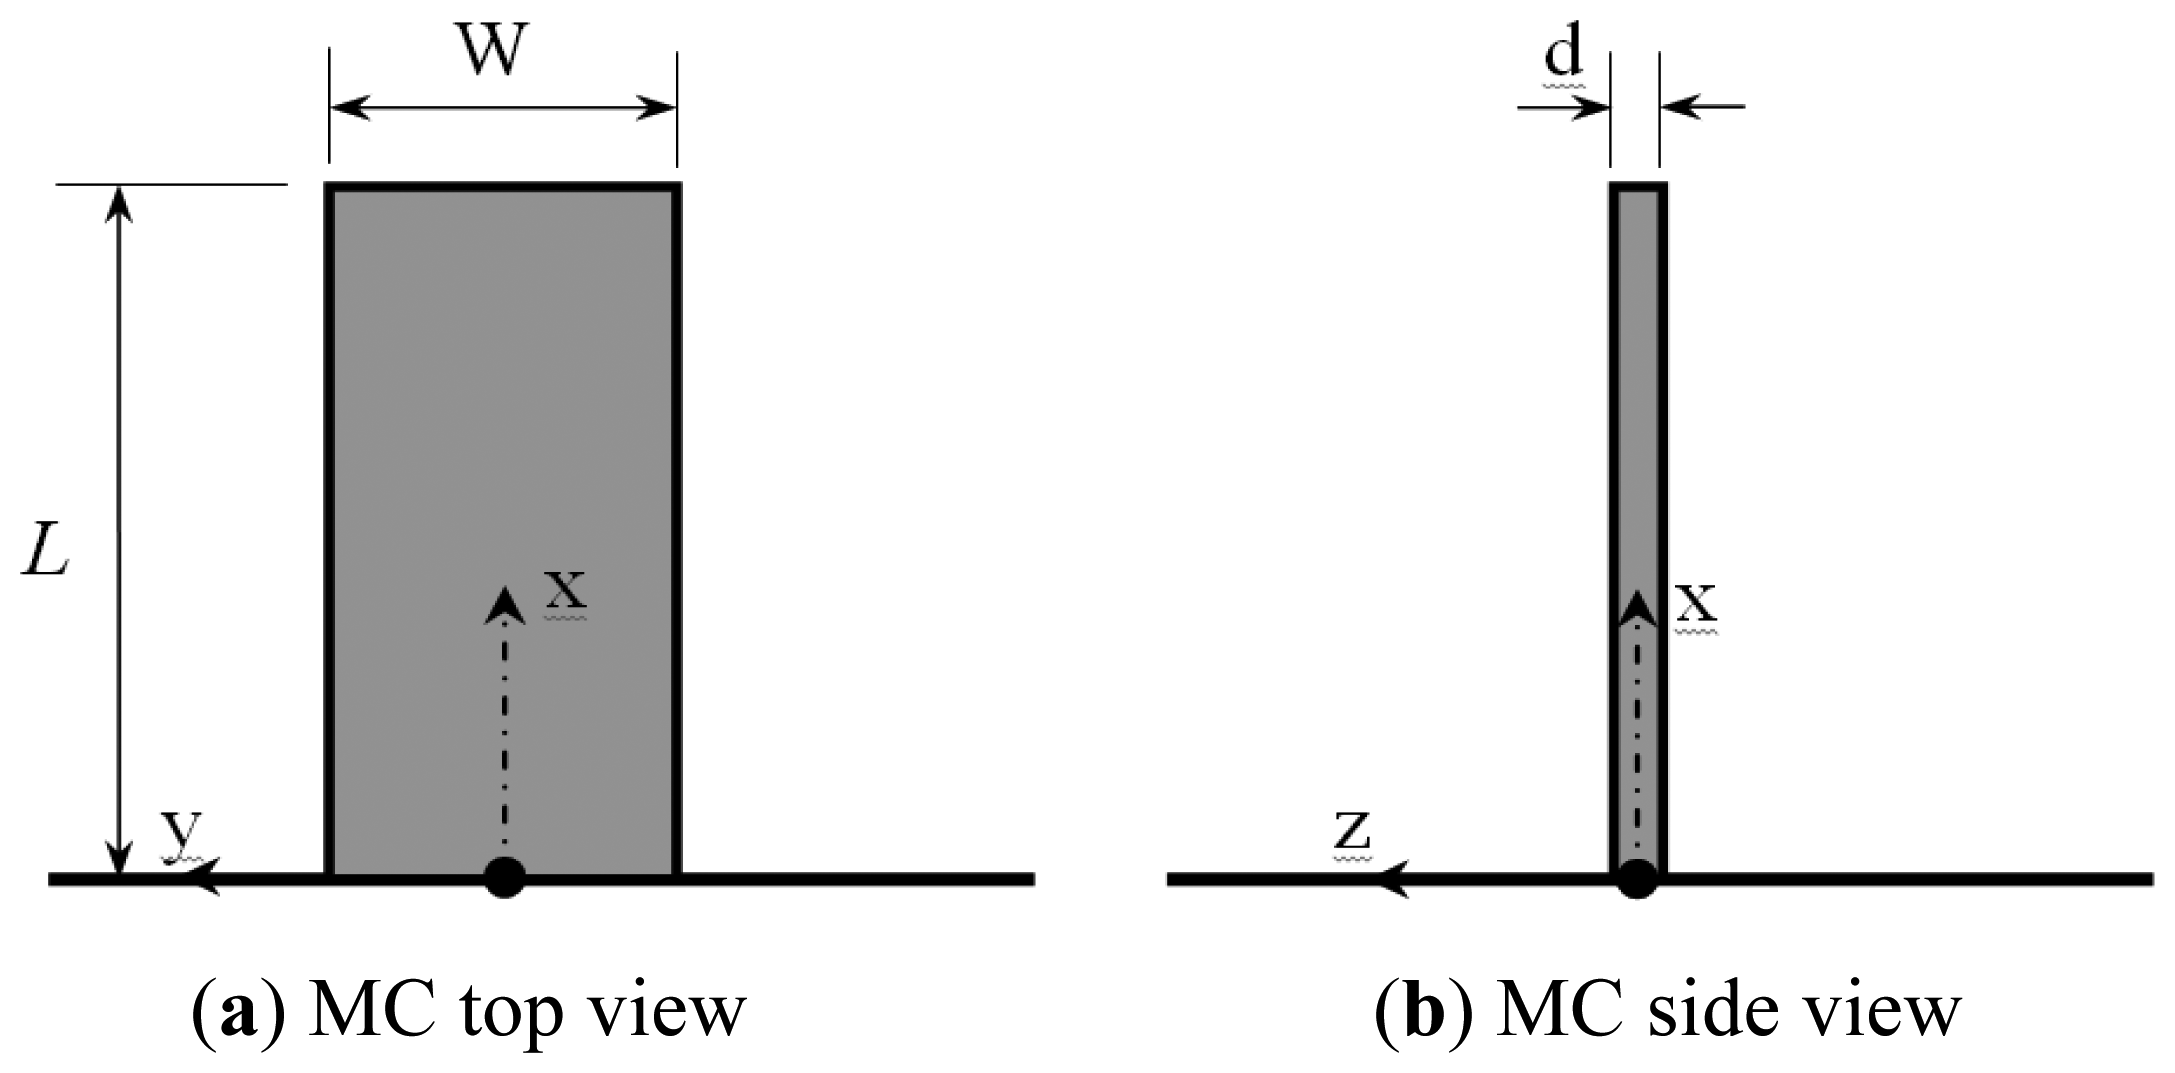
2.1. The Typical Rectangular Microcantilever
2.1.1. Deflections of the Typical Rectangular Microcantilever
2.1.1.1. Concentrated Force Loading
2.1.1.2. Prescribed Differential Surface Stress
2.1.2. The Disturbance in the Deflections of the Typical Rectangular Microcantilever
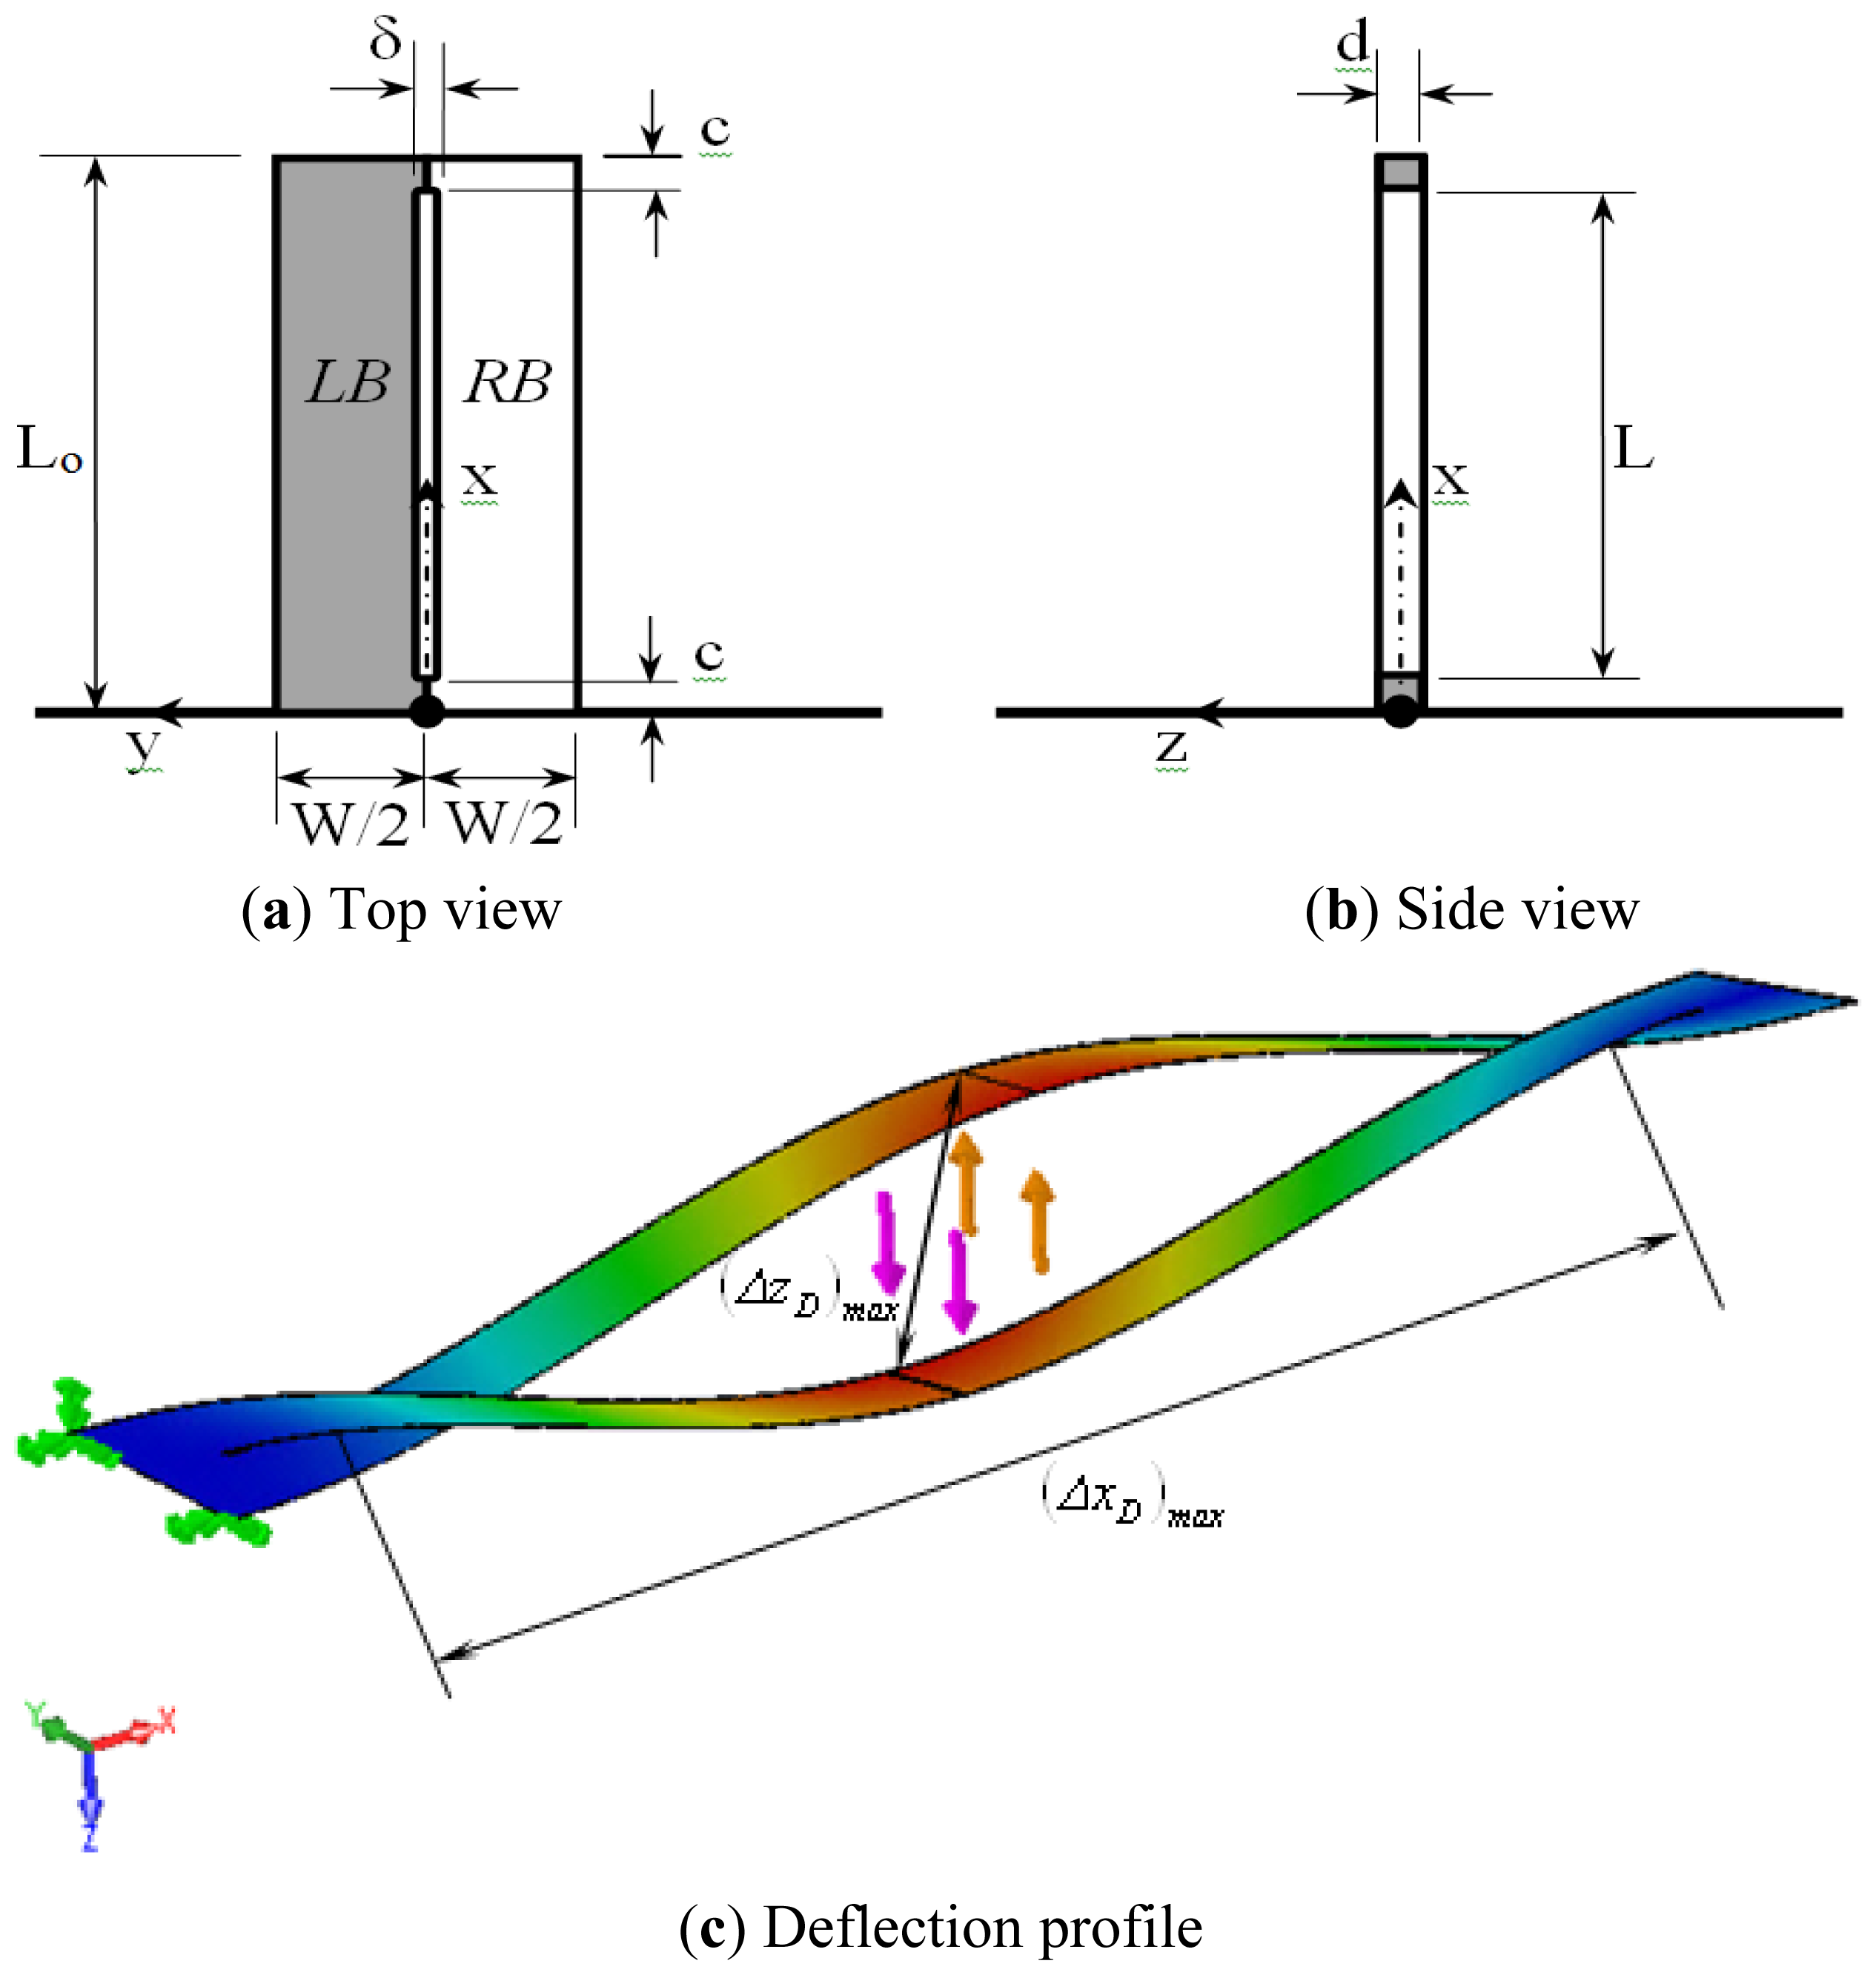
2.2. The Rectangular Microcatilever with a Long-slit
2.2.1. Deflections of the Rectangular Microcatilever with Long-slit
2.2.1.1. Concentrated Force Loadings
2.2.1.2. Prescribed Differential Surface Stress
2.2.2. The Disturbance in the Deflections of the Rectangular Microcantilever with Long-slit
3. Results and Discussion
3.1. Validation of the Results
3.2. Discussion of the Results
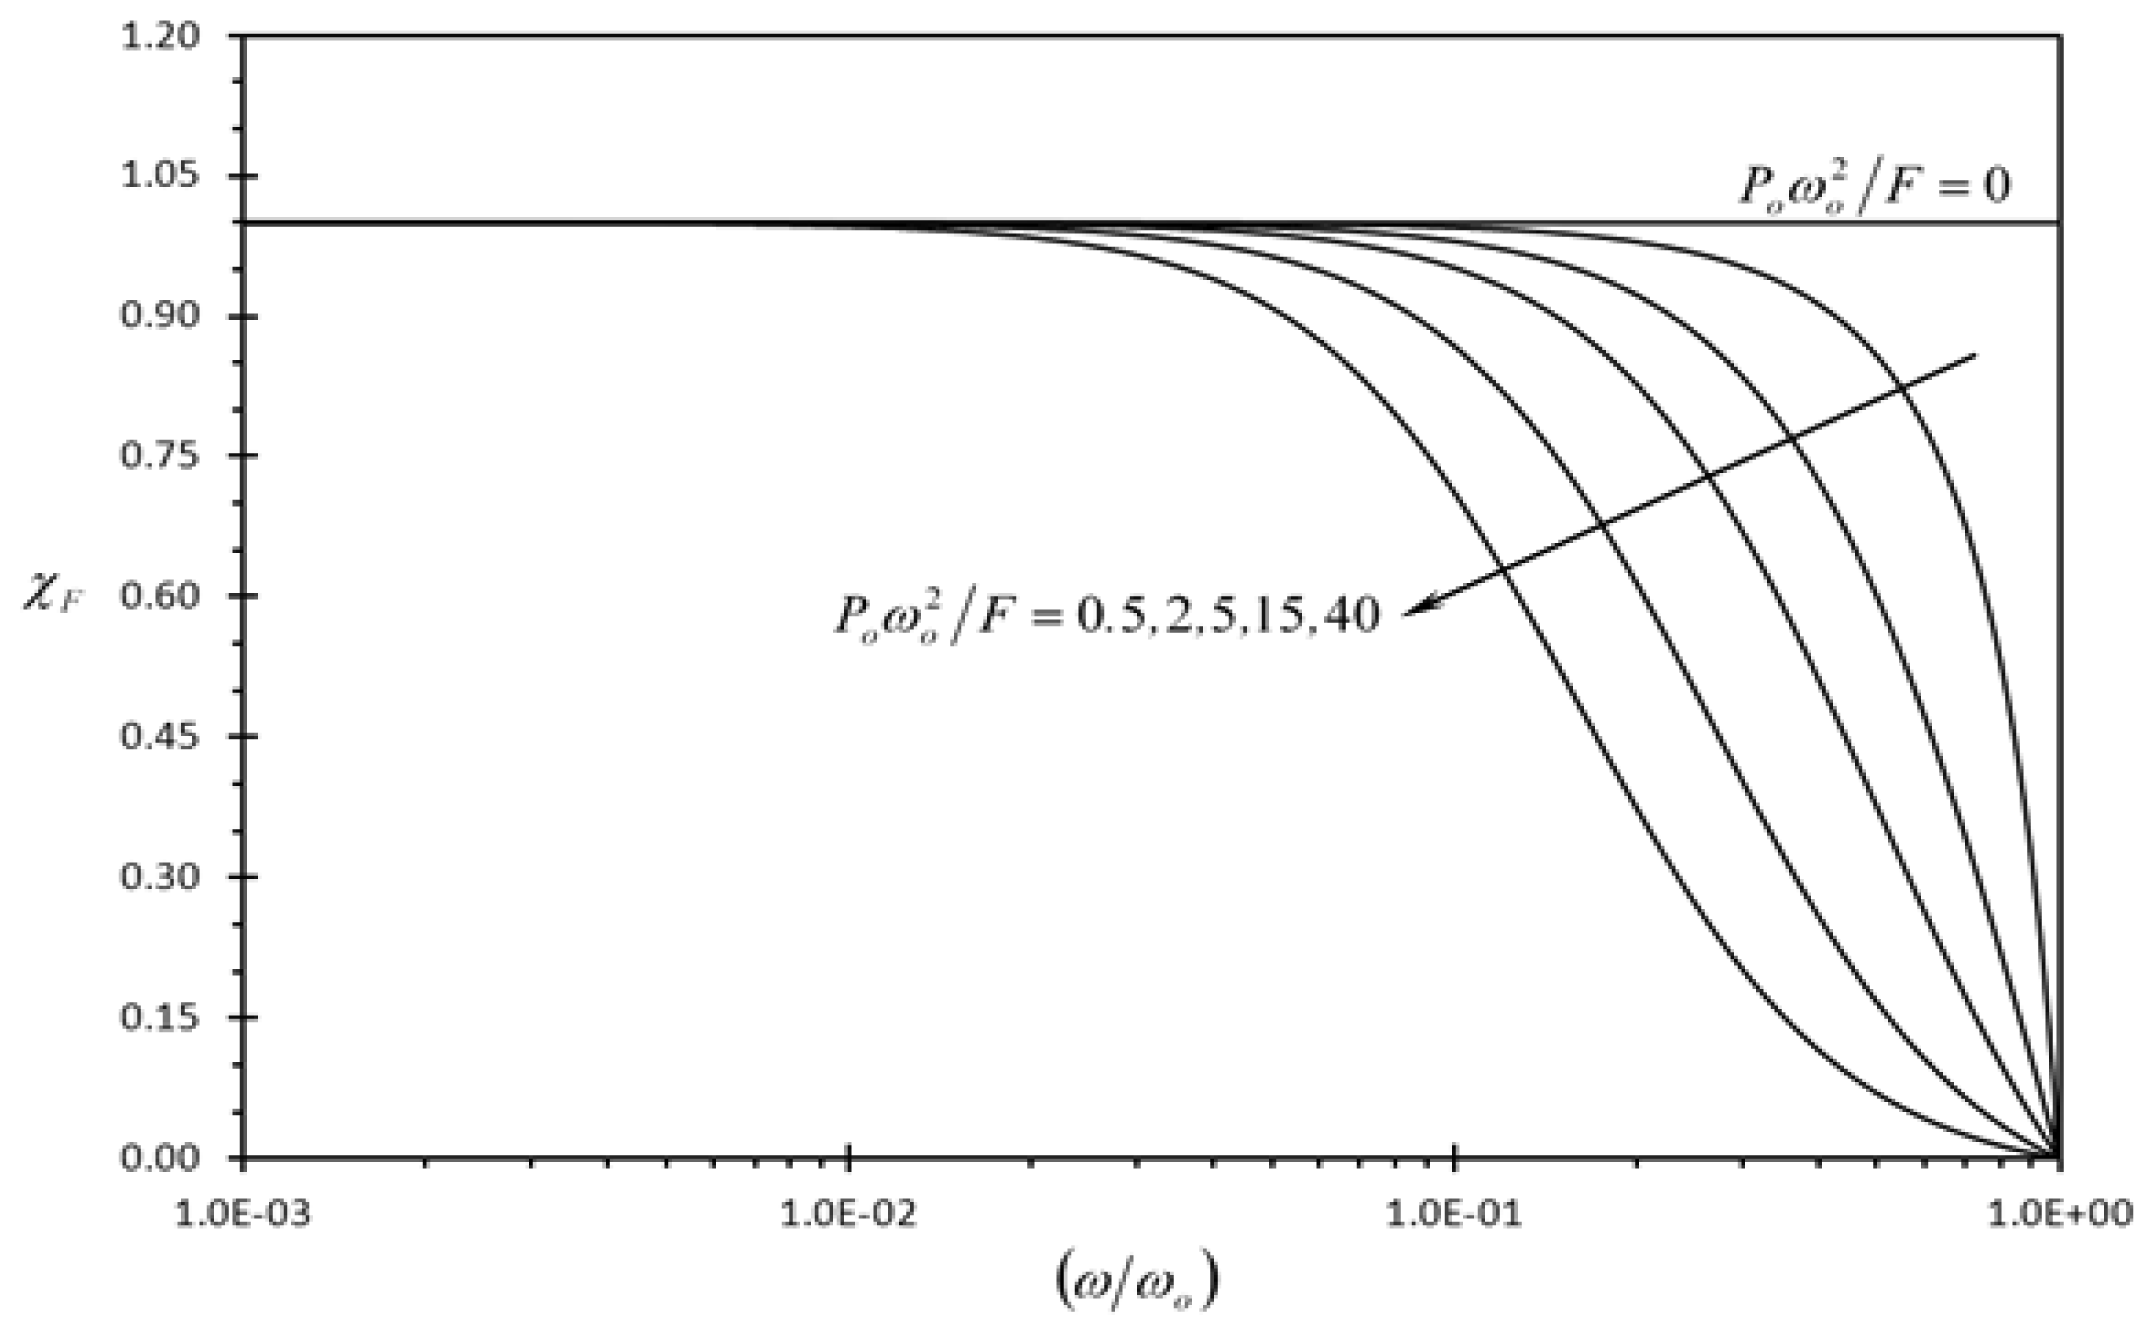
3.2.1. Discussion of the Results of First Detection Enhancement Indicator
3.2.2. Discussion of the Results of Clearness Indicator of Typical Rectangular Microcantilever
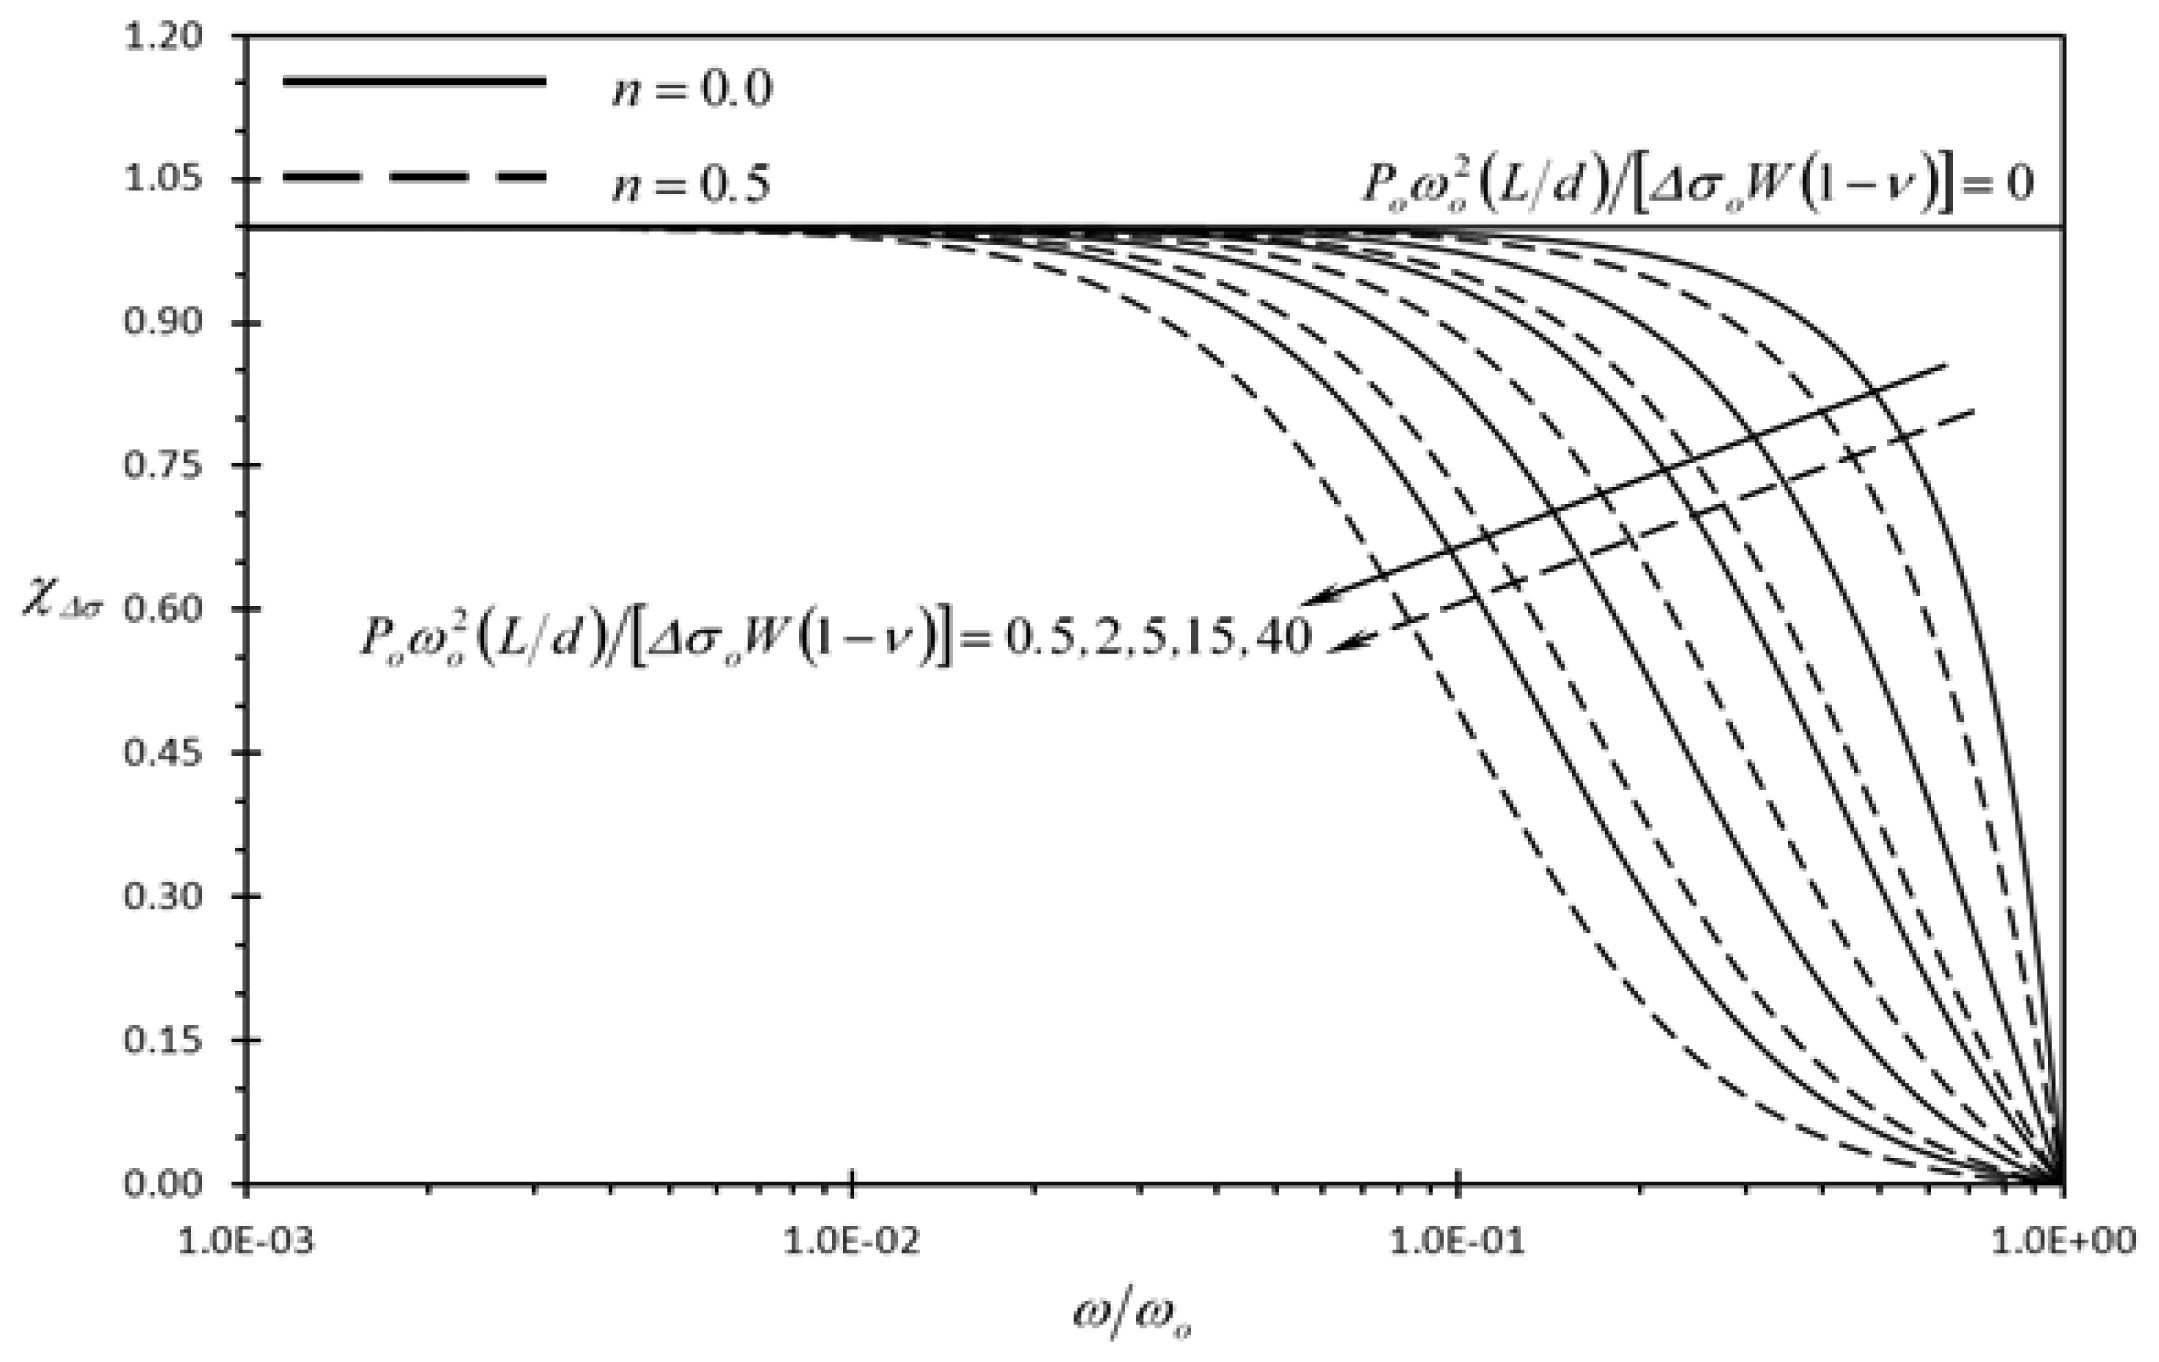
3.2.3. Discussion of the Results of Second Detection Enhancement Indicator
4. Conclusions
References
- Alkamine, S.; Barrett, R.C.; Quate, C.F. Improved atomic force microscope images using microcantilevers with sharp tips. Appl. Phys. Lett. 1990, 57, 316–318. [Google Scholar]
- Arntz, Y.; Seelig, J.D.; Lang, H.P.; Zhang, J.; Hunziker, P.; Ramseyer, J.P.; Meyer, E.; Hegner, M.; Gerber, C. Label-free protein assay based on a nanomechanical cantilever array. Nanotechnology 2003, 14, 86–90. [Google Scholar]
- Suri, C.R.; Kaur, J.; Gandhi, S.; Shekhawat, G.S. Label-free ultra-sensitive detection of atrazine based on nanomechanics. Nanotechnology 2008, 19, 235502–235600. [Google Scholar]
- Calleja, M.; Nordstrom, M.; Alvarez, M.; Tamayo, J.; Lechuga, L.M.; Boisen, A. Highly sensitive polymer-based cantilever-sensors for DNA detection. Ultramicroscopy 2005, 105, 215–222. [Google Scholar]
- Wu, G.; Ji, H.; Hansen, K.; Thundat, T.; Datar, R.; Cote, R.; Hagan, M.F.; Chakraborty, A.K.; Majumdar, A. Origin of nanomechanical cantilever motion generated from biomolecular interactions. Proc. Natl. Acad. Sci. USA 2001, 98, 1560–1564. [Google Scholar]
- Khaled, A.-R.A.; Vafai, K.; Yang, M.; Zhang, X.; Ozkan, C.S. Analysis, control and augmentation of microcantilever deflections in bio-sensing systems. Sens. Actuators B 2003, 94, 103–115. [Google Scholar]
- Boisen, A.; Thaysen, J.; Jensenius, H.; Hansen, O. Environmental sensors based on micromachined cantilevers with integrated read-out. Ultramicroscopy 2000, 82, 11–16. [Google Scholar]
- Zuo, G.; Li, X.; Zhang, Z.; Yang, T.; Wang, Y.; Cheng, Z.; Feng, S. Dual-SAM functionalization on integrated cantilevers for specific trace-explosive sensing and non-specific adsorption suppression. Nanotechnology 2007, 18. [Google Scholar] [CrossRef]
- Zhang, G.; Zhao, L.; Jiang, Z.; Yang, S.; Zhao, Y.; Huang, E.; Hebibul, R.; Wang, X.; Liu, Z. Suface stress-induced deflection of a microcantilver with various widths and overall microcantilever sensitivity enhancement via geometry modification. J. Phys. D Appl. Phys. 2011, 44. [Google Scholar] [CrossRef]
- Fritz, J.; Baller, M.K.; Lang, H.P.; Rothuizen, H.; Vettiger, P.; Meyer, E.; Güntherodt, H.-J.; Gerber, C.; Gimzewski, J.K. Translating biomolecular recognition into nanomechanics. Science 2000, 288, 316–318. [Google Scholar]
- Lee, H.J.; Chang, Y.S.; Lee, Y.P.; Jeong, K.-H.; Kim, H.-Y. Deflection of microcantilever by growing vapor bubble. Sens. Actuators A 2007, 136, 717–722. [Google Scholar]
- Jeon, S.; Jung, N.; Thundat, T. Nanomechanics of self-assembled monolayer on microcantilever sensors measured by a multiple-point deflection technique. Sens. Actuators B 2007, 122, 365–368. [Google Scholar]
- Yang, M.; Zhang, X.; Vafai, K.; Ozkan, C.S. High sensitivity piezoresistive cantilever design and optimization for an analyte-receptor binding. J. Micromech. Microeng. 2003, 13, 864–872. [Google Scholar]
- Vafai, K.; Ozkan, C.; Haddon, R.; Khaled, A.-R.A.; Yang, M. Microcantilevers for Biological and Chemical Assays and Methods of Making and Using Thereof. U.S. Patent 7,288,404, 30 October 2007. [Google Scholar]
- Zhu, Q.; Shih, W.Y.; Shih, W.-Y. Enhanced detection resonance frequency shift of a piezoelectric microcantilever sensor by a DC bias electric field in humidity detection. Sens. Actuators B 2008, 138, 1–4. [Google Scholar]
- Yen, Y.-K.; Huang, C.-Y.; Chen, C.-H.; Hung, C.-M.; Wu, K.-C.; Lee, C.-K.; Chang, J.-S.; Lin, S.; Huang, L.-S. A novel, eclectically protein-manipulated microcantilever biosensor for enhancement of capture antibody immobilization. Sens. Actuators B 2009, 141, 498–505. [Google Scholar]
- Ansari, M.Z.; Cho, C. Deflection, Frequency, and Stress Characteristics of Rectangular, Triangular, and Step Profile Microcantilevers for Biosensors. Sensors 2009, 9, 6046–6057. [Google Scholar]
- Vafai, K.; Khaled, A.-R.A. Innovative biosensors for chemical and biological assays. U.S. Patent 7,695,951, 13 April 2010. [Google Scholar]
- Khaled, A.-R.A.; Vafai, K. Optimization modelling of analyte adhesion over an inclined microcantilever-based biosensor. J. Micromech. Microeng. 2004, 14, 1220–1229. [Google Scholar]
- Khanafer, K.; Khaled, A.-R.A.; Vafai, K. Spatial optimization of an array of aligned microcantilever based sensors. J. Micromech. Microeng. 2004, 14, 1328–1336. [Google Scholar]
- Khanafer, K.; Vafai, K. Geometrical and flow configurations for enhanced microcantilever detection within a fluidic cell. Int. J. Heat Mass Transf. 2005, 48, 2886–2895. [Google Scholar]
- Vafai, K.; Khaled, A.-R.A. Methods and devices comprising flexible seals, flexible microchannels, or both for modulating or controlling flow and heat. U.S. Patent 7,770,809, 10 August 2010. [Google Scholar]
- Khaled, A.-R.A.; Vafai, K. Analysis of Deflection Enhancement Using Epsilon Assembly Microcantilevers Based Sensors. Sensors 2011, 11, 9260–9274. [Google Scholar]
- Rao, S.S. Mechanical Vibrations, 5th ed.; Addison-Wesley: New York, NY, USA, 2010. [Google Scholar]
- Sader, J. Frequency response of cantilever beams immersed in viscous fluids with applications to the atomic force microscope. J. Appl. Phys. 1998, 84, 64–76. [Google Scholar]
| Nomenclature | |
|---|---|
| c | clearance length for rectangular microcantilever with long-slit (μm) |
| d | microcantilever thickness (μm) |
| E | elastic modulus (N μm−2) |
| F | concentrated force (N) |
| I | area moment of inertia (μm4) |
| k | stiffness (N/μm) |
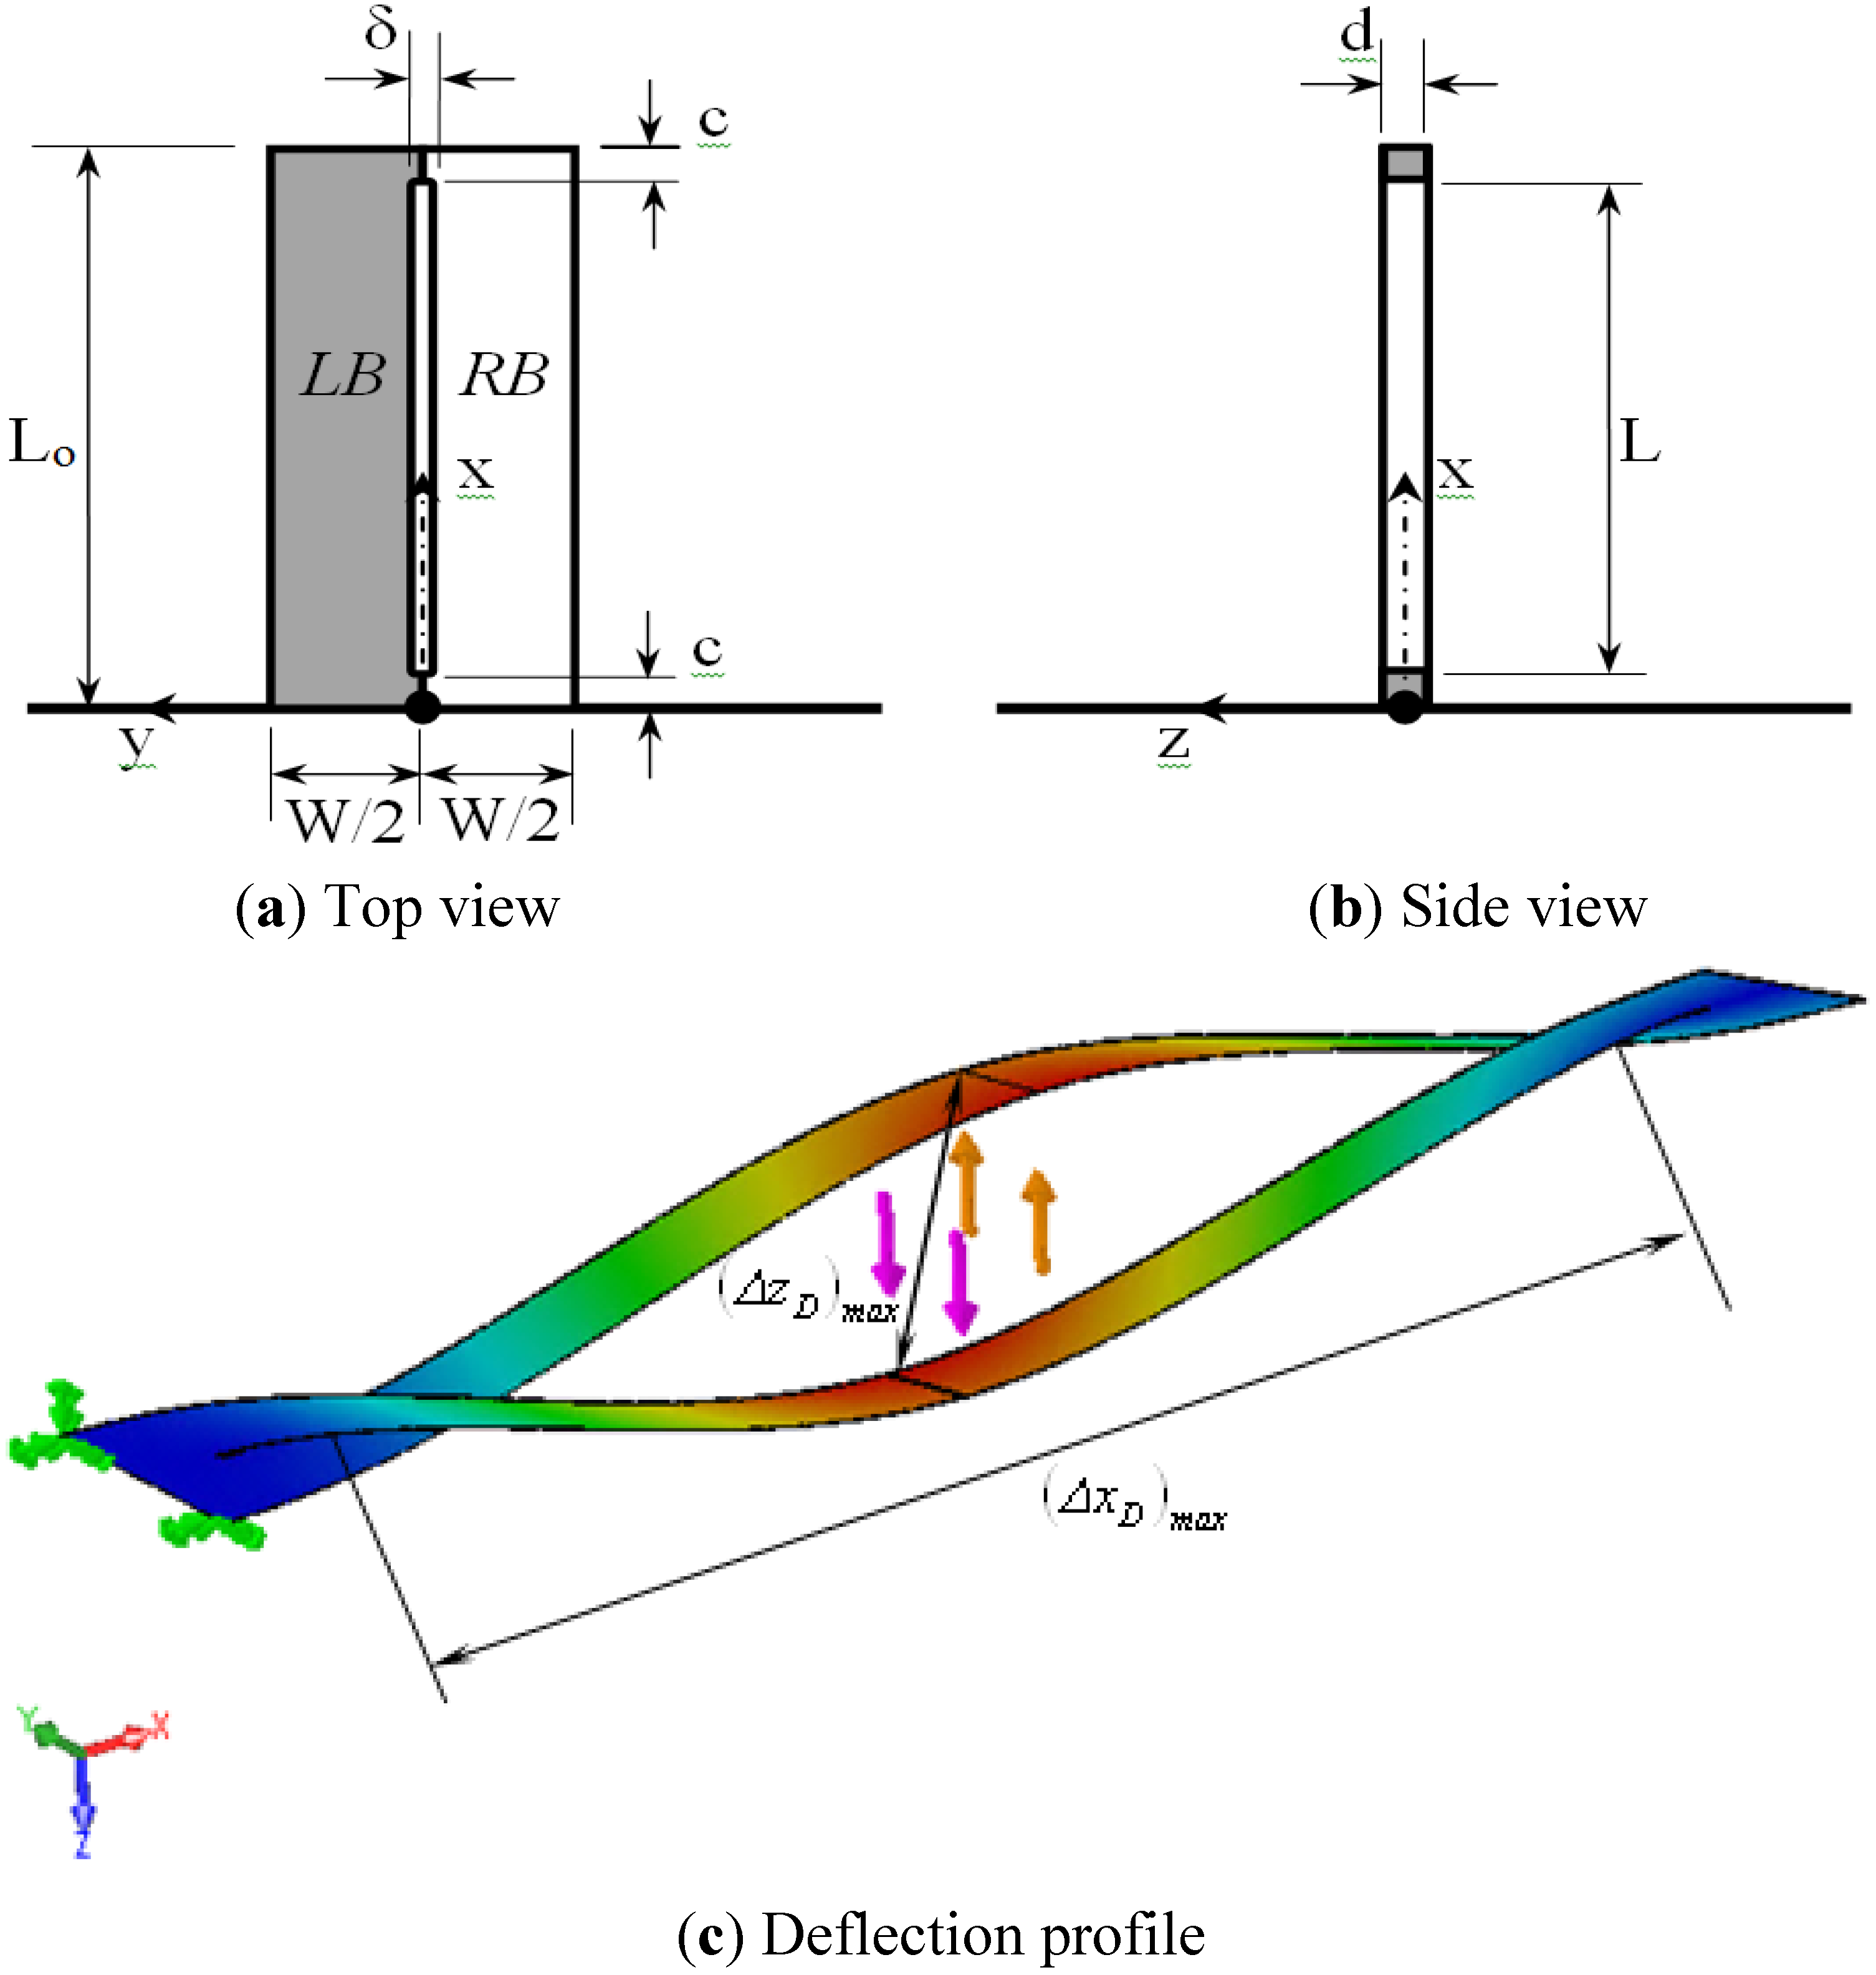
| L | typical rectangular microcantilever or slit length (μm) |
| Lo | length of rectangular microcatilever with long-slit (μm) |
| M | moment (N μm) |
| m | mass (kg) |
| n | surface stress model index |
| Po | dynamic disturbance force per square of frequency of disturbance (N s−2) |
| t | time variable (s) |
| W | total microcantilever width (μm) |
| x | axis of the extension dimension (μm) |
| Y | effective elastic modulus (N μm−2) |
| Z | first deflection indicator |
| z | deflection (μm) |
| zd | Amplitude of disturbance in deflection (μm) |
| Greek Symbols | |
|---|---|
| χ | detection clearness indicator |
| δ | slit thickness (μm) |
| γ1 | the first detection enhancement indicator |
| γ2 | the second detection enhancement indicator |
| λ | wavelength of the dynamic disturbance (μm) |
| ν | Poisson's ratio |
| σ | surface stress (N μm−1) |
| ω | dynamic disturbance frequency (s−1) |
| ωo | first natural frequency of typical rectangular microcantilever (s−1) |
| ωs | first natural frequency of rectangular microcantilever with long-slit (s−1) |
| Subscripts | |
|---|---|
| d | disturbance |
| F | concentrated force condition |
| Δσ | prescribed surface stress condition |
| eff | effective value |
| Abbreviations | |
|---|---|
| LB | left beam of the rectangular microcantilever with long-slit |
| RB | right beam of the rectangular microcantilever with long-slit |


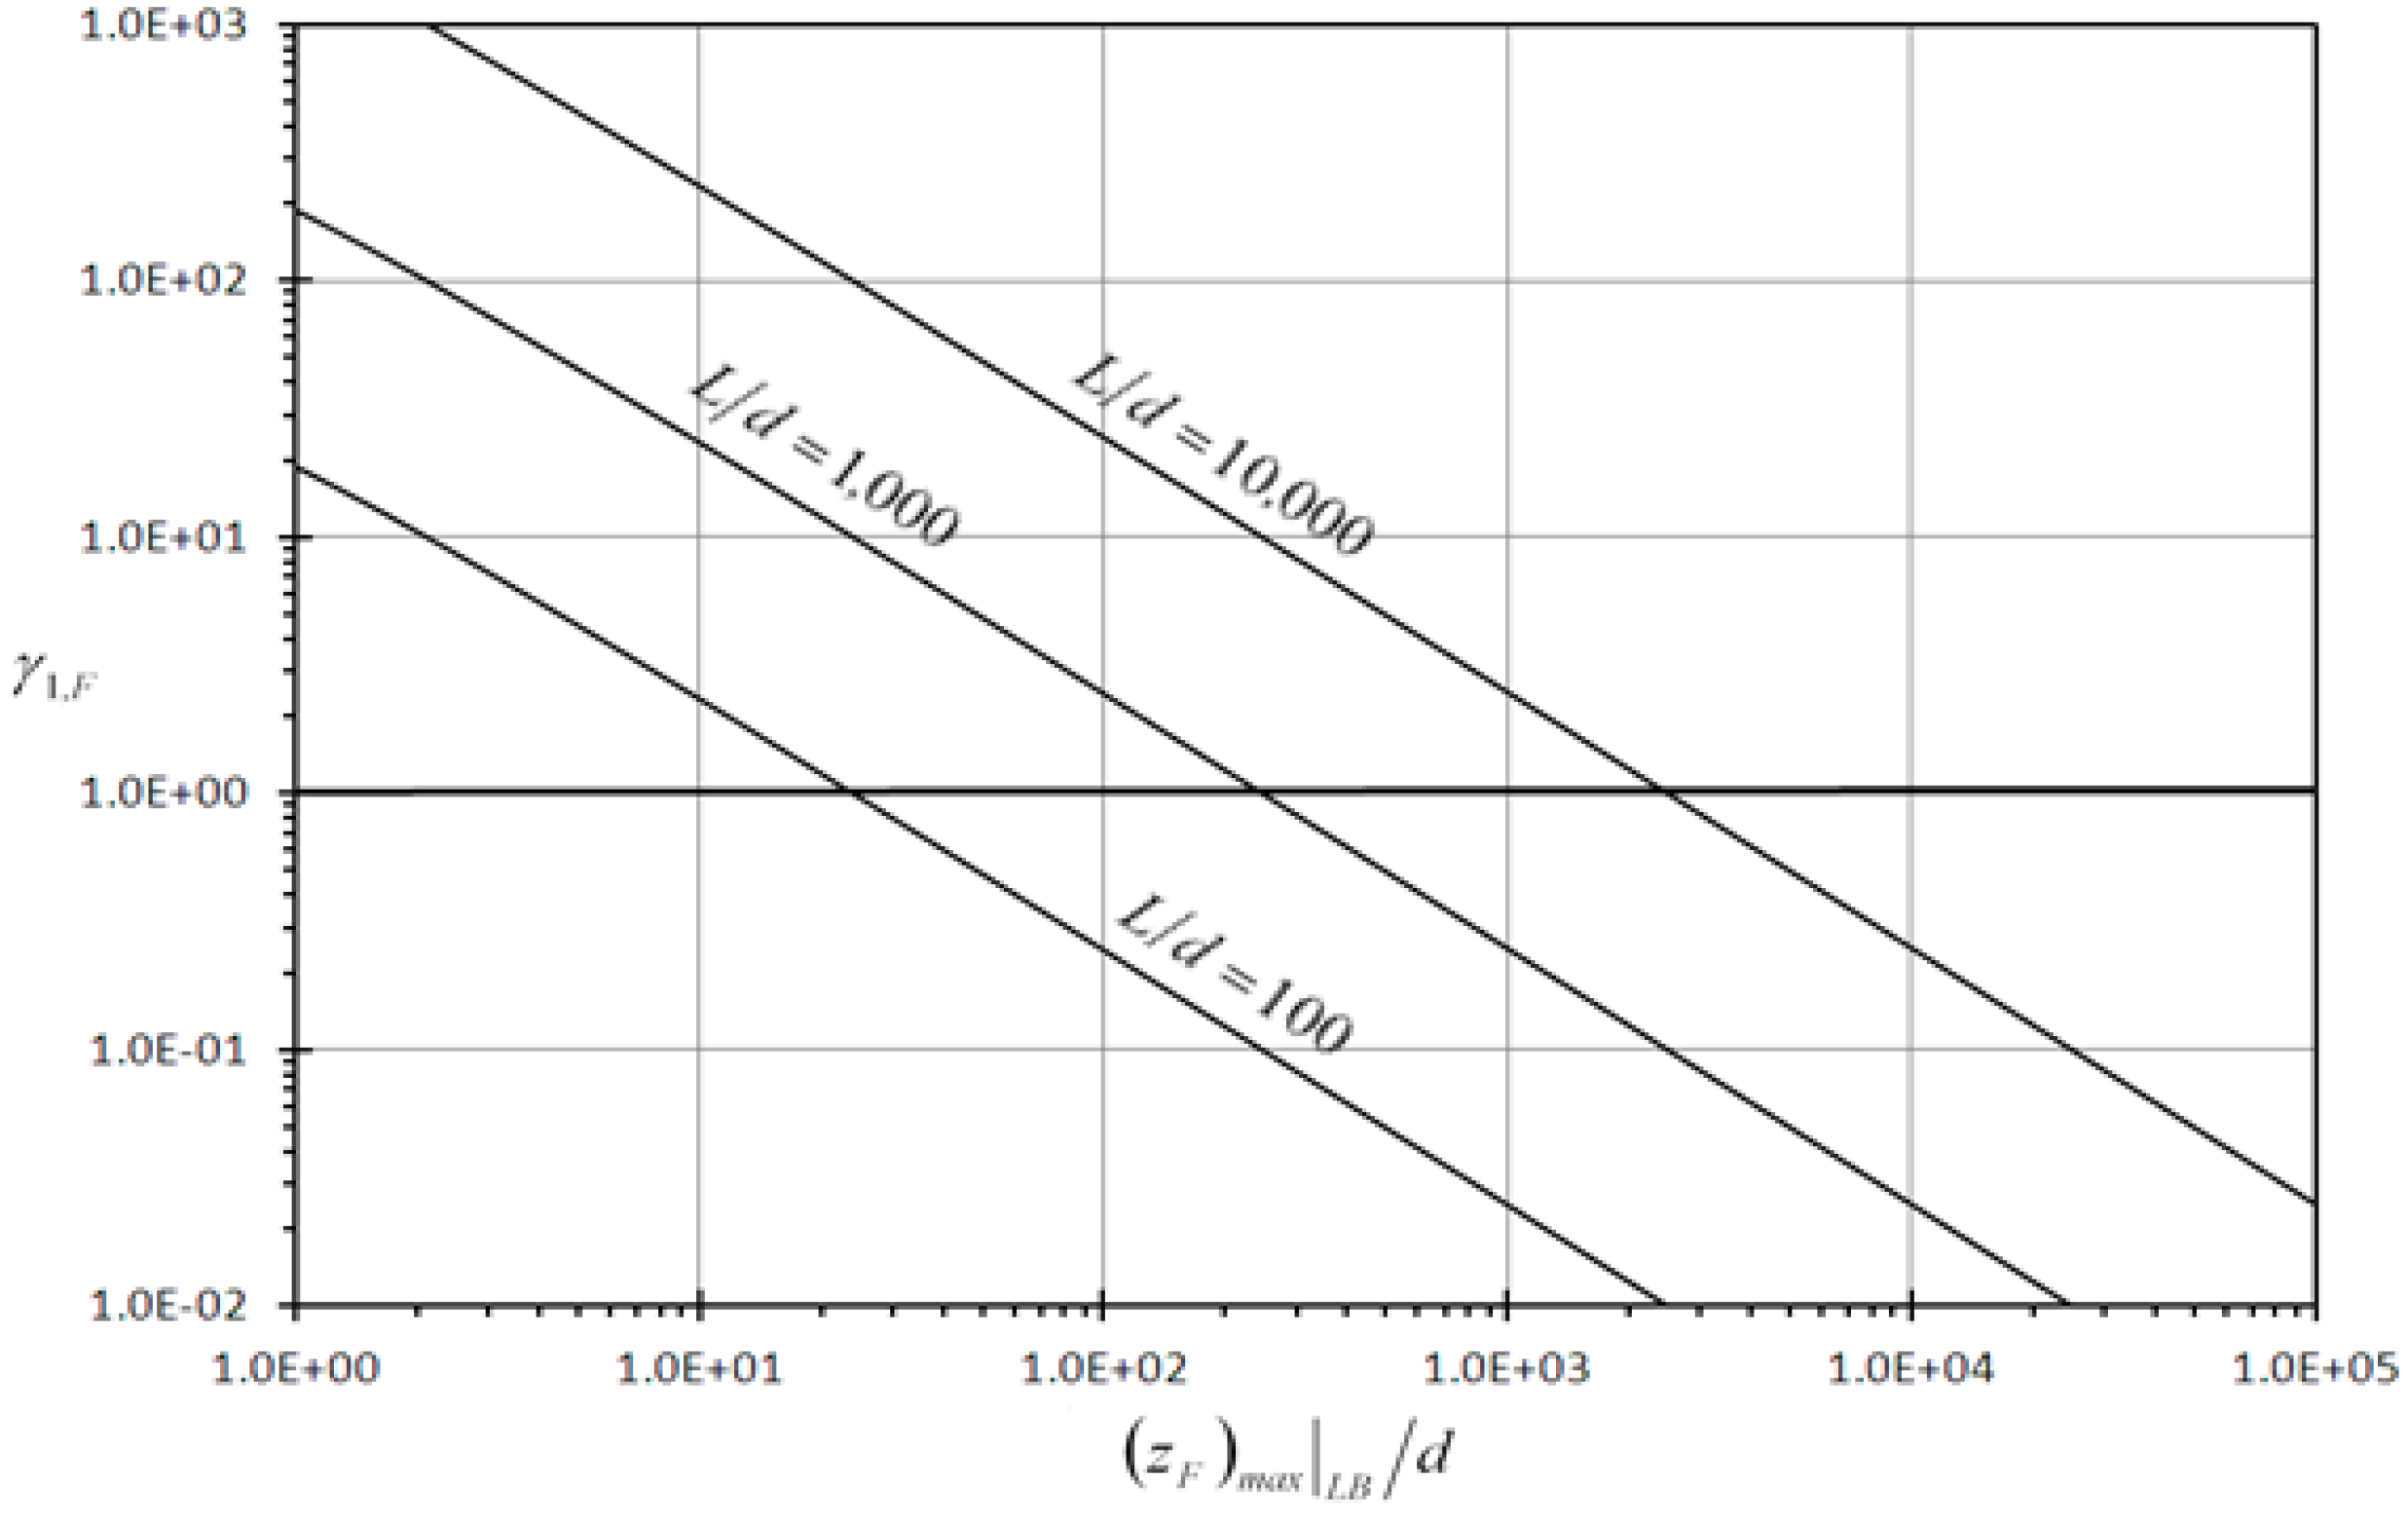
| (d/L) | 10−2 | 10−3 | 10−4 | 10−5 |
|---|---|---|---|---|
| [(zF)max∣LB/d]γF=1 | 23.928 | 246.81 | 2,490.1 | 24,969 |
| [(zF)max∣LB/d]γF=1 = 0.23467 ×exp(−1.00593×d/L) | ||||
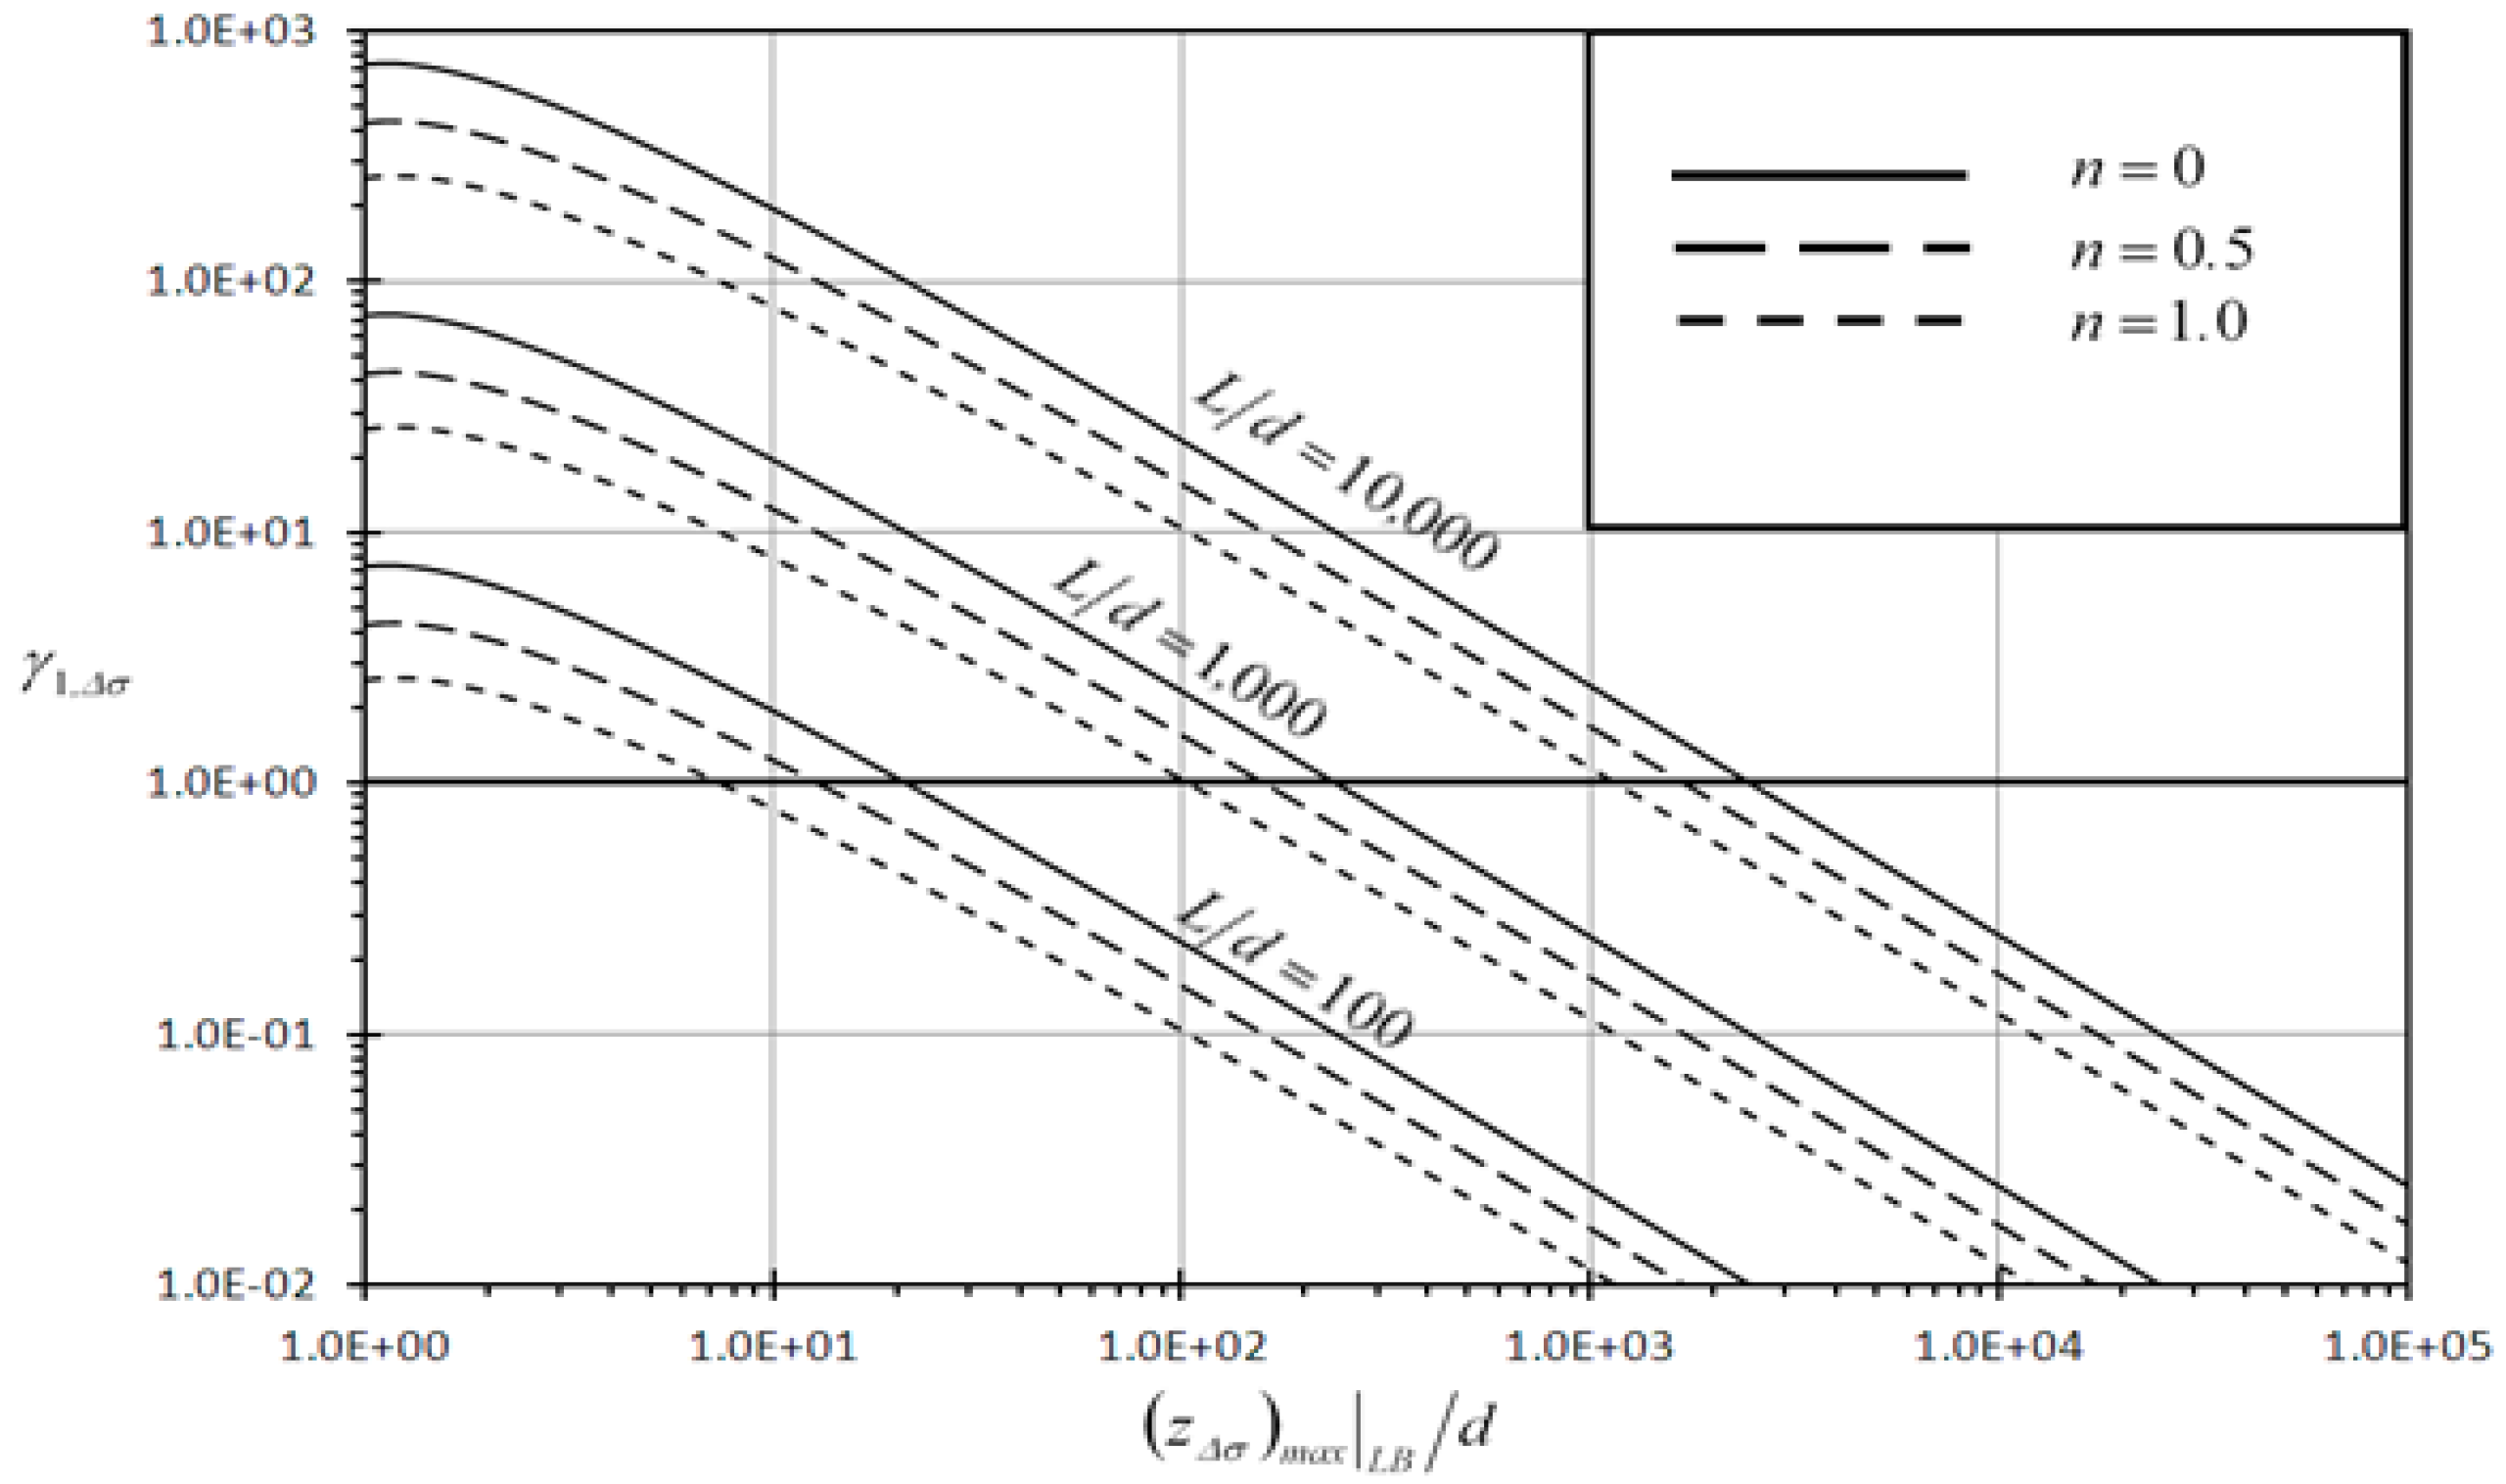
| n | (d/L) | [(zΔσ)max∣LB/d]∣γΔσ=1 | n | (d/L) | [(zΔσ)max|LB/d]∣γΔσ=1 |
|---|---|---|---|---|---|
| n = 0 | 10−2 | 21.157 | n = 1.0 | 10−2 | 7.4114 |
| 10−3 | 238.55 | 10−3 | 103.90 | ||
| 10−4 | 2,464.4 | 10−4 | 1155.5 | ||
| 10−5 | 24,888 | 10−5 | 12067 | ||
| n = 0.5 | 10−2 | 12.854 | n = 1.5 | 10−2 | 3.9373 |
| 10−3 | 159.14 | 10−3 | 66.535 | ||
| 10−4 | 1,699.3 | 10−4 | 775.55 | ||
| 10−5 | 17,408 | 10−5 | 8288.2 |
© 2013 by the authors; licensee MDPI, Basel, Switzerland. This article is an open access article distributed under the terms and conditions of the Creative Commons Attribution license (http://creativecommons.org/licenses/by/3.0/).
Share and Cite
Khaled, A.-R.A.; Vafai, K. Analysis of Detection Enhancement Using Microcantilevers with Long-Slit-Based Sensors. Sensors 2013, 13, 681-702. https://doi.org/10.3390/s130100681
Khaled A-RA, Vafai K. Analysis of Detection Enhancement Using Microcantilevers with Long-Slit-Based Sensors. Sensors. 2013; 13(1):681-702. https://doi.org/10.3390/s130100681
Chicago/Turabian StyleKhaled, Abdul-Rahim A., and Kambiz Vafai. 2013. "Analysis of Detection Enhancement Using Microcantilevers with Long-Slit-Based Sensors" Sensors 13, no. 1: 681-702. https://doi.org/10.3390/s130100681