Synthesis of a Cu2+-Selective Probe Derived from Rhodamine and Its Application in Cell Imaging

Abstract
: A new fluorescent probe P based on rhodamine for Cu2+ was synthesized and characterized. The new probe P showed high selectivity to Cu2+ over other tested metal ions. With optimal conditions, the proposed probe P worked in a wide linear range of 1.0 × 10⁻⁶−1.0 × 10⁻⁵ M with a detection limit of 3.3 × 10⁻⁷ M Cu2+ in ethanol-water solution (9:1, v:v, 20 mM HEPES, pH 7.0). Furthermore, it has been used for imaging of Cu2+ in living cells with satisfying results.1. Introduction
The selective detection of chemical species upon molecular recognition is of great significance in the host environment, particularly when the guest is ionic. Since fluoroionophores can provide chemical information on the ion concentrations, they are important subjects in metal ion analysis [1–5].
Among the metal ions, Cu2+ is one of the important targets, because it exhibits toxicity under overloading conditions, which can causes neurodegenerative diseases [6]. Thus, it is necessary to trace the concentration of Cu2+ in vitro and in vivo. Even though considerable efforts have been devoted to developing fluorescent probes for Cu2+ over the last few decades [7–9], it is still of great importance to develop new Cu2+-selective probes.
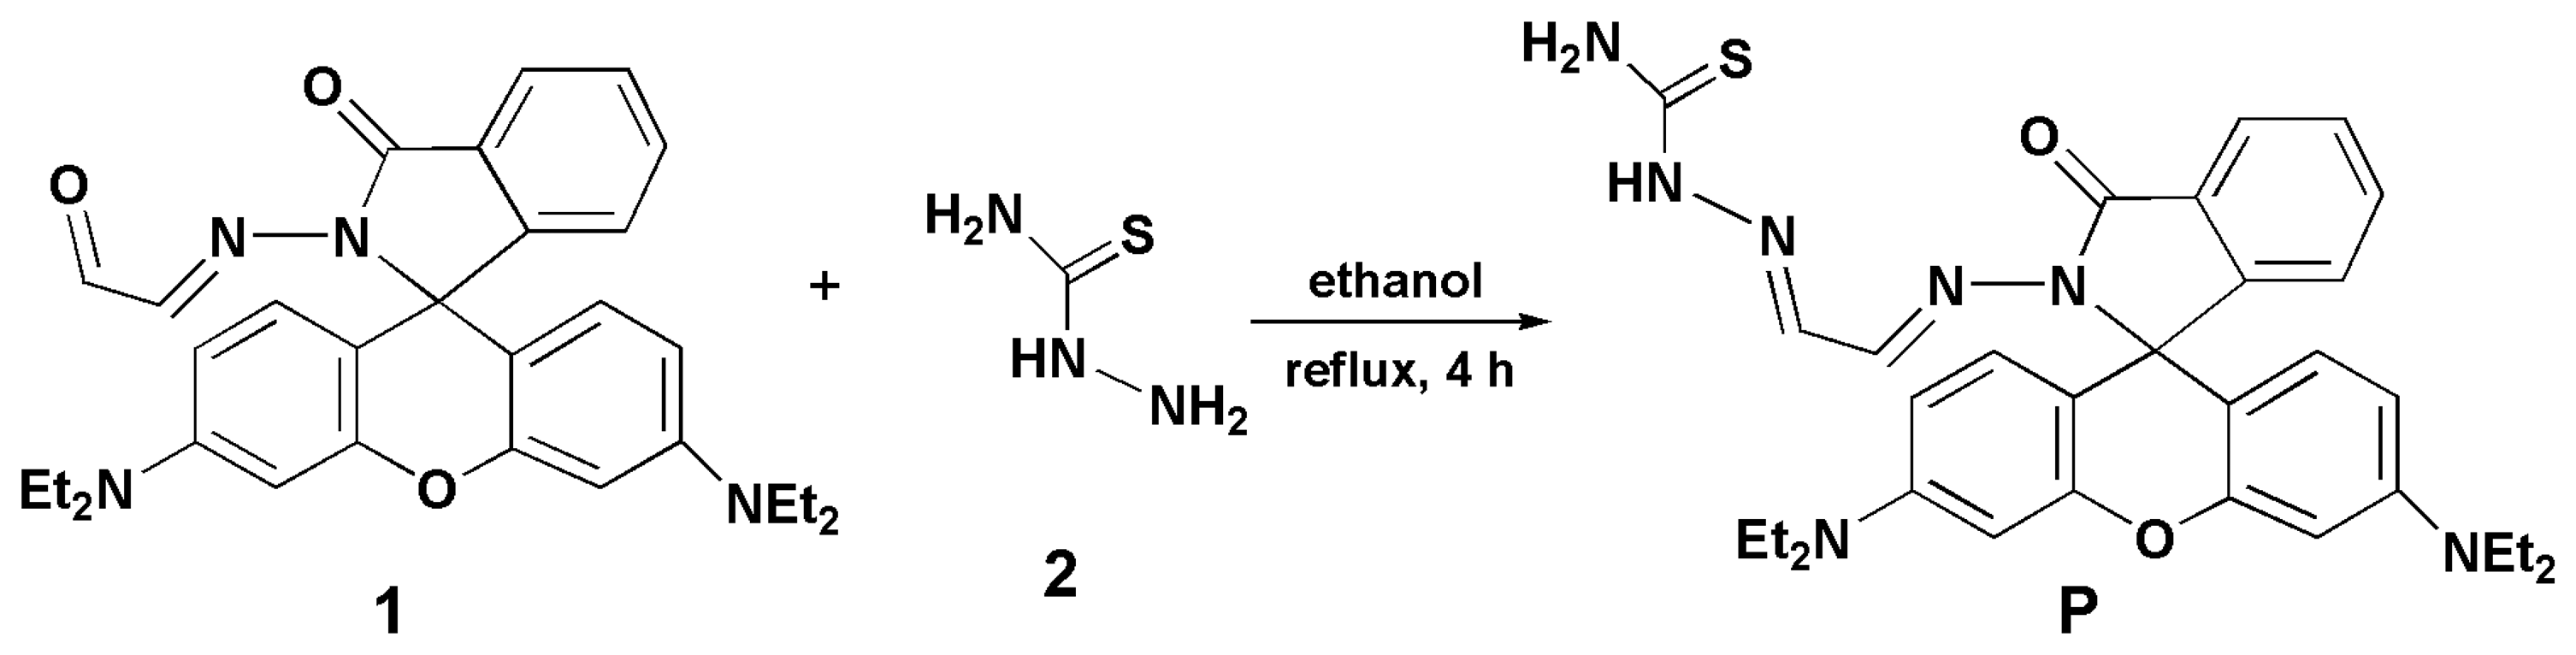
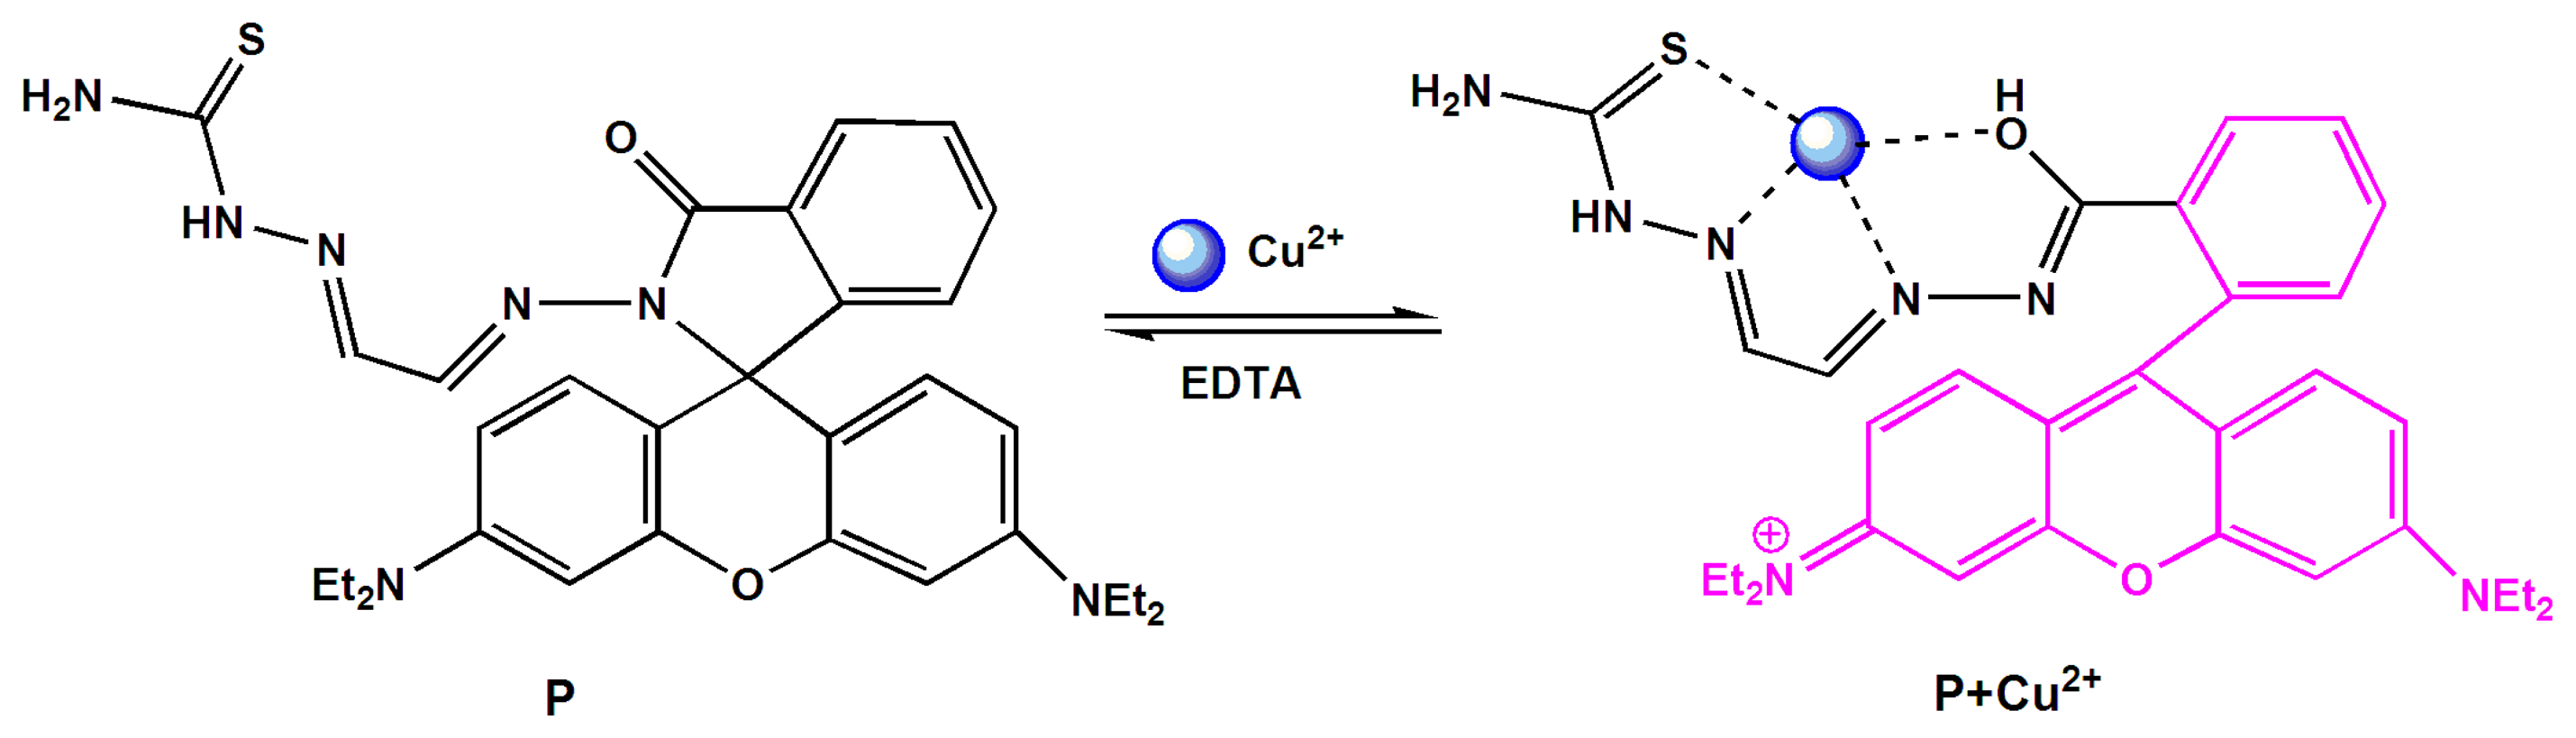
Owing to their excellent fluorescence properties, rhodamine dyes have been used extensively for conjugation with biomolecules [1,4,7]. Many rhodamine B derivatives have been used as fluorescent chemosensors for the detection of different metal ions [1,10,11]. Inspired by these research works, we report here a new fluorescent probe P based on a rhodamine B derivative for Cu2+ (Scheme 1). It showed a reversible “turn-on” fluorescent response for Cu2+ in aqueous solution with remarkably high sensitivity and selectivity. Moreover, it has been demonstrated that P can be used as a fluorescent probe for monitoring Cu2+ in living cells.
2. Experimental Section
2.1. Reagents and Instruments
All reagents and solvents are of analytical grade and used without further purification.
Nuclear magnetic resonance (NMR) spectra were measured with a Brucker AV 400 instrument, and chemical shifts were given in ppm from tetramethylsilane (TMS). Mass spectra (MS) were recorded on a Thermo TSQ Quantum Access Agilent 1100. Fluorescence emission spectra were conducted on a Hitachi 4600 spectrofluorometer. UV-Vis spectra were obtained on a Hitachi U-2910 spectrophotometer. Fluorescence imaging was performed by confocal fluorescence microscopy on an Olympus FluoView Fv1000 laser scanning microscope. pH was conducted with a pH-meter PBS-3C.
2.2. Synthesis of Compound P
Compound 1 [7] (1.0 mmol) and 2 (1.0 mmol) were stirred in ethanol (30 mL) at 80 °C for 4 h. After the reaction was finished, the precipitate so obtained was filtered and purified with silica gel column chromatography (Petroleum ether/acetic ether = 5:1, v/v) to afford P as a yellow solid. Yields: 67.2%. MS (ES+) m/z: 570.26 (M + H)+. 1H NMR (δ ppm, d6-DMSO): 11.58 (s, 1H), 8.62 (d, 1H, J = 8.28), 8.32 (s, 1H), 7.88 (d, 2H, J = 7.58), 7.58 (b, 2H), 7.54 (t, 1H, J = 7.22), 7.02 (d, 1H, J = 7.40), 6.42 (d, 3H, J = 8.68), 6.34 (d, 3H, J = 8.68), 3.33 (m, 8H, J = 7.42), 1.08 (t, 12H, J = 6.78). 13C NMR (δ ppm, d6-DMSO): 179.06, 165.27, 153.24, 152.69, 149.39, 147.19, 142.34, 135.17, 129.68, 128.52, 128.31, 124.57, 124.12, 109.00, 105.89, 98.39, 66.48, 44.56, 13.34 (Figures S1, Figures S2 and Figures S3).
2.3. General Spectroscopic Methods
Metal ions and probe P were dissolved in deionized water and DMSO to obtain 1.0 mM stock solutions, respectively. Before spectroscopic measurements, the working solution was freshly prepared by diluting the high concentration stock solution to the corresponding solution. For all of the measurements, excitation and emission slit widths were 10 nm, and the excitation wavelength was 520 nm.
2.4. Cell Incubation and Imaging
HepG2 cells placed on coverslips were washed with phosphate-buffered saline (PBS), followed by incubating with 1 μM of CuCl2 (in PBS) for 30 min at 37 °C, and then washed with PBS three times. After incubating with 10 μM of probe P for 30 min at 37 °C, the cells were washed with PBS three times again. Fluorescence imaging of intracellular Cu2+ in HepG2 cells was conducted by using a confocal fluorescence microscopy on an Olympus FluoView Fv1000 laser scanning microscope.
3. Results and Discussion
3.1. Effect of pH on P and P with Cu2+
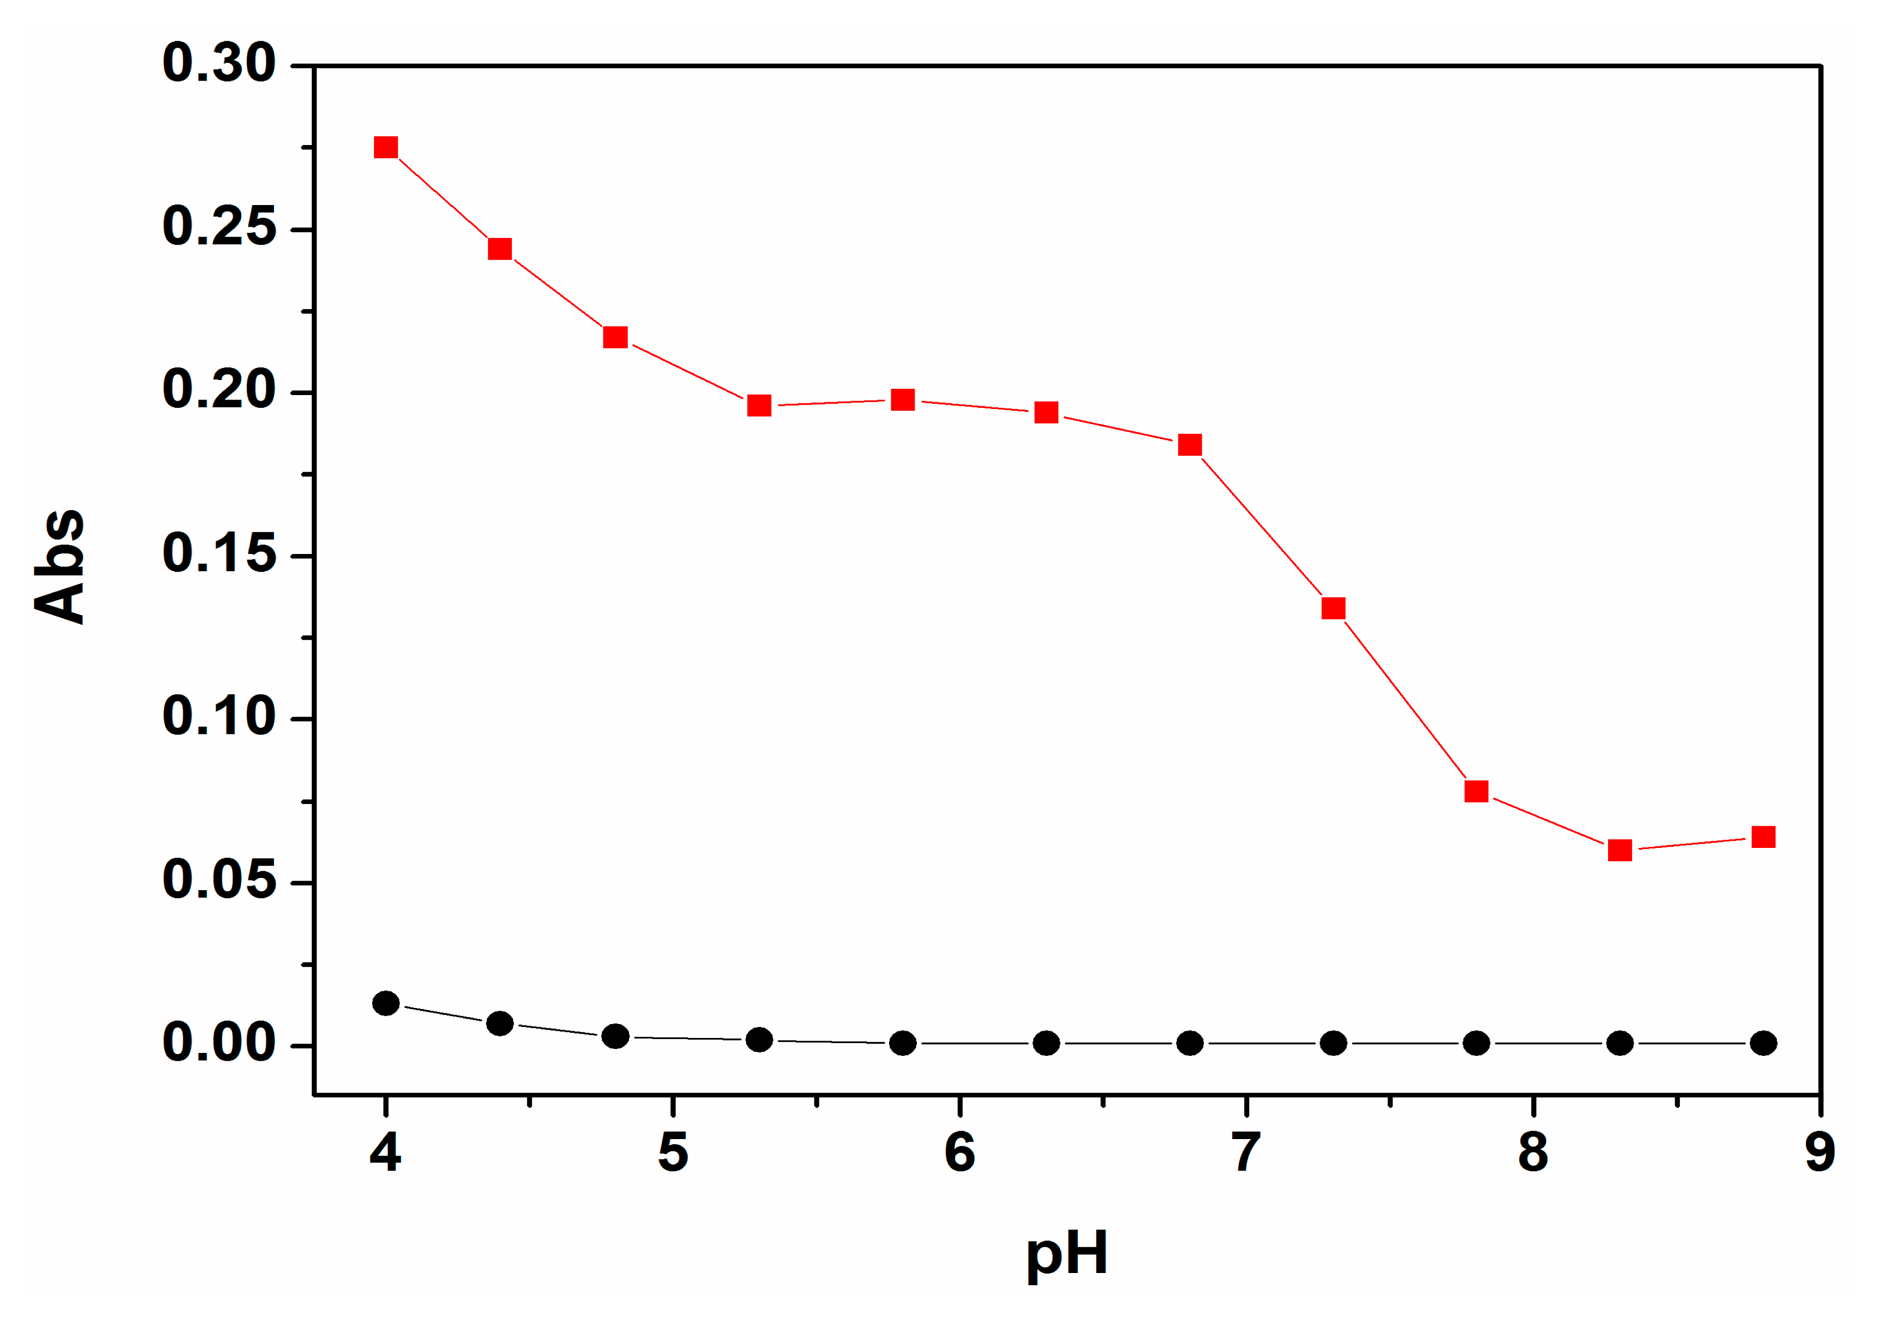
In order to investigate a suitable pH working range of P for the sensing of Cu2+, a pH titration experiment was performed firstly (Figure 1). The results showed that the absorption of the free probe P can be negligible under a pH range from 4 to 9. After the addition of Cu2+, the absorption of probe P at 560 nm rapidly increased to a maximum value. The results showed that the probe P can be worked within a wide pH range of 5.3–7.0. As the pH of a natural water body is near neutral, therefore, further UV-Vis and fluorescent studies were carried out in ethanol-water solution (9:1, v:v, 20 mM HEPES, pH 7.0).
3.2. UV-Vis Spectral Response of P
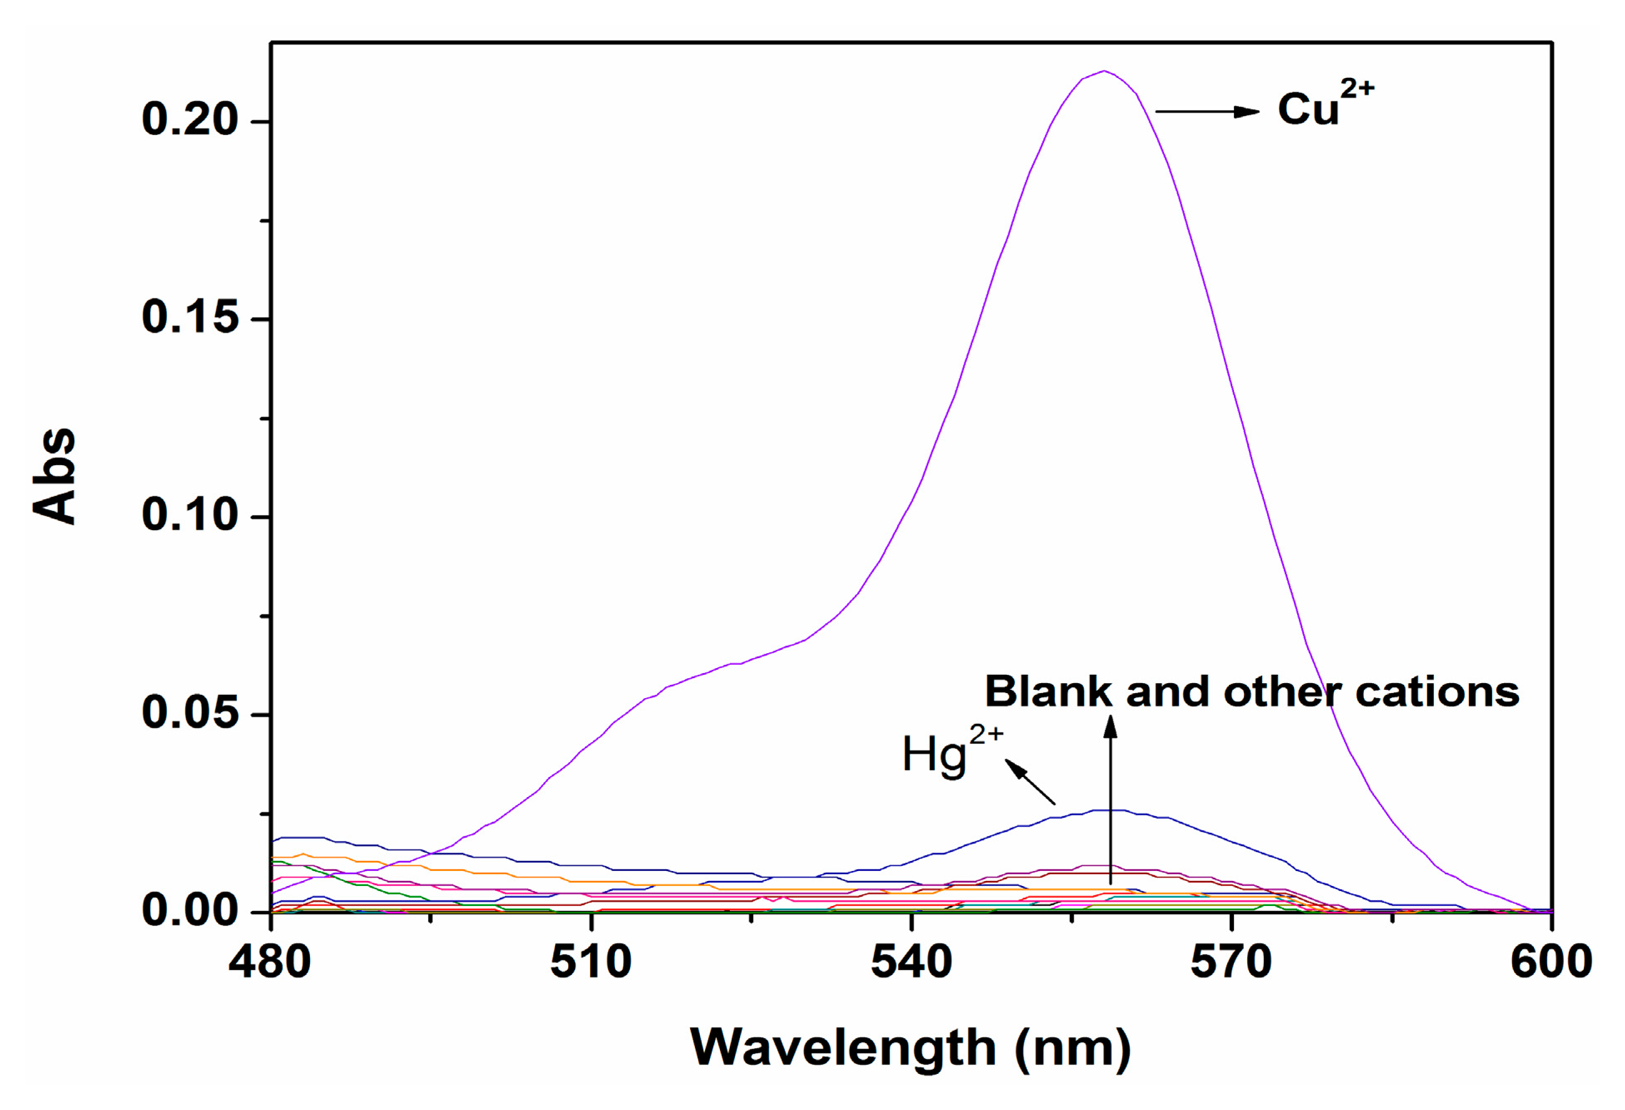
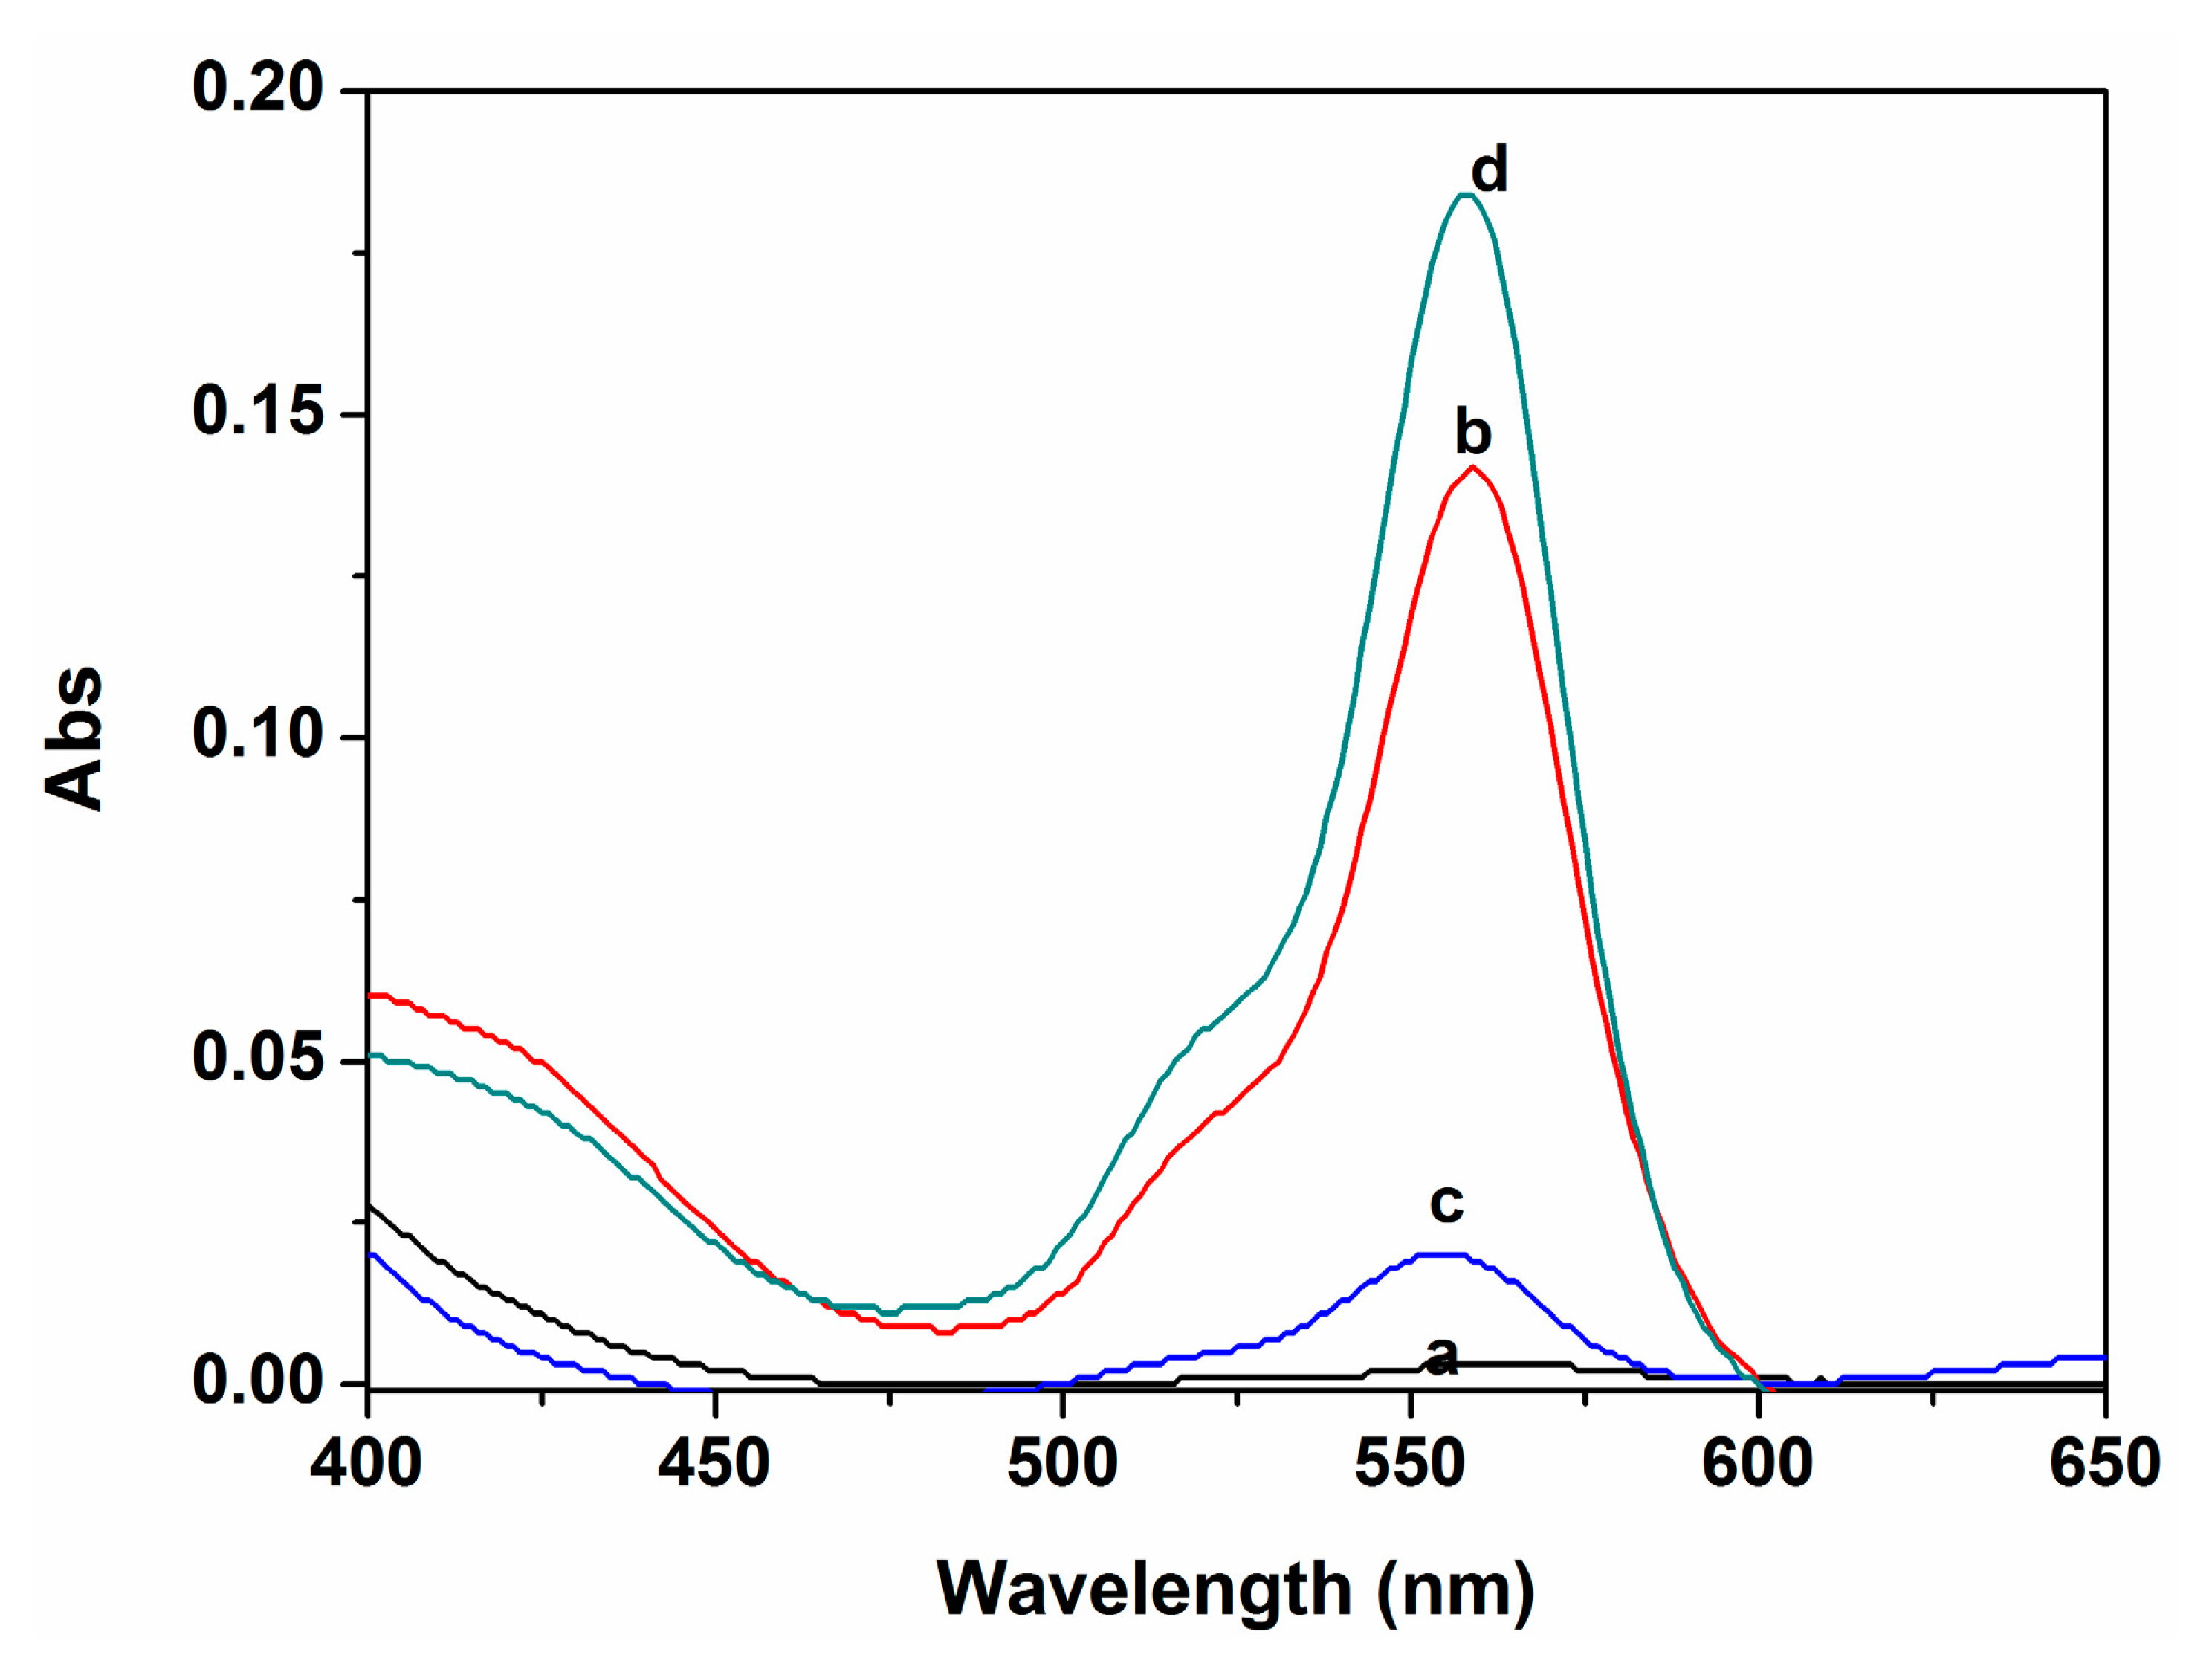
As expected, probe P alone was colorless and scarcely showed absorption in the 500–600 nm region in ethanol-water solution (9:1, v:v, 20 mM HEPES, pH 7.0). However, upon addition of Cu2+, an intense absorption band centered at 560 nm appeared, presumably because of the chelation of Cu2+ with the nitrogen atom of the amide group of P, which resulted in the formation of the open-ring form of rhodamine B. At the same time, other related metal ions (K+, Na+, Ca2+, Mg2+, Zn2+, Pb2+ Co2+, Cd2+, Cr3+, Ni2+, Hg2+, Ag+, Fe3+ and Al3+) did not show any obvious absorption under similar conditions (Figure 2).
3.3. Fluorescence Spectral Response of P
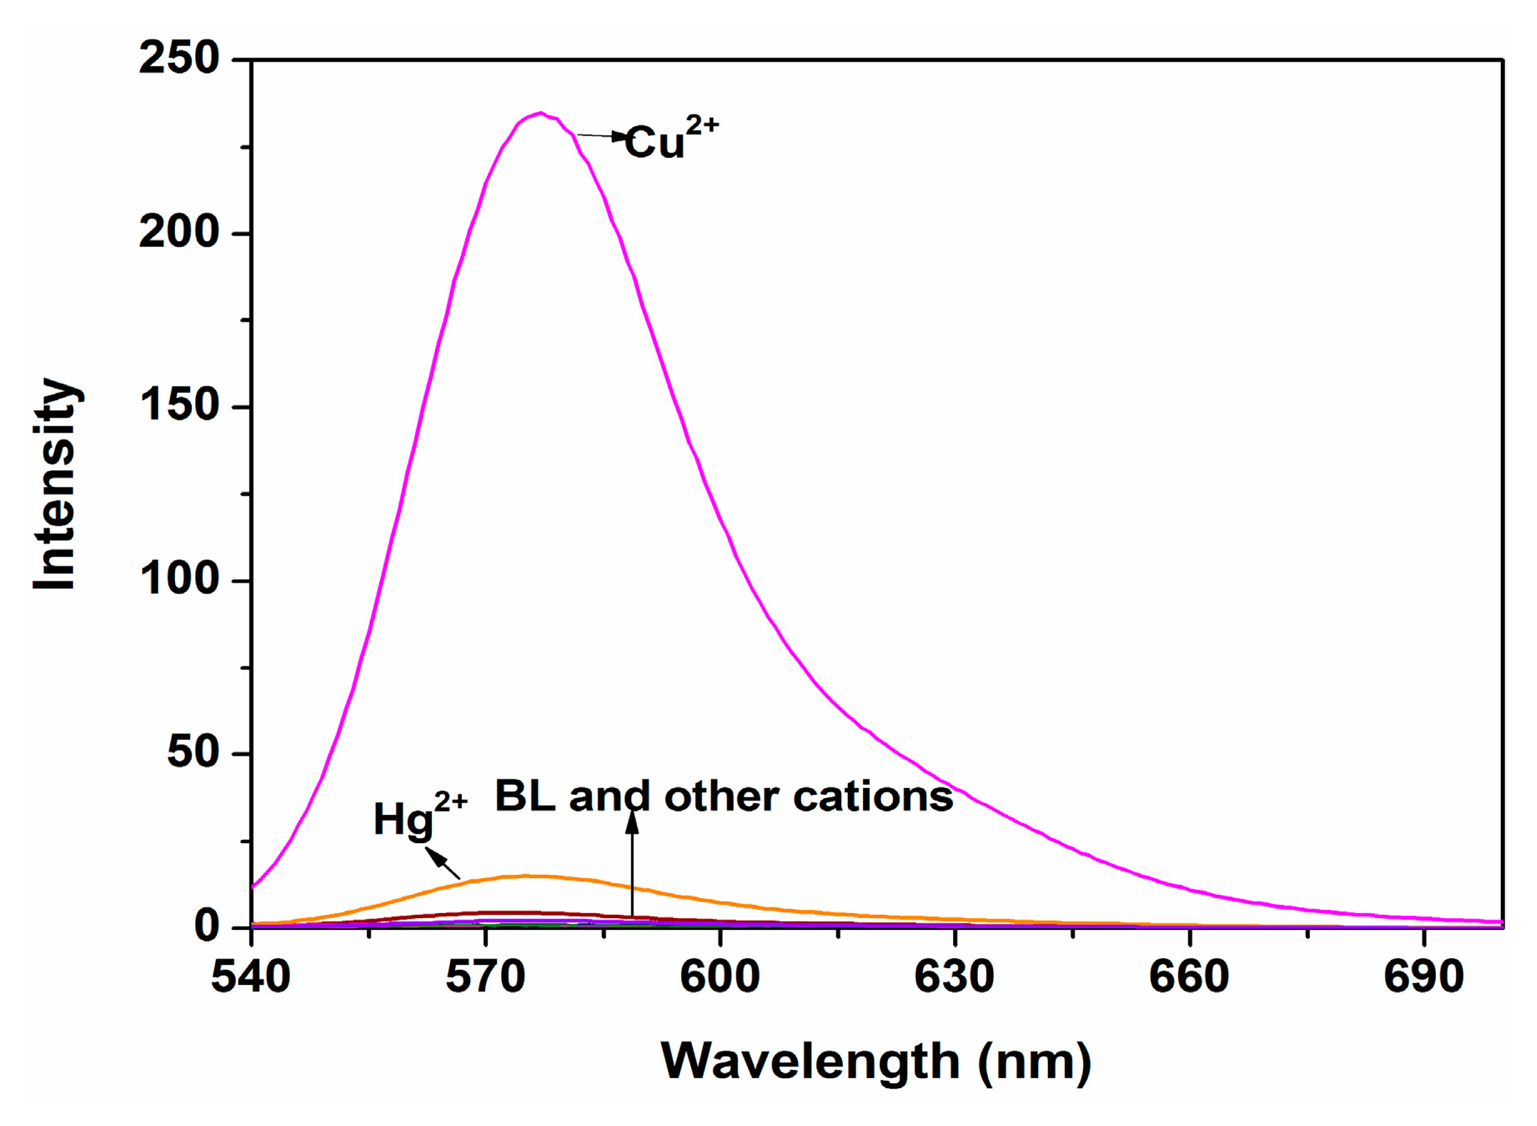
To further evaluate the selectivity of probe P, the fluorescence spectra (ex = 520 nm) of P (10 μM) were investigated in ethanol-water solution (9:1, v:v, 20 mM HEPES, pH 7.0) with the addition of respective metal ions (100 μM) (Figure 3). Compared with other tested ions, only Cu2+ generated a significant “turn-on” fluorescence response of the monomeric peak at 577 nm with a fluorescence enhancement up to 200-fold, and Hg2+ had negligible interference. These results suggested that P had a higher selectivity toward Cu2+ than the other metal ions.
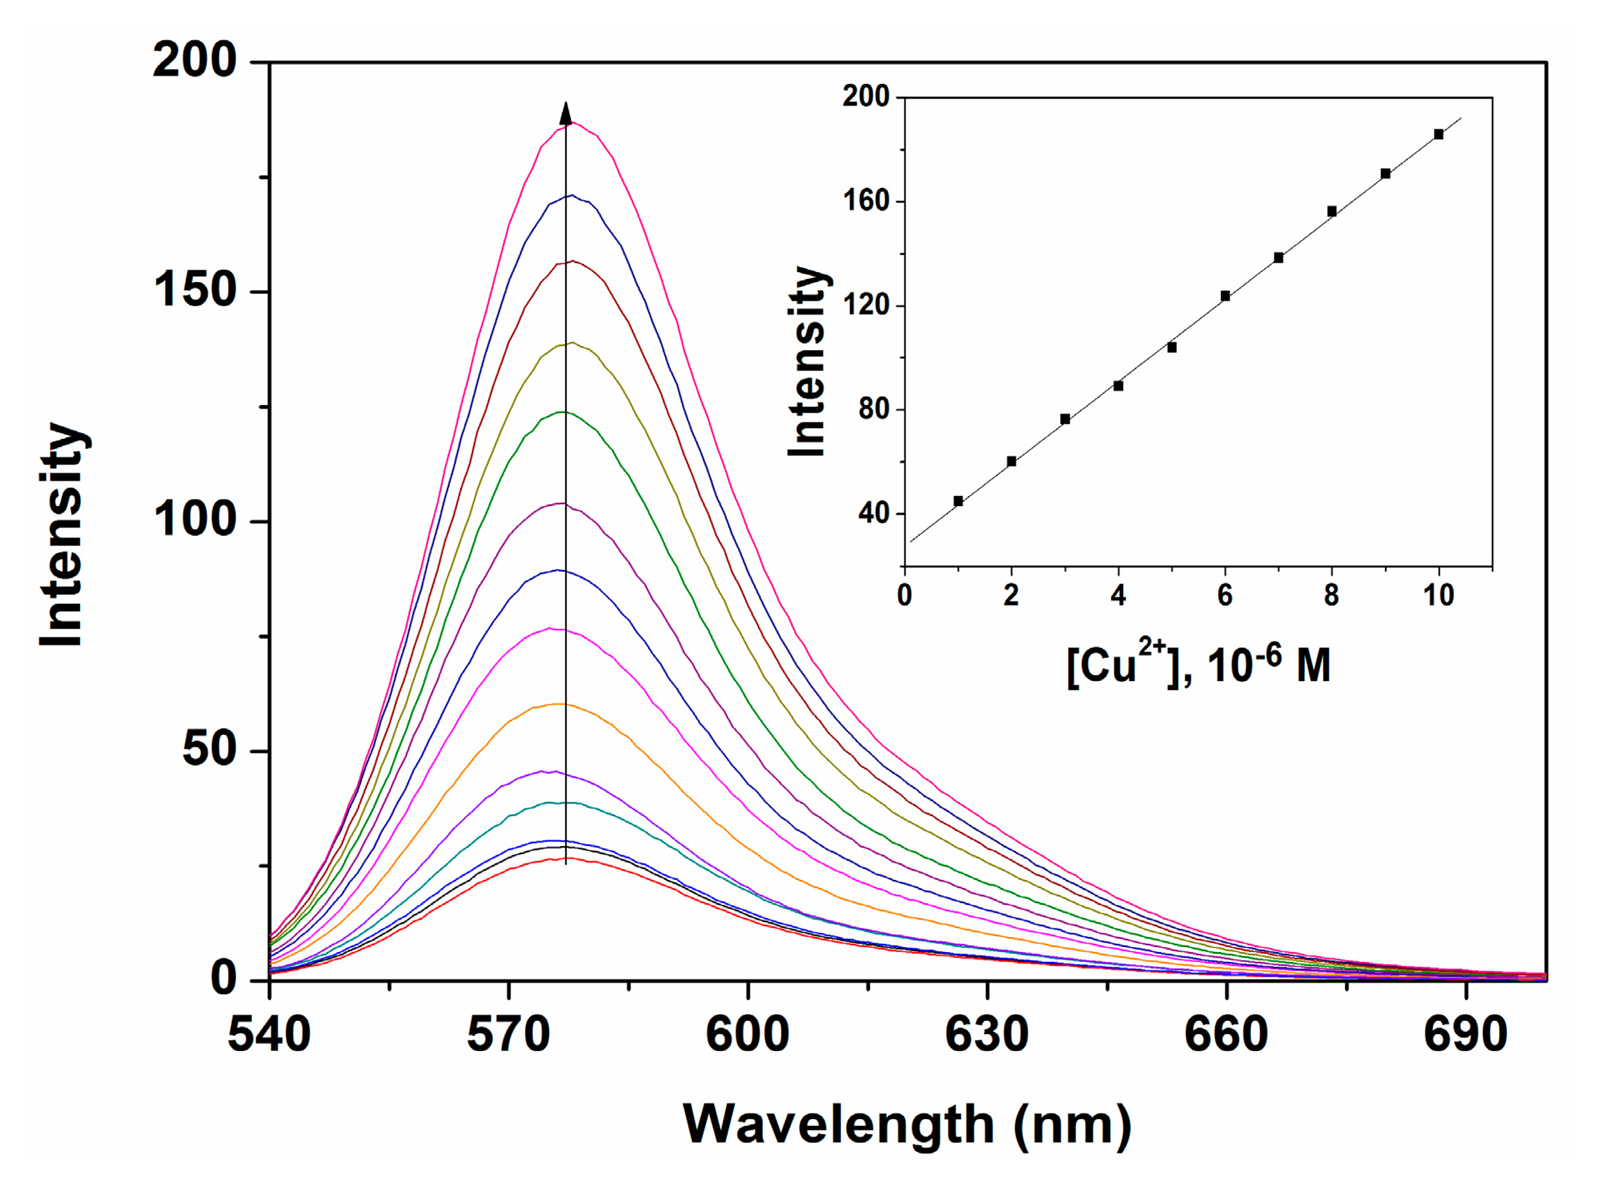
In order to investigate further the interaction of Cu2+ with P, a fluorescent titration experiment was carried out. The results showed that the fluorescence intensity of P was enhanced at 577 nm upon the addition of various amounts of Cu2+ in ethanol-water solution (9:1, v:v, 20 mM HEPES, pH 7.0), as depicted in Figure 4. Under the present conditions, when P was employed at the 10-μM level, the fluorescent intensity of P was proportional to the concentration of Cu2+ in the range from 1.0 × 10⁻⁶ to 1.0 × 10⁻⁵ M with a detection limit of 3.3 × 10⁻⁷ M Cu2+. This clearly demonstrated that chemosensor P could sensitively detect environmentally relevant levels of Cu2+.
3.4. Proposed Reaction Mechanism of P with Cu2+
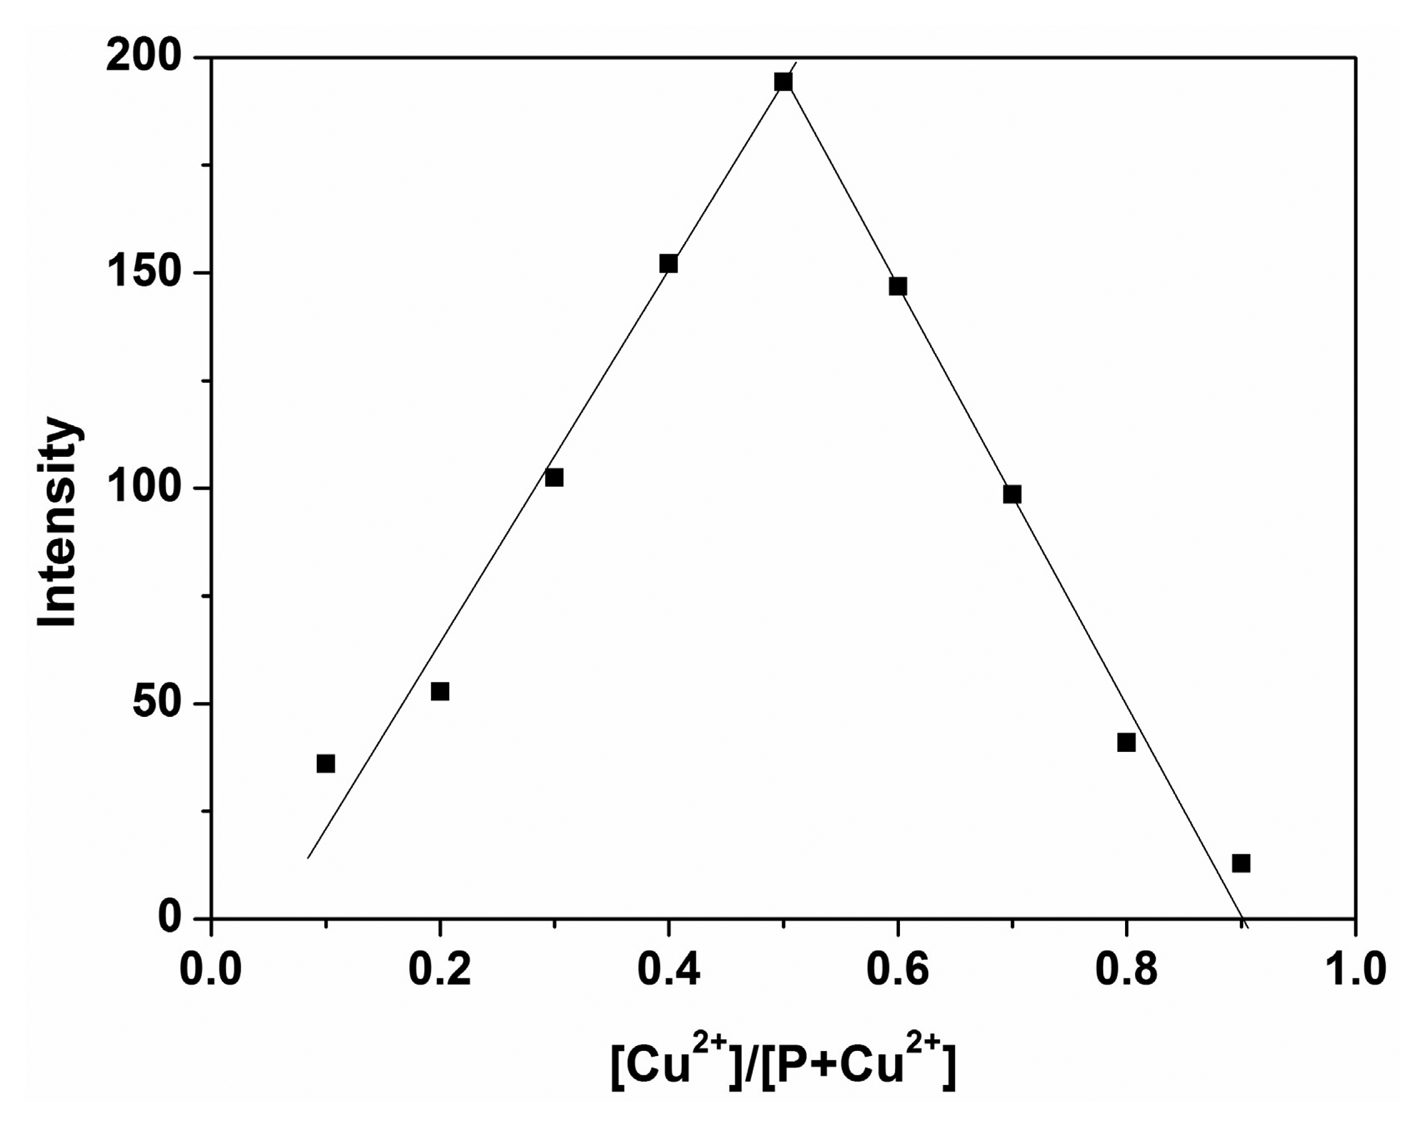
According to the obtained results above, the reaction mechanism is very likely due to the metal ion-induced ring opening of rhodamine spirolactam, rather than other possible reactions [12]. The Job's plot experiment was also explored to study the coordination mode of P with Cu2+, which confirmed a 1:1 stoichiometry for the P-Cu2+ complex and strongly supported the above conclusion (Figure 5). Thus, according to the obtained results, the coordination mode between P and Cu2+ was proposed as shown in Scheme 2.
On the other hand, the response of P to Cu2+ was confirmed to be reversible by the EDTA titration. Upon addition of 50 μM EDTA to the mixture of P (10 μM) and Cu2+ (10 μM) in ethanol-water solution (9:1, v:v. 20 mM HEPES, pH 7.0), the color changed from pink to almost colorless, and a ∼93% fluorescent emission intensity of the system was quenched (Figure 6), which suggested that the EDTA replaced the receptor P to coordinate Cu2+. When Cu2+ was added to the system again, the signals were completely reproduced, and the colorless solution turned to pink. These findings indicated that P can be classified as a reversible chemosensor for Cu2+.
3.5. Preliminary Analytical Application
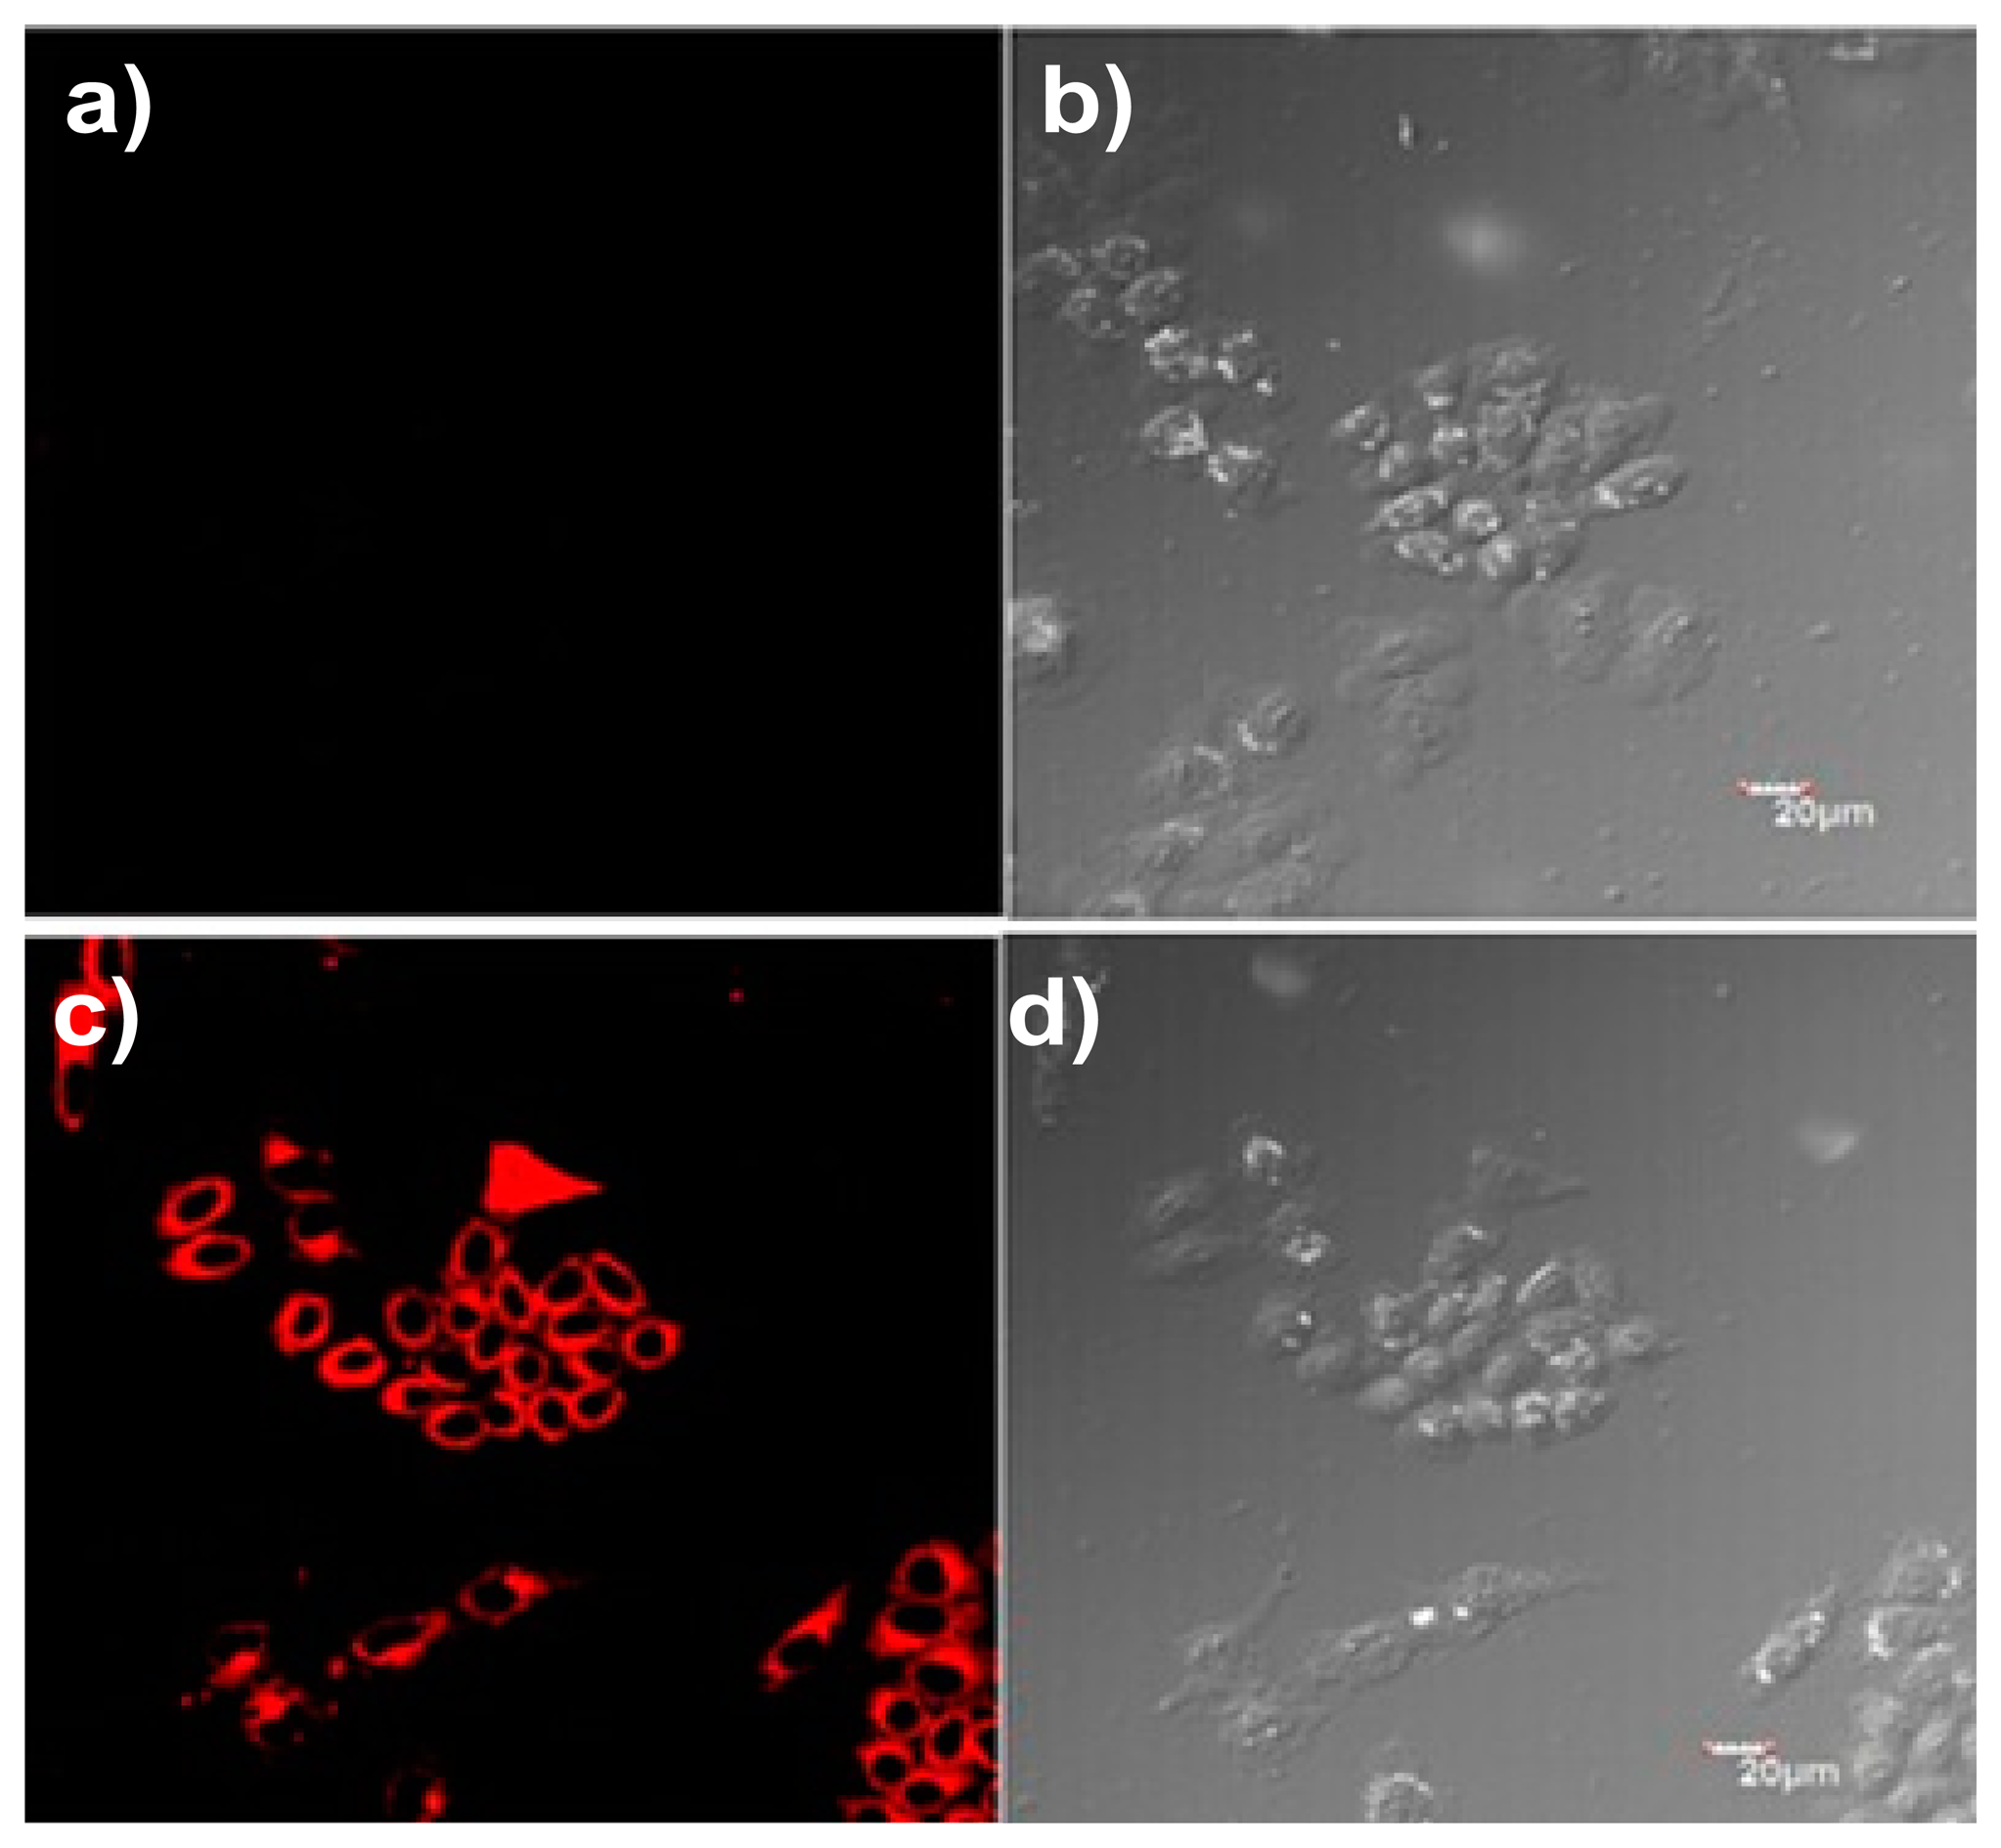
To further demonstrate the practical applicability of the probe P, a cell imaging experiment was carried out to detect Cu2+ in living cells, and the fluorescence images of HepG2 cells were recorded before and after the addition of Cu2+ (Figure 7). The cells were supplemented with only P in the growth medium for 30 min at 37 °C, which led to very weak fluorescence, as determined by laser scanning confocal microscopy (ex = 559 nm) (Figure 7c). In contrast, when loaded with 1 μM CuCl2 for 30 min, a bright fluorescence was detected (Figure 7a). These results suggested that probe P can penetrate the cell membrane and might be used for detecting Cu2+ in living cells.
3.6. Method Performance Comparison
The performance of the proposed probe P was compared with the corresponding performance of some reported fluorescent probes for Cu2+ determination, as shown in Table 1. All of the fluorescent methods present good selectivity for Cu2+. The fluorescence quenching methods using rhodamine derivative exhibit a bad detection limit and are not applicable for living cells [13]. Most of the rhodamine derivatives possess good fluorescent properties [14–16], but some of them have more or less disadvantages, such as irreversibility [14] and complicated purification [14,15]. As for the two types of enhancement probes based on rhodamine derivative, dual-function detection for Cu2+ and ClO− are realized [17], and a reversible response in living cells is exhibited [18]; however, low yields still restrict their further applications [17,18]. Our newly developed fluorescence enhancement method presents a number of attractive analytical features, such as a wide linear range, good reversibility and reproducibility, good selectivity and wide applicability. The fluorescence probe P based on rhodamine spirolactame derivative is easy to prepare at a low cost and can be used for routine analysis of ultra-trace levels of Cu2+ in living cells.
4. Conclusions
A new rhodamine B derivative was successfully characterized as a Cu2+-selective probe. The proposed probe has good selectivity towards Cu2+ compared with other common metal ions. Under optimized conditions, P exhibited a dynamic response range for Cu2+ from 1.0 × 10⁻⁶ to 1.0 × 10⁻⁵ M with a detection limit of 3.3 × 10⁻⁷ M Cu2+ in ethanol-water solution (9:1, v:v. 20 mM HEPES, pH 7.0).
Supplementary Material
sensors-14-21375-s001.pdfAcknowledgments
This work was financially supported by the National Natural Science Foundation of China (Nos. 81260268, 81360266), the Natural Science Foundation of Hainan Province (Nos. 812188, 413131) and the Colleges and Universities Scientific Research Projects of the Education Department of Hainan Province (Hjkj2013-29).
Author Contributions
In this paper, C. Yu performed the synthesis and cell imaging of probe P. Wen mainly focused on the testing experiments of P. Zhang was responsible for organizing the experimental data and the writing of the paper.
Conflicts of Interest
The authors declare no conflict of interest.
References
- Quang, D.T.; Kim, J.S. Fluoro- and Chromogenic Chemodosimeters for Heavy Metal Ion Detection in Solution and Biospecimens. Chem. Rev. 2010, 110, 6280–6301. [Google Scholar]
- Guo, Z.Q.; Park, S.; Yoon, J.Y.; Shin, I. Recent progress in the development of near-infrared fluorescent probes for bioimaging applications. Chem. Soc. Rev. 2014, 43, 16–29. [Google Scholar]
- Wang, R.; Yu, C.W.; Yu, F.B.; Chen, L.X. Molecular fluorescent probes for monitoring pH changes in living cells. TRAC-Trends Anal. Chem. 2010, 29, 1004–1013. [Google Scholar]
- Kikuchi, K.; Takakusa, H.; Nagano, T. Recent advances in the design of small molecule-based FRET sensors for cell biology. TrAC-Trends Anal. Chem. 2004, 23, 407–415. [Google Scholar]
- Yu, C.W.; Fu, Q.Y.; Zhang, J. Synthesis and characterization of a Mg2+-selective fluorescence probe. Sensors 2014, 14, 12560–12567. [Google Scholar]
- Lovstad, R.A. A kinetic study on the distribution of Cu (II)-ions between albumin and transferring. BioMetals 2004, 17, 111–113. [Google Scholar]
- Yu, C.W.; Zhang, J.; Li, J.H.; Liu, P.; Wei, P.H.; Chen, L.X. Fluorescent probe for copper (II) ion based on a rhodamine spirolactame derivative, and its application to fluorescent imaging in living cells. Microchim. Acta 2011, 174, 247–255. [Google Scholar]
- Fan, J.L.; Zhan, P.; Hu, M.M.; Sun, W.; Tang, J.Z.; Wang, J.Y.; Sun, S.G.; Song, F.L.; Peng, X.J. A fluorescent ratiometric chemodosimeter for Cu2+ based on TBET and its application in living cells. Org. Lett. 2013, 15, 492–495. [Google Scholar]
- Kar, C.; Adhikari, M.D.; Ramesh, A.; Das, G. NIR- and FRET-based sensing of Cu2+ and S2− in physiological conditions and in live cells. Inorg. Chem. 2013, 52, 743–752. [Google Scholar]
- Zhou, Z.G.; Yu, M.X.; Yang, H.; Huang, K.W.; Li, F.Y.; Yi, T.; Huang, C.H. FRET-based sensor for imaging chromium(III) in living cells. Chem. Commun. 2008, 29, 3387–3389. [Google Scholar]
- Kumar, M.; Kumar, N.; Bhalla, V.; Singh, H.; Sharma, P.R.; Kaur, T. Naphthalimide appended rhodamine derivative: Through bond energy transfer for sensing of Hg2+ ions. Org. Lett. 2011, 13, 1422–1425. [Google Scholar]
- Kim, H.; Lee, M.; Kim, H.; Kim, J.; Yoon, J. A new trend in rhodamine-based chemosensors: Application of spirolactam ring-opening to sensing ions. Chem. Soc. Rev. 2008, 37, 1465–1472. [Google Scholar]
- Kim, M.H.; Noh, J.H.; Kim, S.; Ahn, S.; Chang, S.K. The synthesis of crown ether-appended dichlorofluoresceins and their selective Cu2+ chemosensing. Dyes Pigments. 2009, 82, 341–346. [Google Scholar]
- Hu, Z.Q.; Wang, X.M.; Feng, Y.C.; Ding, L.; Lu, H.Y. Sulfonyl rhodamine hydrazide: A sensitive and selective chromogenic and fluorescent chemodosimeter for copper ion in aqueous media. Dyes Pigments 2011, 88, 257–261. [Google Scholar]
- Zhao, Y.; Zhang, X.B.; Han, Z.X.; Qiao, L.; Li, C.Y.; Jian, L.X.; Shen, G.L.; Yu, R.Q. Highly sensitive and selective colorimetric and off-on fluorescent probe for Cu2+ in aqueous solution and living cells. Anal. Chem. 2009, 81, 7022–7030. [Google Scholar]
- Yu, C.W.; Zhang, J.; Wang, R.; Chen, L.X. Highly sensitive and selective colorimetric and off-on fluorescent probe for Cu2+ based on rhodamine derivative. Org. Biomol. Chem. 2010, 8, 5277–5279. [Google Scholar]
- Liu, Y.L.; Sun, Y.; Du, J.; Lv, X.; Zhao, Y.; Chen, M.L.; Wang, P.; Guo, W. Highly sensitive and selective turn-on fluorescent and chromogenic probe for Cu2+ and ClO− based on a N-picolinyl rhodamine B-hydrazide derivative. Org. Biomol. Chem. 2011, 9, 432–437. [Google Scholar]
- Huang, L.; Wang, X.; Xie, G.Q.; Xi, P.X.; Li, Z.P.; Xu, M.; Wu, Y.J.; Bai, D.C.; Zeng, Z.Z. A new rhodamine-based chemosensor for Cu2+ and the study of its behaviour in living cells. Dalton Trans. 2010, 39, 7894–7896. [Google Scholar]


| Fluorescence Modes | Fluorescence Reagents | Reproducibility | LOD (nM) | Testing Media | Applications | Remarks | Reference |
|---|---|---|---|---|---|---|---|
| Enhancement λex/em = 510/580 nm | Rhodamine derivative | Reversible | 7 | Water-methanol (2:8, v/v, pH 7.0, 20 mM HEPES) | HeLa cells | Yield (85%), simple synthetic route | [7] |
| Quenching λex/em = 495/552 nm | Rhodamine derivative | NA | 2600 | Water-DMSO (1:1, v/v) | NA | Yield (52%) | [13] |
| Enhancement λex/em = 530/575 nm | Rhodamine derivative | NA | 10 | Water-CH3CN (1:1, v/v, pH 7.1, 50 mM HEPES) | Waste water samples | Yield (60%), complicated purification | [14] |
| Enhancement λex/em = 500/552 nm | Rhodamine derivative | Reversible | 300 | Water-ethanol (8:2, v/v, pH 7.1, Tris-HCl,) | River samples and HeLa cells | Yield (23%), complicated purification | [15] |
| Enhancement λex/em = 510/580 nm | Rhodamine derivative | Reversible | 3 | Water-methanol (2:8, v/v, pH 7.0, 20 mM HEPES) | NA | Yield (80%), simple purification | [16] |
| Enhancement λex/em = 540/586 nm | Rhodamine derivative | NA | NA | Water-CH3CN (9:1, v/v, pH 7.0, 10 mM Tris-HCl) | NA | Yield (60%), dual-function chemosensor for Cu2+ and ClO− | [17] |
| Enhancement λex/em = 495/552 nm | Rhodamine derivative | Reversible | NA | Water-CH3CN (1:1, v/v) | EJ cells | Yield (55%) | [18] |
| Enhancement λex/em = 520/577 nm | Rhodamine derivative | Reversible | 300 | Water-ethanol (1:9, v/v, pH 7.0, 20 mM HEPES) | HepG2 cells | Yield (67.2%), simple synthetic route | This work |
© 2014 by the authors; licensee MDPI, Basel, Switzerland. This article is an open access article distributed under the terms and conditions of the Creative Commons Attribution license ( http://creativecommons.org/licenses/by/3.0/).
Share and Cite
Yu, C.; Wen, Y.; Zhang, J. Synthesis of a Cu2+-Selective Probe Derived from Rhodamine and Its Application in Cell Imaging. Sensors 2014, 14, 21375-21384. https://doi.org/10.3390/s141121375
Yu C, Wen Y, Zhang J. Synthesis of a Cu2+-Selective Probe Derived from Rhodamine and Its Application in Cell Imaging. Sensors. 2014; 14(11):21375-21384. https://doi.org/10.3390/s141121375
Chicago/Turabian StyleYu, Chunwei, Yingying Wen, and Jun Zhang. 2014. "Synthesis of a Cu2+-Selective Probe Derived from Rhodamine and Its Application in Cell Imaging" Sensors 14, no. 11: 21375-21384. https://doi.org/10.3390/s141121375