In the following sections, we present the results of our investigations of the recorded gait data. Our classification results prove a number of hypotheses regarding biometric and biographic characteristics of the human subjects. Specifically, the gender, the body height and the age of participants could be classified well. Each of classification tasks was solved by training random forest classifiers, as introduced in the previous section.
3.1. Gender Classification
Our goal was to show that classification tasks regarding the gender of the trial subject can be performed sufficiently well by using the proposed sensors attached to each of the given locations.
: The gender can be identified by motion recordings of any of the employed sensors
The results presented in
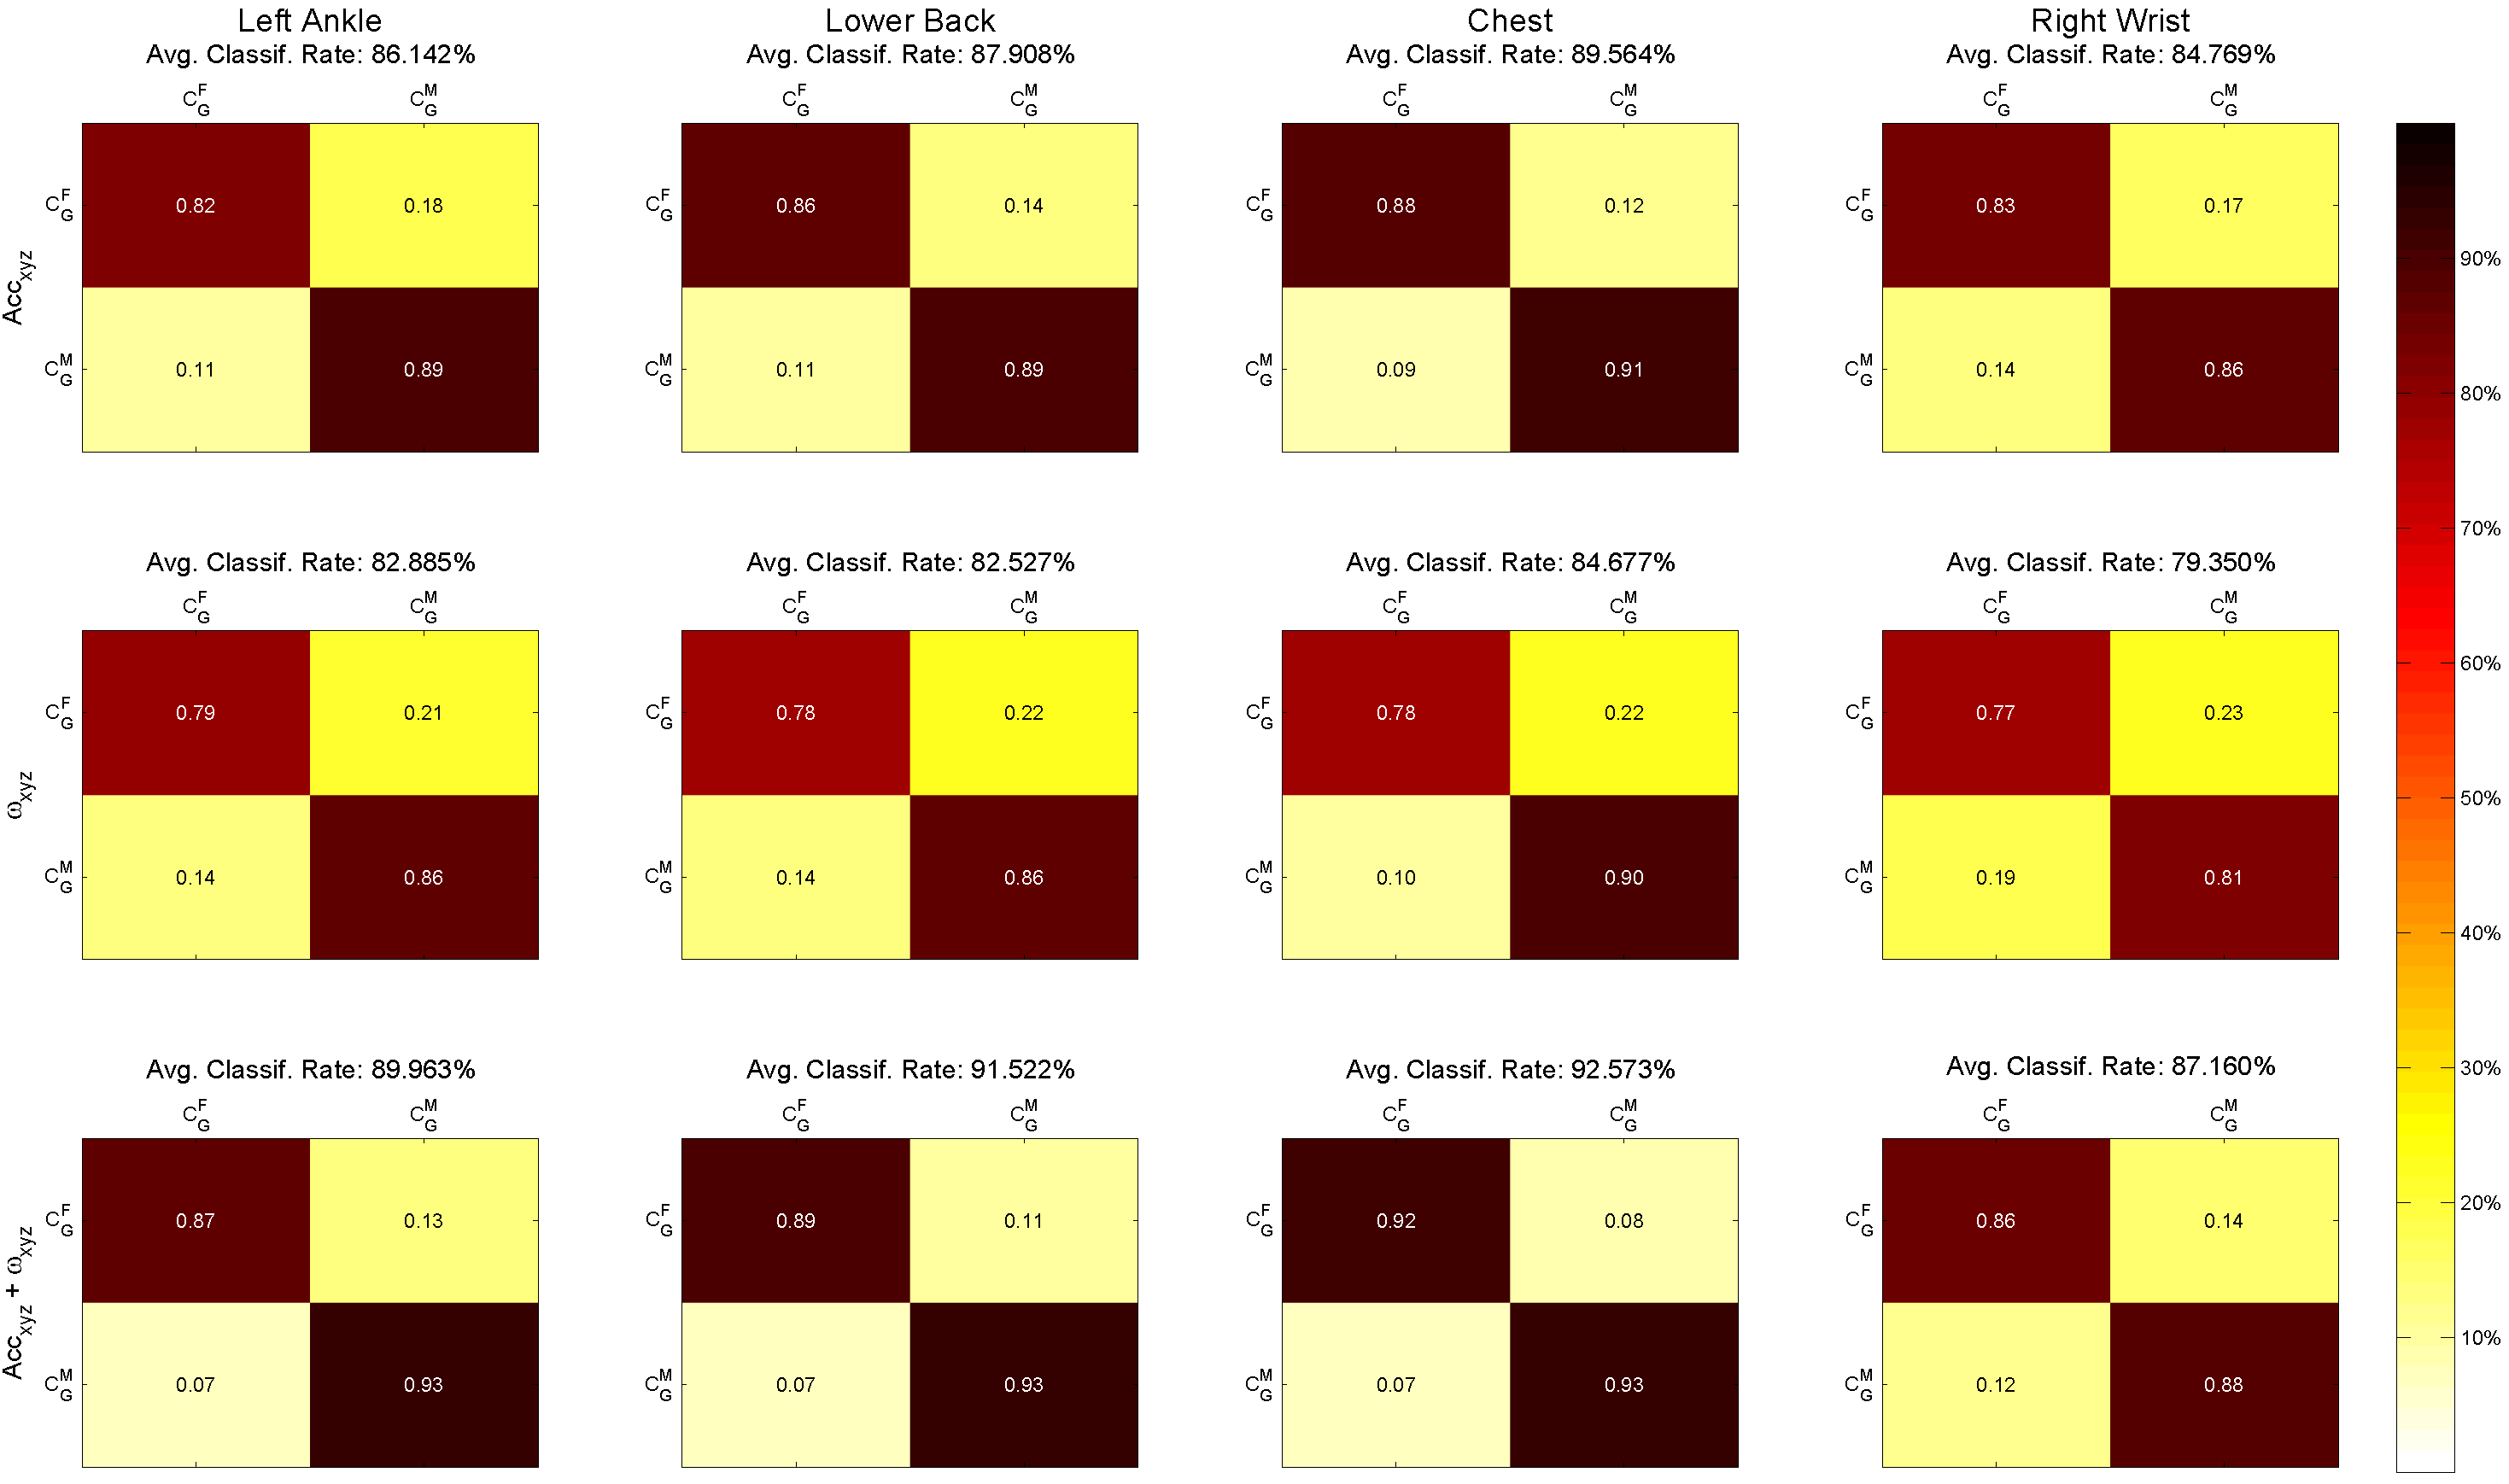
Figure 3 show that the statement holds true for each of the four sensors individually. For each sensor, there are three different images visualizing the results of the binary classification, namely for the investigation of accelerations, of angular velocities, as well as of both combined. The confusion matrices encode the following information: each column represents the instances in one of the predicted classes, while each row represents the instances in the actual class (female/male).
Figure 3.
Confusion matrices of gender classification computed with 10-fold cross-validation. Each column presents sensor position (left to right): left ankle, lower back, chest and right wrist. Each row presents feature sets used for classification (top to bottom): 3D accelerations (26 features), 3D angular velocities (26 features) and 6D accelerations and angular velocities (50 features). Classes: = gender female; = gender male.
For the application of acceleration only, the classification rates are higher than
for each of the sensors. Classification results based on angular velocities show a lower classification rate, but still above
. The classification based on the combined features performs better than each of the individual feature sets, namely above
. More precisely, the results for the combined features are (listed by sensor in descending order of rates): chest (
), lower back (
), left ankle (
), right wrist (
).
Table 6 presents 10-fold cross-validation results of gender classification, including correct classification accuracy, sensitivity, specificity, the positive predictive value (PPV) of each class and the average PPV of all classes. PPV
represents the PPV of the class
, and PPV
represents the PPV of the class
.
Table 6.
Classification results obtained by using 10-fold cross-validation for different classification categories: gender, height and age. The results show balanced correct classification rates, sensitivity, specificity, the positive predictive value (PPV) of each class and the average PPV of all classes.
| Classification Task | Body Part | Sensor | Class.Rate | Sens. | Spec. | PPV | PPV | PPV | Avg.PPV |
|---|
| Gender Classification | Chest | A, G | 92.57 | 91.72 | 93.24 | 91.43 | 93.48 | – | 92.45 |
| Lower Back | A, G | 91.52 | 89.42 | 93.18 | 91.22 | 91.75 | – | 91.49 |
| Right Wrist | A, G | 87.16 | 85.75 | 88.32 | 85.85 | 88.24 | – | 87.05 |
| Left Ankle | A, G | 89.96 | 86.77 | 92.57 | 90.52 | 89.54 | – | 90.03 |
| Body Height Classification | Chest | A, G | 89.05 | 88.84 | 94.45 | 89.65 | 87.43 | 90.00 | 89.03 |
| Lower Back | A, G | 88.45 | 88.16 | 94.05 | 91.36 | 88.73 | 86.39 | 88.82 |
| Right Wrist | A, G | 84.78 | 84.65 | 92.33 | 83.40 | 85.21 | 85.43 | 84.68 |
| Left Ankle | A, G | 87.28 | 87.07 | 93.47 | 89.87 | 89.06 | 84.23 | 87.72 |
| Age Classification | Chest | A, G | 88.82 | 87.40 | 94.05 | 90.10 | 93.02 | 85.81 | 89.64 |
| Lower Back | A, G | 88.82 | 87.20 | 94.12 | 87.34 | 89.48 | 90.03 | 88.95 |
| Right Wrist | A, G | 83.50 | 81.08 | 91.18 | 82.23 | 88.74 | 82.72 | 84.56 |
| Left Ankle | A, G | 85.74 | 83.80 | 92.33 | 86.09 | 92.52 | 82.82 | 87.14 |
3.2. Body Height Classification
Another goal was body height classification from only accelerations, angular velocities and a combination of both.
: The body height can be identified by motion recordings of any of the employed sensors
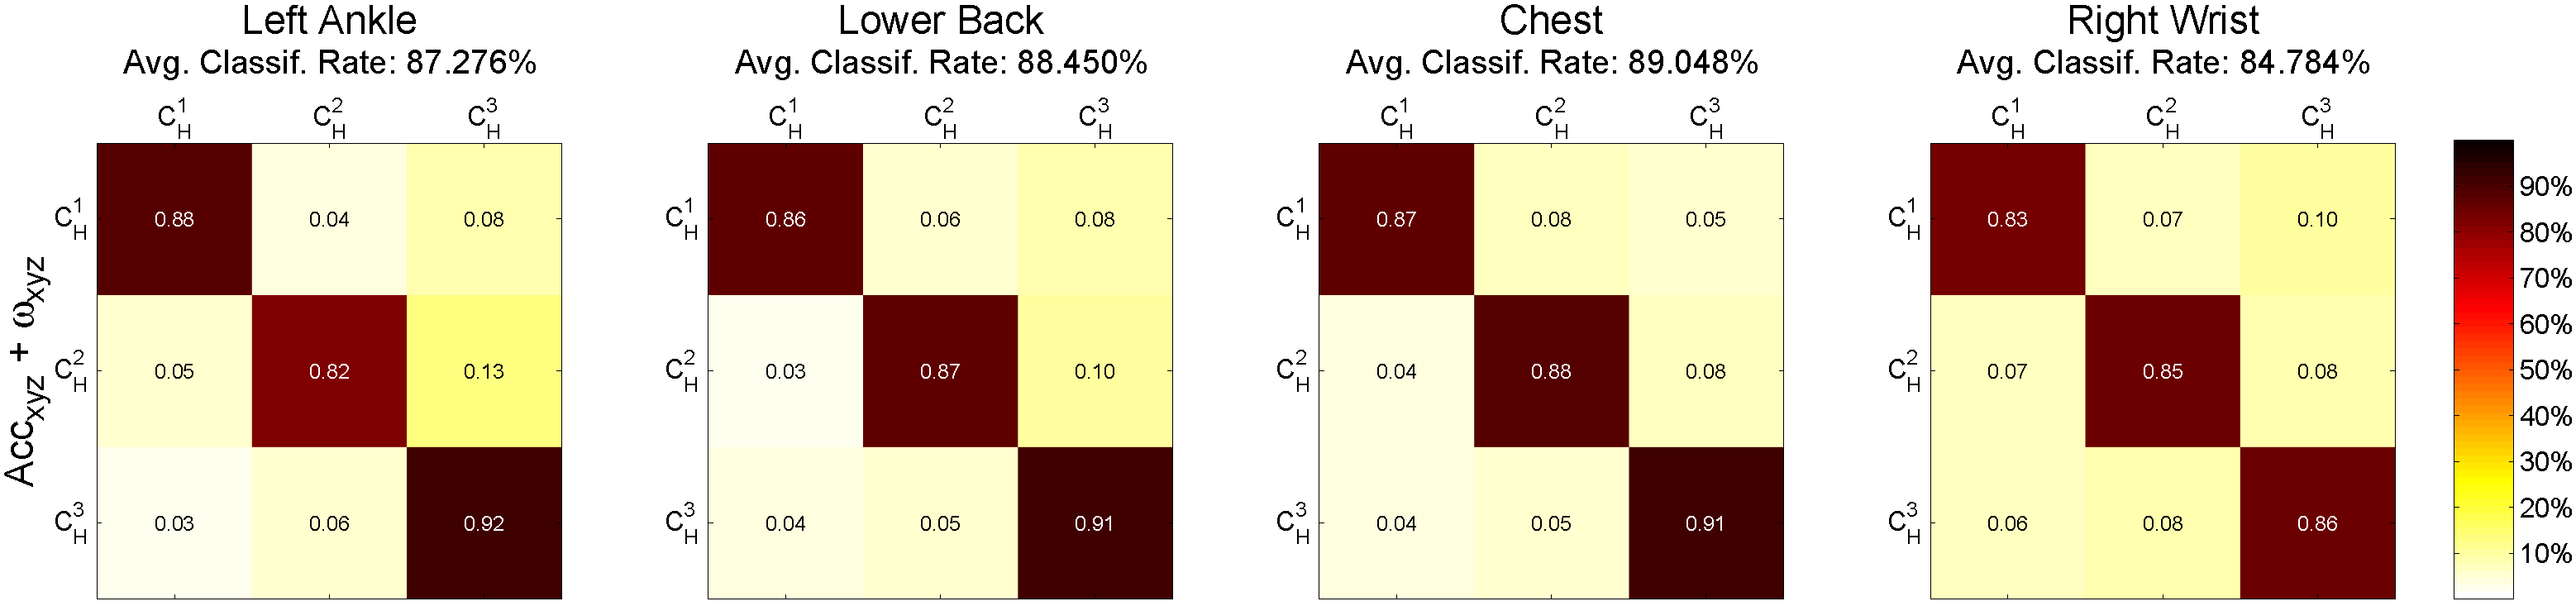
The results of the ternary classification for each individual sensor are given in
Figure 4. Here, the classification estimated the assignment to three classes (
height ≤170 cm,
170 cm < height < 180 cm,
height ≥180 cm). A behavior similar to the gender classification was observed where the classification based on the combined features of accelerations and angular velocities performs better than the individual ones. More precisely, the results for the combined features are (listed by sensor in descending order of rates): chest (
), lower back (
), left ankle (
), right wrist (
).
Table 6 presents 10-fold cross-validation results of body height classification, including correct classification accuracy, sensitivity, specificity, the positive predictive value (PPV) of each class and the average PPV of all classes. PPV
shows the PPV of the class
; PPV
shows the PPV of the class
; and PPV
shows the PPV of the class
.
Figure 4.
Confusion matrices of body height classification computed with 10-fold cross-validation. Each column presents the sensor position (left to right): left ankle, lower back, chest and right wrist. 6D accelerations and angular velocities (50 features) were used for classification. height ≤170 cm, 170 cm < height < 180 cm, height cm.
3.3. Age Classification
Another goal was age group classification from only accelerations, angular velocities and their combination.
: The age group of individuals can be identified by motion recordings of any of the employed sensors.
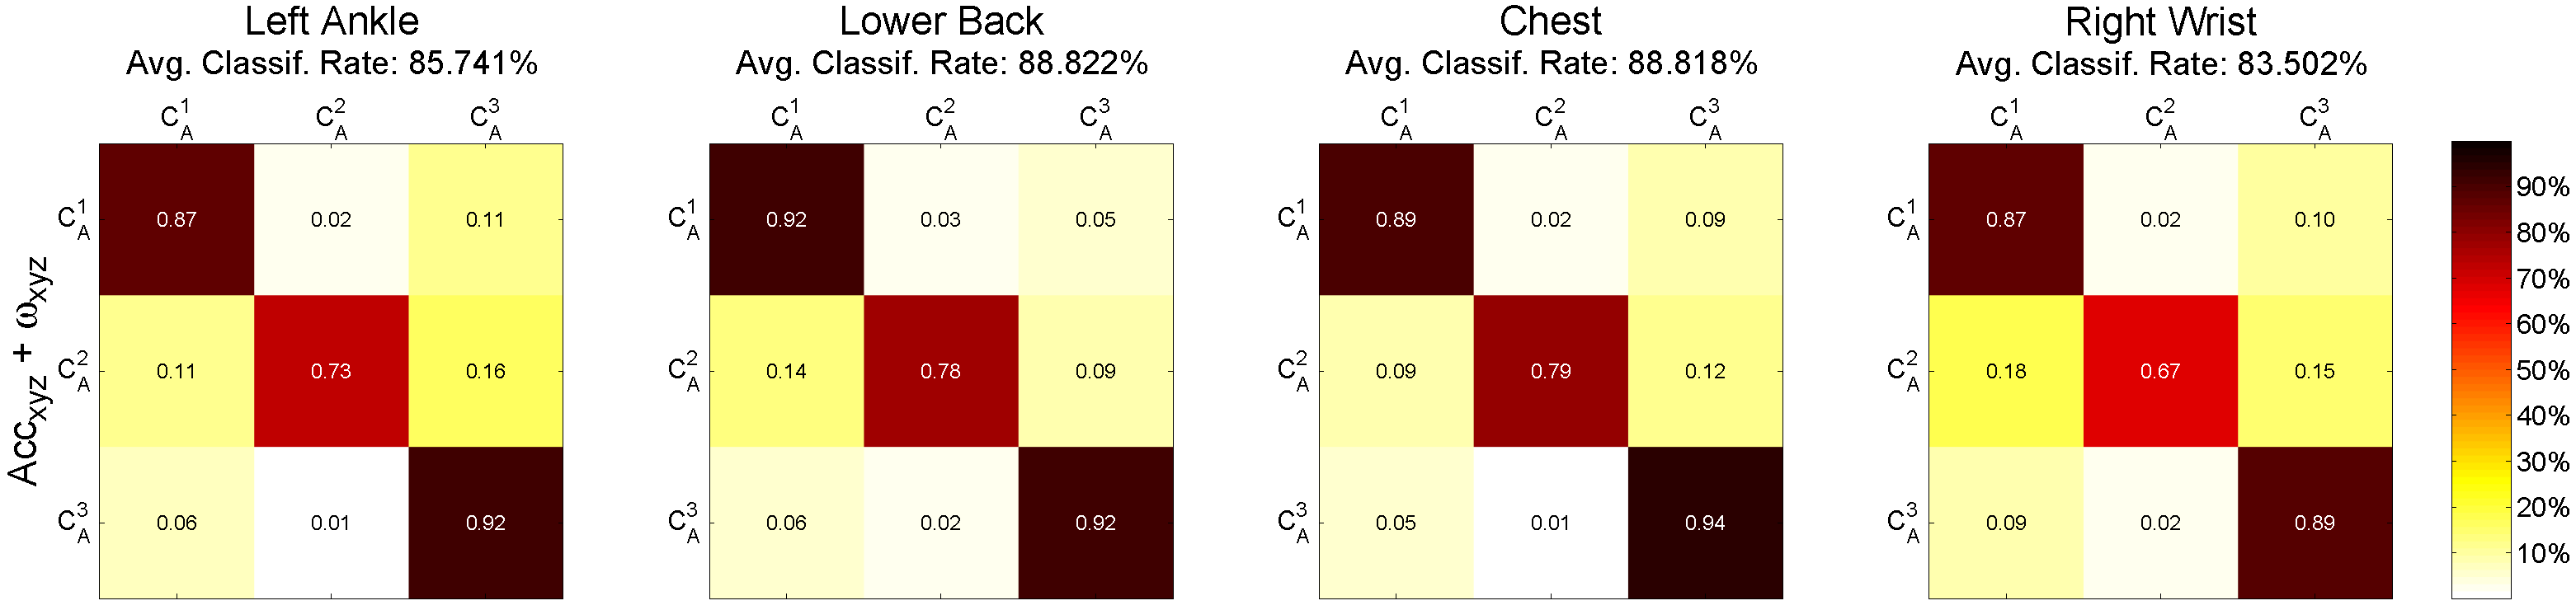
The results of the ternary classification for each individual sensor are given in
Figure 5. Here, the classification estimated the assignment to three classes according to three age groups (
: age <40;
: 40 ≤ age < 50;
: age
) of participants. Similar to the previous classification tasks, the classification based on the combined features of accelerations and angular velocities performs better than the individual ones. More precisely, age classification results for the combined features are (listed by sensor in descending order of rates): lower back (
), chest (
), left ankle (
), right wrist (
).
Table 6 presents 10-fold cross-validation results of age classification, including correct classification accuracy, sensitivity, specificity, the positive predictive value (PPV) of each class and the average PPV of all classes. PPV
represents the PPV of the class
; PPV
represents the PPV of the class
; and PPV
represents the PPV of the class
.
Figure 5.
Confusion matrices of age classification computed with 10-fold cross-validation. Each column presents the sensor position (left to right): left ankle, lower back, chest and right wrist. 6D accelerations and angular velocities (50 features) were used for classification. : age <40; : 40 ≤ age < 50; : age .
3.4. Contribution of Individual Features to Classification Results
The contribution of each of the employed features in all three classification tasks was homogenous in the sense that there is not one outstanding feature with a major contribution to the classification results. In all experiments, we made the following observation: in sum, accelerations contributed more to the overall results than angular velocities. However, the combination of the two feature types did better than accelerations or angular velocities individually. Random forest’s permutation-based variable importance measures have been used to evaluate the contribution of individual features in the overall classification results. For further details, refer to the works of Breimann [
29] and Louppe
et al. [
37].
In detail, the classification results related to sensors at different locations can depend on quite different feature sets. In the following, we will give an overview of the most important contributors for each of the locations.
3.4.1. Gender Classification
For the location at the chest, angular velocities (around the y-axis, i.e., transverse axis) contributed most, especially the standard deviation, max, energy, and RMS. These are related to the rotation of the upper body around a horizontal axis over the course of the motion. Note that this is not a contradiction to our other claims. Furthermore, the amplitude of the accelerations along the x-axis, i.e., the cranio-caudal axis, is of high importance. For the lower back, the most important features are associated with acceleration of the z-axis. This corresponds to changes in the velocity of the hip movement within the sagittal plane, i.e., front to back. In addition, angular velocities associated with the z-axis, i.e., rotation around the anteroposterior axis (swinging of hips), contribute significantly to the results. Furthermore, the amplitude of the accelerations along the x-axis, i.e., the cranio-caudal axis, is also of high importance. For the right wrist, features associated with acceleration along the y- and z-axes are top contributors. Particularly, minimum, maximum and entropy acceleration values associated with dorso-ventral, as well as lateral movement of the hand play a more important part in the classification. Furthermore, the RMS and energy of angular velocities associated with the z-axis are important. This is also linked to the swinging of the hand in the lateral direction.
For the ankles, the contribution of accelerations along each axis is generally higher compared to the contribution of other single features.
Figure 6 shows bar graphs of the features’ importance computed during gender classification. The graphs present a comparison of the importance of each feature (as percentage) with respect to different sensor positions. In general, all features are significantly contributing in the classification task. An overview of contribution percentages where the most important features are highlighted is given in
Table 7.
Table 7.
Features importance computed during gender classification using 10-fold cross-validation strategy. The top 5 contributing features are highlighted with bold text. All values are the percentage.
Table 7.
Features importance computed during gender classification using 10-fold cross-validation strategy. The top 5 contributing features are highlighted with bold text. All values are the percentage.
| | Len | Dur | Mean | SD | Min | Max | RMS | Ent | E | Amp |
|---|
| Chest | A | 1.42 | 1.39 | 1.62 | 2.72 | 2.05 | 2.14 | 2.51 | 1.87 | 1.44 | 4.38 |
| A | – | – | 1.14 | 1.35 | 1.32 | 1.09 | 1.03 | 1.08 | 1.03 | 2.17 |
| A | – | – | 2.80 | 1.55 | 2.31 | 2.18 | 3.48 | 3.01 | 3.85 | 1.15 |
| G | – | – | 1.58 | 1.28 | 2.42 | 2.20 | 1.20 | 2.45 | 1.22 | 2.04 |
| G | – | – | 1.04 | 4.67 | 1.42 | 5.02 | 3.70 | 0.88 | 4.75 | 1.83 |
| G | – | – | 0.84 | 1.49 | 1.00 | 1.17 | 1.56 | 1.14 | 1.53 | 1.50 |
| Lower Back | A | 1.61 | 1.62 | 1.45 | 2.41 | 1.34 | 2.08 | 1.80 | 1.94 | 1.36 | 4.14 |
| A | – | – | 1.99 | 1.80 | 1.53 | 1.43 | 1.69 | 1.70 | 1.92 | 2.48 |
| A | – | – | 5.11 | 2.25 | 4.30 | 4.93 | 2.19 | 2.12 | 2.15 | 2.05 |
| G | – | – | 1.47 | 3.51 | 1.75 | 1.42 | 1.54 | 1.29 | 1.71 | 2.39 |
| G | – | – | 1.02 | 1.60 | 1.33 | 1.39 | 1.44 | 1.16 | 1.38 | 1.75 |
| G | – | – | 1.40 | 1.42 | 1.38 | 2.20 | 1.42 | 1.46 | 1.59 | 3.60 |
| Right Wrist | A | 1.20 | 1.21 | 1.49 | 2.33 | 1.88 | 1.41 | 1.62 | 1.52 | 1.40 | 2.14 |
| A | – | – | 2.43 | 1.83 | 2.69 | 2.01 | 2.49 | 2.89 | 2.53 | 2.04 |
| A | – | – | 2.02 | 2.24 | 2.25 | 2.84 | 2.49 | 1.62 | 2.30 | 1.70 |
| G | – | – | 1.52 | 2.04 | 1.82 | 1.47 | 2.36 | 1.31 | 2.52 | 2.00 |
| G | – | – | 2.35 | 1.46 | 1.57 | 1.53 | 2.61 | 1.83 | 2.61 | 1.57 |
| G | – | – | 1.78 | 1.88 | 1.94 | 2.38 | 3.00 | 1.49 | 2.89 | 1.50 |
| Left Ankle | A | 1.15 | 1.17 | 1.52 | 2.62 | 3.97 | 1.65 | 2.12 | 1.66 | 1.86 | 1.71 |
| A | – | – | 3.61 | 1.68 | 1.55 | 4.21 | 1.83 | 2.15 | 1.59 | 1.22 |
| A | – | – | 5.17 | 1.62 | 3.43 | 2.15 | 1.58 | 1.86 | 1.65 | 1.89 |
| G | – | – | 1.60 | 1.46 | 1.92 | 2.29 | 1.55 | 1.64 | 1.30 | 1.65 |
| G | – | – | 2.01 | 1.86 | 2.39 | 1.90 | 1.86 | 1.72 | 1.94 | 2.19 |
| G | – | – | 1.64 | 1.80 | 1.99 | 1.90 | 1.65 | 1.77 | 1.75 | 1.67 |
Figure 6.
Bar graphs of the features’ importance computed during gender classification using the 10-fold cross-validation strategy. The graphs present a comparison of the importance of each feature (in %) with respect to different sensor positions. In general, all features are significantly contributing in the classification task.
3.4.2. Body Height Classification
For the location at the chest, accelerations along the z-axis contributed most, especially the mean, minimum, maximum and energy. These are associated with the motion of the upper body in the dorso-ventral direction. Furthermore, the minimum accelerations along the x-axis, i.e., the cranio-caudal axis, are of importance.
For the lower back, the most important features are associated with acceleration of the z-axis, especially the mean, maximum, RMS and energy. This corresponds to changes in the velocity of the movement of the hips within the sagittal plane,
i.e., front to back. In addition, the minimum of the accelerations in the x-axis contributes significantly to the results. These are linked to the movement of the hips along the cranio-caudal axis (up and down). For the right wrist, features associated with acceleration along each of the three axes contribute significantly. Particularly, maximum, RMS and energy values associated with dorso-ventral movement of the hand play a more important part. For the ankles, also the contribution of accelerations along each axis is generally high. Additionally, angular velocities associated with the rotation of the feet from side to side (around the z-axis) are significant contributors.
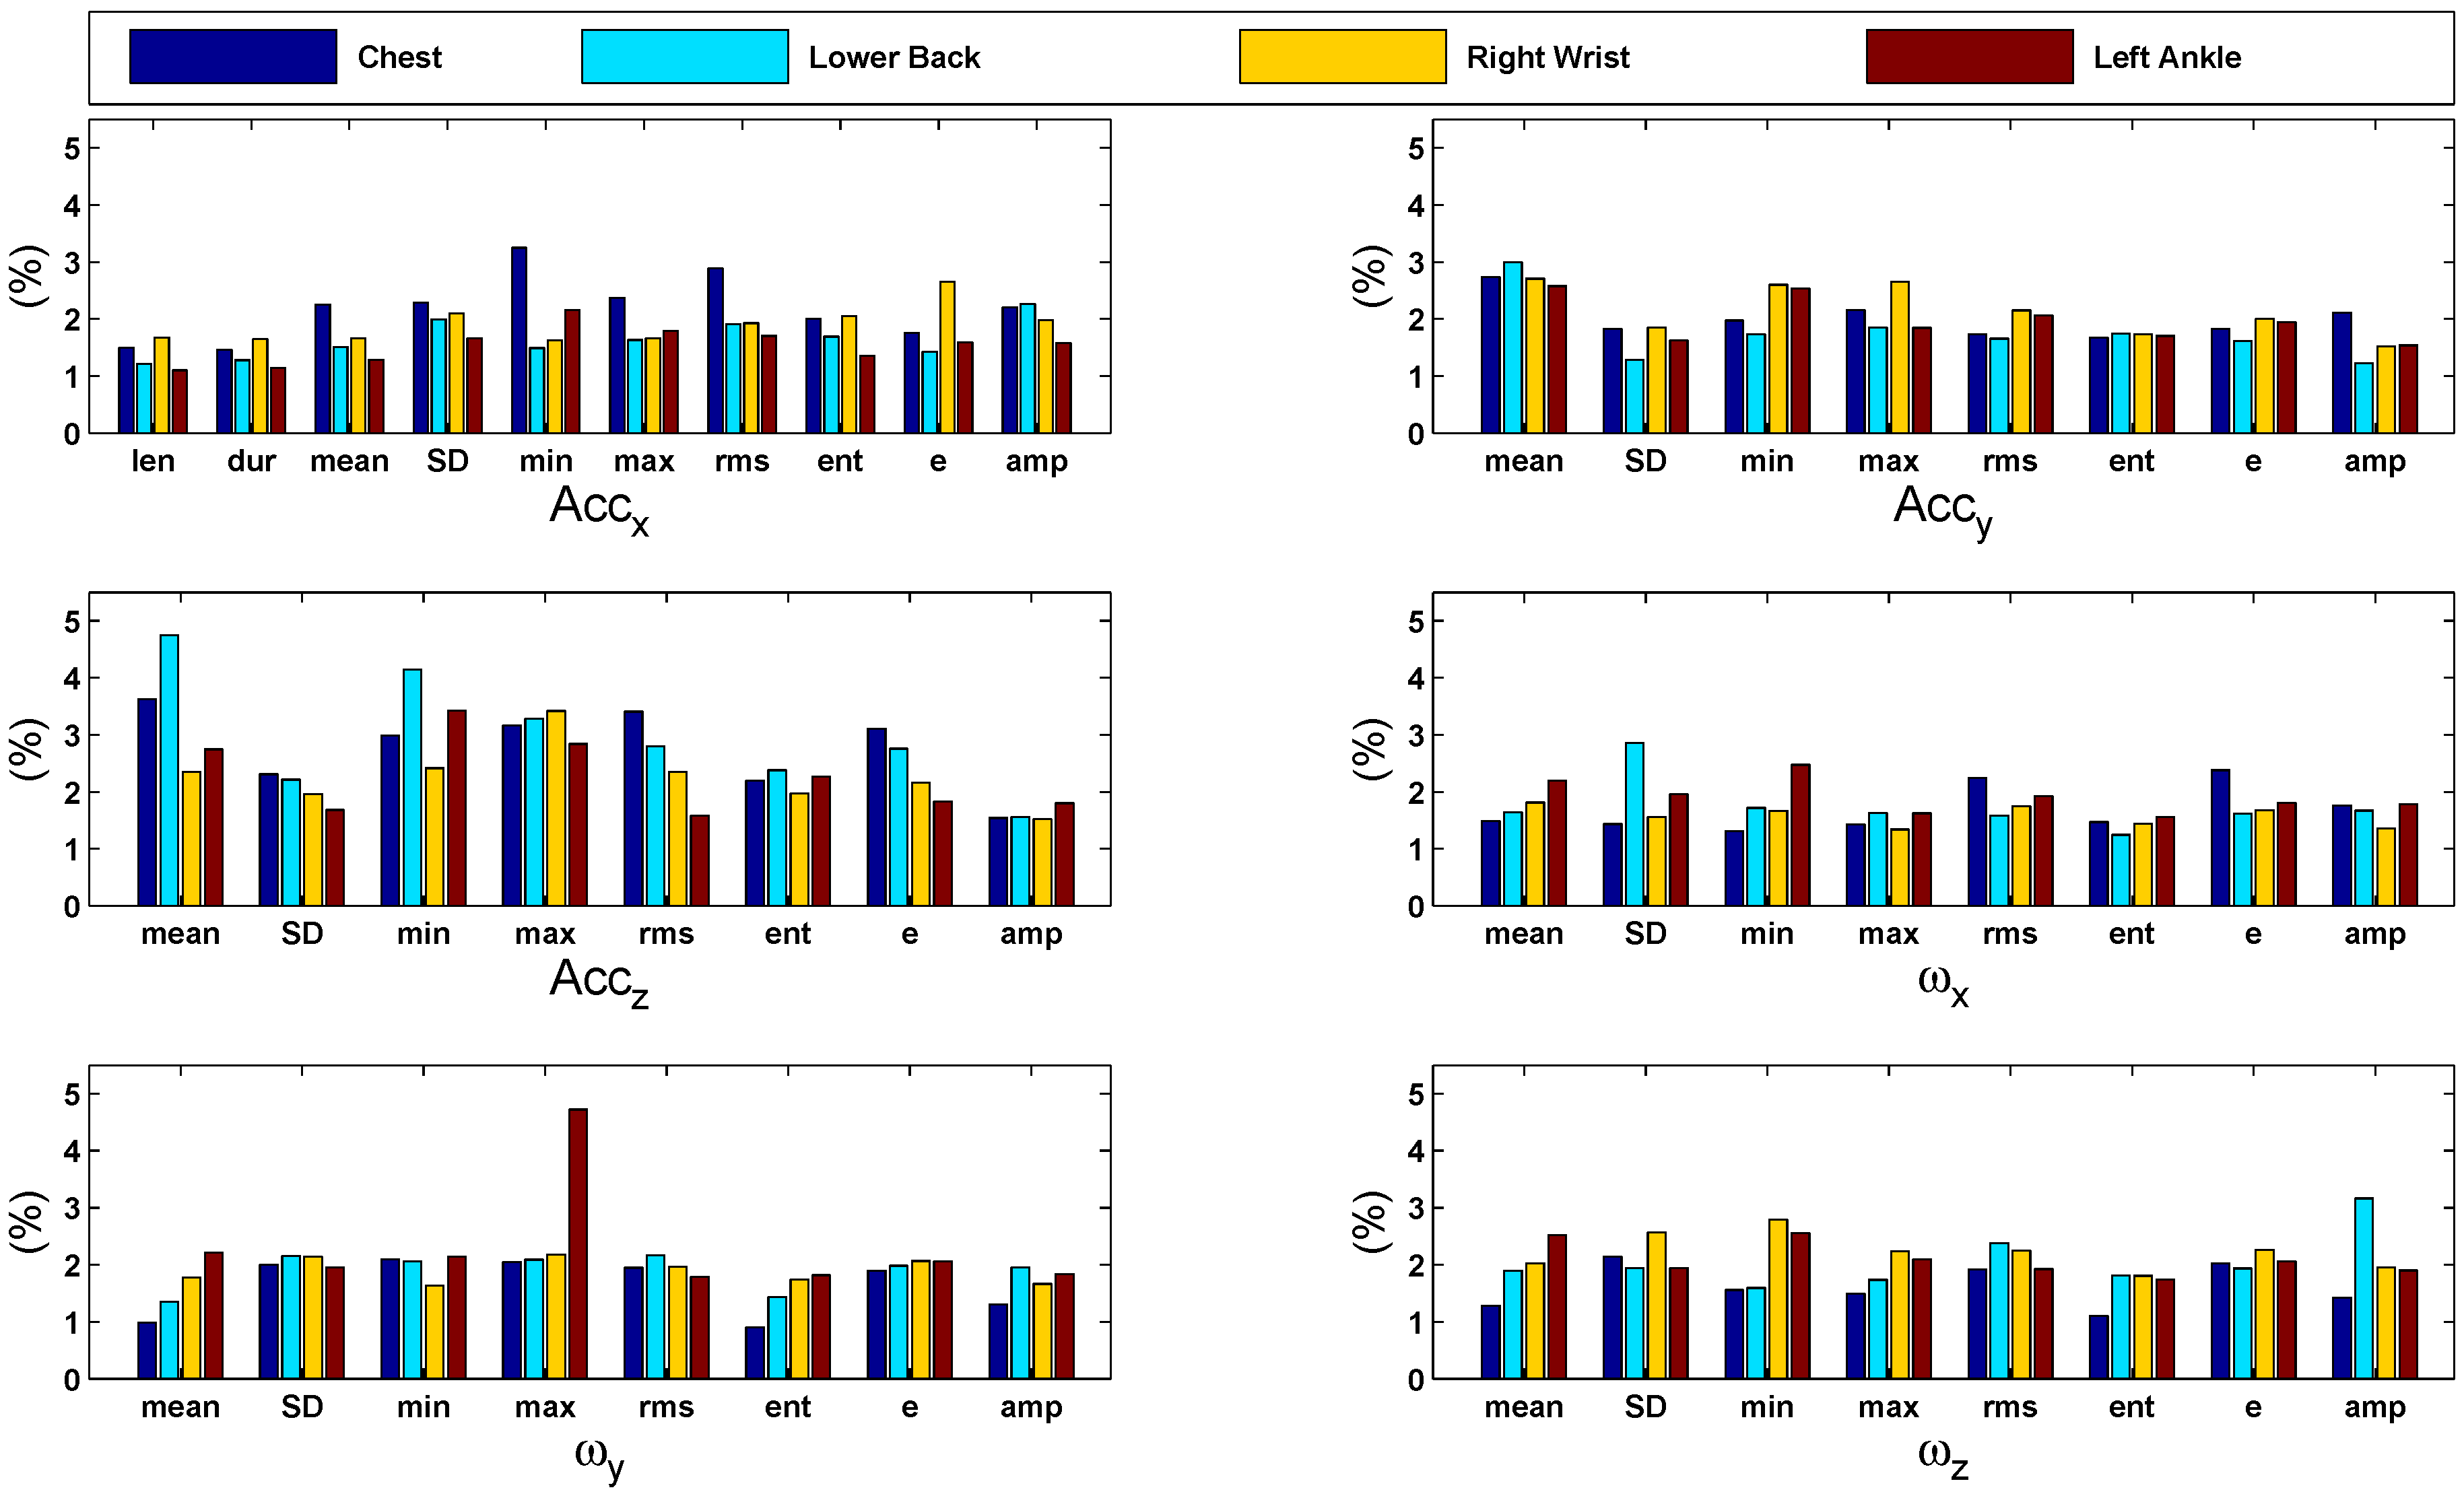
Figure 7 shows bar graphs of the feature contribution computed during body height classification. The graphs present a comparison of the importance of each feature (as percentage) with respect to different sensor positions. In general, all features are significantly contributing in the classification task. An overview of the contribution percentages where the most important features are highlighted is given in
Table 8.
Table 8.
Features’ importance computed during body height classification using the 10-fold cross-validation strategy. The top 5 contributing features are highlighted with bold text. All values are the percentage.
Table 8.
Features’ importance computed during body height classification using the 10-fold cross-validation strategy. The top 5 contributing features are highlighted with bold text. All values are the percentage.
| | Len | Dur | Mean | SD | Min | Max | RMS | Ent | E | Amp |
|---|
| Chest | A | 1.27 | 1.24 | 1.81 | 3.19 | 4.15 | 1.87 | 2.38 | 1.57 | 1.63 | 2.38 |
| A | – | – | 2.28 | 1.61 | 1.86 | 2.10 | 1.87 | 1.48 | 1.62 | 2.09 |
| A | – | – | 3.69 | 3.44 | 3.62 | 3.67 | 3.34 | 2.38 | 3.60 | 1.60 |
| G | – | – | 1.70 | 1.52 | 1.65 | 1.81 | 1.72 | 1.74 | 1.77 | 1.96 |
| G | – | – | 1.00 | 2.05 | 1.61 | 2.15 | 2.06 | 0.94 | 1.89 | 1.22 |
| G | – | – | 1.25 | 1.77 | 1.19 | 1.54 | 1.74 | 1.13 | 1.75 | 1.11 |
| Lower Back | A | 1.34 | 1.33 | 1.57 | 3.12 | 2.65 | 1.82 | 1.89 | 1.78 | 1.59 | 2.43 |
| A | – | – | 2.83 | 1.51 | 1.77 | 2.31 | 1.82 | 1.51 | 1.73 | 1.54 |
| A | – | – | 4.35 | 2.54 | 2.73 | 3.01 | 3.40 | 2.26 | 3.88 | 1.44 |
| G | – | – | 2.16 | 2.08 | 1.52 | 1.63 | 1.52 | 1.40 | 1.50 | 1.42 |
| G | – | – | 1.28 | 1.55 | 1.76 | 1.49 | 1.62 | 1.96 | 1.57 | 1.53 |
| G | – | – | 1.69 | 1.89 | 1.71 | 2.08 | 1.83 | 1.65 | 1.99 | 3.02 |
| Right Wrist | A | 1.33 | 1.33 | 1.89 | 2.83 | 2.78 | 1.49 | 2.26 | 1.62 | 1.82 | 2.35 |
| A | – | – | 2.48 | 2.31 | 3.03 | 2.68 | 2.14 | 1.86 | 1.99 | 2.07 |
| A | – | – | 2.53 | 2.31 | 2.56 | 3.48 | 2.87 | 1.62 | 2.86 | 1.50 |
| G | – | – | 1.71 | 1.49 | 1.60 | 1.43 | 1.81 | 1.26 | 1.64 | 1.32 |
| G | – | – | 1.82 | 1.82 | 1.76 | 2.30 | 1.98 | 1.59 | 2.04 | 1.61 |
| G | – | – | 1.95 | 1.57 | 1.87 | 1.97 | 2.14 | 1.48 | 2.19 | 1.65 |
| Left Ankle | A | 1.04 | 1.06 | 1.31 | 2.53 | 3.81 | 1.86 | 1.89 | 1.26 | 1.50 | 1.82 |
| A | – | – | 3.41 | 1.62 | 1.77 | 3.06 | 2.16 | 1.94 | 2.06 | 1.38 |
| A | – | – | 3.28 | 1.51 | 2.40 | 1.92 | 1.69 | 2.28 | 1.70 | 1.61 |
| G | – | – | 1.73 | 1.61 | 2.00 | 1.65 | 1.65 | 1.18 | 1.65 | 1.44 |
| G | – | – | 2.42 | 2.14 | 2.37 | 2.56 | 2.71 | 1.57 | 2.33 | 2.01 |
| G | – | – | 2.24 | 1.95 | 2.75 | 2.21 | 2.00 | 1.61 | 2.43 | 1.92 |
Figure 7.
Bar graphs of the features’ importance computed during body height classification using the 10-fold cross-validation strategy. The graphs present a comparison of the importance of each feature (in %) with respect to different sensor positions. In general, all features are significantly contributing in the classification task.
3.4.3. Age Classification
For the location at the chest, the importance of the features is similarly distributed as in the height classification results: accelerations along the z-axis contributed most, especially the mean, maximum, RMS and energy. These are associated with the motion of the upper body in the dorso-ventral direction. Furthermore, the minimum acceleration along the x-axis,
i.e., the cranio-caudal axis, is important. For the lower back, the most important features are associated especially with acceleration of the z-axis. This is similar to the results found in the height classification scenario and corresponds to changes in the velocity of the movement of the hips within the sagittal plane,
i.e., front to back. For the right wrist, features associated with acceleration along each of the three axes contribute significantly. Additionally, the minimum angular velocity associated with rotation around the z-axis,
i.e., swinging laterally, is important. For the ankles, the contribution of features associated with lateral acceleration is high. Additionally, angular velocities associated with swinging of the feet from side to side (around the z-axis), as well as rolling over from heel to toes (rotation around the y-axis) are significant contributors.
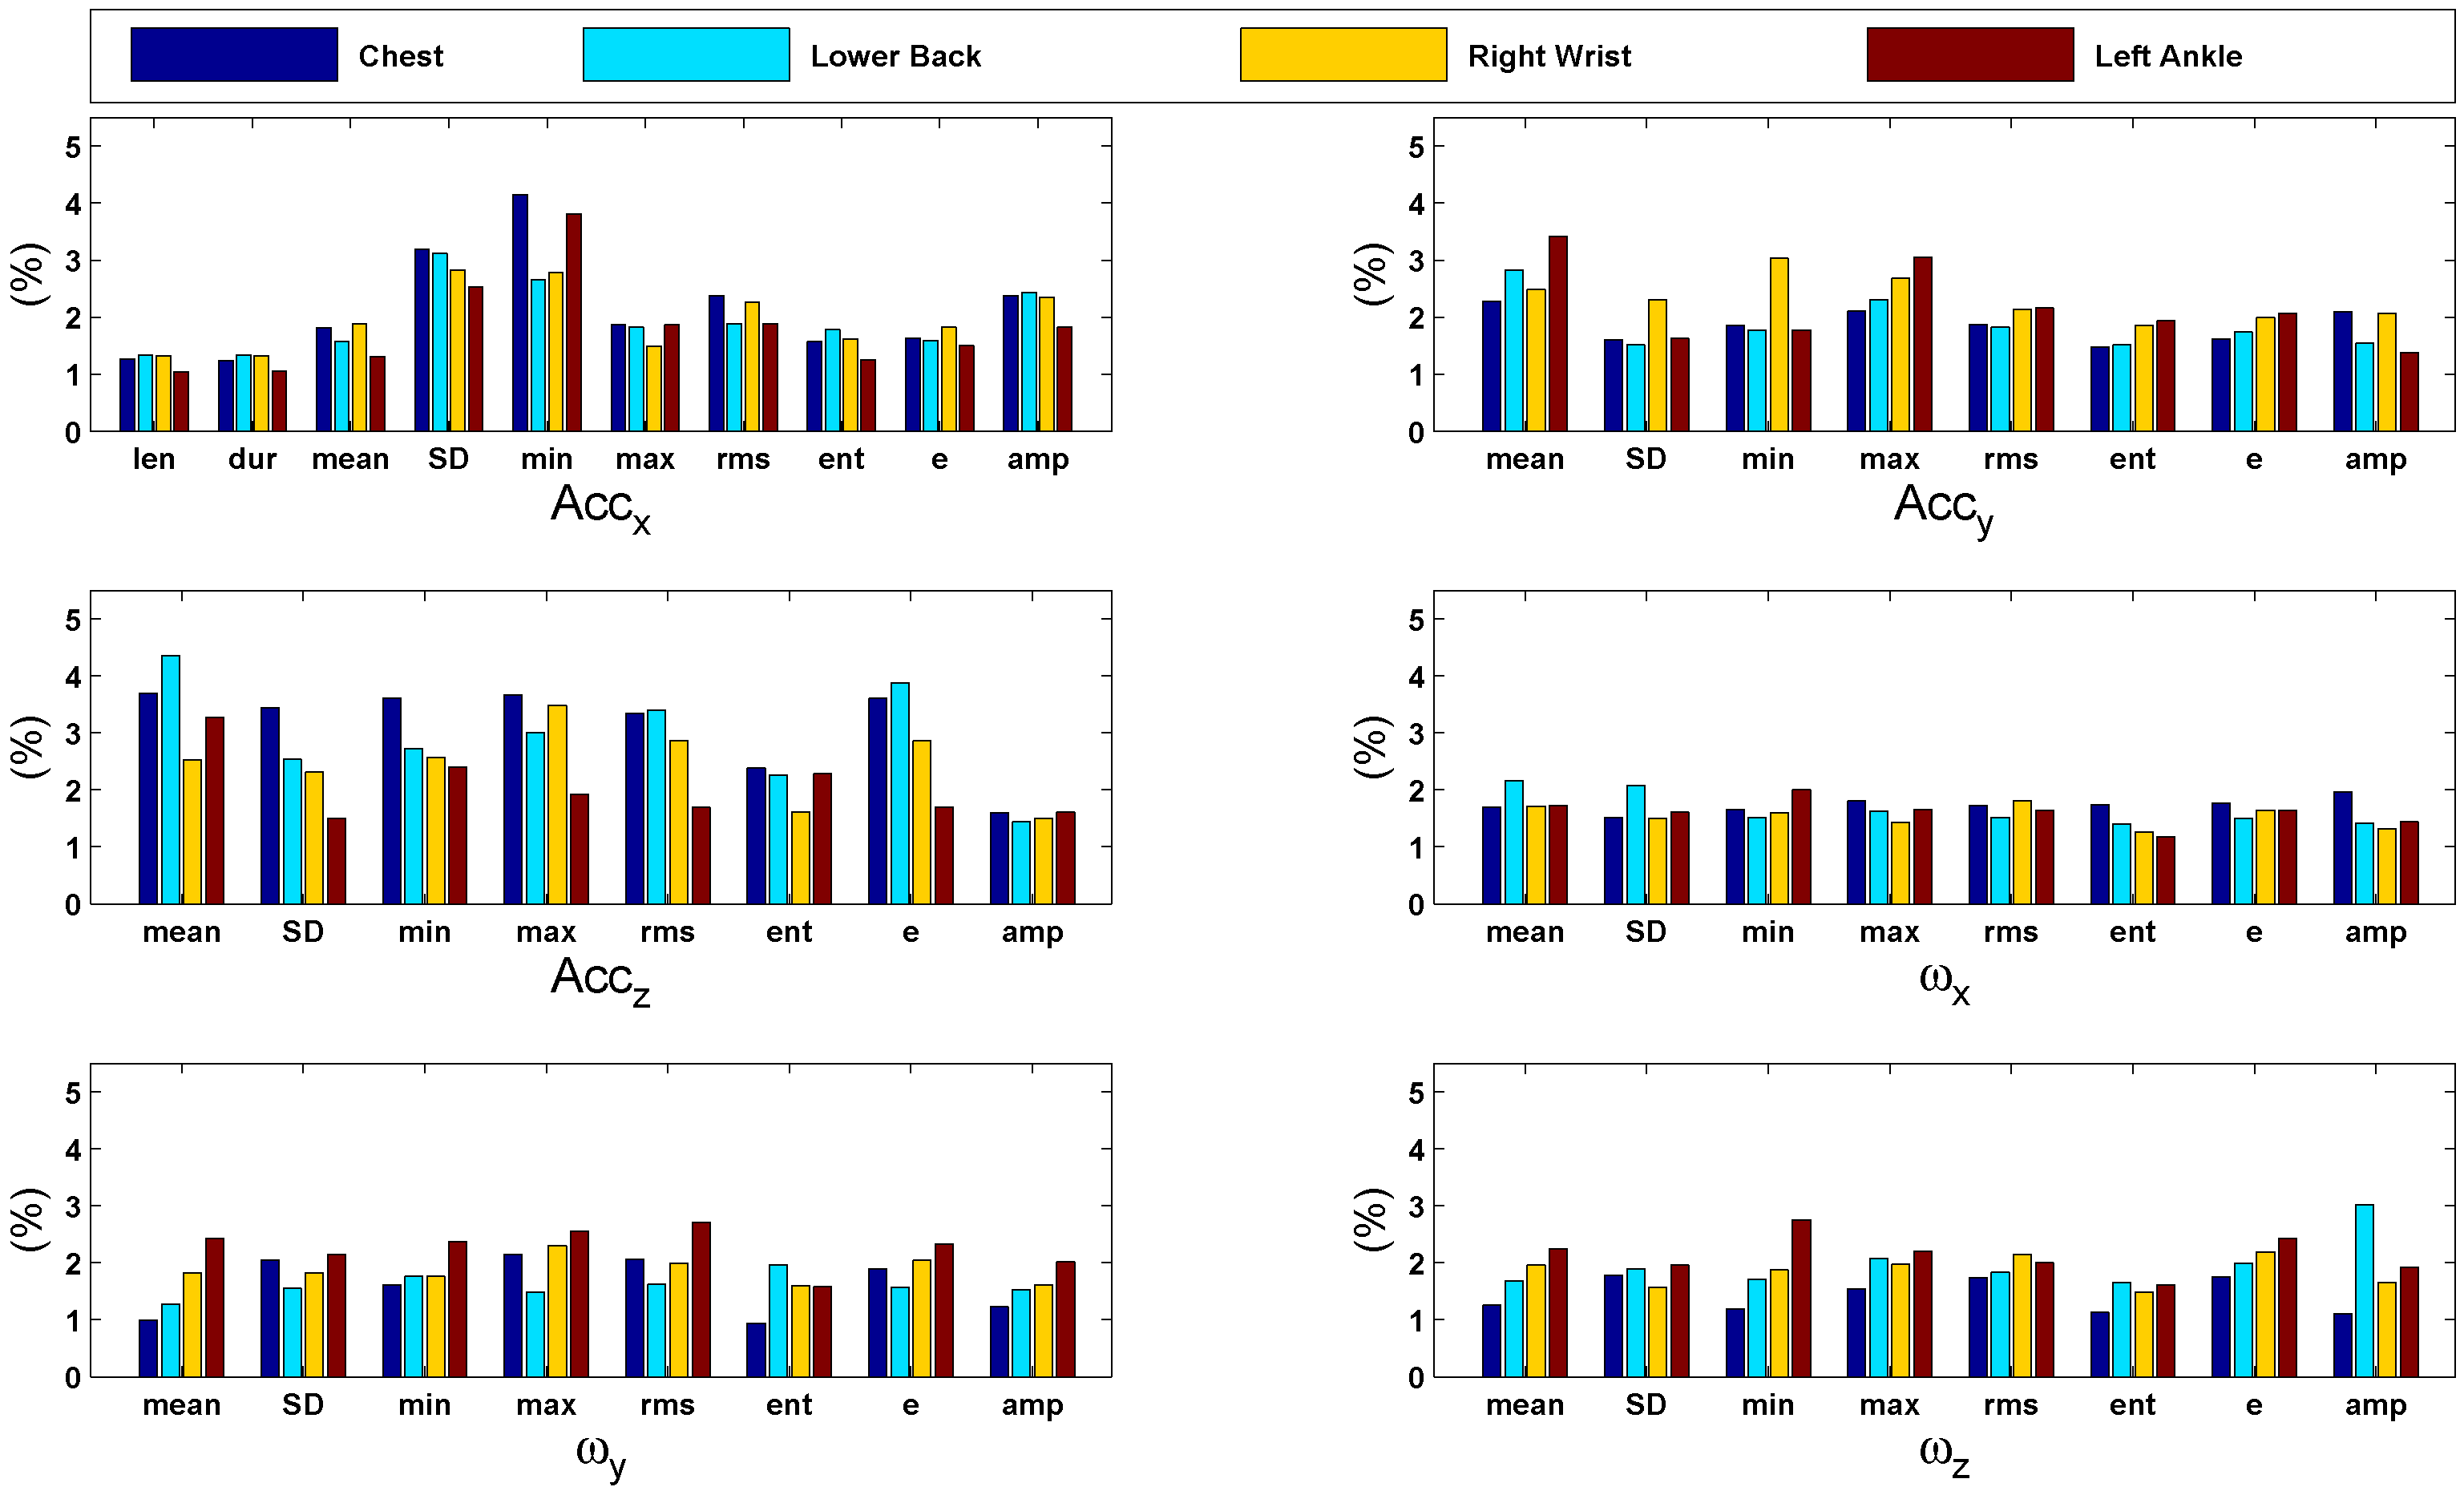
Figure 8 shows bar graphs of the features’ importance computed during age classification. The graphs present a comparison of the importance of each feature (as percentage) with respect to different sensor positions. In general, all features are significantly contributing in the classification task. An overview of contribution percentages where the most important features are highlighted is given in
Table 9.
Figure 8.
Bar graphs of the features’ importance computed during age classification using the 10-fold cross-validation strategy. The graphs present a comparison of the importance of each feature (in %) with respect to different sensor positions. In general, all features are significantly contributing in the classification task.
Table 9.
Features’ importance computed during age classification using the 10-fold cross-validation strategy. The top 5 contributing features are highlighted with bold text. All values are the percentage.
Table 9.
Features’ importance computed during age classification using the 10-fold cross-validation strategy. The top 5 contributing features are highlighted with bold text. All values are the percentage.
| | Len | Dur | Mean | SD | Min | Max | RMS | Ent | E | Amp |
|---|
| Chest | A | 1.50 | 1.46 | 2.26 | 2.29 | 3.25 | 2.37 | 2.89 | 2.00 | 1.75 | 2.21 |
| A | – | – | 2.74 | 1.83 | 1.97 | 2.16 | 1.73 | 1.67 | 1.83 | 2.11 |
| A | – | – | 3.63 | 2.31 | 2.98 | 3.17 | 3.40 | 2.19 | 3.11 | 1.54 |
| G | – | – | 1.49 | 1.44 | 1.31 | 1.43 | 2.24 | 1.47 | 2.38 | 1.76 |
| G | – | – | 0.99 | 2.00 | 2.09 | 2.05 | 1.95 | 0.90 | 1.90 | 1.30 |
| G | – | – | 1.28 | 2.14 | 1.56 | 1.49 | 1.92 | 1.10 | 2.02 | 1.42 |
| Lower Back | A | 1.22 | 1.28 | 1.51 | 1.99 | 1.49 | 1.63 | 1.91 | 1.69 | 1.42 | 2.26 |
| A | – | – | 2.99 | 1.29 | 1.73 | 1.85 | 1.65 | 1.74 | 1.61 | 1.22 |
| A | – | – | 4.75 | 2.22 | 4.15 | 3.28 | 2.80 | 2.38 | 2.76 | 1.56 |
| G | – | – | 1.64 | 2.86 | 1.72 | 1.63 | 1.58 | 1.25 | 1.62 | 1.67 |
| G | – | – | 1.35 | 2.16 | 2.06 | 2.09 | 2.17 | 1.44 | 1.98 | 1.95 |
| G | – | – | 1.90 | 1.94 | 1.59 | 1.74 | 2.38 | 1.81 | 1.94 | 3.17 |
| Right Wrist | A | 1.68 | 1.65 | 1.66 | 2.10 | 1.62 | 1.66 | 1.93 | 2.05 | 2.65 | 1.98 |
| A | – | – | 2.71 | 1.85 | 2.60 | 2.65 | 2.15 | 1.73 | 2.00 | 1.52 |
| A | – | – | 2.35 | 1.96 | 2.42 | 3.42 | 2.35 | 1.97 | 2.17 | 1.52 |
| G | – | – | 1.81 | 1.56 | 1.67 | 1.34 | 1.75 | 1.44 | 1.68 | 1.35 |
| G | – | – | 1.78 | 2.14 | 1.63 | 2.18 | 1.97 | 1.74 | 2.07 | 1.67 |
| G | – | – | 2.03 | 2.57 | 2.79 | 2.23 | 2.25 | 1.81 | 2.26 | 1.95 |
| Left Ankle | A | 1.10 | 1.15 | 1.29 | 1.66 | 2.16 | 1.79 | 1.70 | 1.35 | 1.59 | 1.58 |
| A | – | – | 2.58 | 1.63 | 2.54 | 1.84 | 2.06 | 1.70 | 1.94 | 1.54 |
| A | – | – | 2.75 | 1.68 | 3.42 | 2.84 | 1.58 | 2.27 | 1.83 | 1.80 |
| G | – | – | 2.20 | 1.96 | 2.47 | 1.62 | 1.93 | 1.56 | 1.81 | 1.78 |
| G | – | – | 2.21 | 1.96 | 2.14 | 4.72 | 1.79 | 1.81 | 2.06 | 1.84 |
| G | – | – | 2.52 | 1.94 | 2.56 | 2.09 | 1.93 | 1.74 | 2.06 | 1.90 |
3.5. Classification Results Based on Restriction to Subgroups
Since the correlation between body height and gender is very high (on average, men are taller than women), we performed a gait-based classification task on each of the groups of female and male participants in order to present height classification results that are independent of this particular phenomenon. Moreover, we also performed age classification on the data of each subgroup (female
vs. male) separately. The number of subjects present in the study did not allow for ternary classification of subgroups (see
Table 5 for the population characteristics). Therefore, there were two different classes in the height-related experiment:
= the body height of the subject is less than or equal to
cm;
= the body height of the subject is greater than
cm (
for male,
for female subjects). In the age-related experiment, assigned classes were:
= the subject is less than or equal to
years old;
= the subject is greater than
years old (
for male,
for female subjects).
Table 10 shows an overview of the results. It is quite clear that the results are very good in all cases with the classification rate higher than
in all but two cases (
and
for the right wrist sensor in both female groups). The results also present balanced sensitivity, specificity, the positive predictive value (PPV) of each class and the average PPV of all classes. For body height classification, PPV
represents the PPV of the class
, and PPV
represents the PPV of the class
. For age classification, PPV
shows the PPV of the class
, and PPV
shows the PPV of the class
.
Table 10.
Results of body height and age classifications within participant subgroups using 10-fold cross-validation. The results show balanced correct classification rates, sensitivity, specificity, the positive predictive value (PPV) of each class and the average PPV of all classes.
Table 10.
Results of body height and age classifications within participant subgroups using 10-fold cross-validation. The results show balanced correct classification rates, sensitivity, specificity, the positive predictive value (PPV) of each class and the average PPV of all classes.
| Classification Task | Body Part | Sensor | Class. Rate | Sens. | Spec. | PPV | PPV | Avg. PPV |
|---|
| Body Height Classification | |
| Male Group | Chest | A, G | 95.06 | 96.74 | 92.72 | 94.87 | 95.33 | 95.10 |
| Lower Back | A, G | 93.46 | 94.82 | 91.61 | 93.93 | 92.81 | 93.37 |
| Right Wrist | A, G | 93.50 | 96.77 | 89.07 | 92.31 | 95.32 | 93.81 |
| Left Ankle | A, G | 93.27 | 94.91 | 91.20 | 93.16 | 93.41 | 93.29 |
| Female Group | Chest | A, G | 91.18 | 92.84 | 89.07 | 91.49 | 90.77 | 91.13 |
| Lower Back | A, G | 93.22 | 96.06 | 89.63 | 92.13 | 94.73 | 93.43 |
| Right Wrist | A, G | 89.34 | 92.97 | 84.90 | 88.30 | 90.78 | 89.54 |
| Left Ankle | A, G | 92.71 | 94.71 | 90.08 | 92.59 | 92.86 | 92.73 |
| Age Classification | |
| Male Group | Chest | A, G | 93.36 | 93.12 | 93.60 | 93.90 | 92.79 | 93.34 |
| Lower Back | A, G | 93.61 | 93.45 | 93.77 | 94.01 | 93.19 | 93.60 |
| Right Wrist | A, G | 93.55 | 94.40 | 92.65 | 93.19 | 93.95 | 93.57 |
| Left Ankle | A, G | 92.65 | 92.69 | 92.62 | 92.58 | 92.73 | 92.65 |
| Female Group | Chest | A, G | 92.78 | 90.04 | 95.29 | 94.59 | 91.27 | 92.93 |
| Lower Back | A, G | 95.05 | 95.78 | 94.39 | 93.92 | 96.11 | 95.01 |
| Right Wrist | A, G | 87.97 | 88.79 | 87.20 | 86.62 | 89.29 | 87.96 |
| Left Ankle | A, G | 90.80 | 87.37 | 93.74 | 92.29 | 89.64 | 90.96 |
3.6. Subject-Wise Cross-Validation
In order to show that our results are not caused by over-fitting the classification to specific subjects rather than learning the properties, we are looking for (gender, height, age), a subject-wise cross-validation model was also employed (as explained in
Section 2.8).
Table 11 presents the classification results of subject-wise cross-validation for all three group classification tasks: gender, height and age. The feature set contained all features of 6D accelerations and angular velocities (50 in total). For each sensor position, sensitivity, specificity, the PPV of each class and the average PPV of all classes were also computed. A comparison of the classification results of group classification tasks using 10-fold cross-validation and subject-wise cross-validation for chest (CH), lower back (LB), right wrist (RW) and left ankle (LA) is presented in
Figure 9. It is clearly observable that 10-fold cross-validation outperforms subject-wise cross-validation in all cases.
Figure 9.
A comparison of correct classification accuracy of group classification tasks (gender, height and age) using 10-fold cross-validation and subject-wise cross-validation. Sensor positions include: chest (CH), lower back (LB), right wrist (RW) and left ankle (LA). The 10-fold cross-validation model outperforms the subject-wise cross-validation model in all cases.
Table 11.
Subject-wise classification results of different classification categories: gender, height and age. The results show balanced correct classification rates, sensitivity, specificity, the positive predictive value (PPV) of each class and the average PPV of all classes.
Table 11.
Subject-wise classification results of different classification categories: gender, height and age. The results show balanced correct classification rates, sensitivity, specificity, the positive predictive value (PPV) of each class and the average PPV of all classes.
| Classification Task | Body Part | Sensor | Class. Rate | Sens. | Spec. | PPV | PPV | PPV | Avg. PPV |
|---|
| Gender Classification | Chest | A, G | 85.48 | 85.09 | 85.88 | 86.28 | 84.66 | – | 85.47 |
| Lower Back | A, G | 87.95 | 85.71 | 89.71 | 86.74 | 88.88 | – | 87.81 |
| Right Wrist | A, G | 78.90 | 73.50 | 82.69 | 74.89 | 81.63 | – | 78.26 |
| Left Ankle | A, G | 77.14 | 82.32 | 72.67 | 72.17 | 82.68 | – | 77.43 |
| Body Height Classification | Chest | A, G | 82.87 | 79.13 | 91.23 | 75.00 | 71.20 | 91.81 | 79.34 |
| Lower Back | A, G | 84.38 | 84.88 | 92.02 | 83.18 | 81.98 | 87.23 | 84.13 |
| Right Wrist | A, G | 72.61 | 71.98 | 86.31 | 80.02 | 58.66 | 79.10 | 72.59 |
| Left Ankle | A, G | 67.78 | 67.84 | 83.92 | 84.96 | 59.57 | 61.60 | 68.71 |
| Age Classification | Chest | A, G | 68.54 | 69.38 | 84.47 | 59.79 | 85.62 | 70.28 | 71.90 |
| Lower Back | A, G | 72.00 | 72.05 | 85.61 | 63.95 | 72.28 | 85.23 | 73.82 |
| Right Wrist | A, G | 61.99 | 61.72 | 80.96 | 53.01 | 68.50 | 62.84 | 61.45 |
| Left Ankle | A, G | 63.95 | 63.31 | 81.91 | 60.59 | 55.31 | 72.88 | 62.93 |
In the case of gender classification using chest and lower back sensors, the classification rates are and lower than 10-fold cross-validation. For right wrist and left ankle sensors, the classification rates are and lower than 10-fold cross-validation. In the case of height classification using chest and lower back sensors, the classification rates are and lower than 10-fold cross-validation. For right wrist and left ankle sensors, the classification rates are and lower than 10-fold cross-validation.
For the age classification task, a sharp decline in the classification rates is observable in subject-wise cross-validation. For chest and lower back sensors, the classification rates are and lower than 10-fold cross-validation. For right wrist and left ankle, the classification rates are and lower than 10-fold cross-validation. The main reason for such a sharp decline is because of the unbalanced population in classes , and with a subject ratio of 9:6:11.
On the level of subject-wise cross-validation, it is also possible to address the questions of the invariance of the features within the different steps of a walking sequence or to come up with random forest regressions for age and height. Not surprisingly, almost all steps of one walking sequence were classified identically; for gender classification, for height classification and for age classification. When performing a random forest regression instead of a classification, we obtained age classifications with an average RMS error of about 11.51 years and height classification with an average RMS error of about 9.14 cm.


