
Integration of Curved D-Type Optical Fiber Sensor with Microfluidic Chip


Abstract
:1. Introduction
2. Materials and Methods
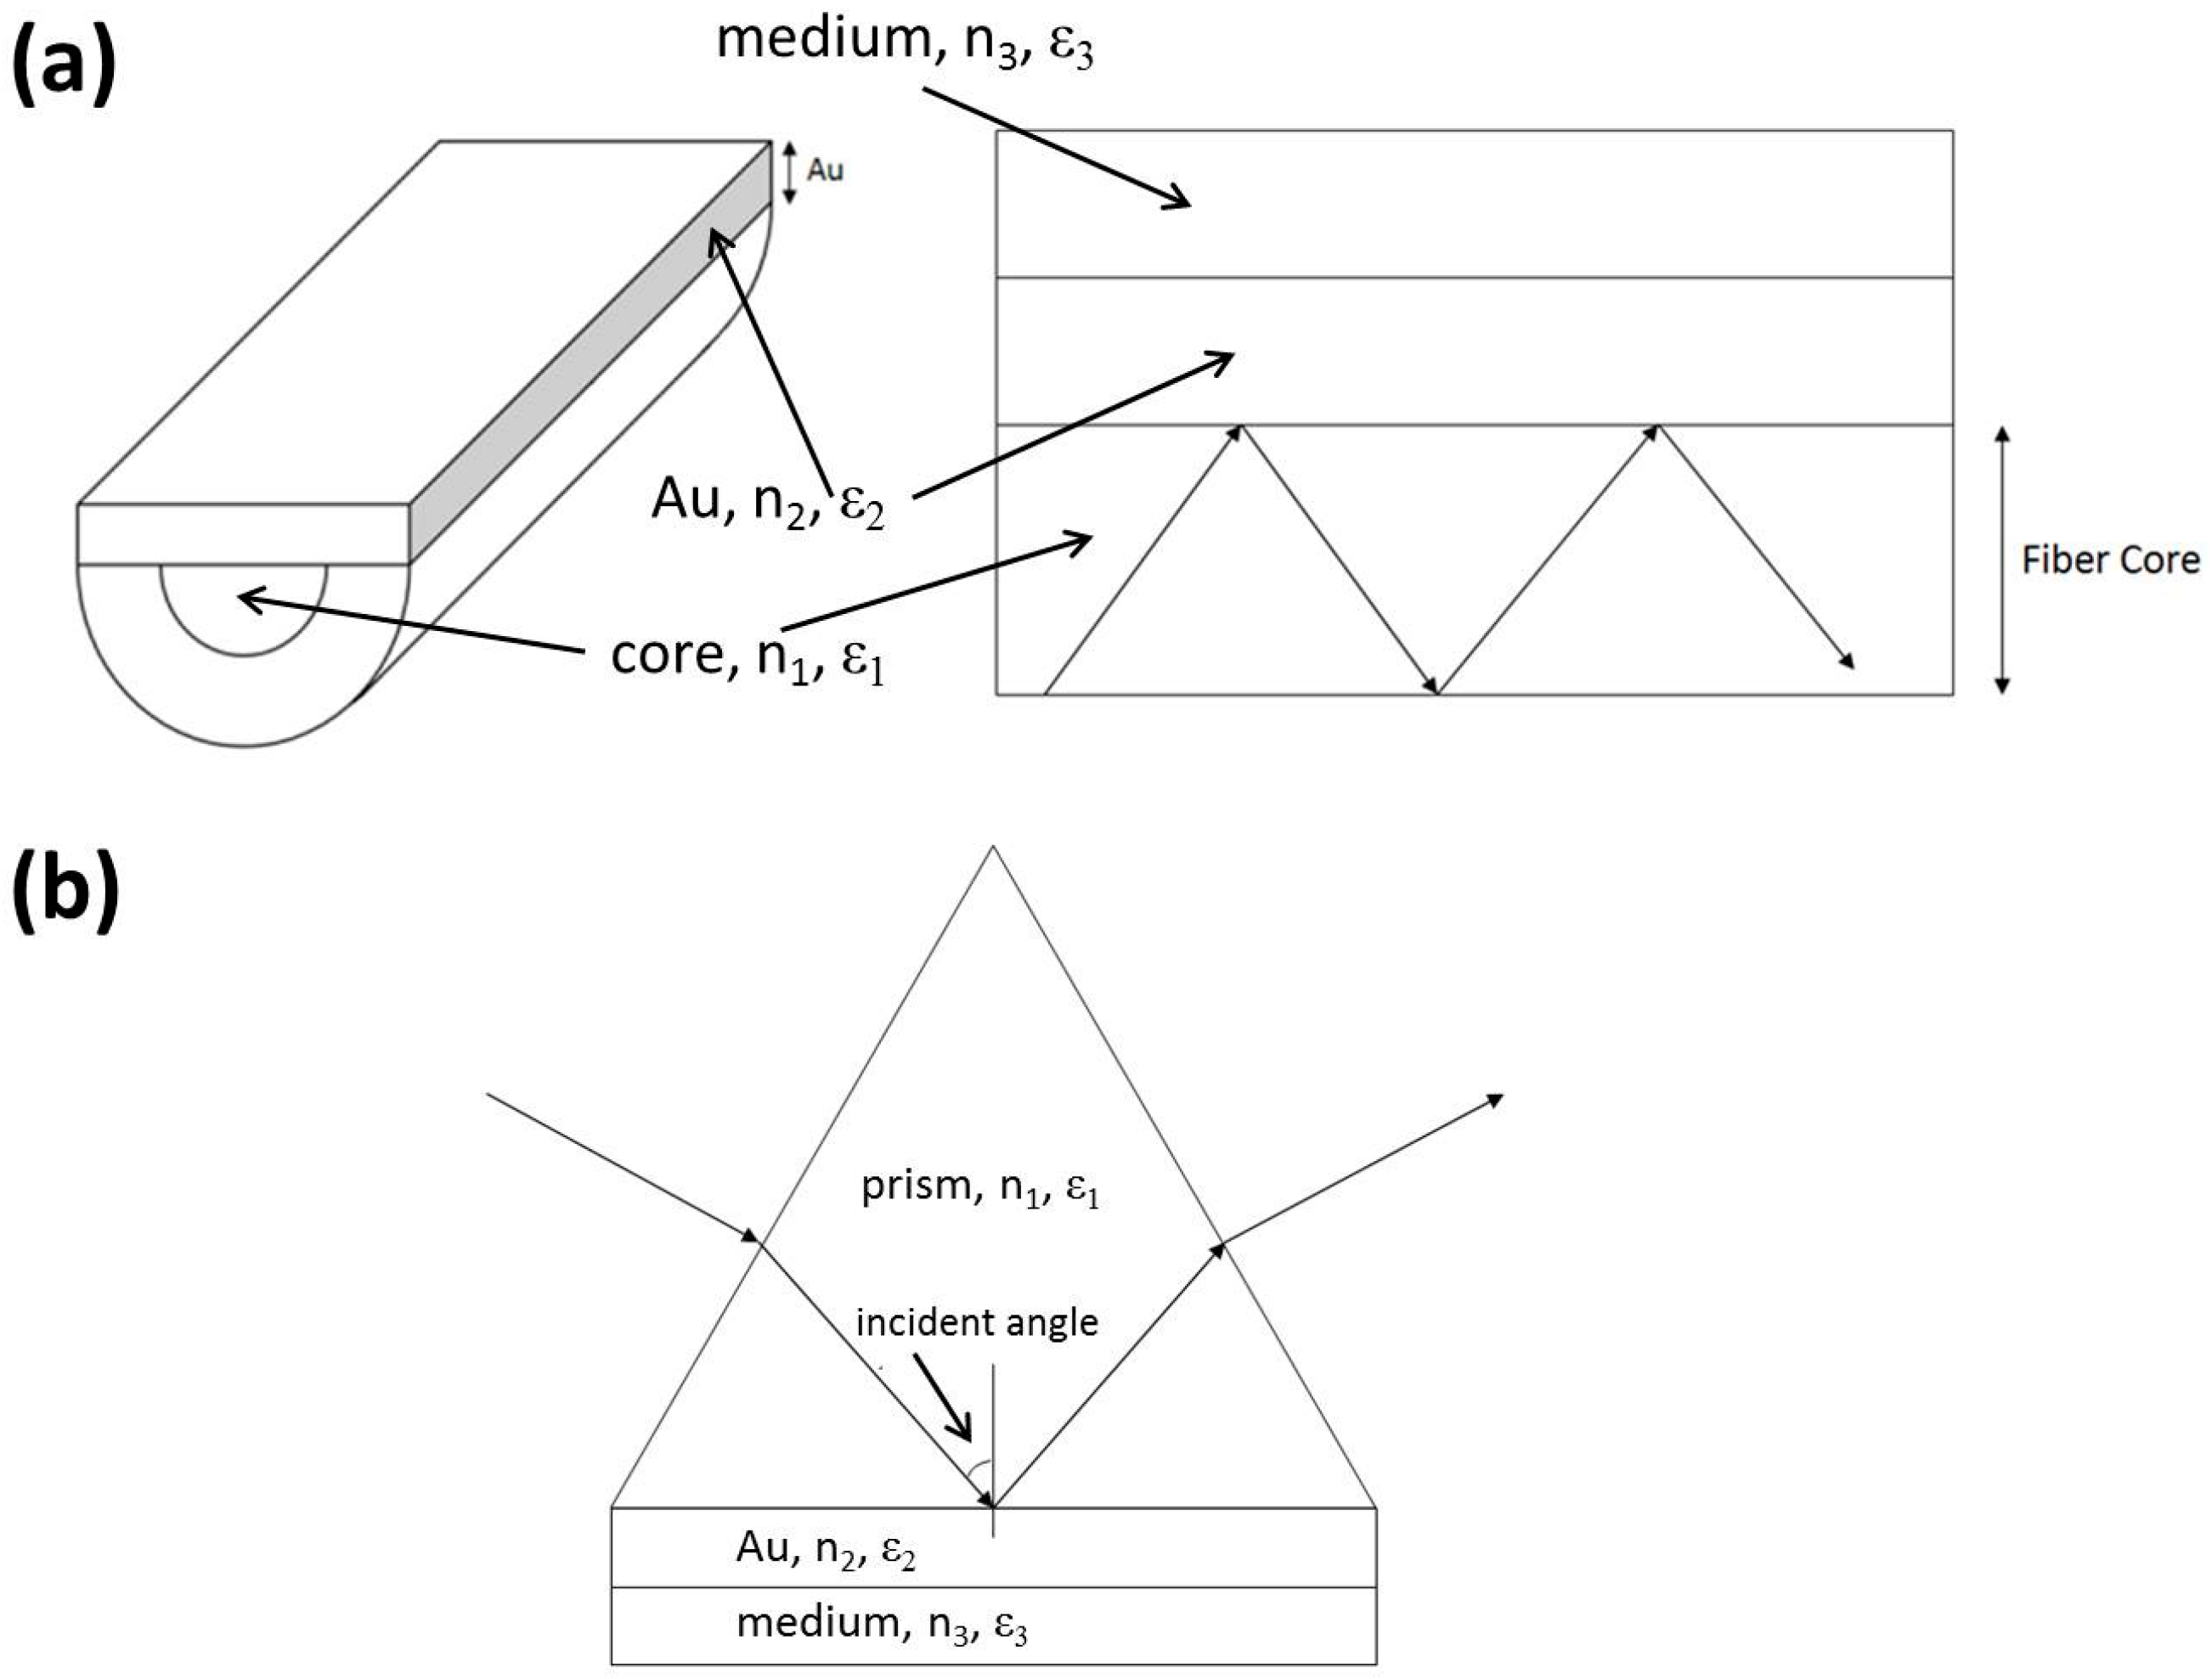
2.1. SPR Theory
2.2. Simulation
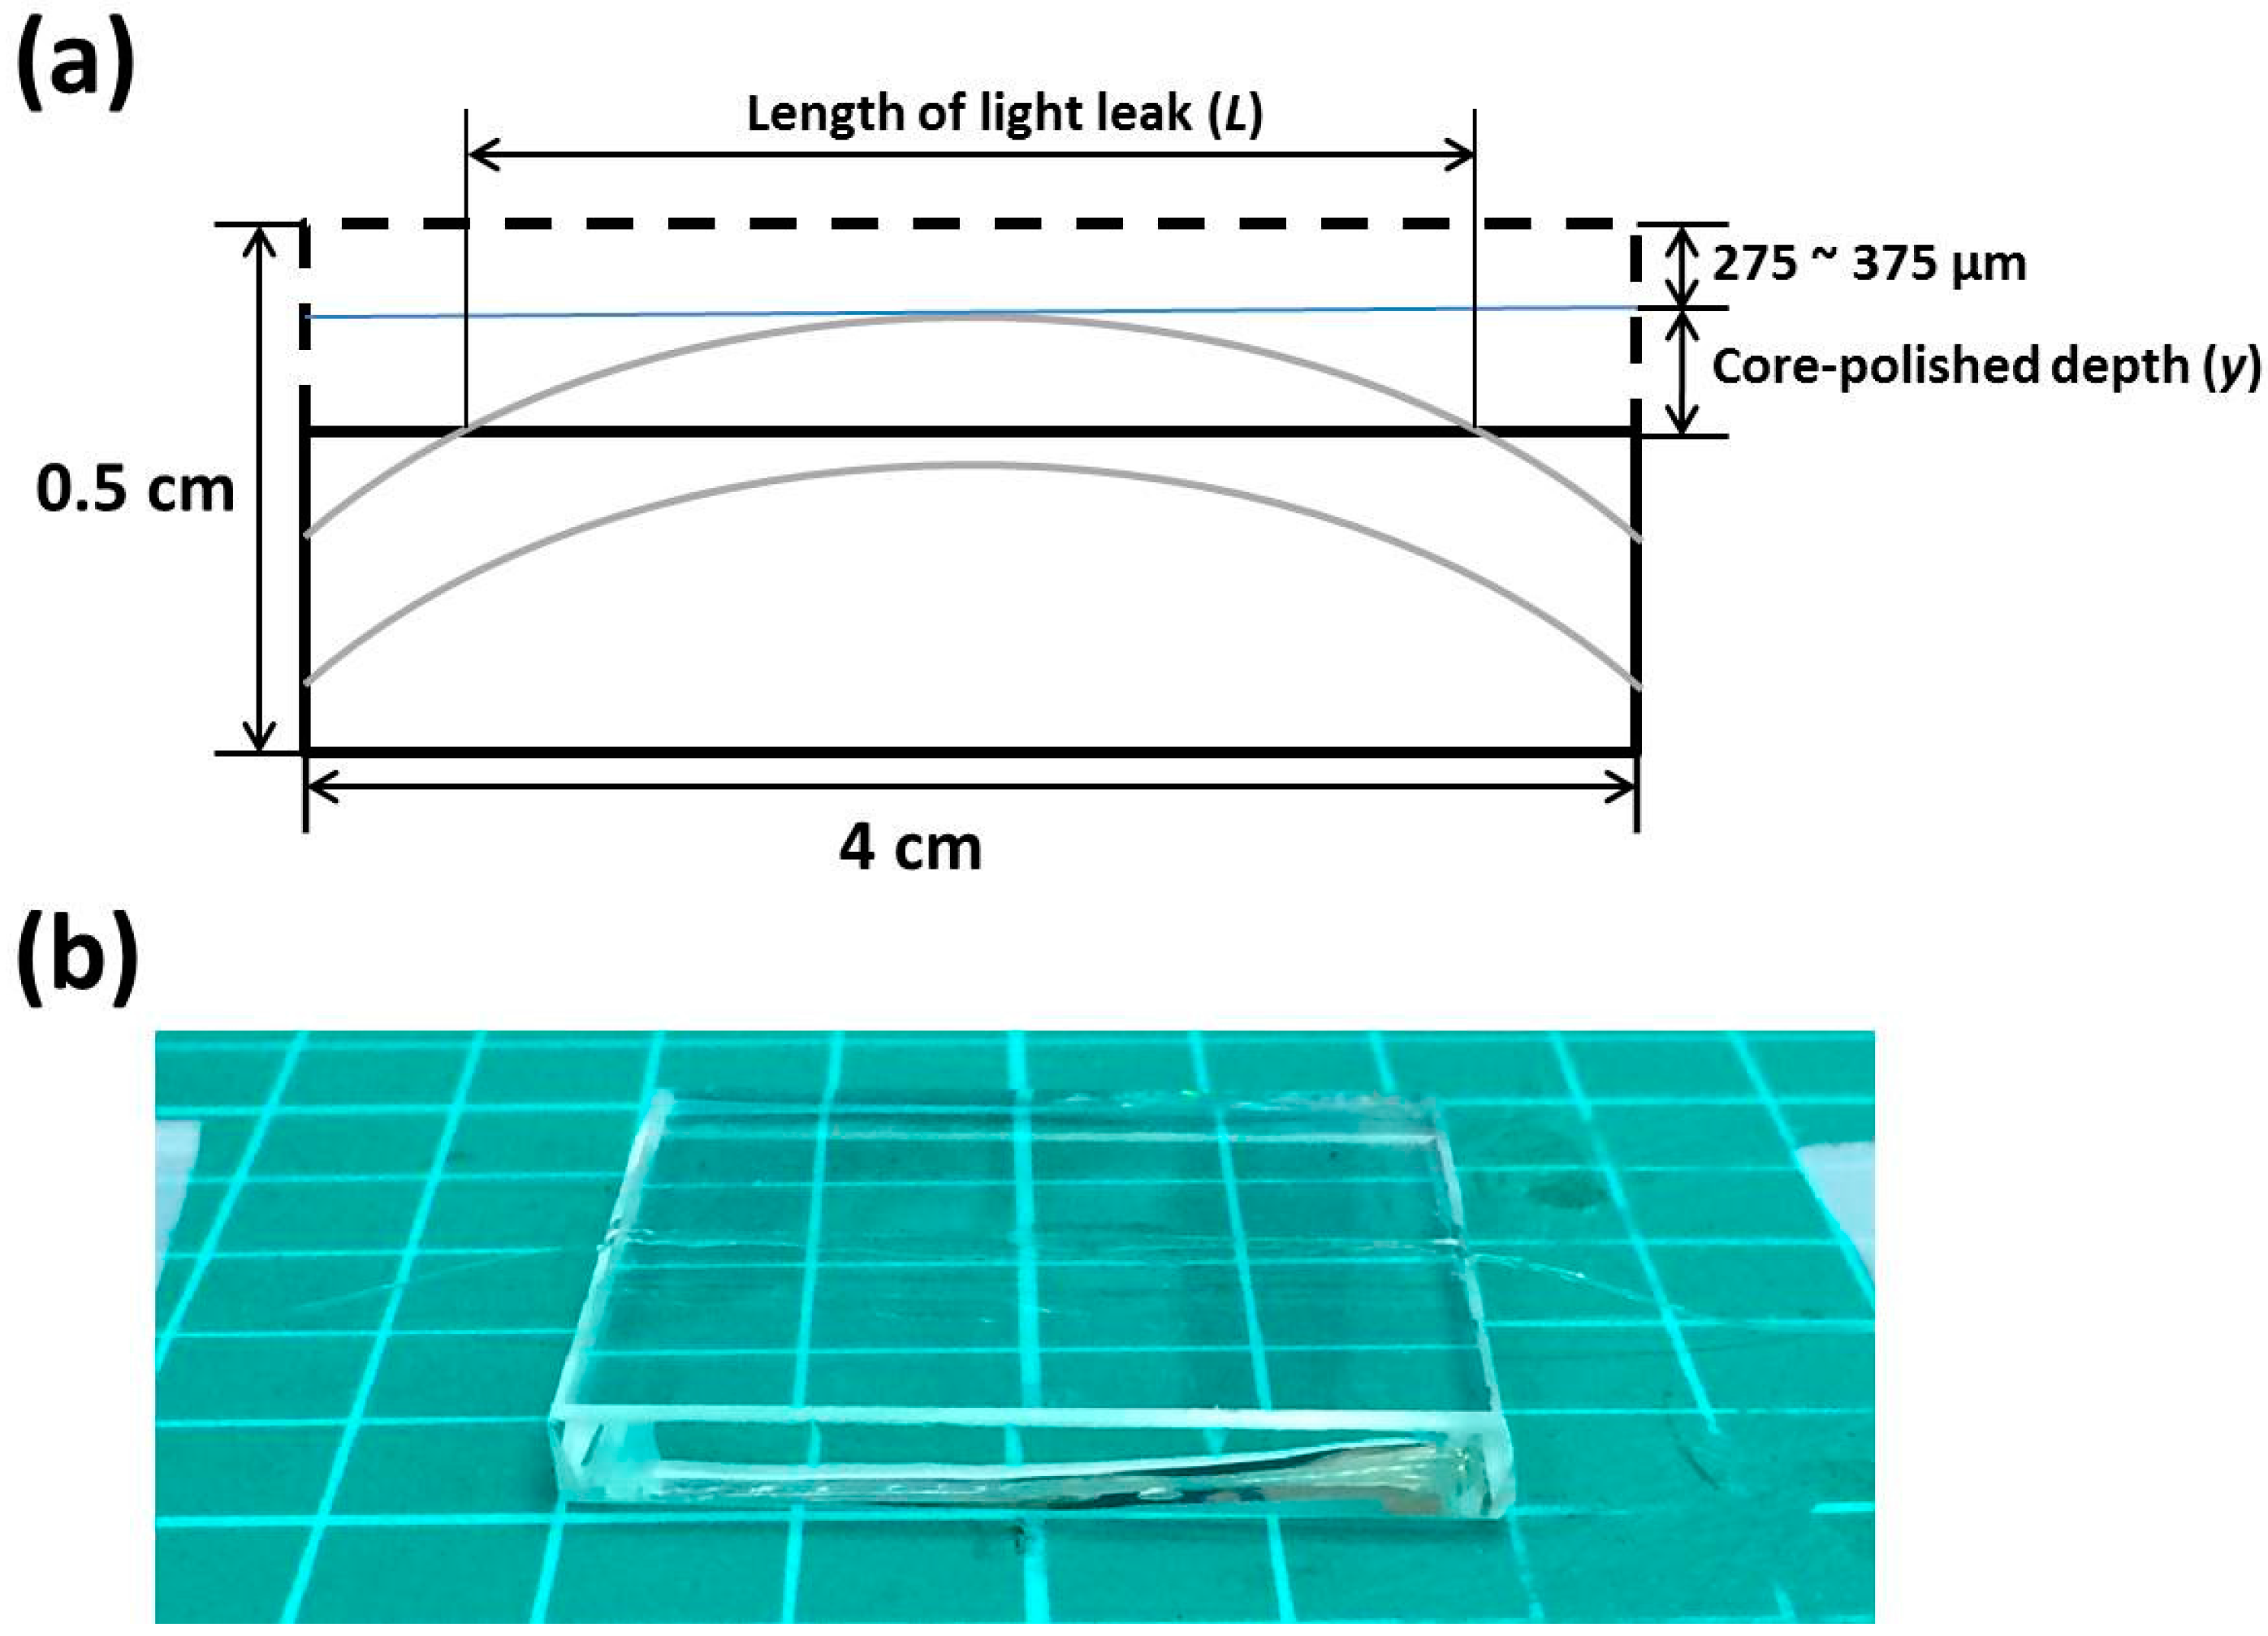
2.3. Fabrication of the OFS
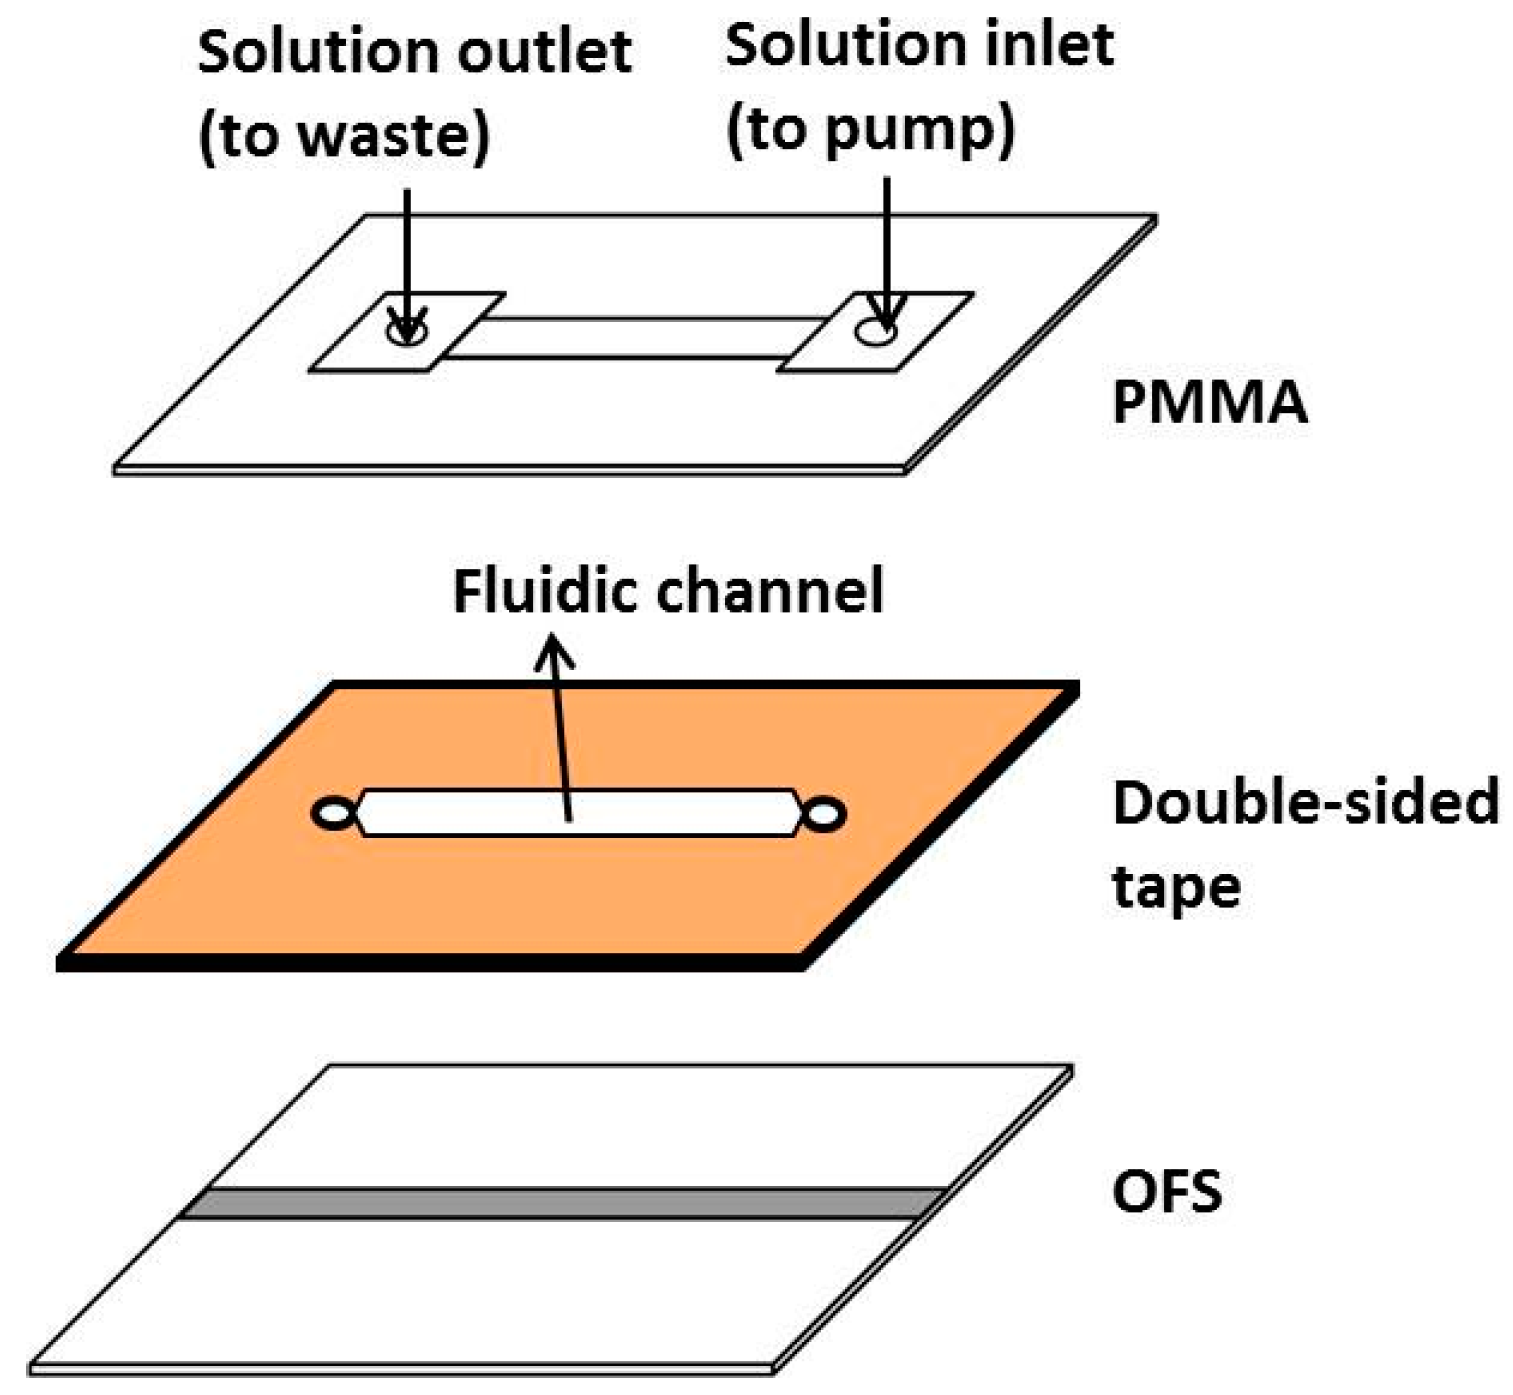
2.4. Fabrication of the Microfluidic Chip
2.5. Materials
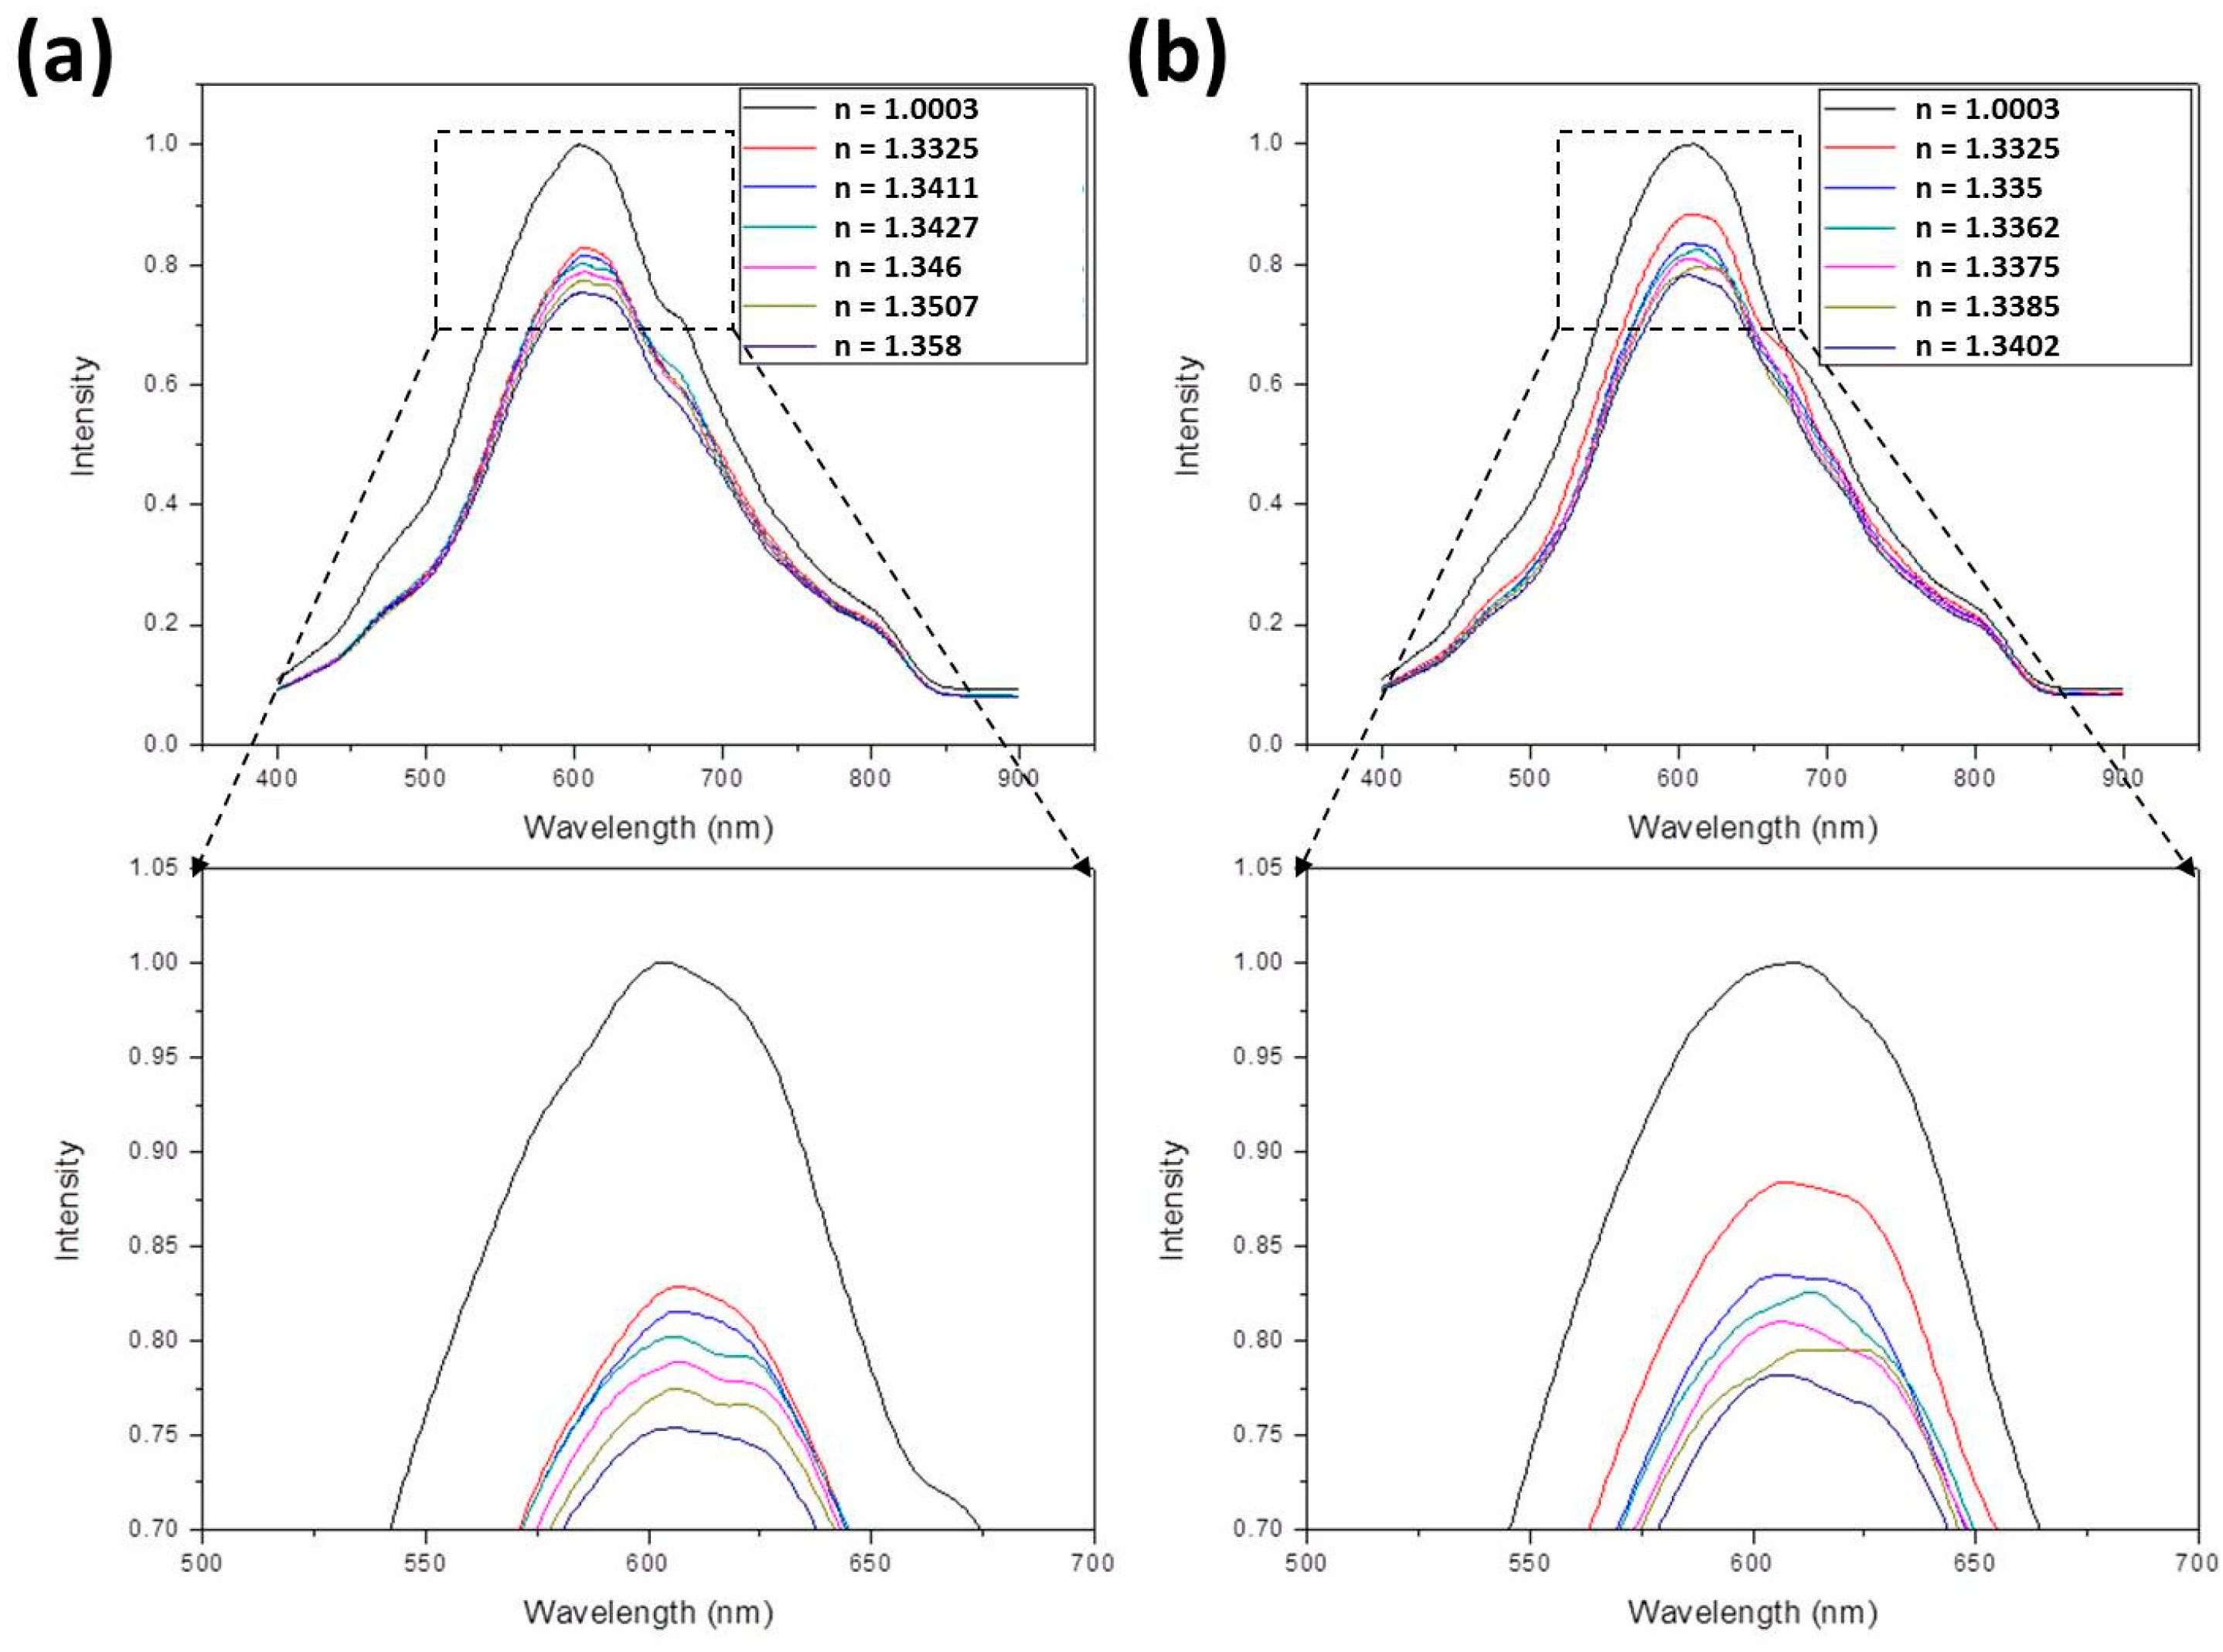
- For ethanol, the following equation is applied:In this equation [40,41], nmix and nwater are the refractive indices of ethanol-water mixture and water, respectively, and Veth/Vtot is the volume ratio of ethanol to total solution. Assuming nwater = 1.33, refractive indices of 1.3412, 1.3429, 1.3456, 1.3499, and 1.3587 were obtained by suitably adjusting Veth/Vtot. These values were further measured to be 1.3411, 1.3427, 1.346, 1.3507, and 1.358.
- For methanol, the following equation is applied:Using this equation, refractive indices of 1.3354, 1.336, 1.3368, 1.3383, and 1.3412 were obtained by suitably adjusting Vmeth/Vtot. These values were further measured to be 1.335, 1.3362, 1.3375, 1.3385, and 1.3402.
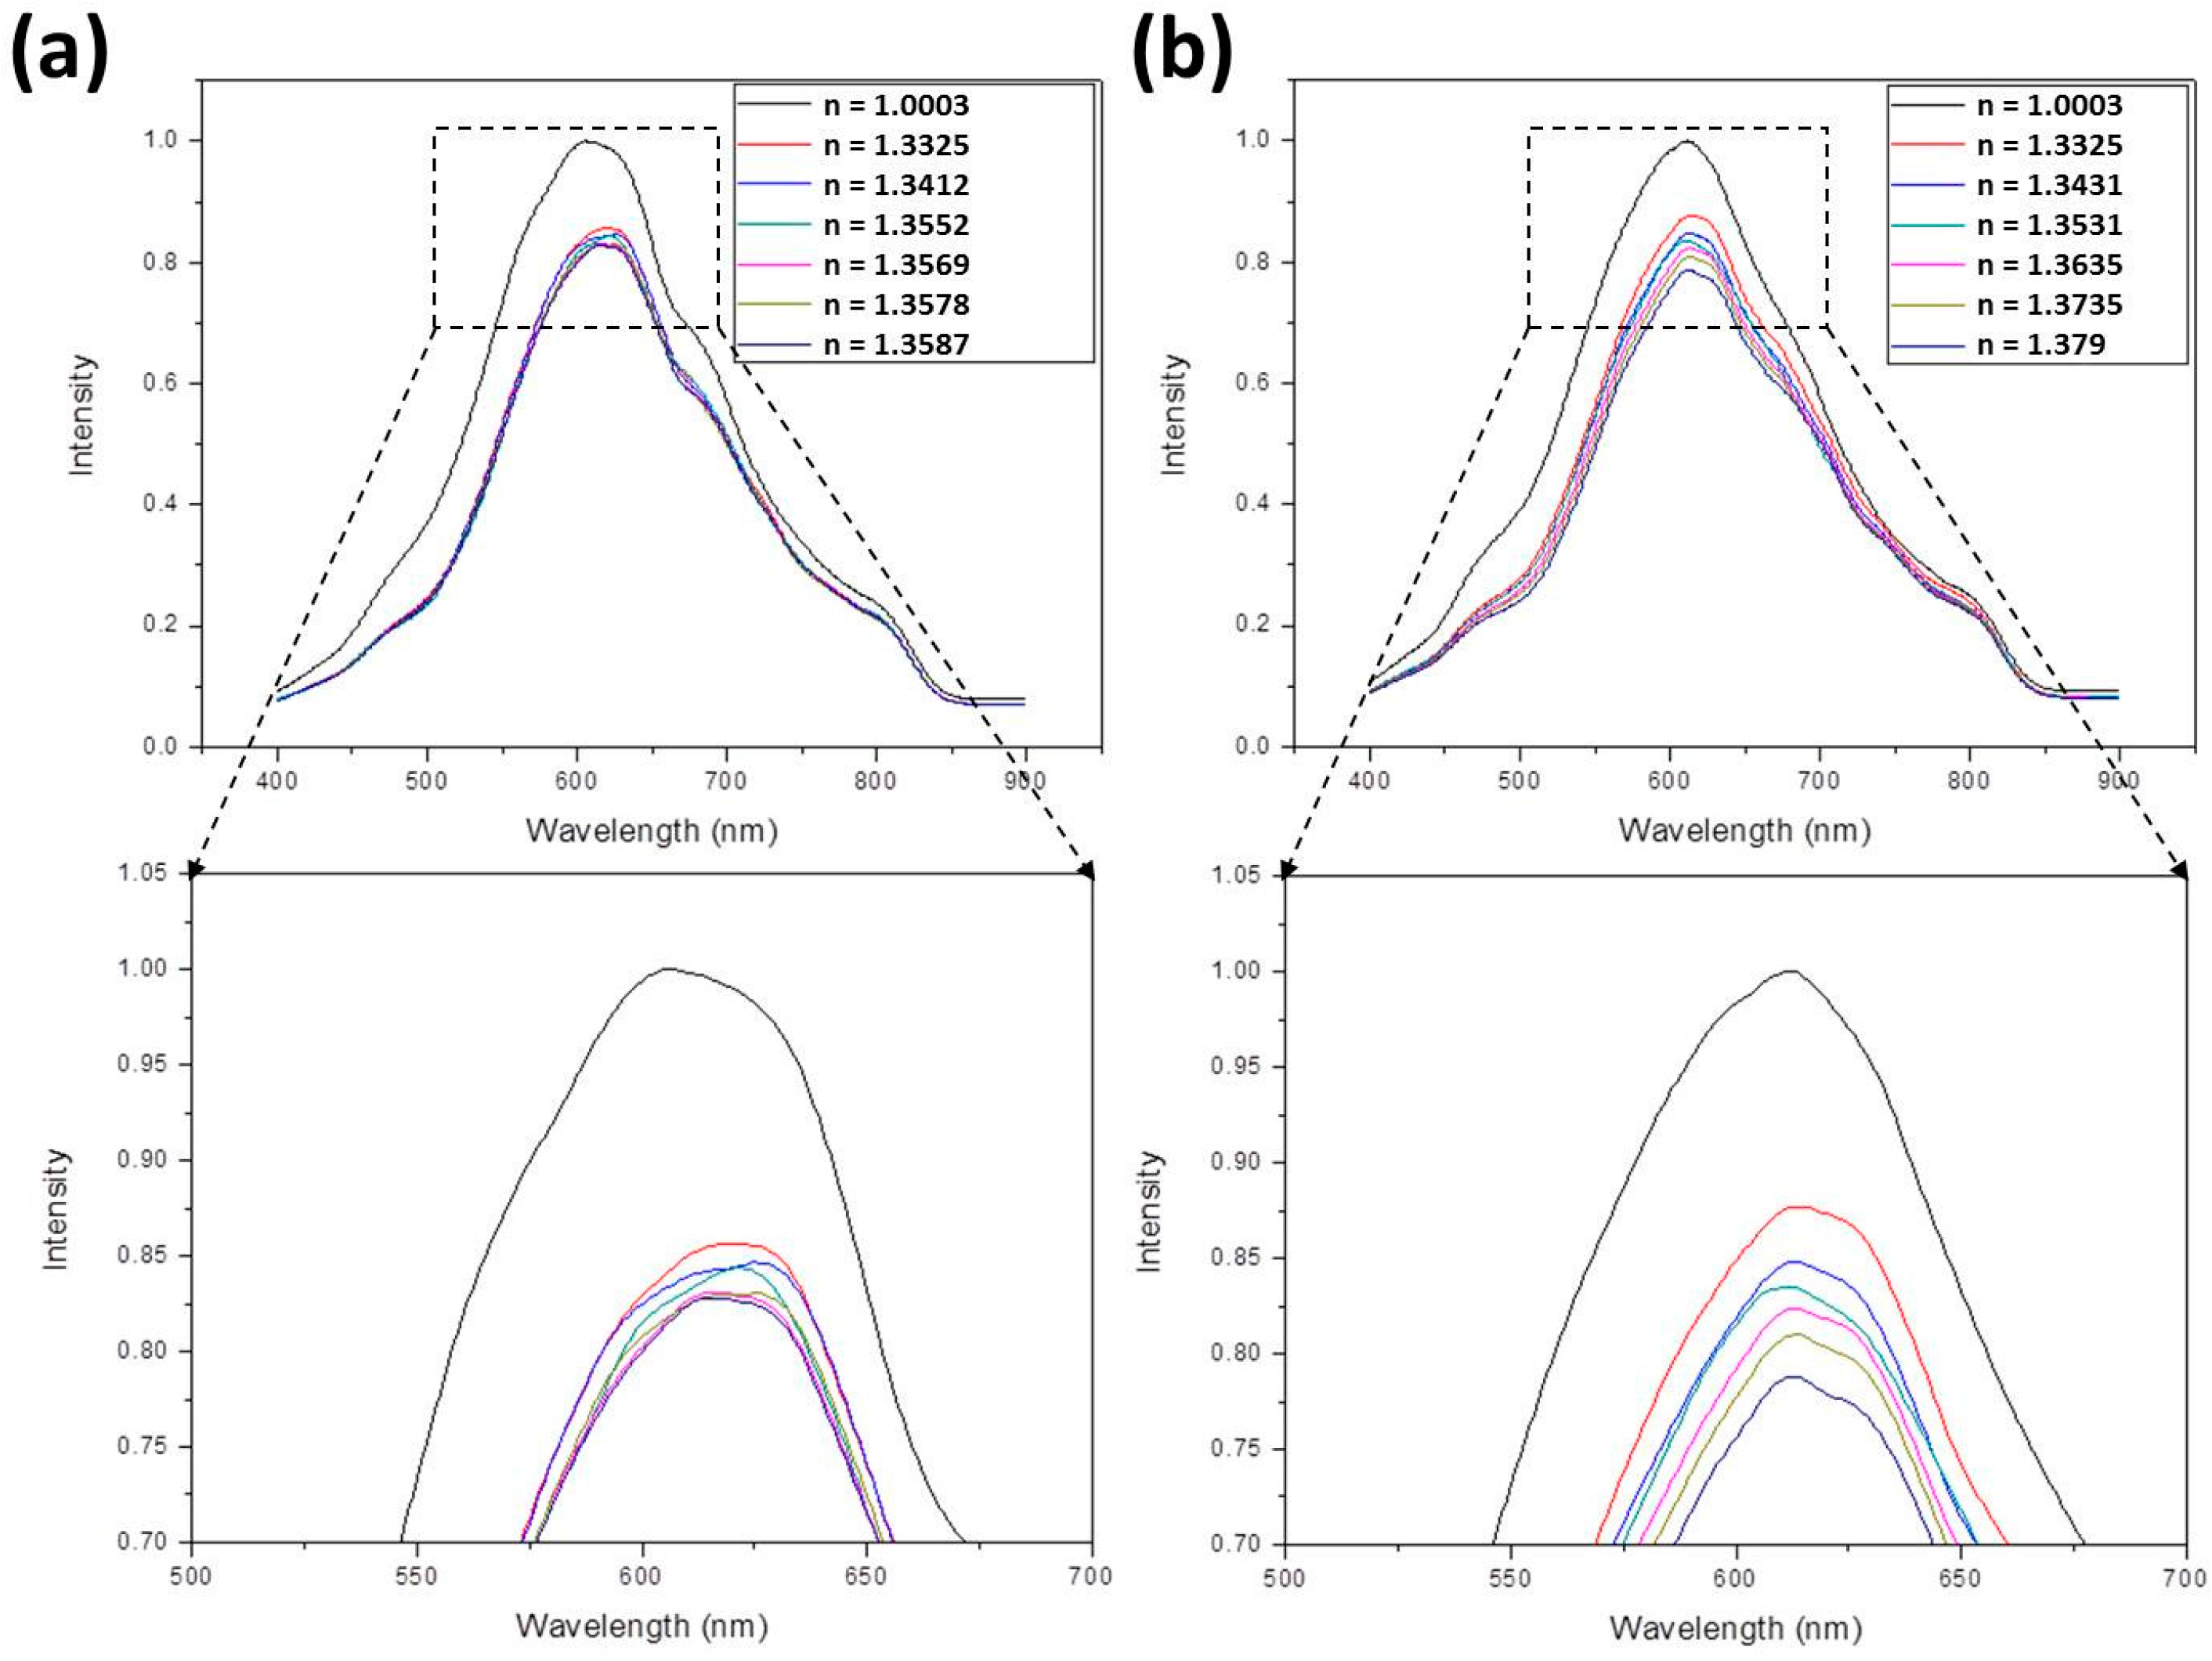
- For ethanol-methanol mixture, the following equation is applied:Using this equation, refractive indices of 1.3412, 1.3552, 1.3569, 1.3578, and 1.3587 were obtained by suitably adjusting Vmeth/Vtot and Veth/Vtot. These values were further measured to be 1.3402, 1.3547, 1.3553, 1.3563, and 1.358.
- For glucose solution, the following equation is applied:In this equation, Mglu/Vtot is the mass concentration (g/mL) of the solution. By suitably adjusting Mglu/Vtot, refractive indices of 1.343, 1.353, 1.363, 1.3731, and 1.383 were obtained. These values were further measured to be 1.3431, 1.3531, 1.3635, 1.3735, and 1.379.
2.6. Experimental Setup
3. Results
3.1. The SPR Spectra
3.2. The Sensitivity
4. Discussion
5. Conclusions
Acknowledgments
Author Contributions
Conflicts of Interest
References
- Pilolli, R.; Visconti, A.; Monaci, L. Rapid and label-free detection of egg allergen traces in wines by surface plasmon resonance biosensor. Anal. Bioanal. Chem. 2015, 407, 3787–3797. [Google Scholar] [CrossRef] [PubMed]
- Li, Y.H.; Yan, Y.R.; Lei, Y.N.; Zhao, D.; Yuan, T.X.; Zhang, D.C.; Cheng, W.; Ding, S.J. Surface plasmon resonance biosensor for label-free and highly sensitive detection of point mutation using polymerization extension reaction. Colloid Surf. B 2014, 120, 15–20. [Google Scholar] [CrossRef] [PubMed]
- Zhang, D.C.; Yan, Y.R.; Li, Q.; Yu, T.X.; Cheng, W.; Wang, L.; Ju, H.X.; Ding, S.J. Label-free and high-sensitive detection of Salmonella using a surface plasmon resonance DNA-based biosensor. J. Biotechnol. 2012, 160, 123–128. [Google Scholar] [CrossRef] [PubMed]
- Hu, J.D.; Li, W.; Wang, T.T.; Lin, Z.L.; Jiang, M.; Hu, F.J. Development of a label-free and innovative approach based on surface plasmon resonance biosensor for on-site detection of infectious bursal disease virus (IBDV). Biosens. Bioelectron. 2012, 31, 475–479. [Google Scholar] [CrossRef]
- Huang, C.J.; Bonroy, K.; Reekman, G.; Verstreken, K.; Lagae, L.; Borghs, G. An on-chip localized surface plasmon resonance-based biosensor for label-free monitoring of antigen-antibody reaction. Microelectron. Eng. 2009, 86, 2437–2441. [Google Scholar] [CrossRef]
- Huang, H.; He, C.C.; Zeng, Y.L.; Xia, X.D.; Yu, X.Y.; Yi, P.G.; Chen, Z. A novel label-free multi-throughput optical biosensor based on localized surface plasmon resonance. Biosens. Bioelectron. 2009, 24, 2255–2259. [Google Scholar] [CrossRef] [PubMed]
- Rich, R.L.; Myszka, D.G. Survey of the year 2007 commercial optical biosensor literature. J. Mol. Recognit. 2008, 21, 355–400. [Google Scholar] [CrossRef] [PubMed]
- Sun, Y.S. Optical Biosensors for Label-Free Detection of Biomolecular Interactions. Instrum. Sci. Technol. 2014, 42, 109–127. [Google Scholar] [CrossRef]
- Kurihara, K.; Suzuki, K. Theoretical understanding of an absorption-based surface plasmon resonance sensor based on Kretchmann’s theory. Anal. Chem. 2002, 74, 696–701. [Google Scholar] [CrossRef] [PubMed]
- Keske, A.; Atar, A.; Ustundag, I.; Caglayan, M.O. Detection of Influenza A by Surface Plasmon Resonance Enhanced Total Internal Reflection Ellipsometry. J. Comput. Theor. Nanosci. 2014, 11, 981–986. [Google Scholar] [CrossRef]
- Ustundag, Z.; Caglayan, M.O.; Guzel, R.; Piskin, E.; Solak, A.O. A novel surface plasmon resonance enhanced total internal reflection ellipsometric application: Electrochemically grafted isophthalic acid nanofilm on gold surface. Analyst 2011, 136, 1464–1471. [Google Scholar] [CrossRef] [PubMed]
- Abbas, A.; Linman, M.J.; Cheng, Q. New trends in instrumental design for surface plasmon resonance-based biosensors. Biosens. Bioelectron. 2011, 26, 1815–1824. [Google Scholar] [CrossRef] [PubMed]
- Scarano, S.; Mascini, M.; Turner, A.P.; Minunni, M. Surface plasmon resonance imaging for affinity-based biosensors. Biosens. Bioelectron. 2010, 25, 957–966. [Google Scholar] [CrossRef] [PubMed] [Green Version]
- Bahrami, F.; Aitchison, J.S.; Mojahedi, M. Dual-Wavelength Spectroscopy of a Metallic-Grating-Coupled Surface Plasmon Resonance Biosensor. IEEE Photonics J. 2015, 7, 4800507. [Google Scholar] [CrossRef]
- Marusov, G.; Sweatt, A.; Pietrosimone, K.; Benson, D.; Geary, S.J.; Silbart, L.K.; Challa, S.; Lagoy, J.; Lawrence, D.A.; Lynes, M.A. A Microarray Biosensor for Multiplexed Detection of Microbes Using Grating-Coupled Surface Plasmon Resonance Imaging. Environ. Sci. Technol. 2012, 46, 348–359. [Google Scholar] [CrossRef] [PubMed]
- Wang, Y.; Dostalek, J.; Knoll, W. Magnetic Nanoparticle-Enhanced Biosensor Based on Grating-Coupled Surface Plasmon Resonance. Anal. Chem. 2011, 83, 6202–6207. [Google Scholar] [CrossRef] [PubMed]
- Sharma, A.K.; Gupta, B.D. Theoretical model of a fiber optic remote sensor based on surface plasmon resonance for temperature detection. Opt. Fiber. Technol. 2006, 12, 87–100. [Google Scholar] [CrossRef]
- Sharma, A.K.; Jha, R.; Gupta, B.D. Fiber-optic sensors based on surface plasmon resonance: A comprehensive review. IEEE Sens. J. 2007, 7, 1118–1129. [Google Scholar] [CrossRef]
- Sciacca, B.; Monro, T.M. Dip biosensor based on localized surface plasmon resonance at the tip of an optical fiber. Langmuir 2014, 30, 946–954. [Google Scholar] [CrossRef] [PubMed]
- Sai, V.V.; Kundu, T.; Mukherji, S. Novel U-bent fiber optic probe for localized surface plasmon resonance based biosensor. Biosens. Bioelectron. 2009, 24, 2804–2809. [Google Scholar] [CrossRef] [PubMed]
- Lin, T.J.; Chung, M.F. Detection of cadmium by a fiber-optic biosensor based on localized surface plasmon resonance. Biosens. Bioelectron. 2009, 24, 1213–1218. [Google Scholar] [CrossRef] [PubMed]
- Villuendas, F.; Pelayo, J. Optical fibre device for chemical seming based on surface plasmon excitridon. Sens. Actuators A 1990, 23, 1142–1145. [Google Scholar] [CrossRef]
- Bardin, F.; Ivan, K.; Trouillet, A.; Matejec, V.; Gagnaire, H.; Chomat, M. Surface plasmon resonance sensor using an optical fiber with an inverted graded-index profile. Appl. Opt. 2002, 41, 2514–2520. [Google Scholar] [CrossRef] [PubMed]
- Hautakorpi, M.; Mattinen, M.; Ludvigsen, H. Surface-plasmon-resonance sensor based on three-hole microstructured optical fiber. Opt. Express 2008, 16, 8427–8432. [Google Scholar] [CrossRef] [PubMed]
- Lo, Y.L.; Chuang, C.H.; Lin, Z.W. Ultrahigh sensitivity polarimetric strain sensor based upon D-shaped optical fiber and surface plasmon resonance technology. Opt. Lett. 2011, 36, 2489–2491. [Google Scholar] [CrossRef] [PubMed]
- Luan, N.; Wang, R.; Lv, W.; Yao, J. Surface plasmon resonance sensor based on D-shaped microstructured optical fiber with hollow core. Opt. Express 2015, 23, 8576–8582. [Google Scholar] [CrossRef] [PubMed]
- Wang, S.F.; Chiu, M.H.; Hsu, J.C.; Chang, R.S.; Wang, F.T. Theoretical analysis and experimental evaluation of D-type optical fiber sensor with a thin gold film. Opt. Commun. 2005, 253, 283–289. [Google Scholar] [CrossRef]
- Chiu, M.H.; Shih, C.H.; Chi, M.H. Optimum sensitivity of single-mode D-type optical fiber sensor in the intensity measurement. Sens. Actuators B-Chem. 2007, 123, 1120–1124. [Google Scholar] [CrossRef]
- Homola, J.; Slavik, R. Fibre-optic sensor based on surface plasmon resonance. Electron. Lett. 1996, 32, 480–482. [Google Scholar] [CrossRef]
- Hsu, J.C.; Jeng, S.W.; Sun, Y.S. Simulation and experiments for optimizing the sensitivity of curved D-type optical fiber sensor with a wide dynamic range. Opt. Commun. 2015, 341, 210–217. [Google Scholar] [CrossRef]
- Sun, Y.S.; Zhu, X.D. Kinetic Analysis of Biomolecular Interactions Using Label-Free Biosensors. Instrum. Sci. Technol. 2015, 43, 255–267. [Google Scholar] [CrossRef]
- Kusnezow, W.; Syagailo, Y.V.; Ruffer, S.; Klenin, K.; Sebald, W.; Hoheisel, J.D.; Gauer, C.; Goychuk, I. Kinetics of antigen binding to antibody microspots: Strong limitation by mass transport to the surface. Proteomics 2006, 6, 794–803. [Google Scholar] [CrossRef] [PubMed]
- Schuck, P.; Minton, A.P. Analysis of mass transport-limited binding kinetics in evanescent wave biosensors. Anal. Biochem. 1996, 240, 262–272. [Google Scholar] [CrossRef] [PubMed]
- Hsu, W.T.; Hsieh, W.H.; Cheng, S.F.; Jen, C.P.; Wu, C.C.; Li, C.H.; Lee, C.Y.; Li, W.Y.; Chau, L.K.; Chiang, C.Y.; et al. Integration of fiber optic-particle plasmon resonance biosensor with microfluidic chip. Anal. Chim. Acta 2011, 697, 75–82. [Google Scholar] [CrossRef]
- Makiabadi, T.; Le Nader, V.; Kanso, M.; Louarn, G. Comprehensive study of an optical fiber plasmonic microsensor in a microfluidic device. Eur. Phys. J. Appl. Phys. 2011, 56, 13704. [Google Scholar] [CrossRef]
- Wu, S.Y.; Hou, H.S.; Sun, Y.S.; Cheng, J.Y.; Lo, K.Y. Correlation between cell migration and reactive oxygen species under electric field stimulation. Biomicrofluidics 2015, 9, 054120. [Google Scholar] [CrossRef] [PubMed]
- Lo, K.Y.; Zhu, Y.; Tsai, H.F.; Sun, Y.S. Effects of shear stresses and antioxidant concentrations on the production of reactive oxygen species in lung cancer cells. Biomicrofluidics 2013, 7, 064108. [Google Scholar] [CrossRef] [PubMed]
- Sun, Y.S.; Peng, S.W.; Cheng, J.Y. In vitro electrical-stimulated wound-healing chip for studying electric field-assisted wound-healing process. Biomicrofluidics 2012, 6, 034117. [Google Scholar] [CrossRef] [PubMed]
- Sun, Y.S.; Peng, S.W.; Lin, K.H.; Cheng, J.Y. Electrotaxis of lung cancer cells in ordered three-dimensional scaffolds. Biomicrofluidics 2012, 6, 014102. [Google Scholar] [CrossRef] [PubMed]
- Esteban, O.; Diaz-Herrera, N.; Navarrete, M.C.; Gonzalez-Cano, A. Surface plasmon resonance sensors based on uniform-waist tapered fibers in a reflective configuration. Appl. Opt. 2006, 45, 7294–7298. [Google Scholar] [CrossRef] [PubMed]
- Bueno, F.J.; Esteban, O.; Diaz-Herrera, N.; Navarrete, M.C.; Gonzalez-Cano, A. Sensing properties of asymmetric double-layer-covered tapered fibers. Appl. Opt. 2004, 43, 1615–1620. [Google Scholar] [CrossRef] [Green Version]
- Song, X.F.; Wang, Z.J.; Liu, Y.B.; Wang, C.; Li, L.J. A highly sensitive ethanol sensor based on mesoporous ZnO-SnO2 nanofibers. Nanotechnology 2009, 20, 075501. [Google Scholar] [CrossRef] [PubMed]
- Shabaneh, A.A.; Girei, S.H.; Arasu, P.T.; Rashid, S.A.; Yunusa, Z.; Mahdi, M.A.; Paiman, S.; Ahmad, M.Z.; Yaacob, M.H. Reflectance Response of Optical Fiber Coated With Carbon Nanotubes for Aqueous Ethanol Sensing. IEEE Photonics J. 2014, 6, 1–10. [Google Scholar] [CrossRef]
- Morisawa, M.; Muto, S. Plastic Optical Fiber Sensing of Alcohol Concentration in Liquors. J. Sens. 2012, 709849. [Google Scholar] [CrossRef]
- Rahman, M.M.; Khan, S.B.; Jamal, A.; Faisal, M.; Asiri, A.M. Fabrication of a methanol chemical sensor based on hydrothermally prepared alpha-Fe2O3 codoped SnO2 nanocubes. Talanta 2012, 95, 18–24. [Google Scholar] [CrossRef] [PubMed]
- Rahman, M.M.; Khan, S.B.; Jamal, A.; Faisal, M.; Asiri, A.M. Highly sensitive methanol chemical sensor based on undoped silver oxide nanoparticles prepared by a solution method. Microchim. Acta 2012, 178, 99–106. [Google Scholar] [CrossRef]
- Fabian, M.; Lewis, E.; Newe, T.; Lochmann, S.; Mueller, I. Investigation of ethanol and methanol water mixtures in the visible wavelength area using fibre-optic evanescent field absorption sensors based on a u-shaped, a coil-shaped and a meander-shaped probe. In Proceeding of the SAS 2008-IEEE Sensors Applications Symposium, Atlanta, GA, USA, 12–14 February 2008.
- Wang, C.J.; Kaya, M.; Wang, C. Evanescent field-fiber loop ringdown glucose sensor. J. Biomed. Opt. 2012, 17, 037004. [Google Scholar] [CrossRef] [PubMed]
- Luo, B.B.; Yan, Z.J.; Sun, Z.Y.; Liu, Y.; Zhao, M.F.; Zhang, L. Biosensor based on excessively tilted fiber grating in thin-cladding optical fiber for sensitive and selective detection of low glucose concentration. Opt. Express 2015, 23, 32429–32440. [Google Scholar] [CrossRef] [PubMed]
- Li, L.; Walt, D.R. Dual-analyte fiber-optic sensor for the simultaneous and continuous measurement of glucose and oxygen. Anal. Chem. 1995, 67, 3746–3752. [Google Scholar] [CrossRef] [PubMed]


| Bio-Liquids | Refractive Index | Slope | Sensitivity | Previous Report Sensitivity |
|---|---|---|---|---|
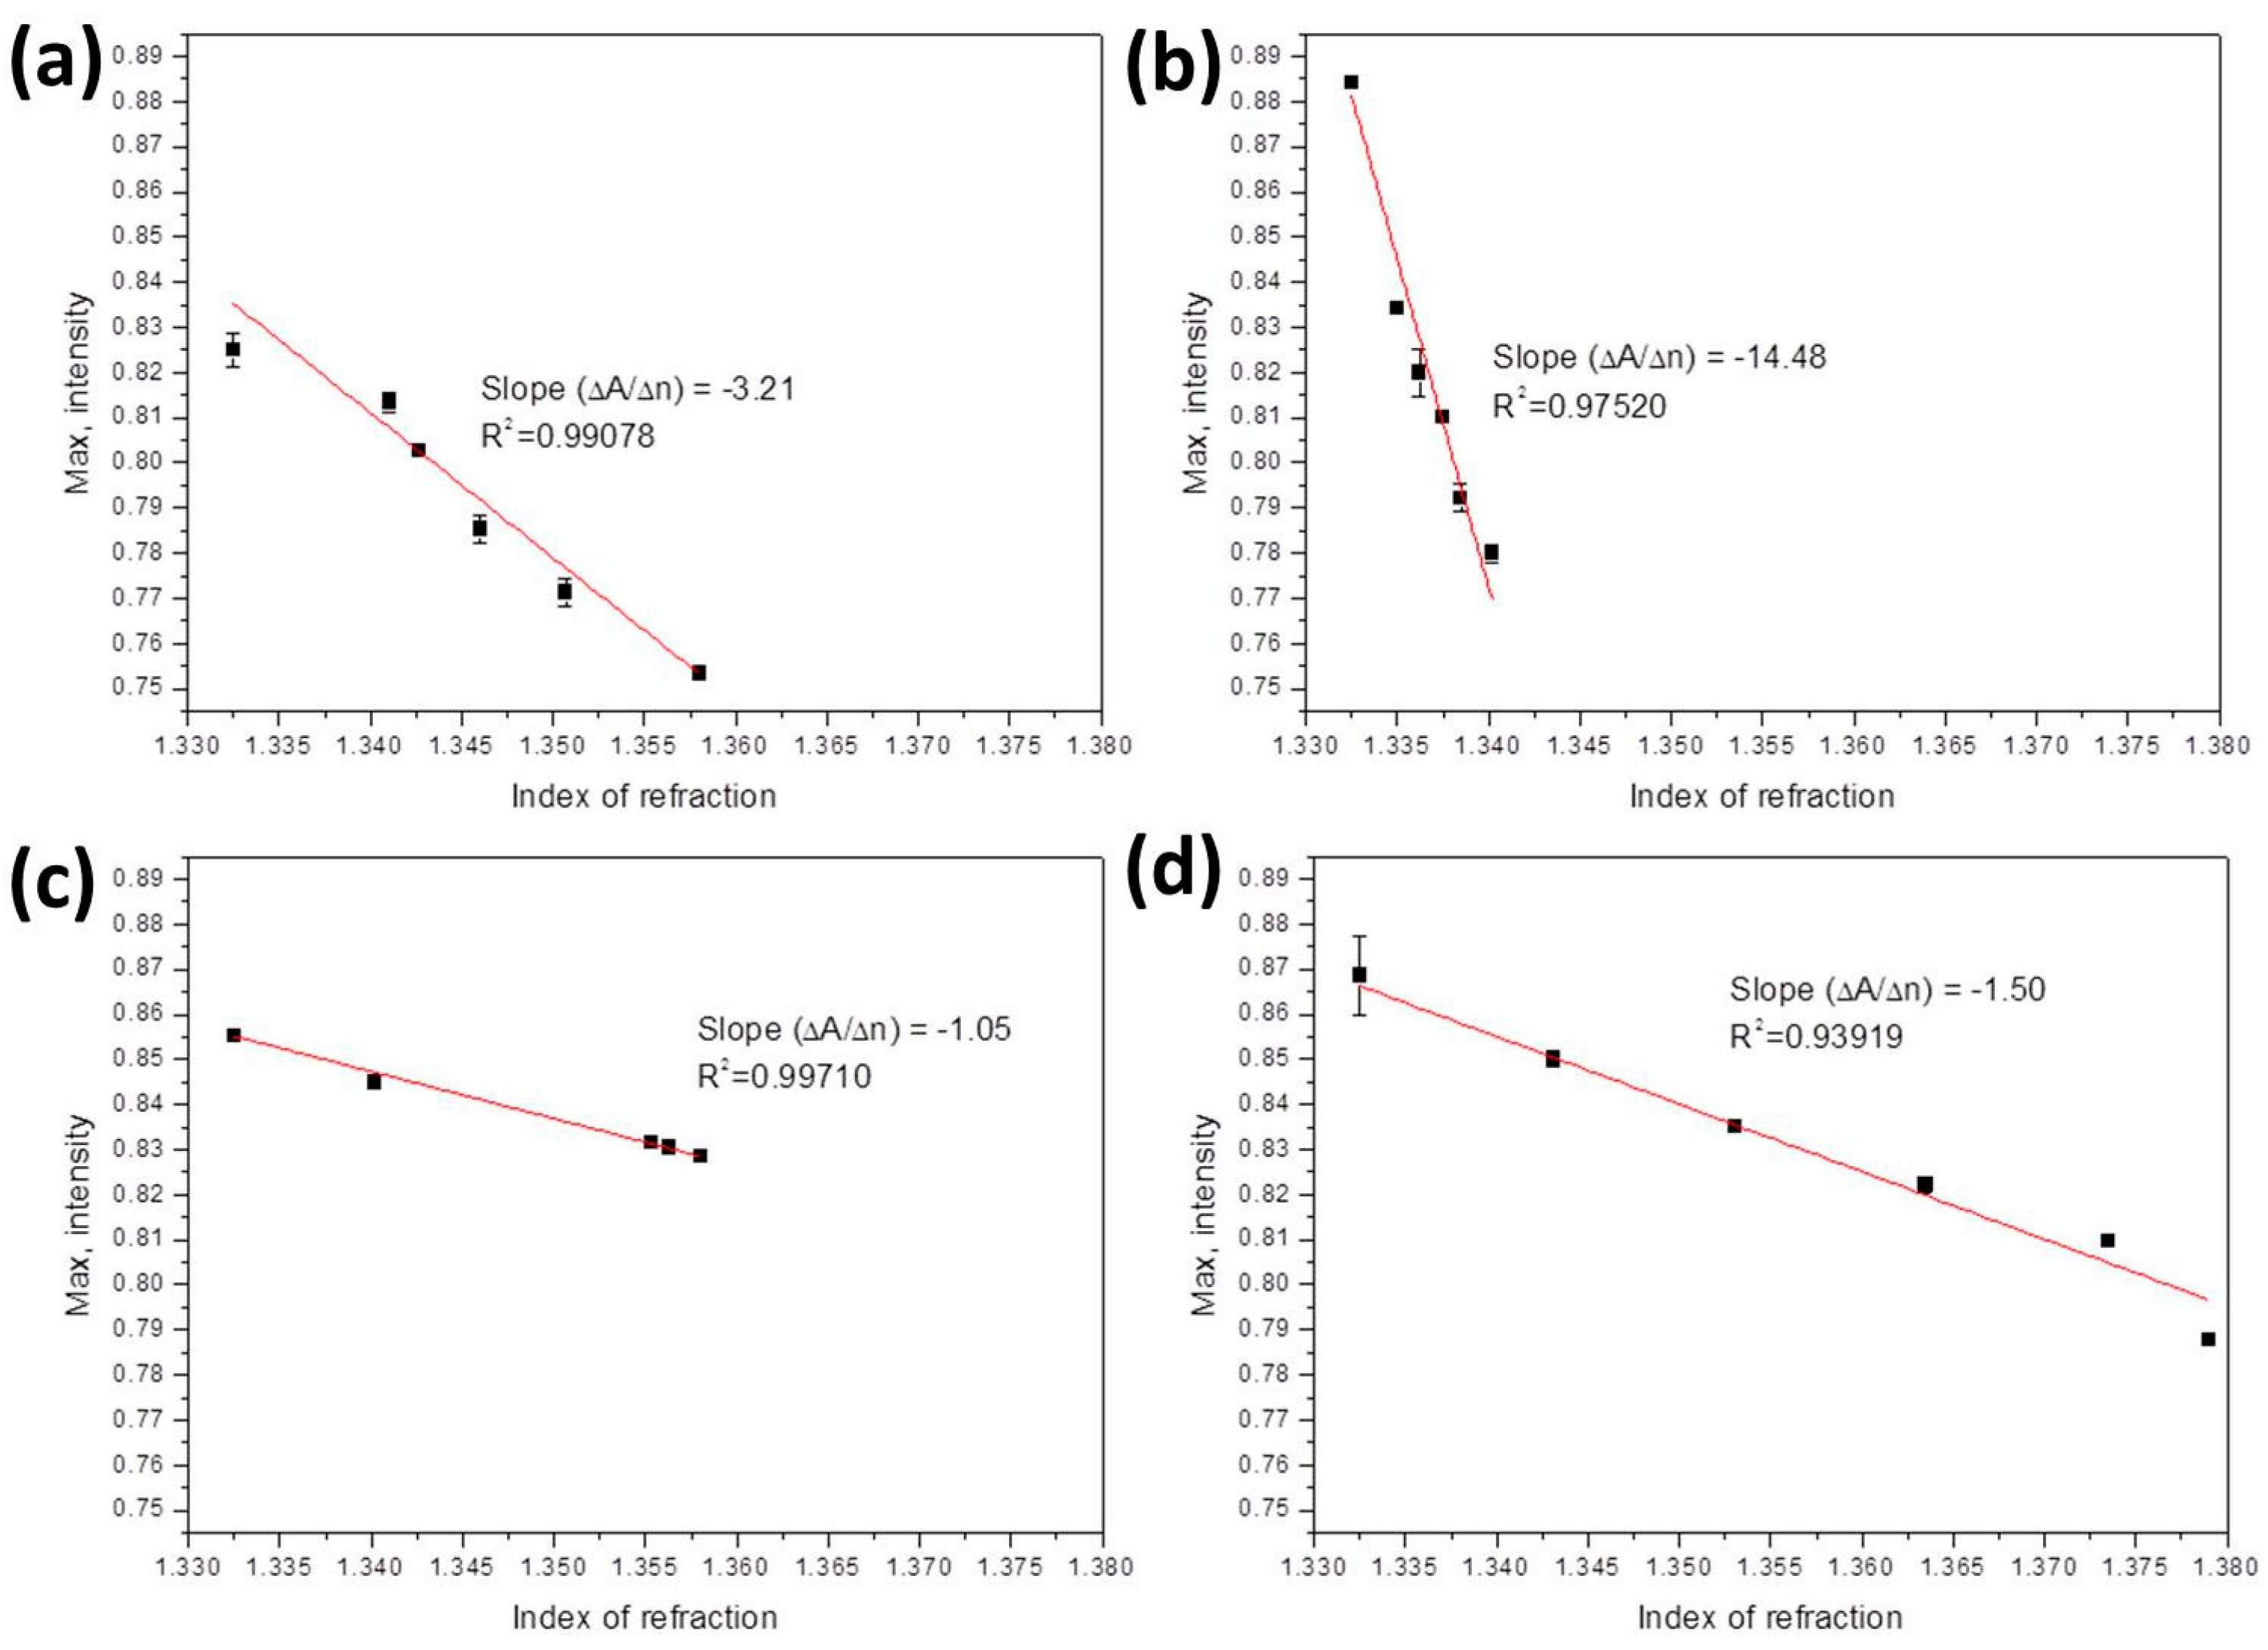
| Ethanol solutions | 1.3325–1.358 | –3.21 | 3.12 × 10⁻⁵ RIU or 0.06% or 60 ppm | 3–500 ppm [42]; 5%–80% [43]; 5%–40% [44] |
| Methanol solutions | 1.3325–1.3402 | –14.48 | 6.91 × 10⁻⁶ RIU or 0.04% or 40 ppm | 6.5 ppm [45]; 1.5 ppm [46] |
| Ethanol-methanol | 1.3325–1.358 | –1.05 | 9.52 × 10⁻⁵ RIU or 0.273%/273 ppm of methanol | Methanol 0.5% [47] |
| Glucose solutions | 1.3325–1.379 | –1.5 | 6.67 × 10⁻⁵ RIU or 66 mg/dL of glucose | 10 mg/dL [48,49]; 1.08 mg/dL [50] |
© 2016 by the authors; licensee MDPI, Basel, Switzerland. This article is an open access article distributed under the terms and conditions of the Creative Commons Attribution (CC-BY) license (http://creativecommons.org/licenses/by/4.0/).
Share and Cite
Sun, Y.-S.; Li, C.-J.; Hsu, J.-C. Integration of Curved D-Type Optical Fiber Sensor with Microfluidic Chip. Sensors 2017, 17, 63. https://doi.org/10.3390/s17010063
Sun Y-S, Li C-J, Hsu J-C. Integration of Curved D-Type Optical Fiber Sensor with Microfluidic Chip. Sensors. 2017; 17(1):63. https://doi.org/10.3390/s17010063
Chicago/Turabian StyleSun, Yung-Shin, Chang-Jyun Li, and Jin-Cherng Hsu. 2017. "Integration of Curved D-Type Optical Fiber Sensor with Microfluidic Chip" Sensors 17, no. 1: 63. https://doi.org/10.3390/s17010063