
A Review of Wearable Technologies for Elderly Care that Can Accurately Track Indoor Position, Recognize Physical Activities and Monitor Vital Signs in Real Time

Abstract
: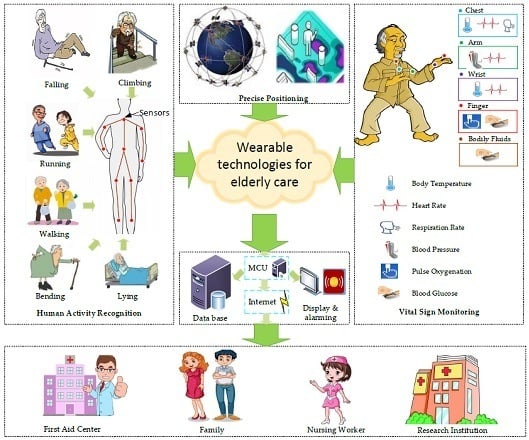
1. Introduction
- Investigate and summarize the state-of-the-art technologies to achieve precise indoor positioning based on wireless/wired communication;
- Compare up to date physical activity tracking approaches that incorporate multiple sensors into sensing nodes wearable by people;
- Present some flexible and wearable medical devices that have been demonstrated with applications in vital signs monitoring, utilizing flexible, stretchable, and lightweight materials for fabricating the biosensors.
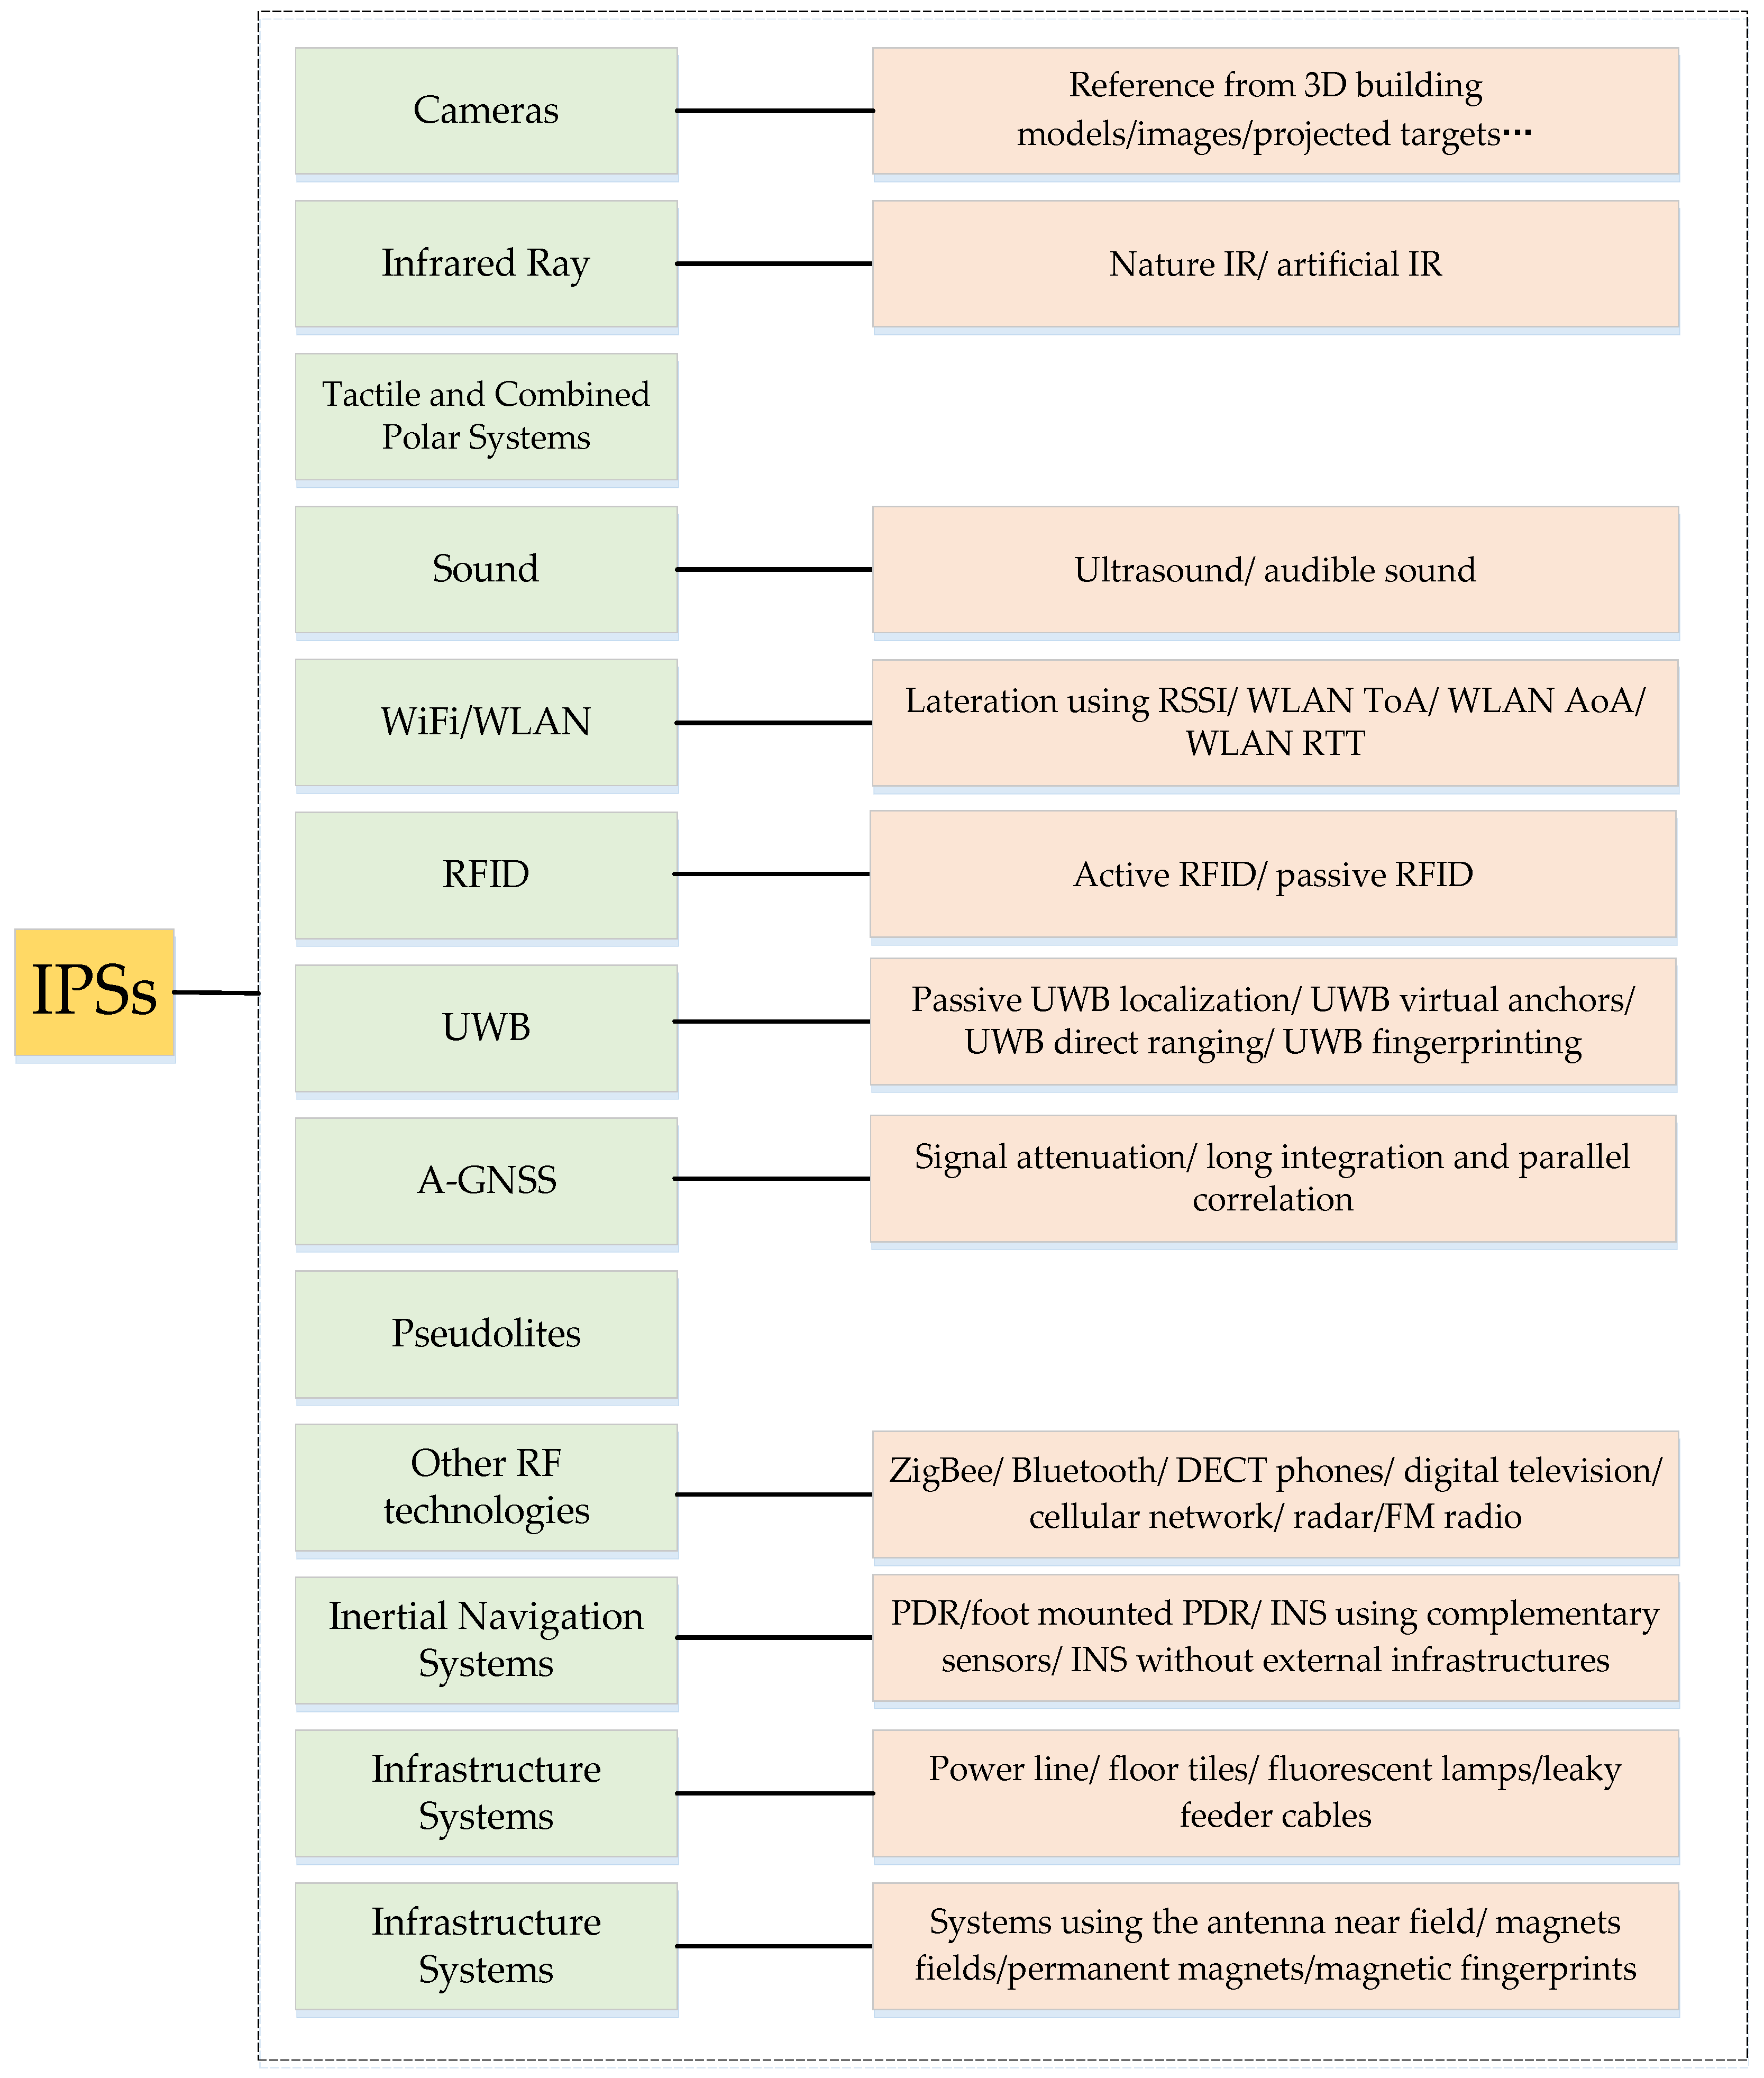
2. Indoor Positioning Systems
2.1. Categorization of IPSs
2.2. Selection of the Proposed IPSs
- Accuracy: the average Euclidean distance between an estimated position and the true position [27].
- Coverage Area: the area covered by the IPS; this generally includes three levels (i.e., local, scalable, and global [33]).
- Required User-Side Device: whether extra equipment must be carried to construct the IPS.
- Complexity: the complexity of designing, constructing, and maintaining an IPS.
- Continuity: the property of continuous operation of an IPS over a contiguous time period to perform its specific function, including acceptable outage frequencies.
- Update Rate: the frequency with which target item positions are calculated (either on devices or at external processing locations).
- Data Output: this metric involves output data types, data output speed, data capture capabilities, data storage, etc.
2.2.1. A-GPS
2.2.2. GSM
2.2.3. RFID
2.2.4. WiFi
2.2.5. UWB
2.2.6. DR
2.2.7. Infrared
2.2.8. BLE Beacon
2.2.9. Acoustic Signal
2.2.10. Visible Light
2.2.11. Image-Based IPS
2.2.12. Geomagnetism-Based IPS
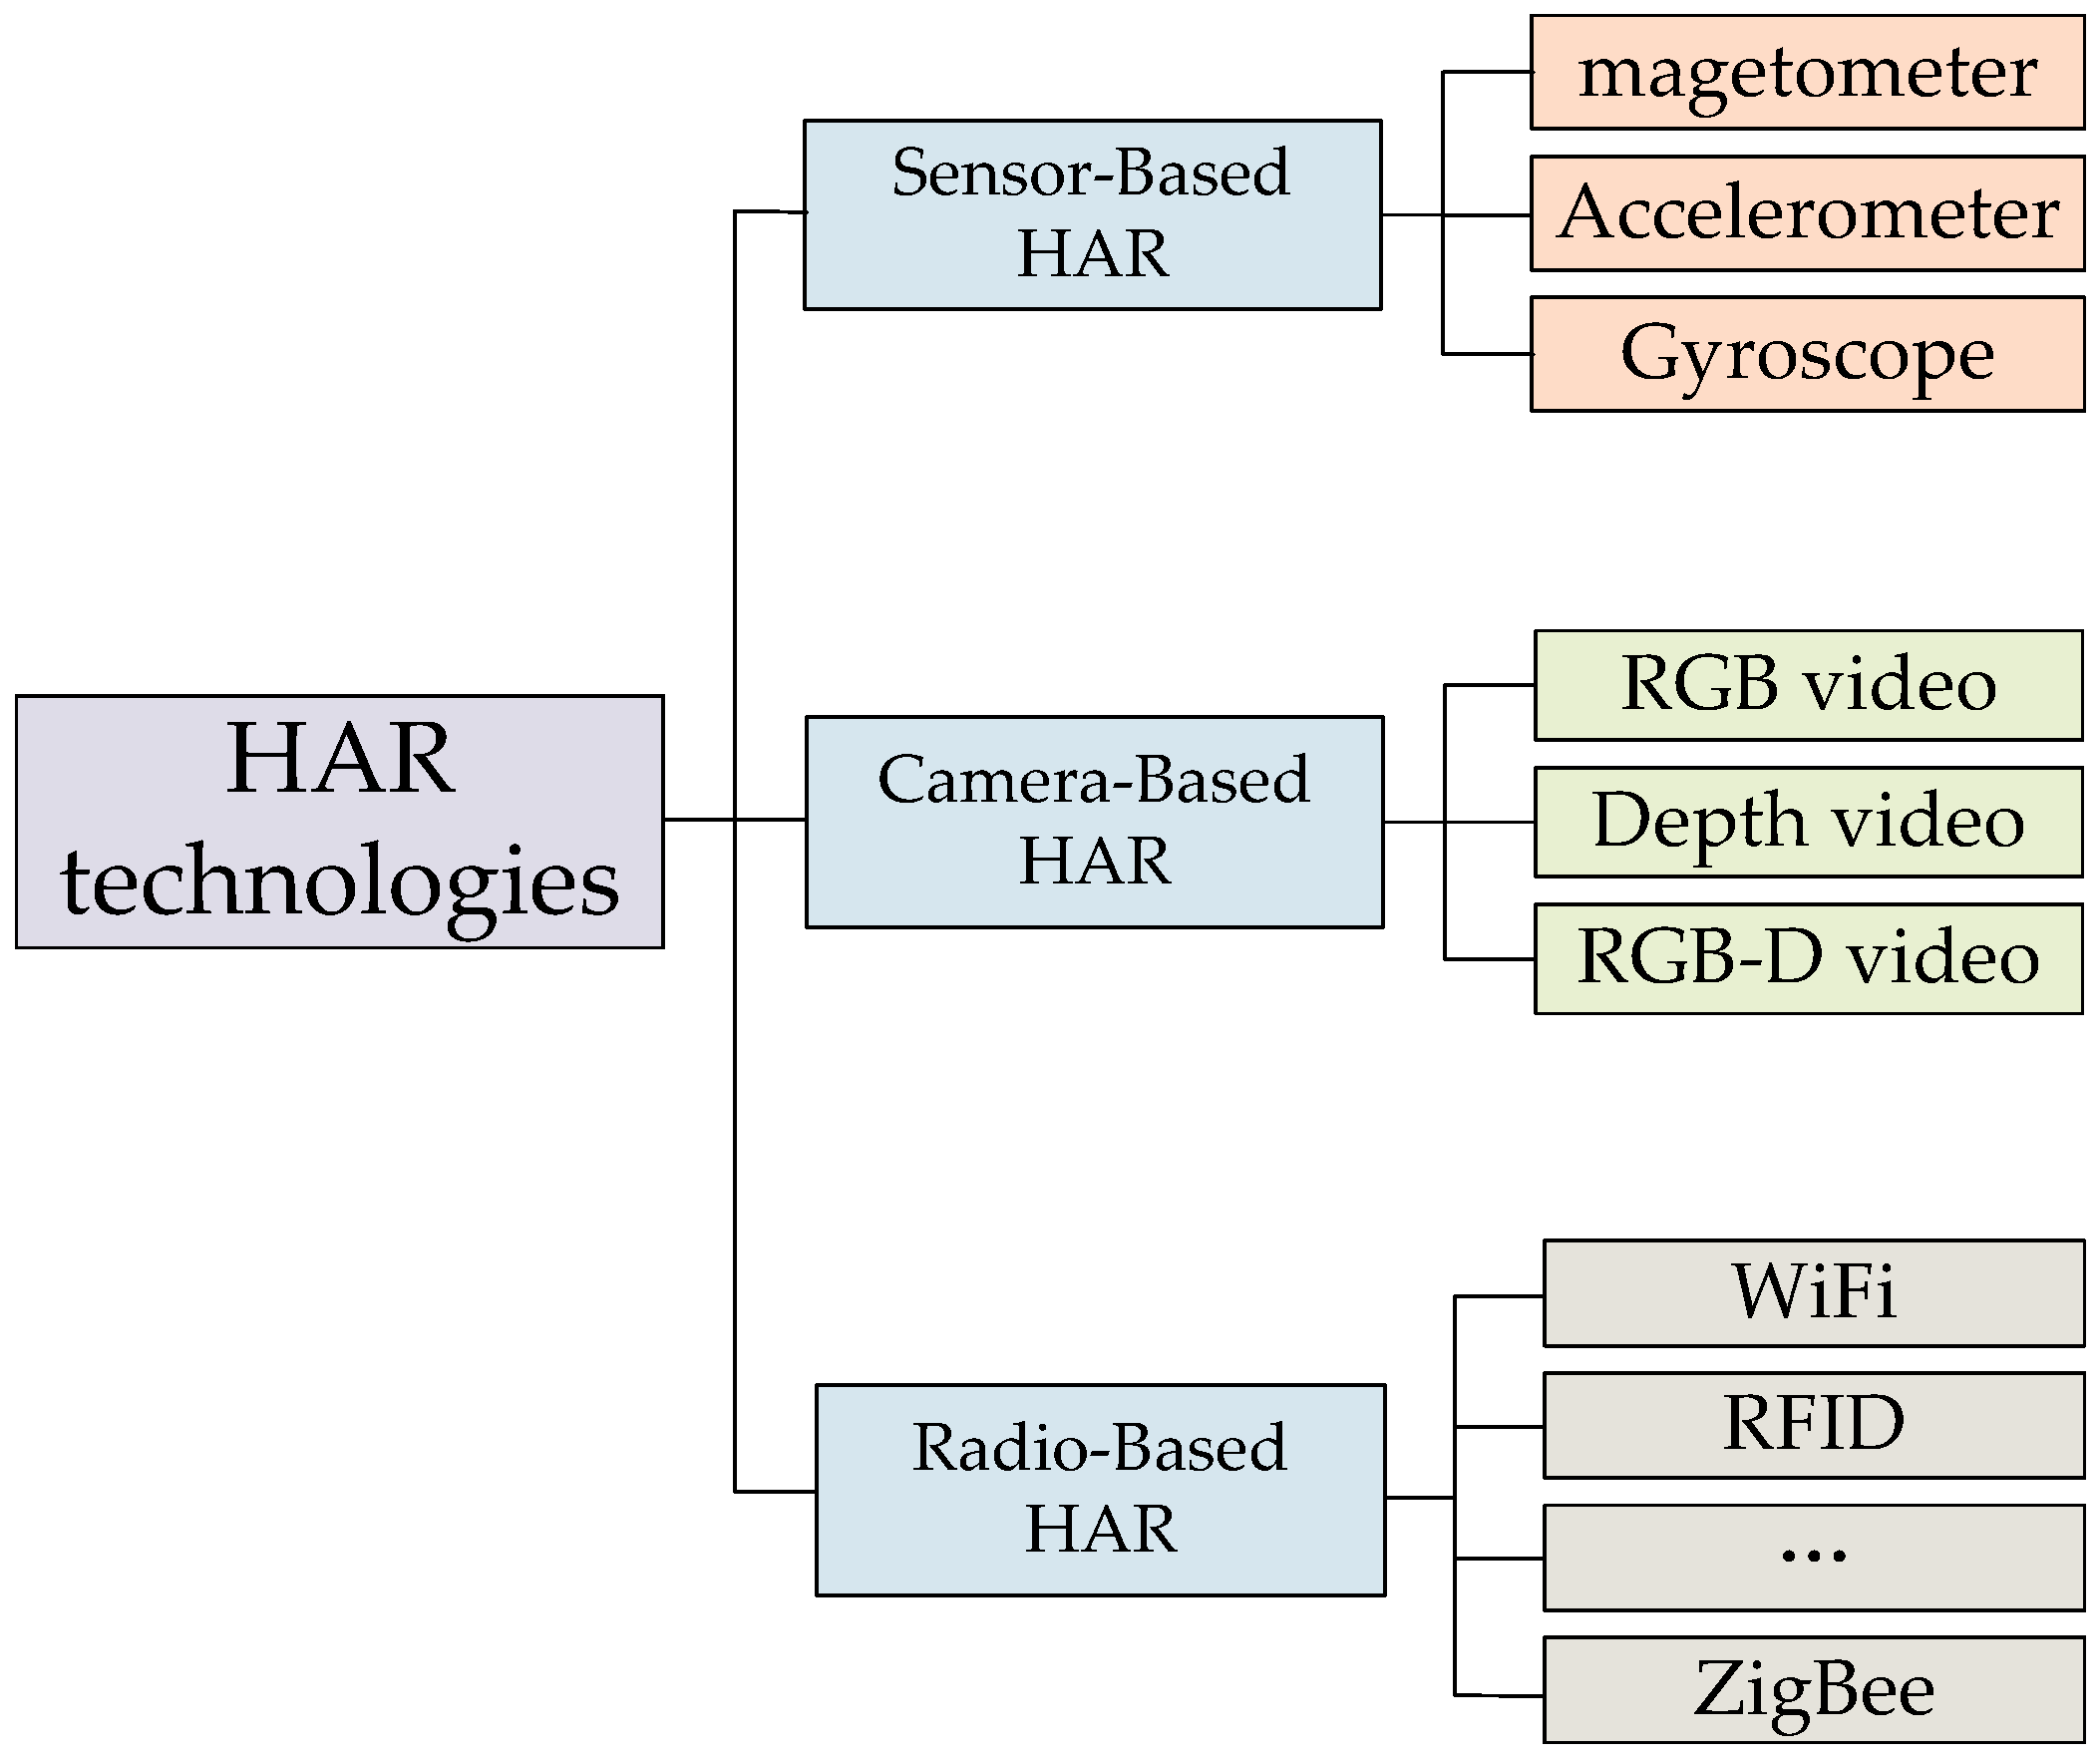
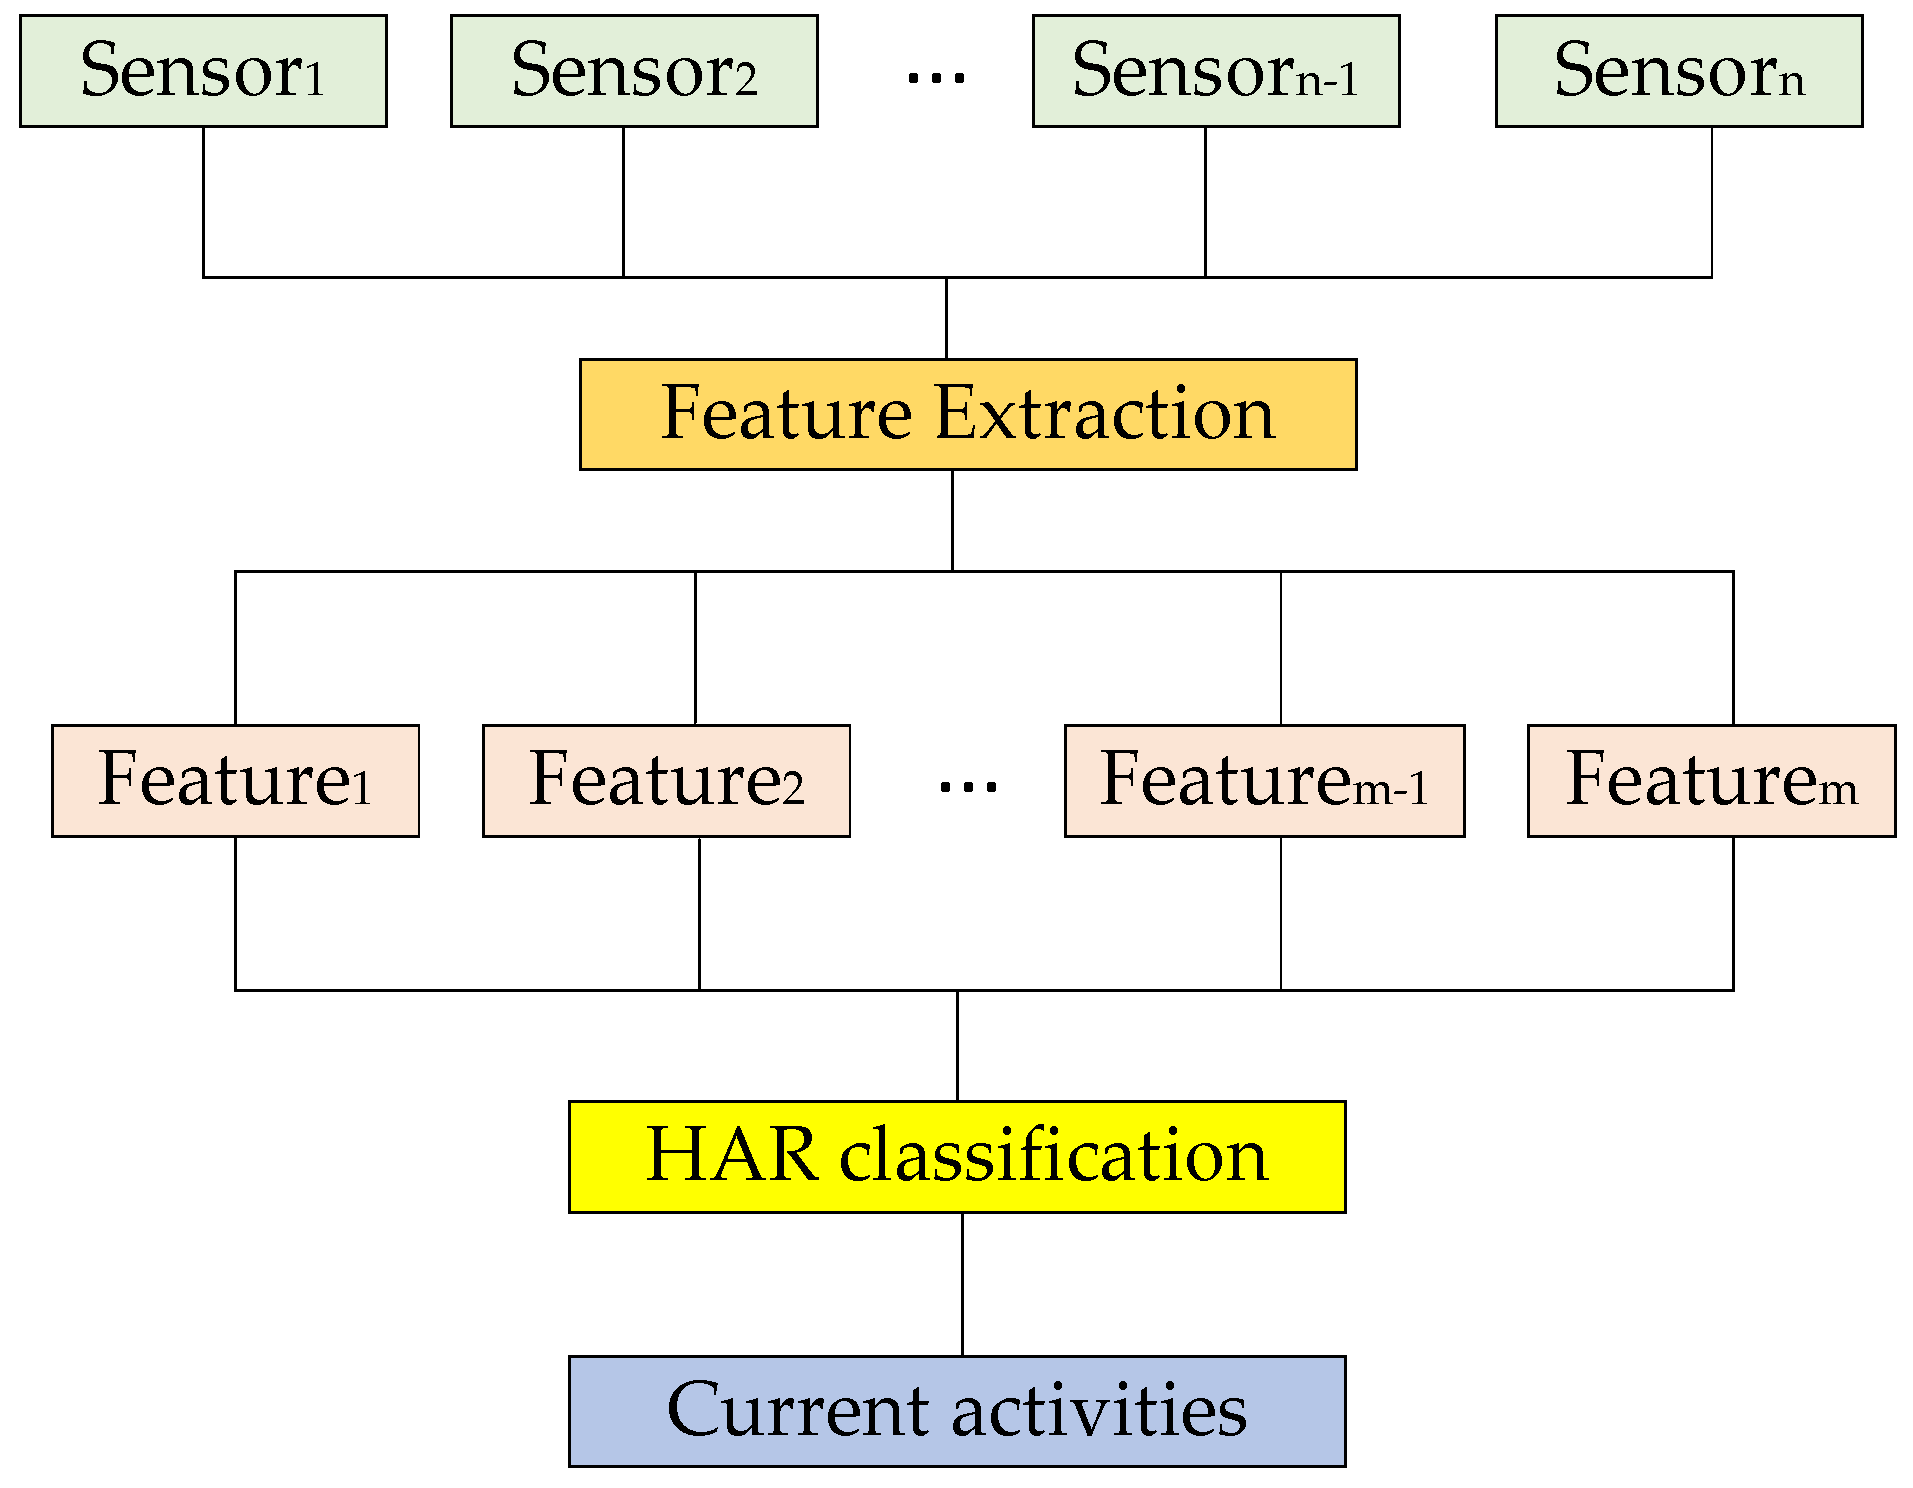
3. Human Activity Recognition
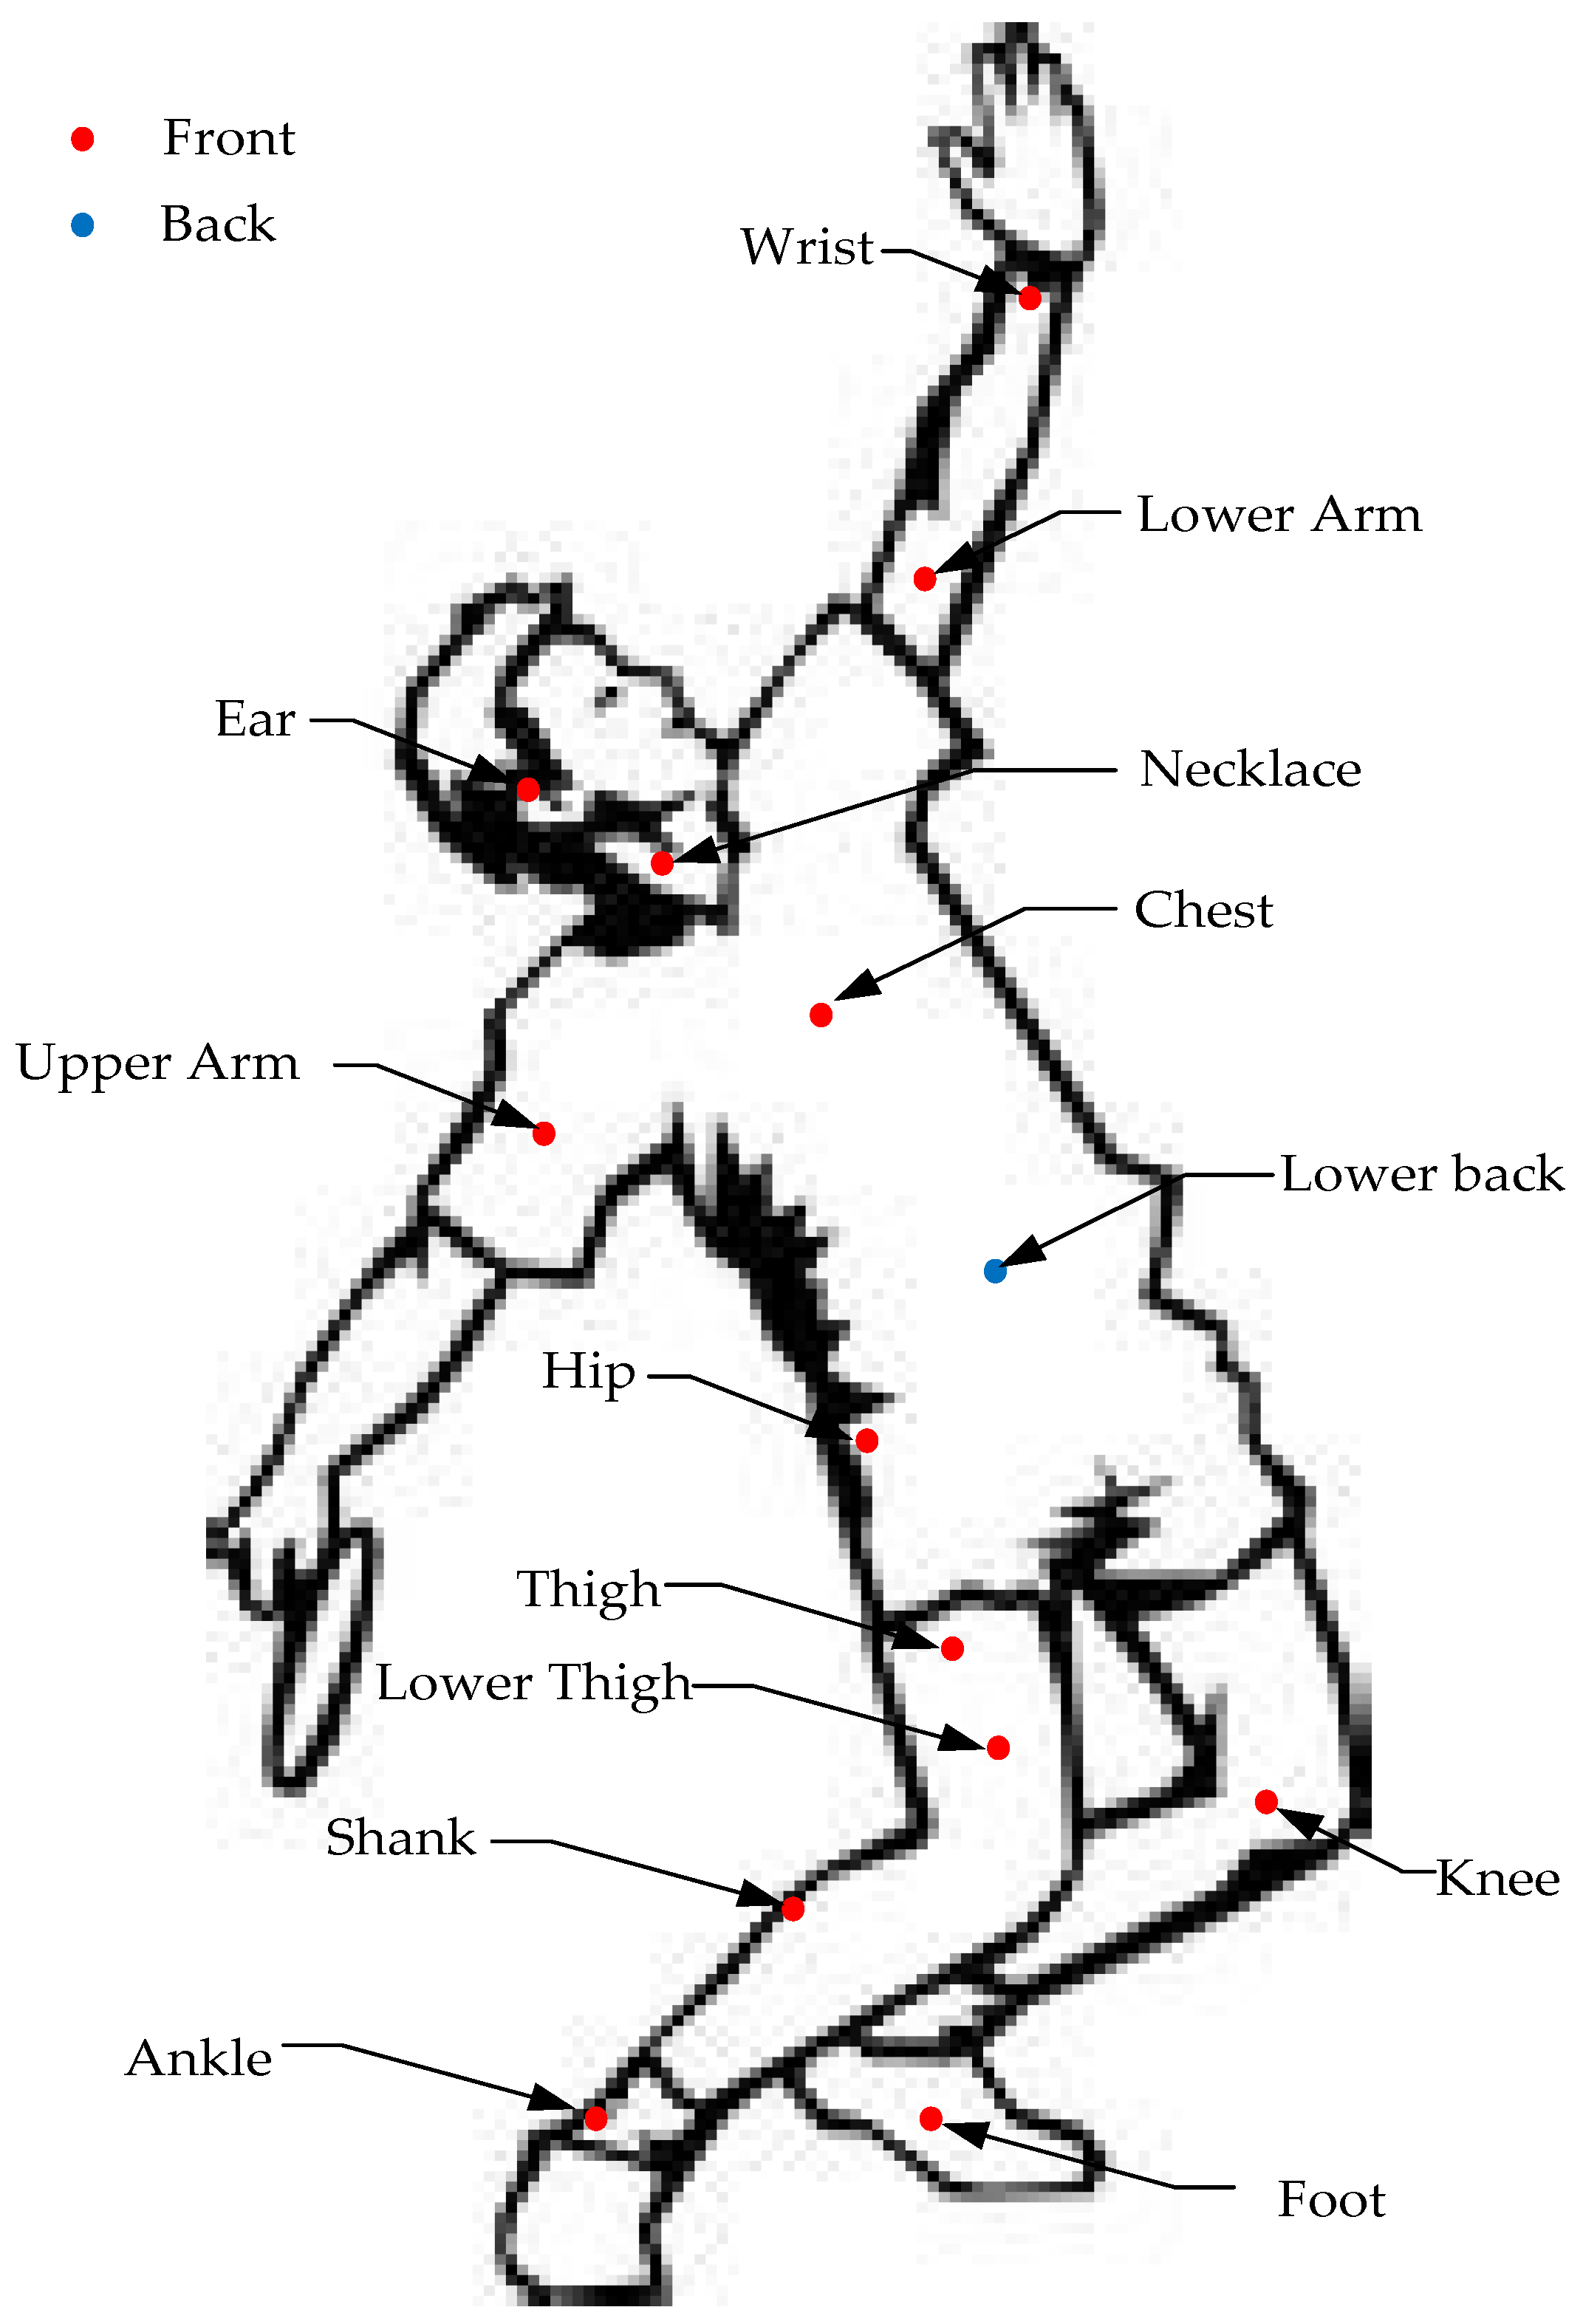
3.1. Sensor Placement
3.2. Features for Classification
3.3. Algorithms for Sensor-Based HAR
3.3.1. Hidden Markov Models
3.3.2. k-Nearest Neighbor
3.3.3. Support Vector Machines
3.3.4. Random Forests
3.3.5. Naive Bayes
3.3.6. Gaussian Mixture Models
3.3.7. Decision Tree
3.3.8. Artificial Neural Network
3.3.9. Deep Learning
3.3.10. Other Algorithms
4. Vital Sign Monitoring
4.1. Body Temperature
4.2. Heart Rate
4.3. Respiration Rate
4.4. Blood Pressure
4.5. Pulse Oxygenation
4.6. Blood Glucose
5. Discussion
5.1. Positioning Technologies
5.2. Physical Activity Detection
5.3. Vital Sign Monitoring
6. Conclusions
Acknowledgments
Conflicts of Interest
References
- Beard, J.; Biggs, S. Global Population Ageing: Peril or Promise; Bloom, D., Fried, L., Eds.; World Economic Forum: Geneva, Switzerland, 2011; pp. 6–15. [Google Scholar]
- Yazar, A.; Erden, F.; Cetin, A.E. Multi-Sensor Ambient Assisted Living System for Fall Detection. In Proceedings of the 2014 IEEE International Conference on Acoustics, Speech and Signal Processing, Florence, Italy, 4–9 May 2014; pp. 1–3.
- Priya, A.; Kumar, A.; Chauhan, B. A Review of Textile and Cloth Fabric Wearable Antennas. Int. J. Comput. Appl. 2015, 17. [Google Scholar] [CrossRef]
- Heddoko. Available online: http://www.heddoko.com/ (accessed on 18 July 2016).
- Hexoskin Wearable Body Metrics. Available online: http://www.hexoskin.com/ (accessed on 12 July 2016).
- Mimobaby TM. Available online: http://mimobaby.com/ (accessed on 16 July 2016).
- Owlet Rest Assured. Available online: https://www.owletcare.com/ (accessed on 14 May 2016).
- Abbate, S.; Avvenuti, M.; Bonatesta, F.; Cola, G.; Corsini, P. A smartphone-based fall detection system. Pervas. Mobile Comput. 2012, 8, 883–899. [Google Scholar] [CrossRef]
- Alarifi, A.; Al-Salman, A.; Alsaleh, M.; Alnafessah, A. Ultra-Wideband Indoor Positioning Technologies: Analysis and Recent Advances. Sensors 2016, 16, 707. [Google Scholar] [CrossRef] [PubMed]
- Dardari, D.; Closas, P.; Djuric, P.M. Indoor tracking: Theory, methods, and technologies. IEEE Trans. Veh. Technol. 2015, 64, 1263–1278. [Google Scholar] [CrossRef]
- Huang, H.; Gartner, G. A Survey of Mobile Indoor Navigation Systems. In Cartography in Central and Eastern Europe; Gartner, G., Ortag, F., Eds.; Springer: Heidelberg, Germany, 2010; Chapter 20; pp. 305–319. [Google Scholar]
- Gu, Y.; Lo, A.; Niemegeers, I. A survey of indoor positioning systems for wireless personal networks. IEEE Commun. Surv. Tuts. 2009, 11, 13–32. [Google Scholar] [CrossRef]
- Heinz, E.A.; Kunze, K.S.; Gruber, M.; Bannach, D. Using Wearable Sensors for Real Time Recognition Tasks in Games of Martial Arts—An Initial Experiment. In Proceedings of the IEEE Symposium on Computational Intelligence and Games, Reno, NV, USA, 22–24 May 2006; pp. 98–102.
- Wang, L.K. Recognition of Human Activities Using Continuous Autoencoders with Wearable Sensors. Sensors 2016, 16, 189. [Google Scholar] [CrossRef] [PubMed]
- Zhang, J.; Li, W.Q.; Ogunbona, P.O.; Wang, P.C. RGB-D-based Action Recognition Datasets: A Survey. Pattern Recogn. 2016, 60, 85–105. [Google Scholar] [CrossRef]
- Ikizler, N.; Duygulu, P. Histogram of Oriented Rectangles: A New Pose Descriptor for Human Action Recognition. Image Vis. Comput. 2009, 27, 1515–1526. [Google Scholar] [CrossRef]
- Tunçel, O.; Altun, K.; Barshan, B. Classifying Human Leg Motions with Uniaxial Piezoelectric Gyroscopes. Sensors 2009, 9, 8508–8546. [Google Scholar] [CrossRef] [PubMed]
- Wang, Z.L.; Zhao, C.; Qiu, S. A System of Human Vital Signs Monitoring and Activity Recognition Based on Body Sensor Network. Emerald Group Publ. Limit. 2014, 34. [Google Scholar] [CrossRef]
- Shi, J.D. The Challenges of Indoor Positioning; National University of Singapore: Singapore, 2013. [Google Scholar]
- Correa, A.; Llade, M.B.; Morell, A.; Vicario, J.L. Indoor Pedestrian Tracking by On-body Multiple Receivers. IEEE Sens. J. 2016, 16, 2545–2551. [Google Scholar] [CrossRef]
- Yang, Q.; Pan, J.; Zheng, W.C. Estimating Location Using WiFi. IEEE Intell. Syst. 2008, 1, 8–13. [Google Scholar] [CrossRef]
- Chai, J.H. Positioning System in Hospital Based on Zigbee. In Proceedings of the 2011 International Conference on Intelligent Computation and Bio-medical Instrumentation, Wuhan, China, 14–27 December 2011; pp. 159–162.
- Saad, M.M.; Bleakley, C.J.; Ballal, T.; Dobson, S. High-Accuracy Reference-Free Ultrasonic Location Estimation. IEEE Trans. Instrum. Meas. 2012, 6, 1561–1570. [Google Scholar] [CrossRef]
- Wang, X.G. Research on Pseudolite Positioning Technique; Shanghai Jiao Tong University: Shanghai, China, 2011. [Google Scholar]
- Lin, C.J.; Lee, T.L.; Syu, S.L.; Chen, B.W. Application of Intelligent Agent and RFID Technology for Indoor Position: Safety of Kindergarten as Example. In Proceedings of the 2010 International Conference on Machine Learning and Cybernetics, Qingdao, China, 11–14 July 2010; pp. 2571–2576.
- Mazuelas, S.; Lago, F.A.; Blas, J.; Bahillo, A. Prior NLOS Measurement Correction for Positioning in Cellular Wirelss Network. IEEE Trans. Veh. Technol. 2009, 5, 2585–2591. [Google Scholar] [CrossRef]
- Liu, H.; Darabi, H.; Banerjee, P.; Liu, J. Survey of wireless indoor positioning techniques and systems. IEEE Trans. Syst. Man Cybern. C Appl. Rev. 2007, 37, 1067–1080. [Google Scholar] [CrossRef]
- Yasir, M.; Ho, A.W.; Vellambi, B.N. Indoor Positioning System Using Visible Light and Accelerometer. J. Lightw. Technol. 2014, 32, 3306–3318. [Google Scholar] [CrossRef]
- Yazici, A.; Yayan, U.; Yucel, H. An ultrasonic based indoor positioning system. Proc. Int. Symp. Innov. Intell. Syst. Appl. 2011. [Google Scholar] [CrossRef]
- Al Nuaimi, K.; Kamel, H. A survey of indoor positioning systems and algorithms. In Proceedings of the 2011 International Conference on Innovations in Information Technology (IIT), IEEE Society, Abu Dhabi, United Arab Emirates, 25–27 April 2011; pp. 185–190.
- Chóliz, J.; Eguizabal, M.; Hernandez-Solana, A.; Valdovinos, A. Comparison of Algorithms for UWB Indoor Location and Tracking Systems. In Proceedings of the 2011 IEEE 73rd Conference on Vehicular Technology Conference (VTC Spring), Budapest, Hungary, 15–18 May 2011; pp. 1–5.
- Svalastog, M.S. Indoor Positioning-Technologies, Services and Architectures. Master’s Thesis, University of Oslo, Oslo, Norway, March 2007. [Google Scholar]
- Mautz, R. Indoor Positioning Technologies. Ph.D. Thesis, ETH Zürich, Zürich, Switzerland, February 2012. [Google Scholar]
- Lamance, J.; Desalas, J.; Jarvinen, J. Assisted GPS: A low-infrastructure approach. GPS World 2002, 13, 46–51. [Google Scholar]
- Karunanayake, M.D.; Cannon, M.E.; Lachapelle, G. Analysis of assistance data on AGPS performance. Meas. Sci. Technol. 2007, 18, 1908–1916. [Google Scholar] [CrossRef]
- Rawassizadeh, R.; Momeni, E.; Dobbins, C.; Gharibshah, J.; Pazzani, M. Scalable daily human behavioral pattern mining from multivariate temporal data. IEEE Trans. Knowl. Data Eng. 2015, 8. [Google Scholar] [CrossRef]
- Smith, A.; Balakrishnan, H.; Goraczko, M.; Priyantha, N. Tracking moving devices with the cricket location system. In Proceedings of the 2nd International Conference on Mobile systems (MobiSYS’04), Boston, MA, USA, 6–9 June 2004; pp. 190–202.
- Hightower, J.; Want, R.; Borriello, G. SpotON: An indoor 3D location sensing technology based on RF signal strength. In UW CSE Technical Report #2000-02-02; University of Washington, Department of Computer Science and Engineering: Seattle, WA, USA, 2000. [Google Scholar]
- Bahl, P.; Padmanabhan, V.N. RADAR: An in-building RF based user location and tracking system. In Proceedings of the Nineteenth Annual Joint Conference of the IEEE Computer and Communications Societies (IEEE INFOCOM 2000), Tel Aviv, Isreal, 28–30 March 2000; pp. 775–784.
- Castro, P.; Chiu, P.; Kremenek, T.; Muntz, R.R. A probabilistic room location service for wireless networked environments. In Proceedings of the Ubicomp 2001: Ubiquitous Computing, Third International Conference, Atlanta, GA, USA, 30 September–2 October 2001; pp. 18–34.
- Kaemarungsi, K.; Krishnamurthy, P. Modeling of indoor positioning systems based on location fingerprinting. In Proceedings of the Twenty-third Annual Joint Conference of the IEEE Computer and Communications Societies (IEEE INFOCOM 2004), Hongkong, China, 7–11 March 2004; pp. 1012–1022.
- Ambiplex. WOBISTDU[EB/OL]. Available online: http://www.ambiplex.com (accessed on 10 November 2015).
- Jin, M.H.; Yu, C.H.; Lai, H.R.; Feng, M.W. Zigbee Positioning System for Smart Home Application. In Proceedings of the ISPA International Workshops SSDSN, UPWN, WISH, SGC, ParDMCom, HiPCoMB, and IST-AWSN, Niagara Falls, ON, Canada, 28 August–1 September 2007; pp. 183–192.
- Gabriel, G.; Stéphane, C.; Sisi, Z.; Yannick, B.; Johanne, S.P.; Peter, V.O. Indoor pedestrian navigation using foot-mounted IMU and portable ultrasound range sensors. Sensors 2011, 11, 7606–7624. [Google Scholar]
- Ruiz, A.R.J.; Granja, F.S.; Prieto, J.C. Accurate pedestrian indoor navigation by tightly coupling foot-mounted IMU and RFID measurements. IEEE Trans. Instrum. Meas. 2012, 61, 178–189. [Google Scholar] [CrossRef] [Green Version]
- Chen, Z.H.; Zhu, Q.C.; Soh, Y.C. Smartphone Inertial Sensor Based Indoor Localization and Tracking with iBeacon Corrections. IEEE Trans. Ind. Inform. 2016, 4. [Google Scholar] [CrossRef]
- Hazas, M.; Hopper, A. Broadband ultrasonic location systems for improved indoor positioning. IEEE Trans. Mob. Comput. 2006, 5, 536–547. [Google Scholar] [CrossRef]
- IndoorAtlas. Available online: https://www.indooratlas.com/ (accessed on 22 July 2016).
- Ren, X.; Gu, C. Figure-ground segmentation improves handled object recognition in egocentric video. In Proceedings of the IEEE Conference on Computer Vision and Pattern Recognition (CVPR 2010), San Francisco, CA, USA, 13–18 June 2010; pp. 3137–3144.
- Messing, R.; Pal, C.; Kautz, H. Activity recognition using the velocity histories of tracked key points. In Proceedings of the 2009 IEEE 12th International Conference on Computer Vision, Kyoto, Japan, 27 September–4 October 2009; pp. 104–111.
- Oikonomidis, I.; Kyriazis, N.; Argyros, A.A. Efficient model-based 3D tracking of hand articulations using Kinect. In Proceedings of the 22nd British Machine Vision Conference (BMVC 2011), Dundee, UK, 29 August–2 September 2011.
- Lai, K.; Boa, L.; Ren, X.; Fox, D. A scalable tree-based approach for joint object and pose recognition. In Proceedings of the Twenty-fifth Conference on Artificial Intelligence (AAAI 2011), San Francisco, CA, USA, 7–11 August 2011.
- Lei, J.; Ren, X.; Fox, D. Fine-grained kitchen activity recognition using RGB-D. In Proceedings of the 2012 ACM Conference on Ubiquitous Computing (UbiComp 2012), Pittsburgh, PA, USA, 5–8 September 2012; pp. 208–211.
- Hevesi, P.; Willea, S.; Pirkl, G.; Wehn, N.; Lukowicz, P. Monitoring household activities and user location with a cheap, unobtrusive thermal sensor array. In Proceedings of the 2014 ACM International Joint Conference on Pervasive and Ubiquitous Computing (UbiComp 2014), Seattle, WA, USA, 13–17 September 2014; pp. 141–145.
- Wang, S.Q.; Zhou, G. A review on radio based activity recognition. Dig. Commun. Netw. 2015, 1, 20–29. [Google Scholar] [CrossRef]
- Attal, F.; Mohammed, S.; Dedabrishvili, M. Physical Human Activity Recognition Using Wearable Sensors. Sensors 2015, 15. [Google Scholar] [CrossRef] [PubMed]
- Liu, L.; Peng, Y.X.; Liu, M.; Lukowicz, P. Sensor-based human activity recognition system with a multilayered model using time series shapelets. Knowl. Based Syst. 2015, 90, 138–152. [Google Scholar] [CrossRef]
- Mannini, A.; Sabatini, A.M. Machine learning methods for classifying human physical activity from onbody accelerometers. Sensors 2010, 10, 1154–1175. [Google Scholar] [CrossRef] [PubMed]
- Pirttikangas, S.; Fujinami, K.; Nakajima, T. Feature Selection and Activity Recognition from Wearable Sensors. In Ubiquitous Computing Systems; Springer: Berlin, Germany, 2006; pp. 516–527. [Google Scholar]
- Wu, W.; Dasgupta, S.; Ramirez, E.E.; Peterson, C.; Norman, G.J. Classification Accuracies of Physical Activities Using Smartphone Motion Sensors. J. Med. Internet Res. 2012, 14. [Google Scholar] [CrossRef] [PubMed]
- Coley, B.; Najafi, B.; Paraschiv-Ionescu, A.; Aminian, K. Stair climbing detection during daily physical activity using a miniature gyroscope. Gait Posture 2005, 22, 287–294. [Google Scholar] [CrossRef] [PubMed]
- Lustrek, M.; Kaluza, B. Fall Detection and Activity Recognition with Machine Learning. Inform. Slov. 2009, 33, 197–204. [Google Scholar]
- Li, Q.; Stankovic, J.; Hanson, M.; Barth, A.; Lach, J.; Zhou, G. Accurate, Fast Fall Detection Using Gyroscopes and Accelerometer-Derived Posture Information. In Proceedings of the Sixth International Workshop on Wearable and Implantable Body Sensor Networks (BSN 2009), Berkeley, CA, USA, 3–5 June 2009; pp. 138–143.
- Lee, Y.; Iyengar, S.S.; Min, C.; Ju, Y.; Kang, S.; Park, T. MobiCon: A Mobile Context-monitoring Platform. Commun. ACM 2012, 55, 54–65. [Google Scholar] [CrossRef]
- Khan, Z.A.; Sohn, W. Abnormal Human Activity Recognition System Based on R-Transform and Kernel Discriminant Technique for Elderly Home Care. IEEE Trans. Consum. Electron. 2011, 57, 1843–1850. [Google Scholar] [CrossRef]
- Shoaib, M.; Bosch, S.; Incel, O.D.; Scholten, H.; Havinga, P.J. Fusion of Smartphone Motion Sensors for Physical Activity Recognition. Sensors 2014, 14. [Google Scholar] [CrossRef] [PubMed]
- McAdams, E.T.; Gehin, C.; Noury, N.; Ramon, C.; Nocua, R.; Massot, B. Biomedical Sensors for Ambient Assisted Living. In Advances in Biomedical Sensing, Measurements, Instrumentation and Systems; Springer: Berlin, Germany, 2010; pp. 240–262. [Google Scholar]
- Moncada-Torres, A.; Leuenberger, K.; Gonzenbach, R.; Luft, A.; Gassert, R. Activity classification based on inertial and barometric pressure sensors at different anatomical locations. Physiol. Meas. 2014, 35. [Google Scholar] [CrossRef] [PubMed]
- Chamroukhi, F.; Mohammed, S.; Trabelsi, D.; Oukhellou, L.; Amirat, Y. Joint segmentation of multivariate time series with hidden process regression for human activity recognition. Neurocomputing 2013, 120, 633–644. [Google Scholar] [CrossRef]
- Quinlan, J.R. C4.5: Programs for Machine Learning; Morgan Kaufmann Publishers Inc.: San Francisco, CA, USA, 2014; pp. 2–10. [Google Scholar]
- Yang, J.Y.; Wang, J.-S.; Chen, Y.-P. Using acceleration measurements for activity recognition: An effective learning algorithm for constructing neural classifiers. Pattern Recog. Lett. 2008, 29, 2213–2220. [Google Scholar] [CrossRef]
- Bonomi, A.G.; Goris, A.; Yin, B.; Westerterp, K.R. Detection of type, duration, and intensity of physical activity using an accelerometer. Med. Sci. Sports Exerc. 2009, 41, 1770–1777. [Google Scholar] [CrossRef] [PubMed]
- Yang, C.C.; Hsu, Y.-L. A review of accelerometry-based wearable motion detectors for physical activity monitoring. Sensors 2010, 10, 7772–7788. [Google Scholar] [CrossRef] [PubMed]
- Bao, L.; Intille, S. Activity Recognition from User-Annotated Acceleration Data. In Proceedings of the 2nd International Conference on Pervasive Computing (PERVASIVE 2004), Vienna, Austria, 21–23 April 2004; pp. 1–17.
- Kwapisz, J.R.; Weiss, G.M.; Moore, S.A. Activity Recognition using Cell Phone Accelerometers. In Proceedings of the ACM SIGKDD Intenational Conference on Knowledge Discovery and Data Mining (sensorKDD-2010), Washington, DC, USA, 25–28 July 2010.
- Ronao, C.A.; Cho, S.B. Deep Convolutional Neural Networks for Human Activity Recognition with Smartphone Sensors. In Proceedings of the 22nd International Conference on Neural Information Processing (ICONIP2015), Istanbul, Turkey, 9–12 November 2015.
- Figo, D.; Diniz, P.C.; Ferreira, D.R.; Cardoso, J.M.P. Pre-processing techniques for context recognition from accelerometer data. Pers. Ubiquitous Comput. 2010, 14, 645–662. [Google Scholar] [CrossRef]
- Lara, O.D.; Labrador, M.A. A Survey on Human Activity Recognition using Wearable Sensors. IEEE Commun. Surv. Tutor. 2013, 15, 1192–1209. [Google Scholar] [CrossRef]
- Chau, T. A review of analytical techniques for gait data. Part 1: Fuzzy, statistical and fractal methods. Gait Post. 2001, 13, 49–66. [Google Scholar] [CrossRef]
- Martínez, A.M.; Kak, A.C. Pca versus lda. Pattern Analysis and Machine Intelligence. IEEE Trans. 2001, 23, 228–233. [Google Scholar]
- Duda, R.O.; Hart, P.E.; Stork, D.G. Pattern Classification; John Wiley & Sons: New York, NY, USA, 1999. [Google Scholar]
- Parkka, J.; Ermes, M.; Korpipaa, P.; Mantyjarvi, J.; Peltola, J.; Korhonen, I. Activity classification using realistic data from wearable sensors. IEEE Trans. Inform. Technol. Biomed. 2006, 10, 119–128. [Google Scholar] [CrossRef]
- Maurer, U.; Smailagic, A.; Siewiorek, D.P.; Deisher, M. Activity recognition and monitoring using multiple sensors on different body positions. In Proceedings of the International Workshop on Wearable and Implantable Body Sensor Networks, Cambridge, MA, USA, 3–5 April 2006; pp. 113–116.
- WEKA-The University of Waikato. Available online: http://weka.wikispaces.com/ (accessed on 12 December 2016).
- Atallah, L.; Lo, B.; King, R.; Yang, G.Z. Sensor positioning for activity recognition using wearable accelerometers. IEEE Trans. Biomed. Circuits Syst. 2011, 5, 320–329. [Google Scholar] [CrossRef] [PubMed]
- Ravi, N.; Dandekar, N.; Mysore, P.; Littman, M.L. Activity Recognition from Accelerometer Data. In Proceedings of the National Conference on Artificial Intelligence, Pittsburgh, PA, USA, 9–13 July 2005.
- Wang, A.G.; Chen, G.L.; Yang, J. A Comparative Study on Human Activity Recognition Using Inertial Sensors in a Smartphone. IEEE Sens. J. 2016, 16. [Google Scholar] [CrossRef]
- Chen, L.; Nugent, C.D.; Wang, H. A knowledge-driven approach to activity recognition in smart homes. IEEE Trans. Knowl. Data Eng. 2012, 24, 961–974. [Google Scholar] [CrossRef]
- Riboni, D.; Bettini, C. COSAR: Hybrid reasoning for context-Aware activity recognition. Person. Ubiquitous Comput. 2011, 15, 271–289. [Google Scholar] [CrossRef]
- Riboni, D.; Bettini, C. OWL 2 modeling and reasoning with complex human activities. Pervas. Mobile Comput. 2011, 7, 379–395. [Google Scholar] [CrossRef]
- Lester, J.; Choudhury, T.; Kern, N. A Hybrid Discriminative/Generative Approach for Modeling Human Activities. In Proceedings of the Nineteenth International Joint Conference on Artificial Intelligence (IJCAI 2005), Edinburgh, UK, 30 July–5 August 2015.
- Bhattacharya, S.; Lane, N.D. From Smart to Deep: Robust Activity Recognition on Smartwatches Using Deep Learning. In Proceedings of the 2016 IEEE International Conference on Pervasive Computing and Communication Workshops (PerCom Workshops 2016), Sydney, Australia, 14–18 March 2016.
- Anguita, D.; Ghio, A.; Oneto, L. Human activities Recognition on Smartphones Using a Multiclass Hardware-Friendly Support Vector Machine. In Proceedings of the 6th International Conference on Ubiquitous Computing and Ambient Intelligence & 4th International Workshop on Ambient Assisted Living (UCAmI & IWAAL2012), Vitoria-Gasteiz, Spain, 3–5 December 2012.
- Khan, A.M. Recognizing Physical Activities Using Wii Remote. Int. J. Inform. Educ. Technol. 2013, 3. [Google Scholar] [CrossRef]
- Bedogni, L.; Di-Felice, M.; Bononi, L. By train or by car? Detecting the user’s motion type through smartphone sensors data. In Proceedings of the 24th IFIP International Conference on Testing Software and Systems (ICTSS'12), Aalborg, Denmark, 19–21 November 2012; pp. 1–6.
- Morillo, L.M.S.; Gonzalez-Abril, L.; Ramirez, J.A.O. Low Energy Physical Activity Recognition System on Smartphones. Sensors 2015, 15. [Google Scholar] [CrossRef] [PubMed]
- Wang, Z.; Wu, D.; Chen, J. A Triaxial Accelerometer-Based Human Activity Recognition via EEMD-Based Features and Game-Theory-Based Feature Selection. IEEE Sens. J. 2016, 16, 3198–3208. [Google Scholar] [CrossRef]
- Breiman, L. Random Forests. Mach. Learn. 2001, 45. [Google Scholar]
- Gaussian Mixture Models. Available online: http://www.ll.mit.edu/mission/cybersec/publications /publication-files/full_papers/0802_Reynolds_Biometrics-GMM.pdf. (accessed on 2 December 2016).
- Srivastava, P.; Wong, W.C. Hierarchical Human Activity Recognition Using GMM. In Proceedings of the Second International Conference on Ambient Computing, Applications, Services and Technologies (AMBIENT 2012), Barcelona, Spain, 23–28 September 2012; pp. 32–37.
- Louradour, J.; Larochelle, H. Classification of Sets using Restricted Boltzmann Machines. Comput. Sci. 2011. [Google Scholar]
- Alsheikh, M.A.; Selim, A.; Niyato, D.; Doyle, L.; Lin, S.; Tan, H.P. Deep activity recognition models with triaxial accelerometers. arXiv, 2015; arXiv:1511.04664. [Google Scholar]
- Khan, Y.; Ostfeld, A.E.; Lochner, C.M. Monitoring of Vital Signs with Flexible and Wearable Medical Devices. Adv. Mater. 2016, 28. [Google Scholar] [CrossRef] [PubMed]
- Husain, M.D.; Kennon, R. Preliminary Investigations into the Development of Textile Based Temperature Sensor for Healthcare Applications. Fibers 2013, 1. [Google Scholar] [CrossRef]
- Chen, W.; Dols, S.; Oetomo, S.B.; Feijs, L. Monitoring Body Temperature of Newborn Infants at Neonatal Intensive Care Units Using Wearable Sensors. In Proceedings of the 5th International Conference on Body Area Networks (BodyNets 2010), Corfu Island, Greece, 10–12 September 2010.
- Richmond, V.L. Prediction of Core Body Temperature from Multiple Variables. Ann. Occup. Hyg. 2015, 59, 1168–1178. [Google Scholar] [CrossRef] [PubMed]
- Anliker, U.; Ward, J.A.; Lukowicz, P.; Troster, G.; Dolveck, F.; Baer, M.; Keita, F.; Schenker, E.; Catarsi, F.; Coluccini, L.; et al. AMON: A Wearable Multiparameter Medical Monitoring and Alert System. IEEE Trans. Inform. Technol. Biomed. 2005, 8, 415–427. [Google Scholar] [CrossRef]
- Rienzo, M.D.; Rizzo, F.; Parati, G.; Brambilla, G.; Ferratini, M.; Castiglioni, P. MagIC System: A New Textile-Based Wearable Device for Biological Signal Monitoring. Applicability in Daily Life and Clinical Setting. In Proceedings of the 2005 IEEE Engineering in Medicine and Biology 27th Annual Conference, Shanghai, China, 1–4 September 2005.
- Xu, S.; Zhang, Y.; Jia, L.; Mathewson, K.E.; Jang, K.Y.; Kim, J.; Fu, H.; Huang, X.; Chava, P.; Wang, R.; et al. Soft Microfluidic Assemblies of Sensors, Circuits, and Radios for the Skin. Rogers Sci. 2014, 344. [Google Scholar] [CrossRef] [PubMed]
- Folke, M.; Cernerud, L.; Ekstrom, M.; Hök, B. Critical review of non-invasive respiratory monitoring in medical care. Med. Biol. Eng. Comput. 2003, 41, 377–383. [Google Scholar] [CrossRef] [PubMed]
- Guo, L.; Berglin, L.; Wiklund, U. Design of a garment-based sensing system for breathing monitoring. Text. Res. J. 2013, 83, 499–509. [Google Scholar] [CrossRef]
- Schwartz, G.; Benjamin, C.K.; Mei, J.G. Flexible polymer transistors with high pressure sensitivity for application in electronic skin and health monitoring. Nat. Commun. 2013, 4, 1859–1868. [Google Scholar] [CrossRef] [PubMed]
- Dagdeviren, C.; Su, Y.W.; Joe, P. Conformable amplified lead zirconate titanate sensors with enhanced piezoelectric response for cutaneous pressure monitoring. Nat. Commun. 2014, 5, 4496–4506. [Google Scholar] [CrossRef] [PubMed]
- Lochner, C.M.; Khan, Y.; Pierre, A. All-organic optoelectronic sensor for pulse oximetry. Nat. Commun. 2014, 5, 5745–5757. [Google Scholar] [CrossRef] [PubMed]
- Bansal, A.K.; Hou, S.B.; Kulyk, O.; Bowman, E.M.; Samuel, I.D. Wearable Organic Optoelectronic Sensors for Medicine. Adv. Mater. 2014, 27, 7638–7644. [Google Scholar] [CrossRef] [PubMed] [Green Version]
- Liao, Y.T.; Yao, H.F.; Lingley, A.; Parviz, B. A 3-μW CMOS Glucose Sensor for Wireless Contact-Lens Tear Glucose Monitoring. IEEE J. Solid State Circuits 2012, 47, 335–344. [Google Scholar] [CrossRef]
- Vashist, S.K. Non-invasive glucose monitoring technology in diabetes management: A review. Anal. Chim. Acta 2012, 750, 6–27. [Google Scholar] [CrossRef] [PubMed]
- Temperature of a Healthy Human. Available online: http://hypertextbook.com/facts/LenaWong.shtml (accessed on 4 Feburary 2017).
- Evans, D.; Hodgkinson, B.; Berry, J. Vital signs in hospital patients: A systematic review. Int. J. Nurs. Stud. 2001, 38, 643–650. [Google Scholar] [CrossRef]
- Nie, B.Q.; Xing, S.Y.; Brandt, J. Droplet-based interfacial capacitive sensing. Lab. Chip 2012, 12, 1110–1118. [Google Scholar] [CrossRef] [PubMed]
- Uchiyama, T.; Nakayama, S. Magnetic sensors using amorphous metal materials: Detection of premature ventricular magnetic waves. Physiol. Rep. 2013, 1. [Google Scholar] [CrossRef] [PubMed]
- Wang, Z.H.; Xu, M.; Xu, X.H.; Zhou, Z.T. Bio-Magnetic Sensor Circuit Design Based on Giant Magneto-Impedance Effect. In Proceedings of the 2016 IEEE International Conference on Mechatronics and Automation (ICMA 2016), Harbin, China, 7–10 August 2016.
- Jagadhish, V.S.; Subramanian, M. Using labview to monitor respiration rate for sleep study. Int. J. Biomed. Eng. Technol. 2013, 12, 360–370. [Google Scholar] [CrossRef]
- Lokavee, S.; Puntheeranurak, T.; Kerdcharoen, T.; Watthanwisuth, N. Sensor pillow and bed sheet system: Unconstrained monitoring of respiration rate and posture movements during sleep. In Proceedings of the 2012 IEEE International Conference on Systems, Man, and Cybernetics (SMC 2012), Seoul, Korea, 14–17 October 2012; pp. 1564–1568.
- Atalay, O.; Kennon, W.R.; Demirok, E. Weft-Knitted Strain Sensor for Monitoring Respiratory Rate and Its Electro-Mechanical Modeling. IEEE Sens. J. 2015, 15, 110–121. [Google Scholar] [CrossRef]
- Shin, K.H.; Moon, C.R.; Lee, T.H.; Lim, C.H.; Kim, Y.J. Flexible wireless pressure sensor module. Sens. Actuators A Phys. 2005, 123, 30–35. [Google Scholar] [CrossRef]
- Oximetry.org. Available online: http://www.oximetry.org/pulseox/principles.htm (accessed on 2 December 2016).
- Tierney, M.J.; Kim, H.L.; Burns, M.D.; Tamada, J.A.; Potts, R.O. Electroanalysis of Glucose in Transcutaneously Extracted Samples. Electroanalysis 2000, 12, 666–671. [Google Scholar] [CrossRef]
- Cui, Y.; An, R.X.; Ariyur, K.B. Cellphone geolocation via magnetic mapping. Automatica 2015, 51, 70–79. [Google Scholar] [CrossRef]
- Li, H.Y.; Chen, X.W.; Jing, G.F.; Wang, Y.; Cao, Y.F.; Li, F.; Zhang, X.L.; Xiao, H. An Indoor Continuous Positioning Algorithm on the Move by Fusing Sensors and WiFi on Smartphones. Sensors 2015, 15. [Google Scholar] [CrossRef]
- Zou, H.; Xie, L.; Jia, Q.S.; Wang, H. Platform and algorithm development for a RFID-based indoor positioning system. Unmanned Syst. 2014, 2, 279–291. [Google Scholar] [CrossRef]
- Wang, H.; Sen, S.; Elgohary, A. No need to war-drive: Unsupervised indoor localization. In Proceedings of the 10th International Conference on Mobile Systems, Applications, and Services (MobiSys ’12), New York, NY, USA, 25–29 June 2012; pp. 197–210.
- Chen, G.; Meng, X.; Wang, Y.; Zhang, Y.; Tian, P.; Yang, H. Integrated WiFi/PDR/Smartphone Using an Unscented Kalman Filter Algorithm for 3D Indoor Localization. Sensors 2015, 15. [Google Scholar] [CrossRef] [PubMed]
- Beaurgard, S.; Haas, H. Pedestrian Dead Reckoning: A Basis for Personal Positioning. In Proceedings of the 3rd Workshop on Positioning, Navigation and Communication (WPNC’06), Hannover, Germany, 16–17 March 2006; pp. 27–36.
- Lee, S.; Kim, B.; Kim, H.; Ha, R. Inertial sensor-based indoor pedestrian localization with minimum 802.15.4a configuration. IEEE Trans. Ind. Inform. 2011, 7, 455–466. [Google Scholar] [CrossRef]
- Atakan, B.; Akan, O.B.; Balasubramaniam, S. Body Area NanoNetworks with Molecular Communications in Nanomedicine. IEEE Commun. Mag. 2012, 50, 28–34. [Google Scholar] [CrossRef]


| Technology | Measurement Methods | Suitable Environment | Accuracy | Extra Device on User-side | Power Consumption | Cost | Advantages | Disadvantages | Examples |
|---|---|---|---|---|---|---|---|---|---|
| A-GPS 1 | TTFF 2 | Outdoor and Indoor | 5–10 m | No | High | Low | Reuse sensors embedded in smartphone or smartwatch; cover entire earth. | Low security; occupy channel resource. | Google Earth; Baidu Maps |
| GSM (cellular) | RSS 3 | Outdoor and indoor | 10–50 m | No | Low | Low | Free of same-frequency interference; reuse sensors embedded in smartphone or smartwatch [33]. | Low reliability [33]; privacy issues. | Google Maps |
| RFID | Proximity; RSS | Indoor | 1–3 m | Yes | Low | Moderate | Moderate cost; high accuracy. | Tags lack communications capabilities; positioning coverage is limitted; extral devices. | Cricket (MIT) [37] SpotON (UW) [38] RADAR(Microsoft) [39] |
| WiFi | RSS | Indoor | 1–5 m | No | High | Low | Reuse existing infrastructure; low infrastructure cost. | Fingerprinting systems recalculation [33]. | Nibble [40] Wayes [41] |
| UWB | ToA; TDOA | Indoor | 6–10 cm | Yes | Low | High | Excellent accuracy; effectively passing through obstacles. | High cost; short range; problem in non-Line of Sight. | Ubisense; Dart UWB(Zebra). |
| Dead Reckoning | Tracking | Indoor or Outdoor | 1–5 m | No | High | Low | No additional hardware such as beacons. | Low accuracy. | / |
| Infrared | Proximity; Differential Phase-shift; AoA 4. | Indoor | 1–2 m | Yes | Low | Moderate | Low power consumption. | Short rang; cost for extra hardware. | IR.Loc (Ambiplex) [42] |
| BLE Beacon | Proximity; RSS | Indoor and Semi-outdoor | 1–5 m | No | Low | Low | Low infrustructure cost; low power consumption. | Limitation in user mobility; low accuracy. | Shopstic (App). |
| Acoustic Signal | ToA; TDOA | Indoor | 0.03–0.8 m | No | Low | Moderate | No requirement for line of sight (LOS); does not interfere with electromagnetic waves [32]. | Cannot penetrate solid walls; loss of signal due to obstruction; false signals because of reflections [32]. | Active Bat; Sonitor IPS. |
| ZigBee | RSS | Indoor | 1–10 m | No | Low | Low | Low infrastructure cost; low power consumption; short time delay; high security. | Short range | Best Beacon Match [43] |
| Visible Light | ToA; TdoA 5. | Indoor | 0.01–0.1 m | Yes | Low | High | Dual use of lighting infrastructure; compatible with RF sensitive areas. | Needs to replace existing lights to LEDs 6 (dual use); High cost | Bytelight; Ubeacon. |
| Image-Based IPS | Pattern recognition | Indoor | 0.01–1 m | No | High | Moderate | Relatively cheap compared with technologies such as UWB. | Requires LOS, coverage is limited | Sky-Trax; StarGazer. |
| Geomagnetism-based IPS | Maps matching | Indoor and Outdoor | 0.1–2 m | No | Low | Low | No requirement of the maintenance (reusing existing device); between sensor and source; the ability to penetrate walls. | Interference by environment magnetic fields. | IndoorAtlas (University of Oulu) |
| Criterion | Description | Value |
|---|---|---|
| Accuracy | 2D position compared to reference | 0.5–1 m |
| Installation complexity | The time to install an IPS in a flat | <1 h |
| User acceptance | A qualitative measure of invasiveness | Non-invasive |
| Coverage | Area of a typical living flat | 90 m2 |
| Update rate | The sampling interval of an IPS | 0.5 s |
| Operating time | The battery life | Not assessed |
| Availability | The time that a system is active and responsive | >90% |
| Sensor | Location | Activities | Reference |
|---|---|---|---|
| Gyroscope Accelerometer | Wrist, hip, neck, knee cap | Wing Tsun movements | Heinz et al. [13] |
| Accelerometer | Ankle, thigh, hip, wrist, chest | Typing, talking, riding, walking, arm movement, etc. (20 activities) | Bao et al. [74] |
| Accelerometer | Thigh, Necklace, Wrists. | Falling backward, falling forward, chest pain, headache, vomiting, and fainting and a normal activity walking | Pirttikangas et al. [59] |
| Accelerometer | Waist. | Walking, running, scrubbing, standing, working at a PC, vacuuming, brushing teeth, sitting. | Yang et al. [71] |
| Accelerometer, Gyroscope | Lower arm, Hip, Thigh, Wrist | Walking downstairs, walking upstairs, walking, jogging, biking, sitting and standing. | Shoaib et al. [66] |
| Accelerometer | Thigh | Walking, jogging, ascending stairs, descending stairs, sitting, standing. | Kwapisz et al. [75] |
| Accelerometer | Lower Back. | Lying, sitting, standing, working. on a computer, walking, running, cycling. | Bonomi et al. [72] |
| Accelerometer | Hip, wrist, arm, ankle, thigh | Lying, sitting, standing, walking, stair climbing, running, cycling. | Mannini et al. [58] |
| Accelerometer; gyroscope | Upper arm, thigh | Slow walking, normal walking, brisk walking, jogging, sitting, ascending and descending stairs normally or briskly | Wu et al. [60] |
| Accelerometer | Chest, thigh, ankle. | Stairs ascent and descent, walking, sitting, standing up, sitting on the ground | Chamroukhi et al. [69] |
| Accelerometer | Chest, thigh, ankle. | 16 daily living activities. | Moncada-Torres, et al. [68] |
| Accelerometer gyroscope | Thigh | Walking, walking upstairs, walking downstairs, sitting, standing, and lying down | Ronao et al. [76] |
| Accelerometer; Gyroscope; Barometric pressure sensors. | Wrist; ankle; chest | Walking, running, stair descending and ascending, standing, sitting, lying down, brushing teeth, drinking, cutting food, writing, peeling carrot, eating butter bread, etc. | Moncada-Torres, et al. [68] |
| Group | Method |
|---|---|
| Time domain | Mean, median, standard deviation, variance, minimum, maximum, range, root mean square (RMS), correction, cross-correlation, entropy, and kurtosis, skewness, peak to peak, crest factor [56], difference, zero crossing, integration, mean absolute deviation (MAD) etc. |
| Frequency domain | Fourier transform (FT), coefficients sum, dominant frequency, spectral energy, peak frequency, information entropy, entropy spectrum, spectral analysis of key coefficients, frequency range power (FRP) [13], etc. |
| Sensors | Placement | Features | Classifiers | Participants | Activities | Accuracy (%) | Reference |
|---|---|---|---|---|---|---|---|
| Accelerometer | Upper arm, lower arm, hip, thigh, foot | Time-domain; frequency-domain. | KNN; Decision tree; NB. | 20 | 6 | 52–84 | Bao. et al. [74] |
| Gyroscope | Shank | Frequency-domain | Other | 20 | 1 | 97 | Coley et al. [61] |
| Accelerometer; gyroscope. | Wrist; lower leg; foot; neck; hip. | Time-domain; frequency-domain. | Decision tree; KNN; NB. | 2 | 20 | NA 1 | Heinz et al. [13] |
| Accelerometer | Wrist; hip; necklace | Time-domain | C4.5 2 | 6 | 6 | About 75 | Muurer et al. [83] |
| Accelerometer | Lower back | Time-domain; frequency-domain. | Decision tree | 20 | 20 | 93 | Bonomi et al. [72] |
| Accelerometer; gyroscope. | Chest, thigh | Time-domain | User-defined | 1 | 4 | 91 | Li et al. [63] |
| Accelerometer | Wrist; lower arm; knee; ankle. | Time-domain; frequency-domain. | NB, GMM, SVM, NV, C4.5 | 20 | 20 | 92.2–98.5 | Mannini et al. [58] |
| Accelerometer | Thigh | Time-domain; frequency-domain. | C4.5, MLP 3, LR 4 | 29 | 6 | 78.1–95.7 | Kwapisz et al. [75] |
| Accelerometer; gyroscope | Arm, thigh. | Time-domain; frequency-domain. | KNN; C4.5; NB, etc. | 16 | 13 | 63.2–90.2 | Wu et al. [60] |
| Accelerometer; gyroscope | Lower arm | Time-domain | RBM 5 | 12 | NA | 72.1 | Bhattacharya et al. [92] |
| Accelerometer; gyroscope | Wrist | Time-domain; frequency-domain. | HF-SVM 6 | 30 | 6 | 89 | Anguita et al. [93] |
| Accelerometer | Lower back | Time-domain | Decision tree | 24 | 4 | 96.61 | Khan et al. [94] |
| Accelerometer; gyroscope; barometric pressure sensors | Ankle; wrist; chest | Time-domain; frequency-domain | KNN | 6 | 16 | 93–95 | Moncada-Torres et al. [68] |
| Accelerometer | Wrist | Time-domain; frequency-domain | NB; SVM; Decision tree; KNN | 2 | 8 | 57–64 | Ravi et al. [86] |
| Accelerometer | Chest; upper arm; wrist; hip; thigh; ankle; ear. | Time-domain; frequency-domain | KNN; Bayesian | 11 | 15 | NA | Atallah et al. [85] |
| Accelerometer. | Thigh | Time-domain | Shapelet approach; SVM; NB; KNN; etc. | 4 | 8 | 72–77 | Liu et al. [57] |
| Accelerometer; gyroscope | Wrist | Time-domain | ANN; SVM; NB; C4.5 | 30 | 6 | 76.63–95.75 | Ronao et al. [76] |
| Accelerometer; gyroscope. | Thigh | Time-domain | RF; SVM; NB. | NA | 4 | 77–99 | Bedogni et al. [95] |
| Accelerometer; Gyroscope. | Chest, thigh, ankle | Time-domain; frequency-domain. | Decision tree; KNN; SVM; HMM, etc. | 6 | 12 | 73–98 | Attal et al. [56] |
| Accelerometer | Wrist | Time-domain; | NB; Decision tree; SVM; C4.5; KNN | 10 | 6 | 63.09–99.56 | Morillo et al. [96] |
| Accelerometer | Wrist | Time-domain; frequency-domain. | NN; KNN. | 13 | 6 | 79.2–90.4 | Wang et al. [87] |
| Accelerometer | Hip | Time-domain; frequency-domain. | KNN; SVM. | 5 | 9 | 70–75.68 | Wang et al. [97] |
| Vital Sign | Range & Scale | Technique | Tranduced Signal | References |
|---|---|---|---|---|
| Body temperature | 32–45 °C | Thermistors; thermoelectric effects; optical means | Resistance | Husain et al. [104]; Chen et al. [105]; Richmond et al. [106]. |
| Heart rate | 0.5–4 mV (ECG) | Skin electrode; optical; MI sensor. | Voltage/Current | Anliker et al. [107]; Rienzo et al. [108]; Xu et al. [109]. |
| Respiration Rate | 2–50 b/min 1 | Strain gauge/Impedance | Resistance | Folke et al. [110]; Guo et al. [111]. |
| Blood pressure | 10–400 mm Hg | Piezoelectric capacitors; capacitive strain sensors | Drain current | Schwartzet al. [112]; Dagdeviren et al. [113] |
| Pulse oxygenation | 80%–100% (SpO2) | Optical means. | Photodiode current | Lochner et al. [114]; Bansal et al. [115] |
| Blood glucose | 0.5–1 mM 2 | Electrochemical | Current | Liao et al. [116]; Vashist [117] |
© 2017 by the authors. Licensee MDPI, Basel, Switzerland. This article is an open access article distributed under the terms and conditions of the Creative Commons Attribution (CC BY) license ( http://creativecommons.org/licenses/by/4.0/).
Share and Cite
Wang, Z.; Yang, Z.; Dong, T. A Review of Wearable Technologies for Elderly Care that Can Accurately Track Indoor Position, Recognize Physical Activities and Monitor Vital Signs in Real Time. Sensors 2017, 17, 341. https://doi.org/10.3390/s17020341
Wang Z, Yang Z, Dong T. A Review of Wearable Technologies for Elderly Care that Can Accurately Track Indoor Position, Recognize Physical Activities and Monitor Vital Signs in Real Time. Sensors. 2017; 17(2):341. https://doi.org/10.3390/s17020341
Chicago/Turabian StyleWang, Zhihua, Zhaochu Yang, and Tao Dong. 2017. "A Review of Wearable Technologies for Elderly Care that Can Accurately Track Indoor Position, Recognize Physical Activities and Monitor Vital Signs in Real Time" Sensors 17, no. 2: 341. https://doi.org/10.3390/s17020341