Article

Ppbv-Level Ethane Detection Using Quartz-Enhanced Photoacoustic Spectroscopy with a Continuous-Wave, Room Temperature Interband Cascade Laser

1
College of Biological and Agricultural Engineering, Jilin University, Changchun 130022, China
2
Department of Electrical and Computer Engineering, Rice University, 6100 Main Street, Houston, TX 77005, USA
3
State Key Laboratory of Quantum Optics and Quantum Optics Devices, Institute of Laser Spectroscopy, Shanxi University, Taiyuan 030006, China
4
National Engineering Research Center of Geophysics Exploration Instruments, College of Instrumentation & Electrical Engineering, Jilin University, Changchun 130061, China
5
State Key Laboratory on Integrated Optoelectronics, College of Electronic Science and Engineering, Jilin University, Changchun 130012, China
*
Author to whom correspondence should be addressed.
Sensors 2018, 18(3), 723; https://doi.org/10.3390/s18030723
Submission received: 1 February 2018 / Revised: 20 February 2018 / Accepted: 23 February 2018 / Published: 28 February 2018
(This article belongs to the Special Issue Spectroscopy Based Sensors)

Abstract

:
A ppbv-level quartz-enhanced photoacoustic spectroscopy (QEPAS)-based ethane (C2H6) sensor was demonstrated by using a 3.3 μm continuous-wave (CW), distributed feedback (DFB) interband cascade laser (ICL). The ICL was employed for targeting a strong C2H6 absorption line located at 2996.88 cm−1 in its fundamental absorption band. Wavelength modulation spectroscopy (WMS) combined with the second harmonic (2f) detection technique was utilized to increase the signal-to-noise ratio (SNR) and simplify data acquisition and processing. Gas pressure and laser frequency modulation depth were optimized to be 100 Torr and 0.106 cm−1, respectively, for maximizing the 2f signal amplitude. Performance of the QEPAS sensor was evaluated using specially prepared C2H6 samples. A detection limit of 11 parts per billion in volume (ppbv) was obtained with a 1-s integration time based on an Allan-Werle variance analysis, and the detection precision can be further improved to ~1.5 ppbv by increasing the integration time up to 230 s.

1. Introduction

Ethane (C2H6) is one of the most abundant non-methane hydrocarbon in the atmosphere that strongly affect both atmosphere chemistry and the climate [1,2]. C2H6 usually originates from fossil fuel and biofuel consumption. Hence, C2H6 detection at low concentration levels is very important in environmental monitoring [3,4]. Furthermore, ultra-sensitive detection of ethane can be applied to breath analysis as a non-invasive medical diagnostic method for identifying and monitoring C2H6 concentration levels in the exhaled breath of patients, such as the identification of asthma by the detection of C2H6, which is generated by oxidative stress [5], the measurement of exhaled C2H6 as a direct biomarker of schizophrenia due to increased n − 3 lipid peroxidation [6], and, in the analysis of lung cancer, by detecting C2H6 as a marker of oxidative stress [7].
Gas detection techniques based on optical absorption have many advantages, such as fast response time, high gas selectivity, high measurement precision, no requirement for any sample pretreatment, and minimal drift. Hence, the tunable diode laser absorption spectroscopy (TDLAS) technique that employs a multi-pass gas cell (MGC) [8], the photo-acoustic spectroscopy (PAS) technique that employs a broadband microphone [9], the dispersion spectroscopy technique [10], and the photothermal interferometry technique [11] have been widely used in recent years. However, sensors based on MGC and PAS are large in size. Quartz-enhanced photoacoustic spectroscopy (QEPAS) [12] is an alternative approach, instead of conventional photo-acoustic spectroscopy, which utilizes a millimeter sized piezoelectric quartz tuning fork (QTF) as an acoustic wave transducer to detect photo-acoustic excitation induced by a modulated laser source absorbed by the gas target [13]. A high Q-factor (>10,000) and a ~32.7 kHz resonance frequency of the QTF improve the QEPAS sensitivity, which is also immune to environmental acoustic noise. QEPAS has been widely used by research groups that are engaged in trace gas detection in medicine and numerous other applications [14,15,16].
A distinct advantage of the QEPAS technique is its excitation-wavelength independence [17]. This benefit allows the same QEPAS-based trace gas sensor to be used with any type of laser (e.g., the distributed feedback (DFB) diode laser [18], the quantum cascade laser (QCL) laser [19], and the light emitting diode (LED) [20] and any wavelength (e.g., visible [20], near-infrared (NIR) [21], mid-infrared (MIR) [22], and THz spectral region [23]). A gallium antimonide (GaSb)-based interband cascade laser (ICL) became commercially available in 2010 [24]. An ICL is compact and can provide CW radiation, typically between 3.0 μm and 6.0 μm at room temperature operation [25]. Furthermore the ICL size matches the QEPAS-based acoustic detection module (ADM). This wavelength range corresponds to the strongest fundamental vibration band of carbohydrates, which is most suited for optimum detection sensitivity. In this work, we developed a compact QEPAS sensor for C2H6 detection based on a CW, DFB thermoelectrically cooled (TEC) ICL operating at a wavelength of ~3.3 μm in which an optimum C2H6 absorption line can be detected.

2. Experimental Setup

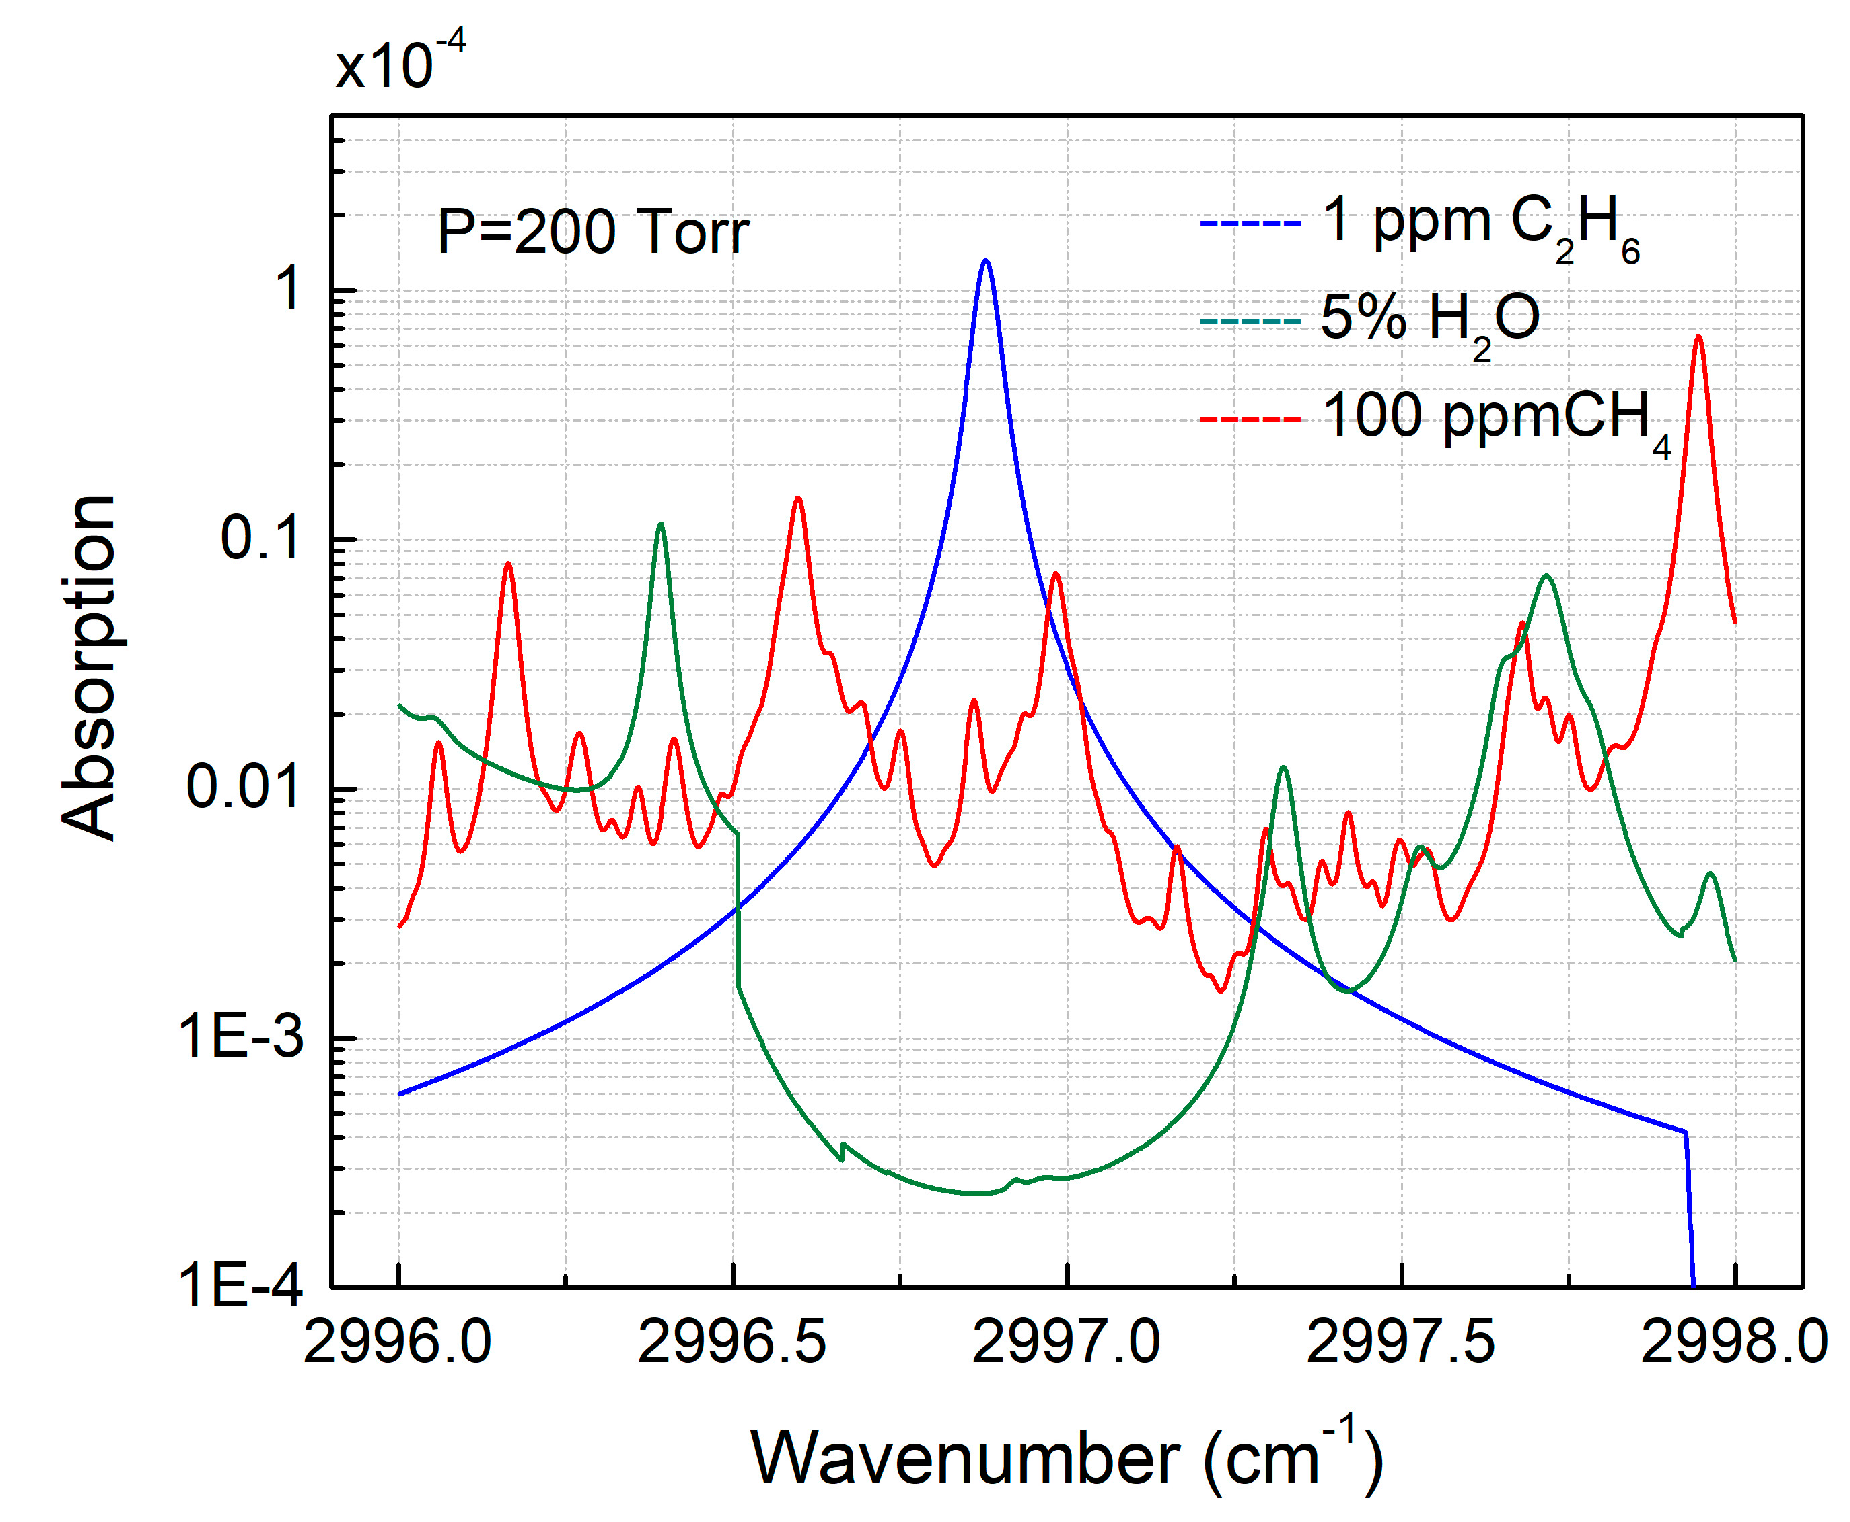
2.1. Absorption Line Selection

C2H6 has its strong fundamental absorption lines in the mid-infrared spectral range (near 3.3 μm), which permit sensitive and selective detection of atmospheric gases in this spectral range. Within this wavelength region, the potential spectral interference originates mainly from water (H2O) and methane (CH4). The concentration levels of H2O and CH4 in air are typically <5% and ~1.8 ppmv, respectively. Therefore, HITRAN absorption spectra of 1 ppmv ethane, 100 ppmv methane, and 50,000 ppmv water at 200 Torr gas pressure and a 3 cm effective optical path length are depicted in Figure 1. The selection of the low gas pressure avoids spectral overlap. A strong C2H6 absorption line at 3336.8 nm (2996.88 cm−1), which is free from spectral interference of other atmospheric gases (such as CH4 and H2O), was selected as the optimum target absorption line.

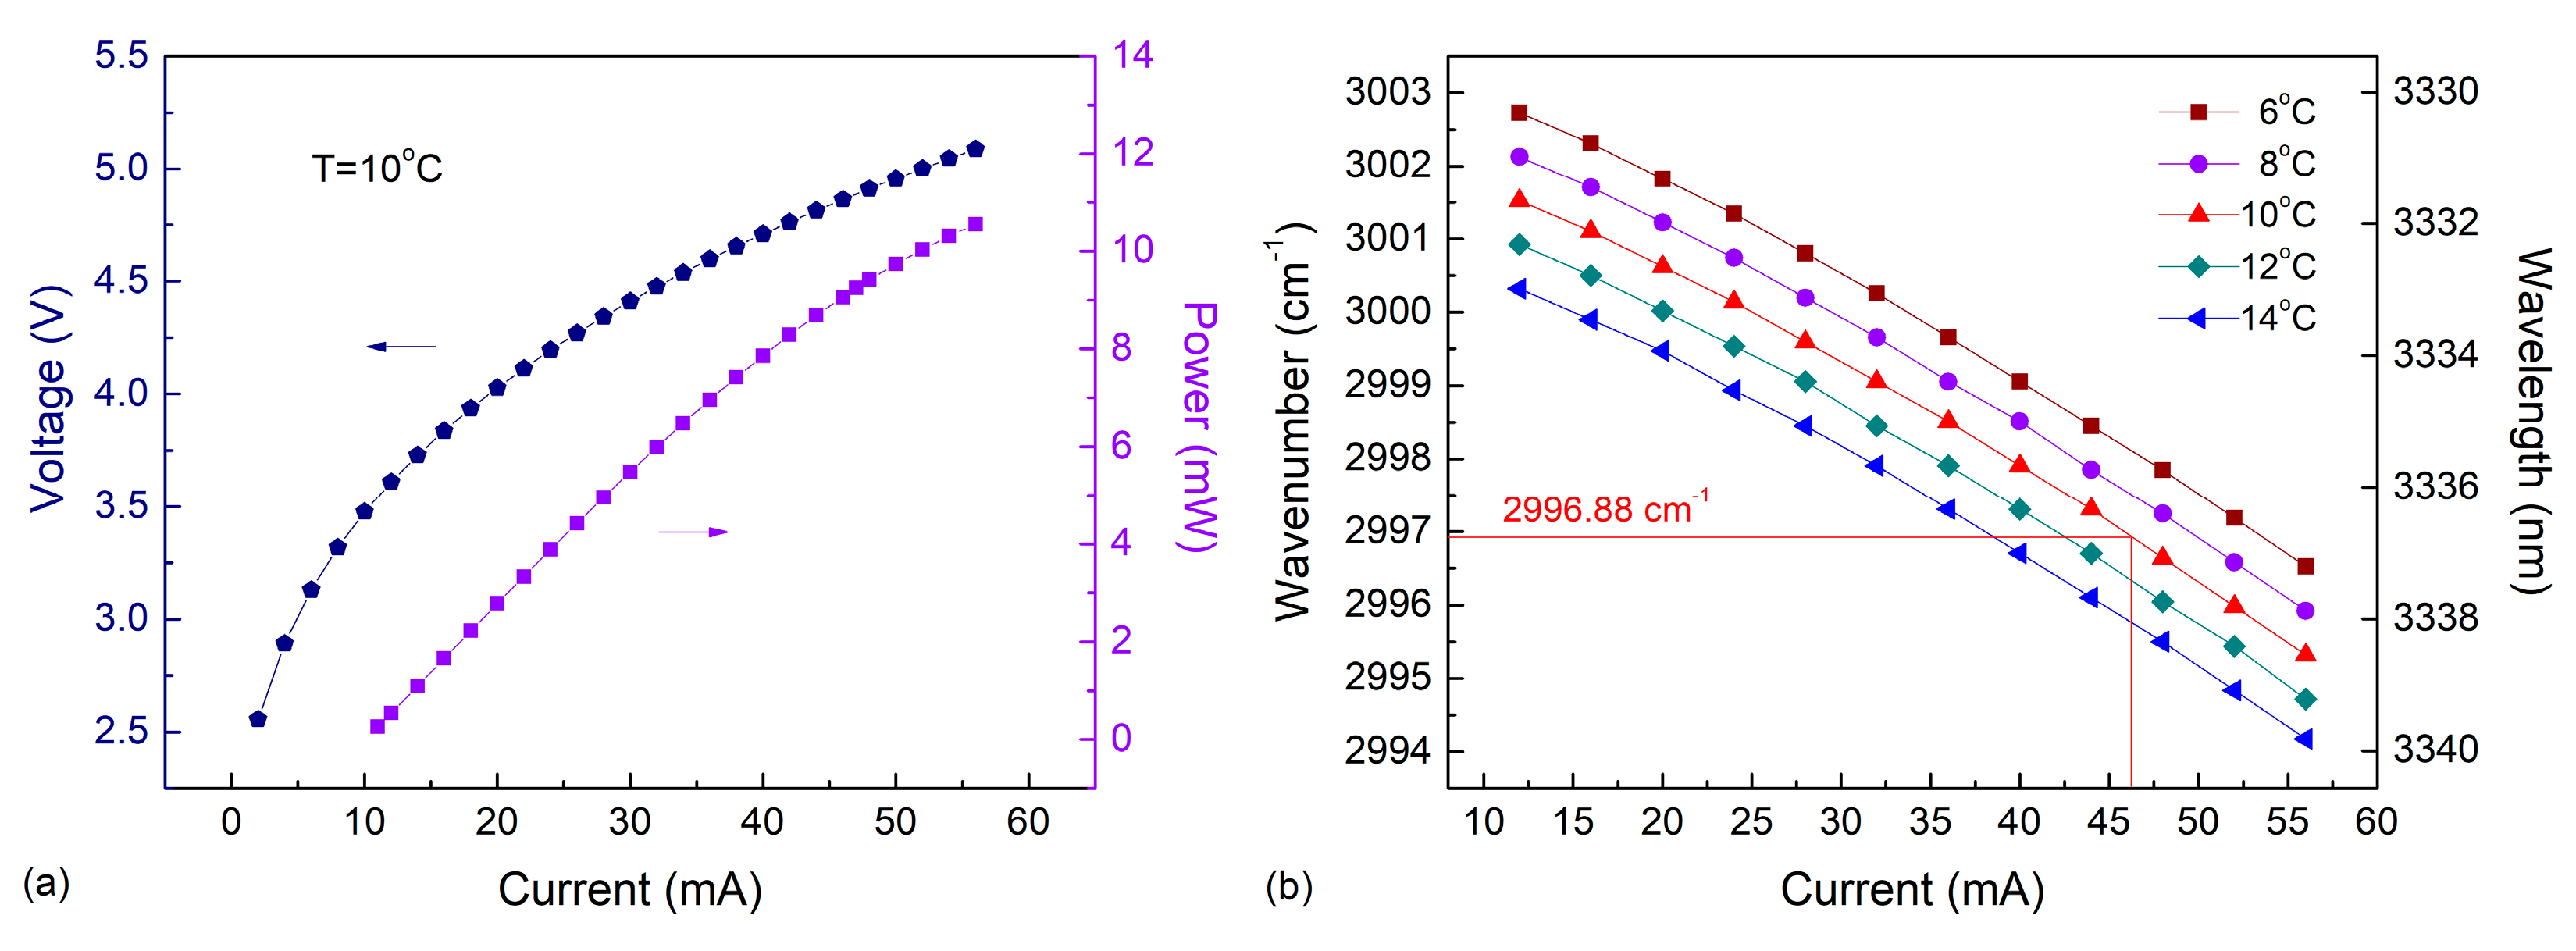
2.2. ICL Characteristics

A CW TEC interband cascade laser with a wavelength of ~3.3 μm from Nanoplus, GmbH was employed as an excitation source to target the C2H6 absorption line near 2996.88 cm−1. The TO66 mounted ICL was enclosed in a 5 × 5 × 5 cm3 cubic heat sink with a TEC. This ICL can be operated at temperatures between 5–15 °C without air or water cooling. The optical power emitted by this laser operated at 10 °C versus five operating temperatures is shown in Figure 2a. With an injected current of 55 mA, the laser power can be as high as ~10.5 mW, which is necessary for a signal-to-noise ratio (SNR) enhancement, since the amplitude of the QEPAS signal is proportional to the laser excitation power.
At different temperatures of 6–14 °C spaced by 2 °C, the laser wavenumbers versus driving current are shown in Figure 2b. Current and temperature-controlled wavelength tuning coefficients for this ICL were experimentally determined to be −0.141528 cm−1/mA and −0.30138 cm−1/°C, respectively, larger than those for QCLs. For the available temperature (6–14 °C) and current ranges (10–55 mA), the single frequency spectral tuning range of the laser wavenumber was determined to be 2994.2 cm−1–3002.7 cm−1. An ICL injection current of 47 mA, combined with a 10 °C operation temperature, was selected for the reported C2H6 concentration measurements.

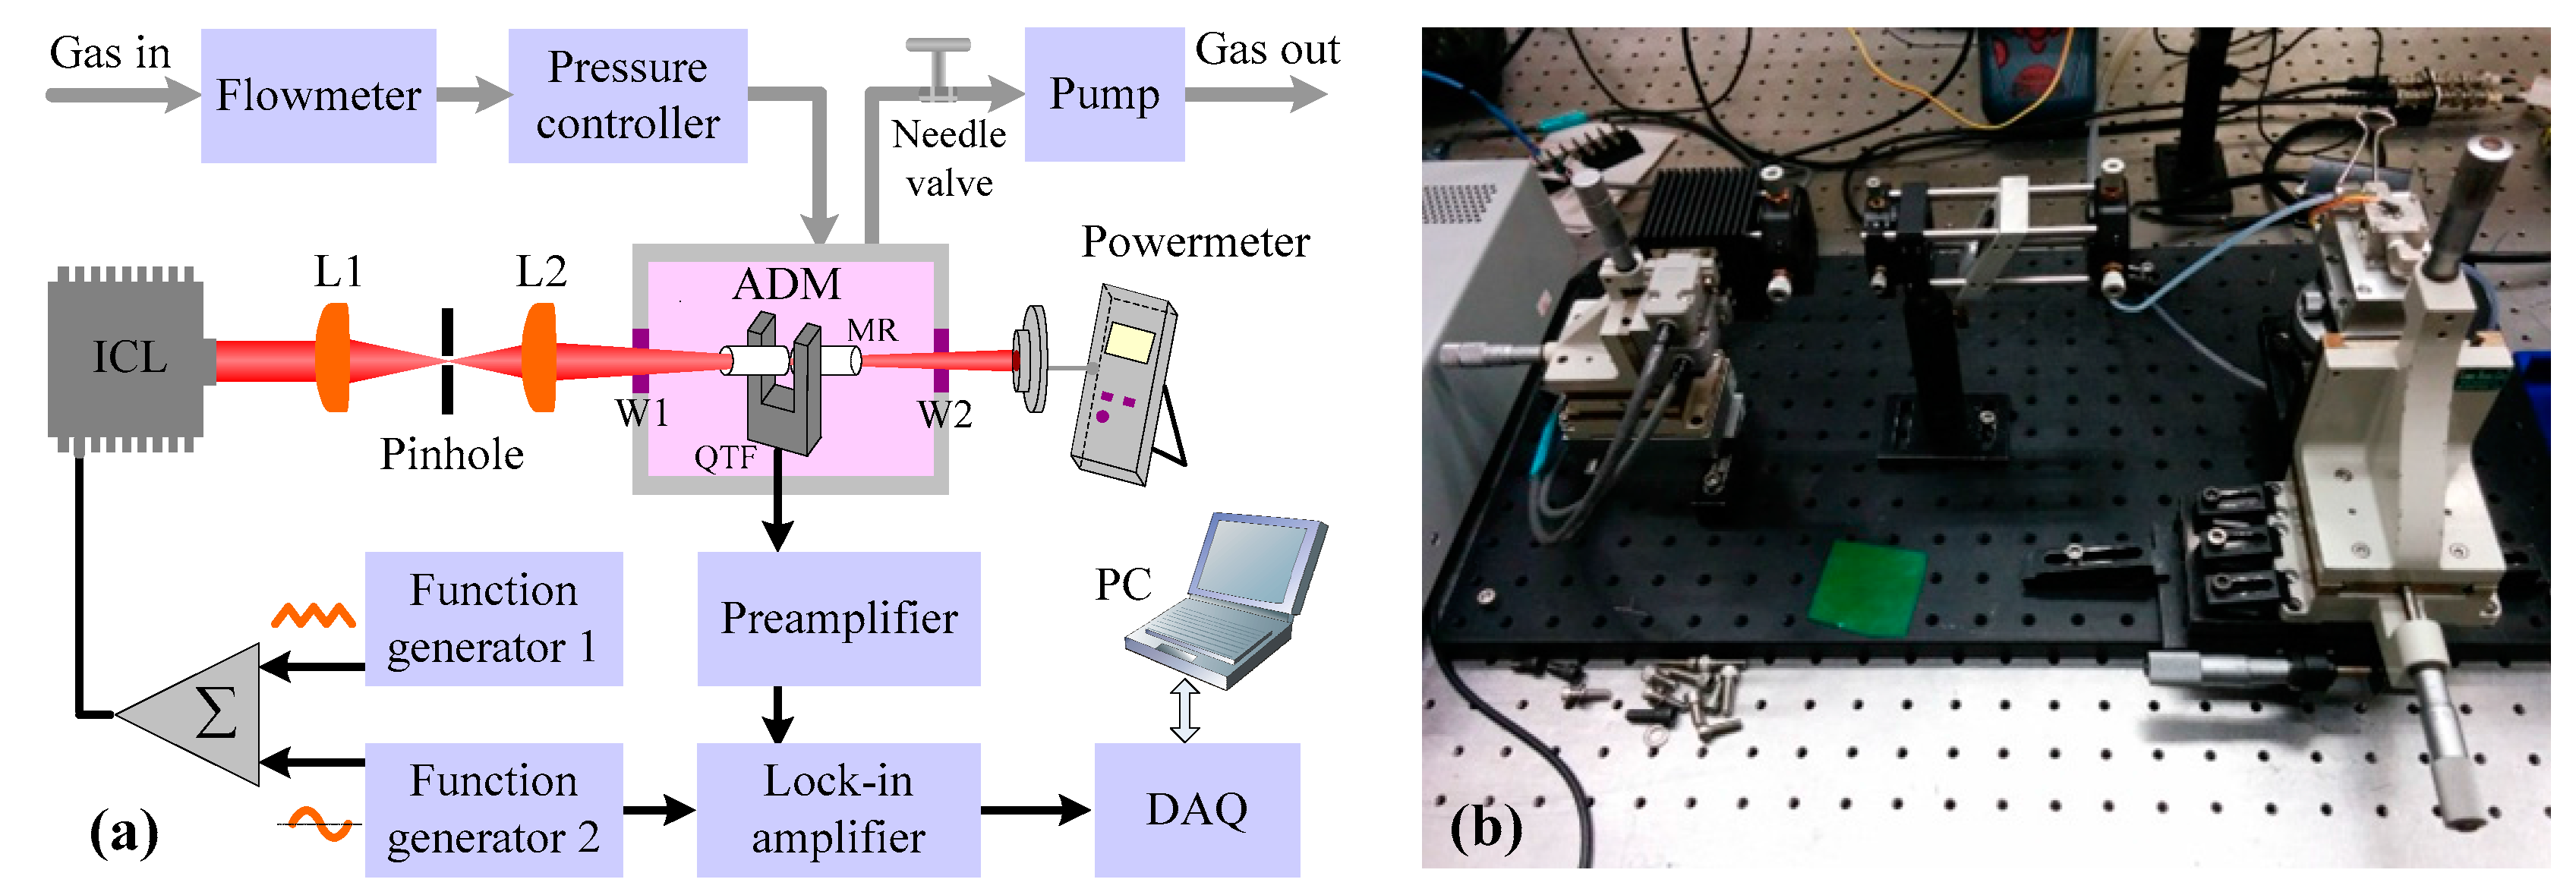
2.3. Sensor Architecture

A schematic of the QEPAS based C2H6 sensor is shown in Figure 3a. The ICL is equipped with a collimation lens and emits single-mode radiation at a center wavelength of 3337 nm. The collimated beam that exits the TO66 header then passes through a pinhole to reduce the beam diameter due to the fact that the diameter of the original collimated beam is ~6 mm, which is wider than the 300 μm gap between the two prongs of the QTF. The spatial filter consists of two plano-convex CaF2 lenses (L1 and L2) with the focal lengths of 5 cm and 4 cm, respectively, and a pinhole with a diameter of 300 μm positioned at the focus position of the two lenses, L1 and L2. The output beam from the spatial filter is directed to an ADM. The ADM includes a standard QTF and two thin metallic tubes with 4 mm length and 0.8 mm internal diameter, which act as acoustic micro-Resonators (AmR) [26]. The ICL beam must be focused through the tubes and the gap between the prongs of the QTF in order to avoid photo-thermal effects and minimize background noise sources [19,27]. A power meter (Ophir, model 3A) is used to monitor the power of the beam after the ADM, verifying that the ICL beam completely passed through the ADM. The ADM is placed in a gas enclosure with a gas inlet and outlet. A pressure controller (MKS Instruments, Inc., USA, model 649) and a vacuum pump are employed to control and maintain the pressure inside the ADM. A needle valve and flow meter are used to control and monitor the gas flow in the sensor system. A photo of the optical system is shown in Figure 3b.
A triangular wave was used to tune the laser wavelength to scan the absorption line near 2996.88 cm−1. Meanwhile, a modulation signal at half of the QTF resonance frequency was applied to modulate the ICL wavelength. The generated electric signal from the QTF was first processed by a pre-amplifier to enhance the SNR and then sent to a lock-in-amplifier for extraction of the 2f signal, whose amplitude represents the C2H6 concentration.

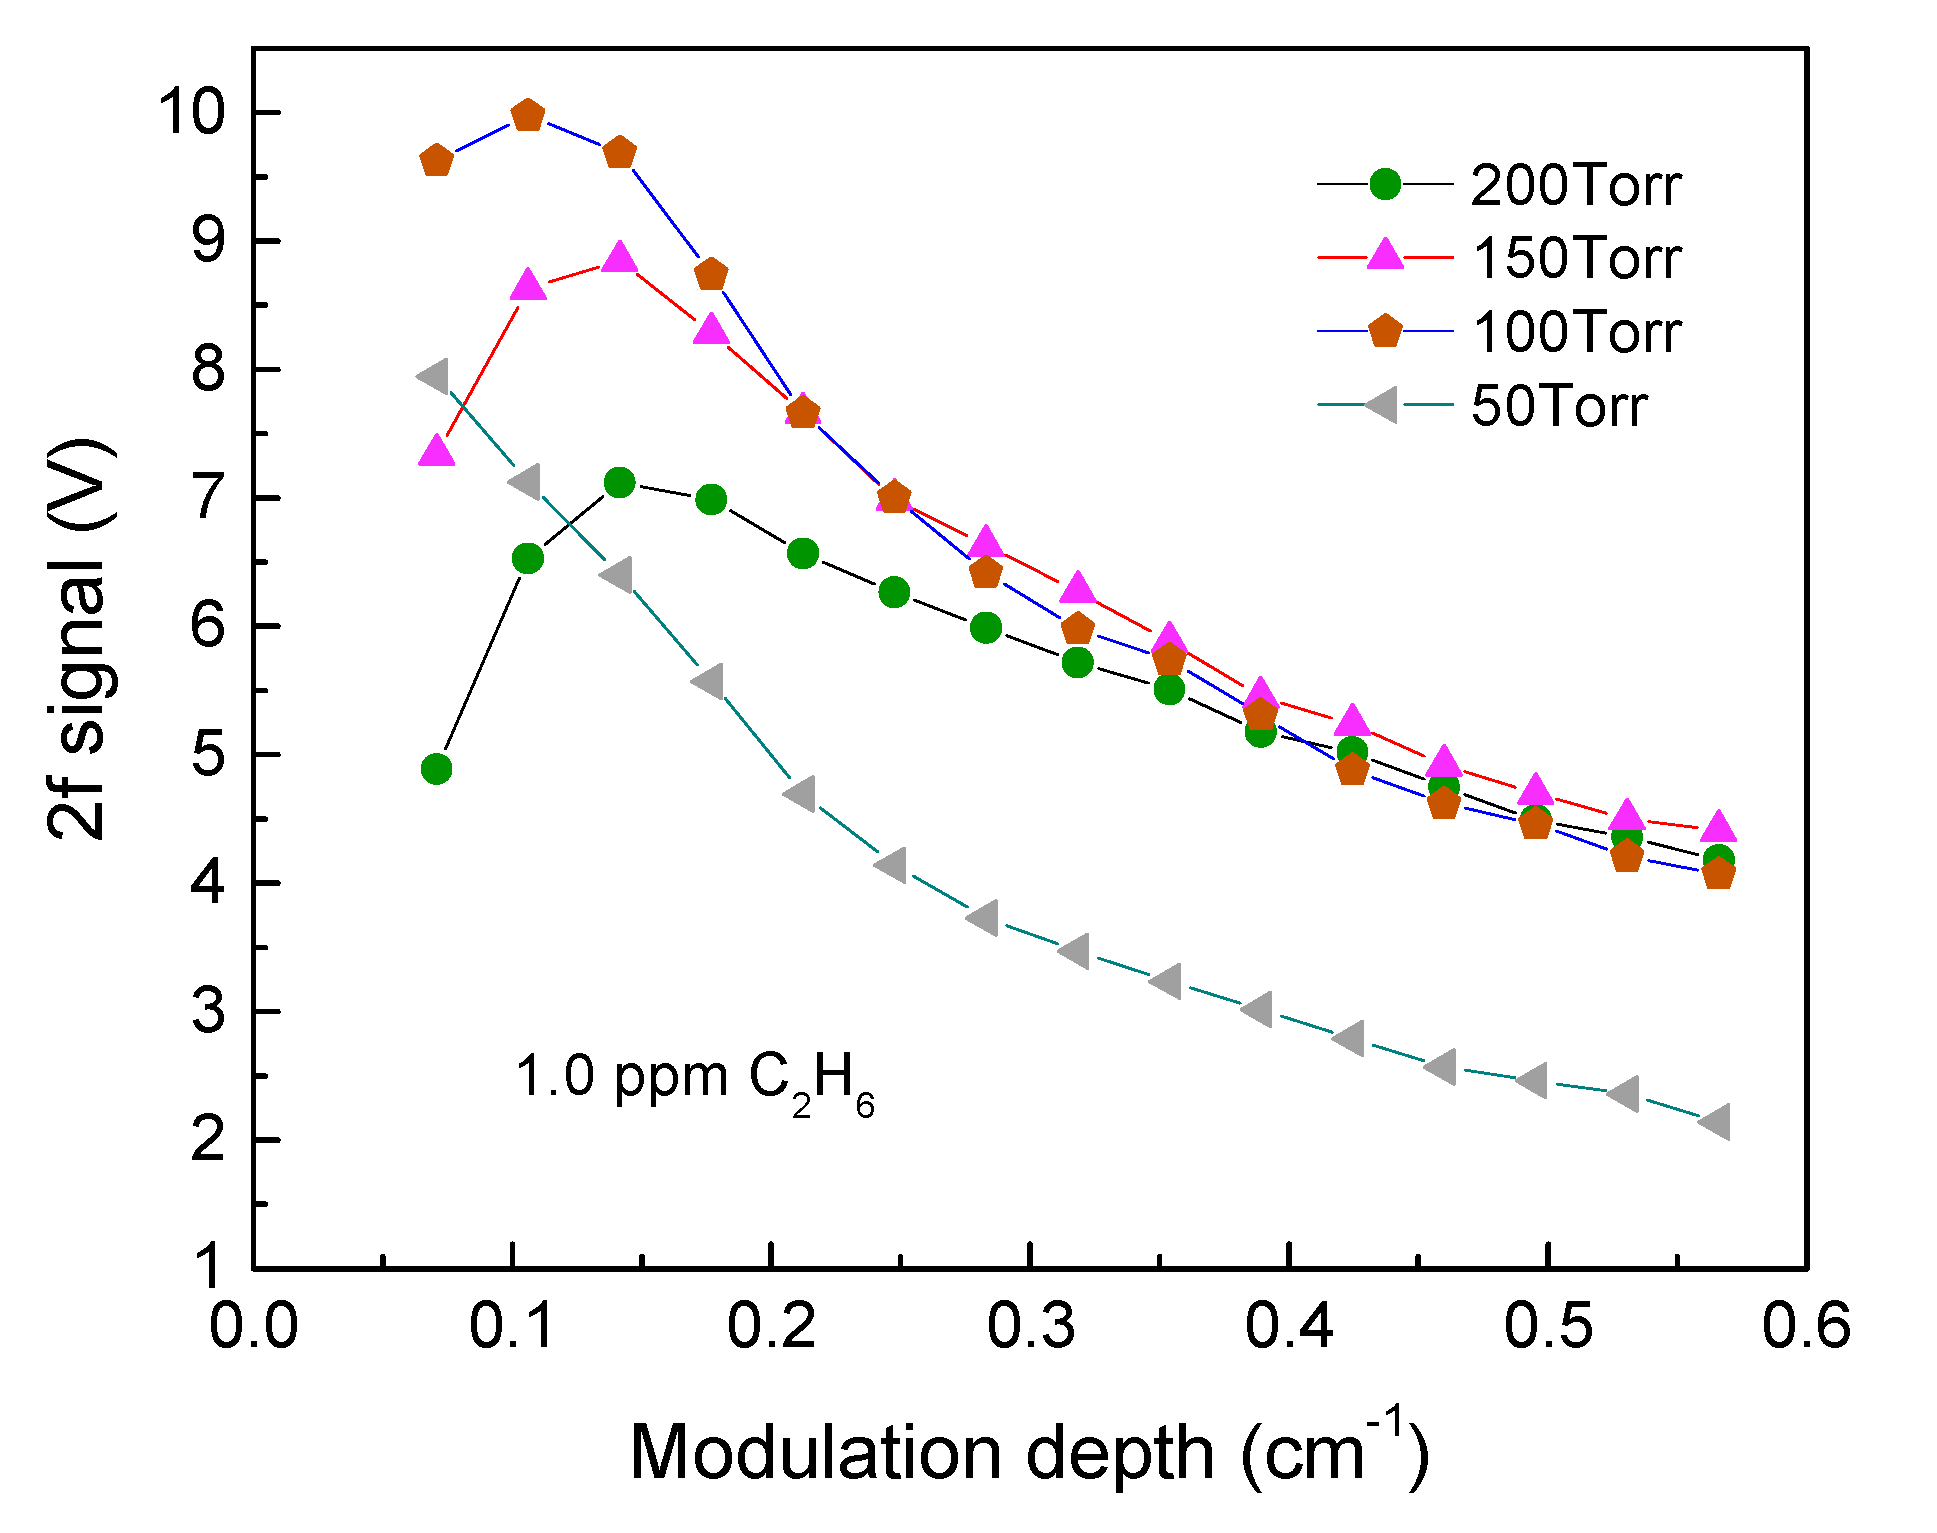
2.4. Optimization of Modulation Depth

In order to obtain the best sensor system detection sensitivity, the gas pressure and modulation depth for wavelength modulation spectroscopy (WMS) should be optimized [28,29]. A certified standard cylinder containing 1 ppmv C2H6 balanced by UHP N2 was employed for the optimization of the ethane sensor system. For each individual pressure ranging from 50 Torr to 200 Torr, the amplitude of the 2f signals was recorded with different modulation depths as depicted in Figure 4. The results demonstrate that the maximum 2f signal of this QEPAS system is observed at 100 Torr and with a modulation depth of 0.106 cm−1. For the same modulation depth, the 2f signal amplitude at a pressure of 200 Torr is 34.6% lower than the maximum value. The 2f signal increases with the modulation depth and decreases when the modulation depth is >0.106 cm−1.

3. Sensor Performance and Discussion

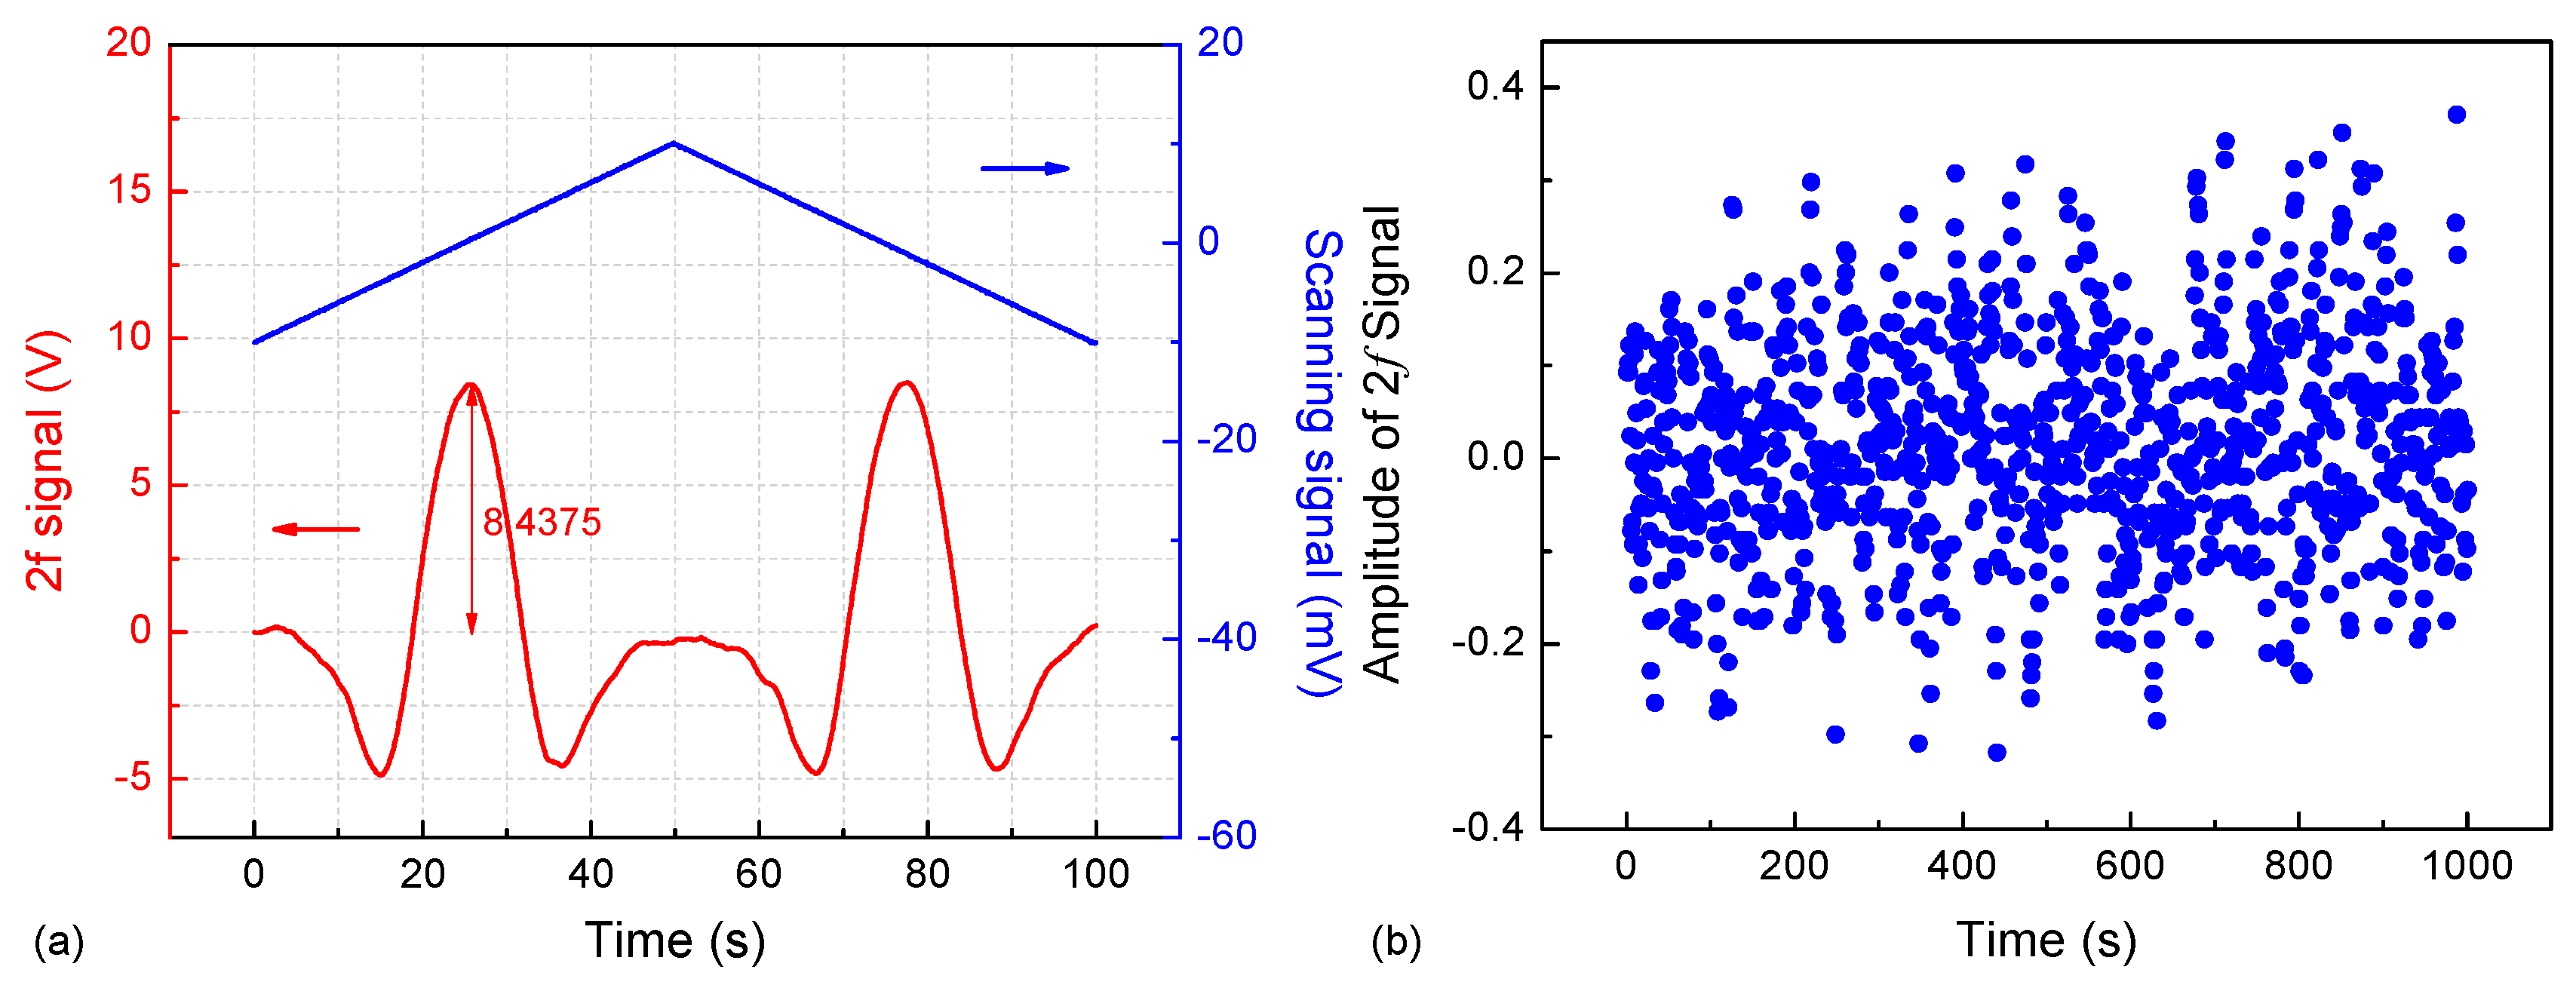
3.1. Estimation on SNR

A sinewave signal with a frequency of 16.3 kHz and amplitude of 0.016 V was used to modulate the ICL wavelength, leading to a modulation depth of 0.106 cm−1. The driving current and laser temperature were set to 47 mA and 10 °C for the ICL wavelength to be centered at 2996.88 cm−1. The pressure in the ADM was set to 100 Torr in order to avoid spectral interference from CH4. The signal from the QTF was first sent to the lock-in amplifier and then to a DAQ card. The sampling rate of the DAQ card was set to be 1 kHz. With a 1 s lock-in integration time, the 2f signal was acquired using a triangular wave with a frequency of 0.01 Hz and a peak-to-peak amplitude of 20 mV by scanning the laser wavelength. A spectral scan corresponding to a C2H6 concentration (1 ppmv) is depicted in Figure 5a. The amplitude of the 2f signal is ~8.44 V. The background noise was measured by flushing the ADM with ultra-high purity (UHP) nitrogen for one hour, as shown in Figure 5b. The noise level (standard deviation for one hour) is ~0.12 V. In this case, the calculated SNR, which was defined as the ratio of the signal amplitude to the 1σ noise level, was ~70.3. A minimum ethane detection sensitivity of 1 ppmv/70.3 ≈ 14 ppbv can thus be estimated.

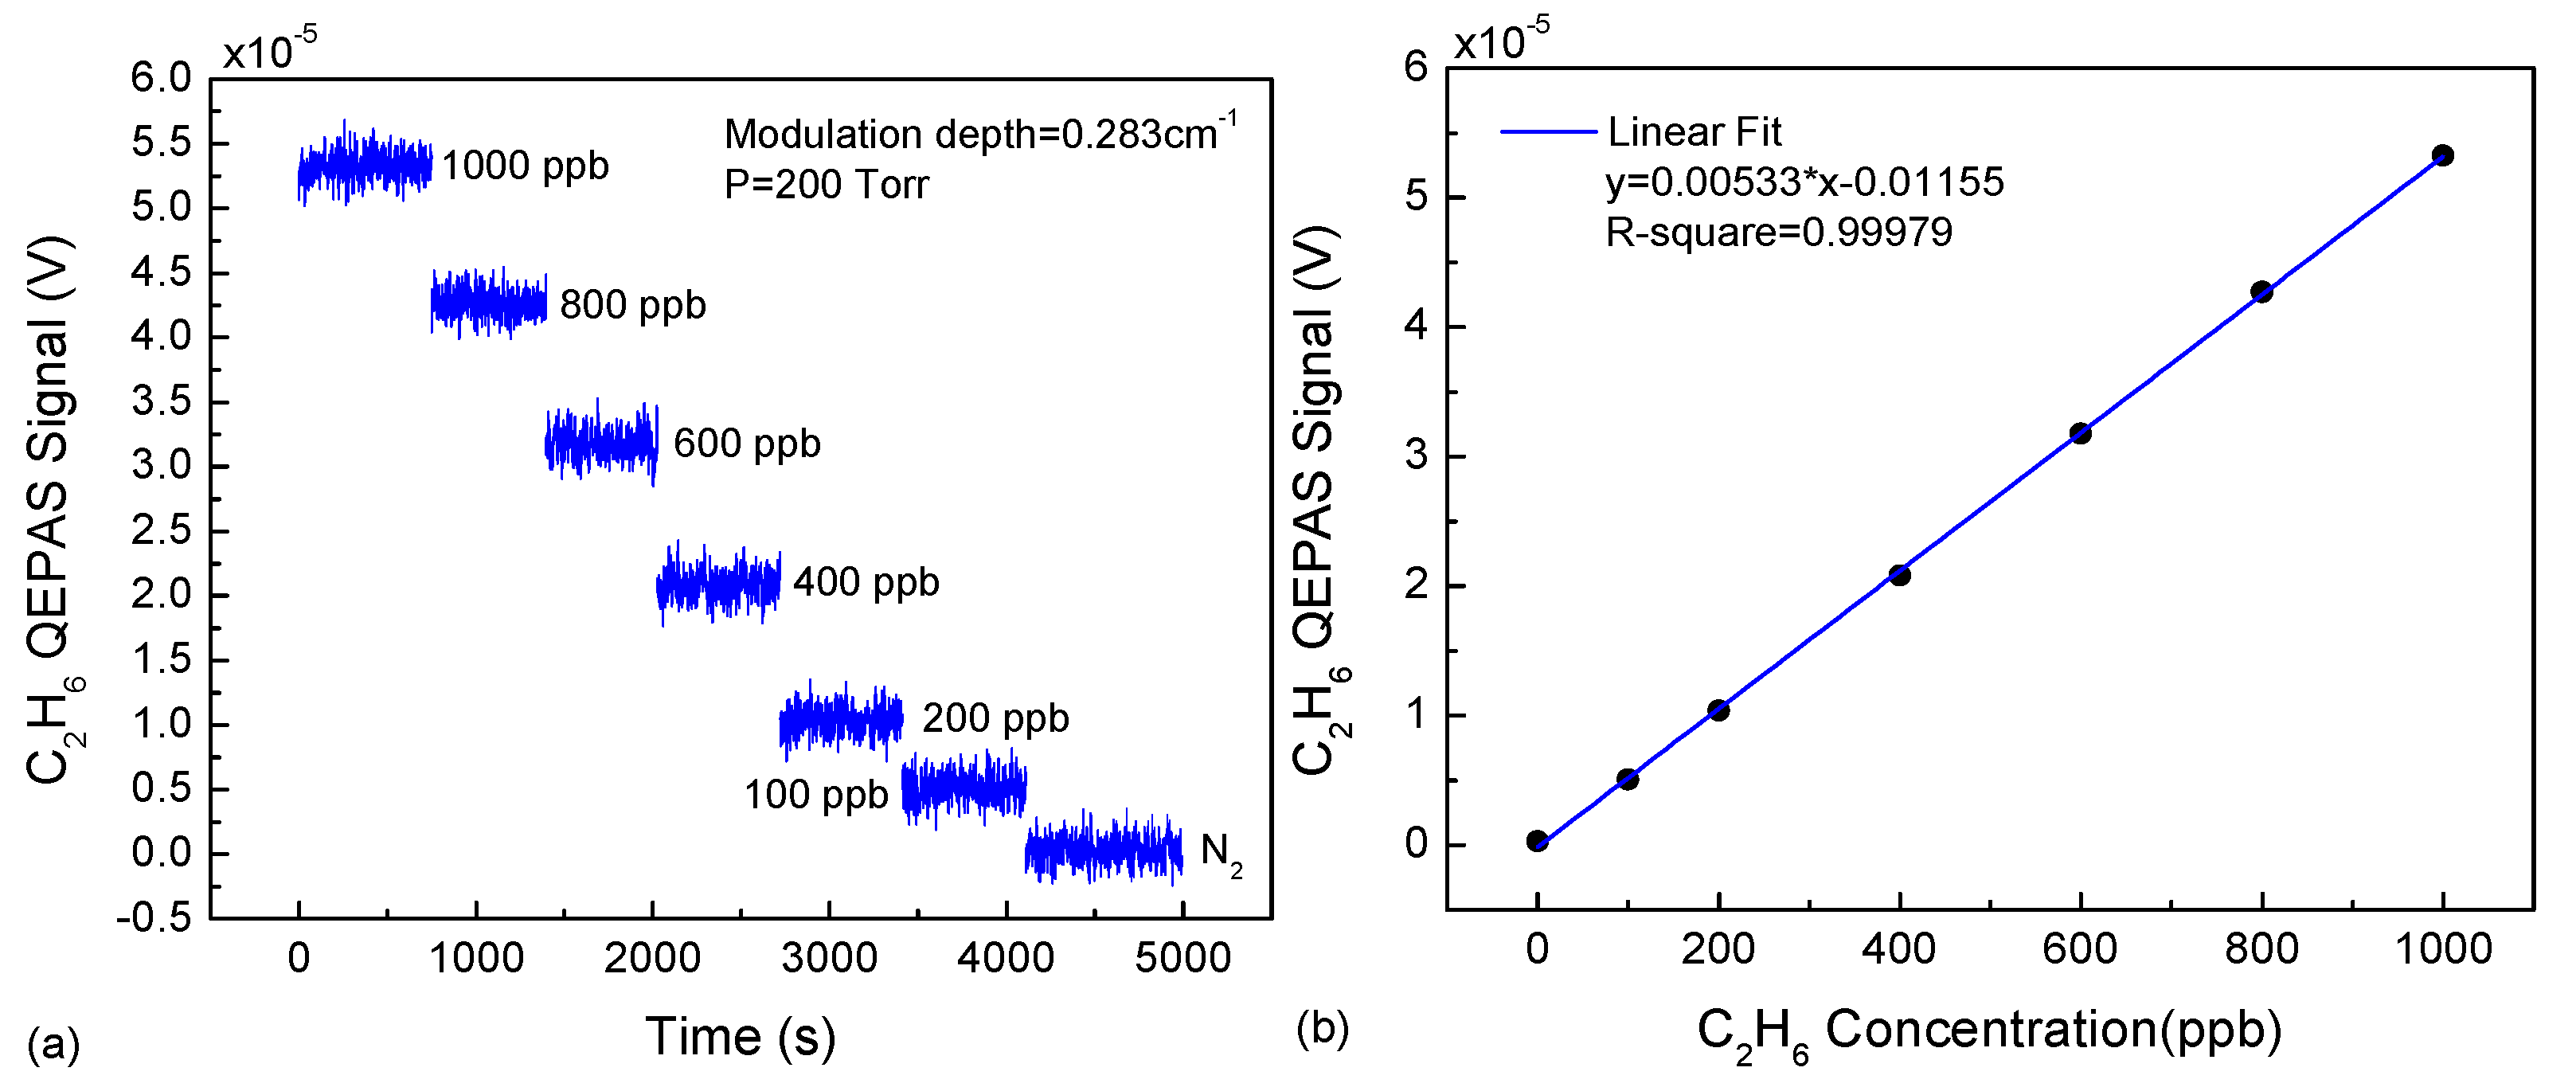
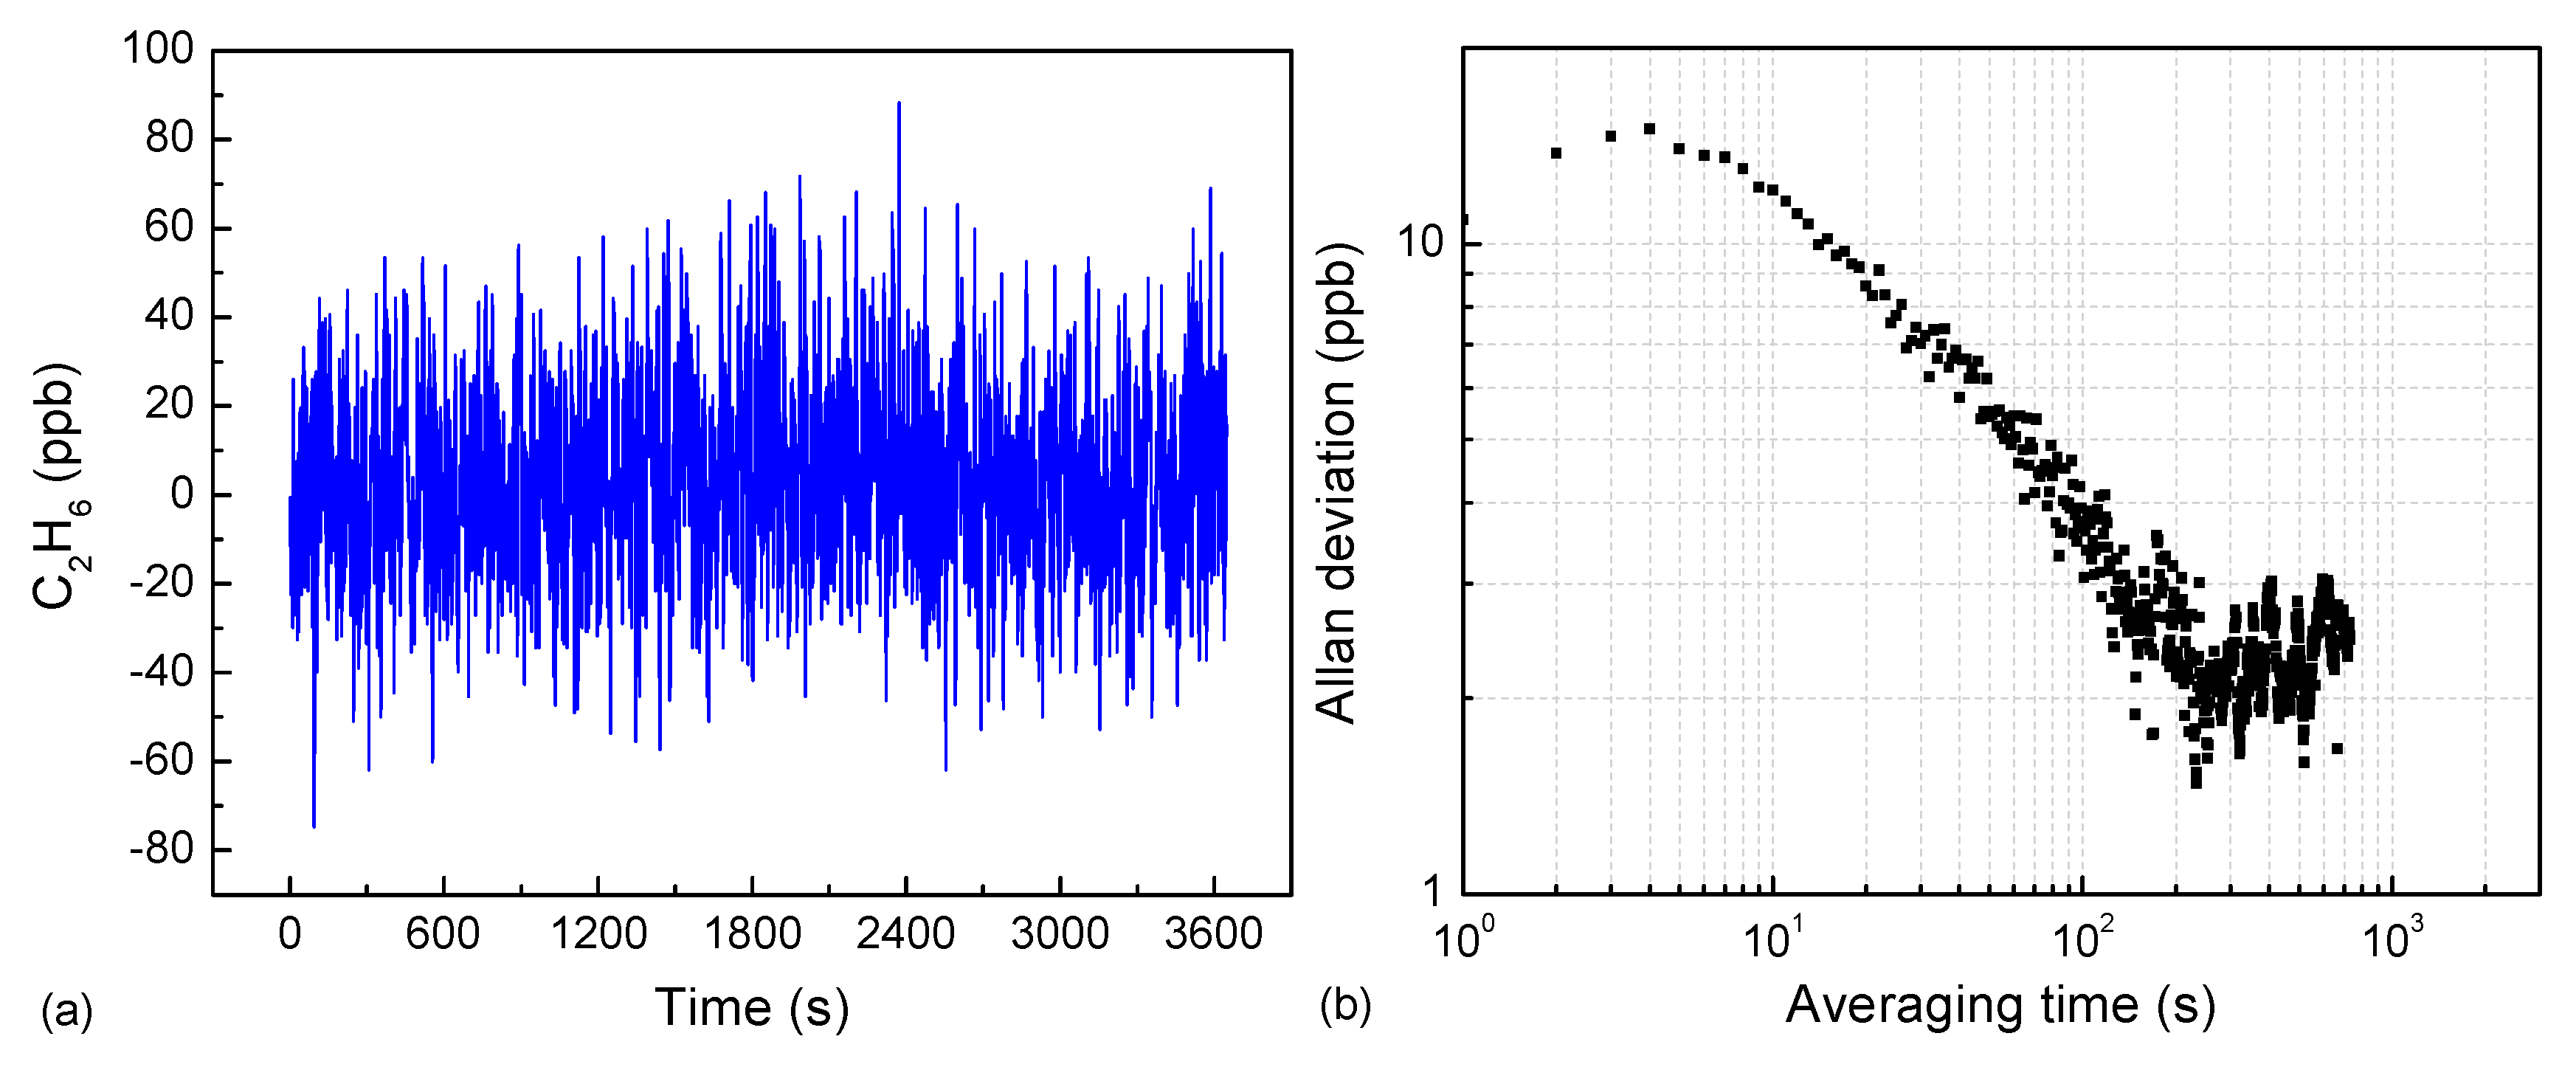
3.2. Experiment and Results

The sensor linearity was investigated. By diluting a calibration mixture of 1 ppmv C2H6 with UHP nitrogen, different C2H6 samples with concentrations ranging from 0 to 1000 ppbv were prepared in order to study the sensor performance. For different C2H6 samples, the amplitude of the 2f signal (max(2f)) was recorded by implementing line-locking functionality by means of an additional reference channel. The data acquisition time for these measurements was set to 1 s, and the intervals between each C2H6 concentration value applied to the sensor were set to ~10 min in order to reach a stable level of the measured QEPAS signal.
The results of max(2f) for different diluted C2H6 concentrations are depicted in Figure 6a. Then, the recorded max(2f) and the linear dependence of the averaged 2f signal amplitude as a function of C2H6 concentration were observed and are plotted in Figure 6b. The calculated R-square value is equal to 0.99979 after a linear fitting procedure, which implies that this QEPAS sensor exhibits excellent linearity for monitoring C2H6 concentrations. The relationship between the 2f amplitude and the concentration can be expressed as
max(2f) = 0.00533 × C − 0.01155 (V)
in which C is in ppbv. Based on Equation (1), the C2H6 concentration can be determined using the amplitude of 2f signal.
Allan-Werle deviation measurements were performed to investigate the time stability of the C2H6 sensor. The C2H6 sensor operated with pure N2 for a period of ~1 h was carried out, and the output results that corresponded to the fluctuation of the sensor output in the absence of the C2H6 were recorded. An Allan-Werle variance was utilized to analyze the time stability and minimum detection limit (MDL) for this technique. Figure 7a,b exhibits the measured concentration and the Allan-Werle deviation as a function of the integration time t. The plot indicates that the MDL is ~11 ppbv for a 1 s measurement time, as well as ~1.5 ppbv for an optimum integration time of 230 s. The MDL obtained from Allan–Werle plot (11 ppbv) is consistent with the estimation value of 14 ppbv based on SNR and standard deviation measured at 1 ppmv.

4. Conclusions

In this work, we reported the design and results of an innovative, sensitive C2H6 sensor based on QEPAS. In order to attain ppbv level C2H6 concentration measurements, a CW, DFB, TEC, ICL with a wavelength of ~3.3 μm combined with a 2f wavelength modulation technique was applied to an interference-free absorption line located at 2996.88 cm−1. After appropriate system optimization, the performance of the QEPAS sensor was evaluated using seven C2H6 samples. An MDL of 11 parts per billion in volume (ppbv) was obtained with a 1s integration time based on the Allan-Werle variance; the MDL could be further improved to ~1.5 ppbv by increasing the integration time up to 230 s. In a future version of this reported C2H6 sensor, the sensitivity could be further improved by replacing the present ICL with a mid-infrared semiconductor source with higher output power.

Acknowledgments

Chunguang Li acknowledges support by National Postdoctoral Program for Innovative Talents (Grant No. BX201700100), China Postdoctoral Science Foundation (Grant No. 2017M621206). Lei Dong acknowledges support from National Natural Science Foundation of China (Grant Nos. 61622503 and 61575113), Program for the Outstanding Innovative Teams of Higher Learning Institutions of Shanxi, “1331 project” key subjects construction, and the Sanjin Scholars Program (2017QNSJXZ-04). Frank K. Tittel acknowledges support from the National Science Foundation (NSF) ERC MIRTHE award, a Robert Welch Foundation Grant C-0586. Chuantao Zheng acknowledges the support from China Scholarship Council (Grant No. 201506175025), the National Natural Science Foundation of China (Grant No. 61307124), and the Changchun Municipal Science and Technology Bureau (Grant No. 14KG022).

Author Contributions

Lei Dong conceived the experiments; Chunguang Li designed and performed the experiments; Chunguang Li and Chuantao Zheng analyzed the data; Frank K. Tittel, Yiding Wang, and Jun Lin contributed equipment and analysis tools; Chuantao Zheng wrote the paper.

Conflicts of Interest

The authors declare no conflict of interest.

References

  1. Simpson, I.J.; Rowland, F.S.; Meinardi, S.; Blake, D.R. Influence of biomass burning during recent fluctuations in the slow growth of global tropospheric methane. Geophys. Res. Lett. 2006, 33, L22808. [Google Scholar] [CrossRef]
  2. Xiao, Y.; Logan, J.A.; Jacob, D.J.; Hudman, R.C.; Yantosca, R.; Blake, D.R. Global budget of ethane and regional constraints on U.S. sources. J. Geophys. Res. 2008, 113, D21306. [Google Scholar] [CrossRef]
  3. Thomson, L.C.; Hirst, B.; Gibson, G.; Gillespie, S.; Jonathan, P.; Skeldon, K.D.; Padgett, M.J. An improved algorithm for locating a gas source using inverse methods. Atmos. Environ. 2007, 41, 1128–1134. [Google Scholar] [CrossRef]
  4. Etiope, G.; Ciccioli, P. Earth’s degassing: A missing ethane and propane source. Science 2009, 323, 478. [Google Scholar] [CrossRef] [PubMed]
  5. Paredi, P.; Kharitonov, S.A.; Barnes, P.J. Elevation of exhaled ethane concentration in asthma. Am. J. Respir. Crit. Care Med. 2000, 162, 1450–1454. [Google Scholar] [CrossRef] [PubMed]
  6. Puri, B.K.; Ross, B.M.; Treasaden, I.H. Increased levels of ethane, a non-invasive, quantitative, direct marker of n-3 lipid peroxidation, in the breath of patients with schizophrenia. Prog. Neuro-Psychopharmacol. Biol. Psychiatry 2008, 32, 858–862. [Google Scholar] [CrossRef] [PubMed]
  7. Skeldon, K.D.; McMillan, L.C.; Wyse, C.A.; Monk, S.D.; Gibson, G.; Patterson, C.; France, T.; Longbottom, C.; Padgett, M.J. Application of laser spectroscopy for measurement of exhaled ethane in patients with lung cancer. Respir. Med. 2006, 100, 300–306. [Google Scholar] [CrossRef] [PubMed]
  8. Lackner, M. Tunable Diode Laser Absorption Spectroscopy (TDLAS) in the Process Industries: A Review. Rev. Chem. Eng. 2007, 23, 65–147. [Google Scholar] [CrossRef]
  9. Varga, A.; Bozoki, Z.; Szakall, M.; Szabó, G. Photoacoustic system for on-line process monitoring of hydrogen sulfide (H2S) concentration in natural gas streams. Appl. Phys. B. 2006, 85, 315–321. [Google Scholar] [CrossRef]
  10. Martin-Mateos, P.; Hayden, J.; Acedo, P.; Lendl, B. Heterodyne Phase-Sensitive Dispersion Spectroscopy in the Mid-Infrared with a Quantum Cascade Laser. Anal. Chem. 2017, 89, 5916–5922. [Google Scholar] [CrossRef] [PubMed]
  11. Waclawek, J.P.; Bauer, V.C.; Moser, H.; Lendl, B. 2f-wavelength modulation Fabry-Perot photothermal interferometry. Opt. Express 2016, 24, 28958–28967. [Google Scholar] [CrossRef] [PubMed]
  12. Waclawek, J.P.; Lewicki, R.; Moser, H.; Brandstetter, M.; Tittel, F.K.; Lendl, B. Quartz-enhanced photoacoustic spectroscopy-based sensor system for sulfur dioxide detection using a CW DFB-QCL. Appl. Phys. B Lasers Opt. 2014, 117, 113–120. [Google Scholar] [CrossRef]
  13. Patimisco, P.; Scamarcio, G.; Tittel, F.K.; Spagnolo, V. Quartz-Enhanced Photoacoustic Spectroscopy. Sensors 2014, 14, 6165–6206. [Google Scholar] [CrossRef] [PubMed]
  14. Yi, H.; Liu, K.; Chen, W.; Tan, T.; Wang, L.; Gao, X. Application of a broadband blue laser diode to trace NO2 detection using off-beam quartz-enhanced photoacoustic spectroscopy. Opt. Lett. 2011, 36, 481–483. [Google Scholar] [CrossRef] [PubMed]
  15. Lewicki, R.; Waclawek, J.; Jahjah, M.; Ma, Y.; Chrysostom, E.; Lendl, B.; Tittel, F.K. A sensitive CW DFB quantum cascade laser based QEPAS sensor for detection of SO2. In Proceedings of the 2012 Conference on Lasers and Electro-Optics, San Jose, CA, USA, 6–11 May 2012. [Google Scholar]
  16. Gray, S.; Liu, A.; Xie, F.; Zah, C.E. Detection of nitric oxide in air with a 5.2 μm distributed-feedback quantum cascade laser using quartz-enhanced photoacoustic spectroscopy. Opt. Express 2010, 18, 23353–23357. [Google Scholar] [CrossRef] [PubMed]
  17. Dong, L.; Wu, H.; Zheng, H.; Liu, Y.; Jiang, W.; Zhang, L.; Ma, W.; Ren, W.; Yin, W.; Jia, S.; et al. Double acoustic microresonator quartz-enhanced photoacoustic spectroscopy. Opt. Lett. 2014, 39, 2479–2482. [Google Scholar] [CrossRef] [PubMed]
  18. Wu, H.; Sampaolo, A.; Dong, L.; Patimisco, P.; Liu, X.; Zheng, H.; Yin, X.; Ma, W.; Zhang, L.; Yin, W.; et al. Fiber-amplifier-enhanced QEPAS sensor using a custom tuning fork with a large prong space. Appl. Phys. Lett. 2015, 107, 111104. [Google Scholar] [CrossRef]
  19. Waclawek, J.P.; Moser, H.; Lendl, B. Compact quantum cascade laser based quartz-enhanced photoacoustic spectroscopy sensor system for detection of carbon disulfide. Opt. Express 2016, 24, 6559–6571. [Google Scholar] [CrossRef] [PubMed]
  20. Zheng, H.; Dong, L.; Yin, X.; Liu, X.; Wu, H.; Zhang, L.; Ma, W.; Yin, W.; Jia, S. Ppbv-level QEPAS NO2 sensor by use of electrical modulation cancellation method with a high power blue LED. Sens. Actuators B Chem. 2015, 208, 173–179. [Google Scholar] [CrossRef]
  21. Spagnolo, V.; Patimisco, P.; Borri, S.; Scamarcio, G.; Bernacki, B.E.; Kriesel, J. Part-per-trillion level SF6 detection using a quartz enhanced photoacoustic spectroscopy-based sensor with single-mode fiber-coupled quantum cascade laser excitation. Opt. Lett. 2012, 37, 4461–4463. [Google Scholar] [CrossRef] [PubMed]
  22. Triki, M.; Nguyen Ba, T.; Vicet, A. Compact sensor for methane detection in the mid infrared region based on Quartz Enhanced Photoacoustic Spectroscopy. Infrared Phys. Technol. 2015, 69, 74–80. [Google Scholar] [CrossRef]
  23. Spagnolo, V.; Patimisco, P.; Pennetta, R.; Sampaolo, A.; Scamarcio, G.; Vitiello, M.S.; Tittel, F.K. THz Quartz-enhanced photoacoustic sensor for H2S trace gas detection. Opt. Express 2015, 23, 7574–7582. [Google Scholar] [CrossRef] [PubMed]
  24. Bauer, A.; Dallner, M.; Kamp, M.; Höfling, S.; Worschech, L.; Forchel, A. Shortened injector interband cascade lasers for 3.3 to 3.6 µm emission. Opt. Eng. 2010, 49, 111117. [Google Scholar] [CrossRef]
  25. Dallner, M.; Höfling, S.; Kamp, M. Room-temperature operation of InAs-based interband-cascade-lasers beyond 6µm. Electron. Lett. 2013, 49, 286–287. [Google Scholar] [CrossRef]
  26. Spagnolo, V.; Kosterev, A.A.; Dong, L.; Lewicki, R.; Tittel, F.K. NO trace gas sensor based on quartz-enhanced photoacoustic spectroscopy and external cavity quantum cascade laser. Appl. Phys. B 2010, 100, 125–130. [Google Scholar] [CrossRef]
  27. Dong, L.; Spagnolo, V.; Lewicki, R.; Tittel, F.K. Ppbv-level detection of nitric oxide using an external cavity quantum cascade laser based QEPAS sensor. Opt. Express 2011, 19, 24037–24045. [Google Scholar] [CrossRef] [PubMed]
  28. Werle, P. A review of recent advances in semiconductor laser based gas monitors. Spectrochim. Acta A 1998, 54, 197–236. [Google Scholar] [CrossRef]
  29. Schilt, S.; Thévenaz, L.; Robert, P. Wavelength modulation spectroscopy: Combined frequency and intensity laser modulation. Appl. Opt. 2003, 42, 6728–6738. [Google Scholar] [CrossRef] [PubMed]
Figure 1. HITRAN based absorption spectra of C2H6, CH4, and H2O in a narrow spectral range from 2996 cm−1 to 2998 cm−1 for specific concentrations of C2H6, CH4, and H2O and a 3 cm path length at a pressure of 200 Torr. C2H6, CH4, and H2O lines are shown in blue, red, and green, respectively.
Sensors 18 00723 g001
Figure 2. Measured laser characteristics for the 3.3 μm CW TEC ICL at different operating temperatures and injection currents. (a) ICL output power and voltage as function of current at 10 °C; (b) ICL wavelength (in cm−1) as function of ICL current at five temperatures.
Sensors 18 00723 g002
Figure 3. (a) Schematic configuration of a 3.3 μm CW, DFB, TEC ICL-based QEPAS system for C2H6 detection. (b) Photo of the optical part of the C2H6 sensor system.
Sensors 18 00723 g003
Figure 4. Measured C2H6 QEPAS signal amplitude as a function of laser modulation depth for a dry 1 ppmv C2H6:N2 mixture at four different pressure values.
Sensors 18 00723 g004
Figure 5. (a) Observed 2f signal for a 1 ppmv C2H6 sample; (b) Measured amplitude of the 2f signal by flushing the ADM with pure N2 for one hour.
Sensors 18 00723 g005
Figure 6. (a) QEPAS-based C2H6 signal at seven C2H6 concentration levels, ranging from 0 ppbv to 1000 ppbv; (b) Linearity of the QEPAS based sensor.
Sensors 18 00723 g006
Figure 7. (a) Measured C2H6 concentration by injecting pure N2 into ADM; (b) Allan-Werle deviation plot for the data shown in Figure 7a.
Sensors 18 00723 g007

