Article

Detection of Hydrogen Peroxide (H2O2) at ExposedTemperatures for Industrial Processes

by
Niko Näther
1,
Leon M. Juárez
1,
Rüdiger Emmerich
2,
Jörg Berger
2,
Peter Friedrich
2 and
Michael J. Schöning
1,*
1
University of Applied Sciences Aachen, Jülich Campus, Laboratory for Chemical and Biosensors, Ginsterweg 1, 52428 Jülich, Germany
2
1 University of Applied Sciences Aachen, Jülich Campus, Laboratory for Chemical and Biosensors, Ginsterweg 1, 52428 Jülich, Germany
3
Institute of Thin Films and Interfaces, Research Centre Jülich GmbH, 52425 Jülich, Germany
*
Author to whom correspondence should be addressed.
Sensors 2006, 6(4), 308-317; https://doi.org/10.3390/s6040308
Submission received: 15 August 2005 / Accepted: 14 February 2006 / Published: 7 April 2006

Abstract

:
An H2O2 sensor for the application in industrial sterilisation processes has been developed. Therefore, automated sterilisation equipment at laboratory scale has been constructed using parts from industrial sterilisation facilities. In addition, a software tool has been developed for the control of the sterilisation equipment at laboratory scale. First measurements with the developed sensor set-up as part of the sterilisation equipment have been performed and the sensor has been physically characterised by optical microscopy and SEM.

Introduction

For the sterilisation of enclosures in which products, like food, medical equipment and drugs are handled or packaged, there exists a manifold of methods including superheated steam, dry heat, radiation, and aqueous and gaseous sterilants such as formaldehyde, glutaraldehyde and ethylene oxide. Due to some benefits, in the last years, the use of hydrogen peroxide vapour (HPV) as sterilant became more relevant [1,2]. Hydrogen peroxide (H2O2) spontaneously decomposes to the harmless products of water and oxygen unlike formaldehyde, glutaraldehyde and ethylene oxide, which pose hazards to the environment and operating personnel. Due to the effectivity in terms of antimicrobial activity and the environmental sound behaviour, the sterilisation with HPV is widely used in common aseptic packaging plants [3]. The advantage of HPV over H2O2 liquids is the cost-saving principle due to lower concentrations of H2O2 used by the HPV method. Therefore, the consumption of H2O2 by using the liquid method is about three times higher than applying the vapour method [4]. For the HPV sterilisation, the package or sterilisation good is placed under a continuously flowing vapour stream. The microbial kill rate depends on the time at which the package is placed under the stream, the H2O2 concentration, the temperature, the humidity and the massflow of the stream. In industrial processes, the retention time is fixed (< 1 s) and the parameters, like temperature (> 200 °C) and H2O2 concentration (1-15 Vol.%) are adjusted by using statistical methods with a set of control samples of the sterilisation good. It is perspicious that a regulation of the sterilisation equipment with such an extensive method is not possible and the realisation of a low-cost H2O2 sensor for such rude conditions is essential.
Beside a series of electrochemical sensors for the liquid phase, like amperometric or potentiometric sensors, there are only a few concepts for measuring H2O2 in the gas phase. For the amperometric detection, a working electrode (Pt, Au, Pd, carbon fibre) has to be polarised on a potential of 0.7 to 0.8 V against a standard reference electrode [5-7]. The measured current flowing through the measurement chain is proportional to the H2O2 concentration. One drawback of this arrangement is the interference with those analytes, which are also electroactive in this potential range. For reducing such interference problems, the electrodes can be covered with additional membranes [7-9] and the electrodes themselves can be modified with different catalysts [10-12], or alternatively new materials for the working electrodes can be used [13]. The selectivity can also be improved by using biological catalysts, like catalase and horseradish-peroxidase. To solve the problem of measuring H2O2 in the gas phase, an additional layer has to be applied between the reference and working electrode. These membranes, like ion-carrier membranes, Nafion, poly-HEMA and solid-state electrolytes collect the analyte and work as supporting electrolyte [3,14-17]. Different combinations of these concepts are suitable for low concentrations of H2O2 and especially, for low temperatures (room temperature) but not adequate for the given conditions in HPV sterilisation plants. Temperature-resistant methods are the testpaper method, UV-photolysis, photometry [18], colorimetry and the application of metal-oxide semiconductor-sensors. For the testpaper method, a paper is treated with a reagent, so that a colour change appears when the testpaper is in contact with H2O2. This colour change can be detected with usual spectroscopic methods. The main disadvantage of such chemoindicators is the response time of the colour-changing process, which can be up to 12 min. [19], so that an on-line measurement is not yet possible. The UV-photolysis, the photometry and colorimetry are representing cost-intensive methods, whereby the UV-photolysis is very unspecific. For this method, OH-radicals are generated by UV-light and detected by fluorescence measurements. As one can see, all molecules whose dissociation energy is lower than that of H2O2 will be dissociated and may be detected.
Due to the high costs of the measurement equipment, all these methods are not appropriate for an on-line detection of H2O2 in industrial processes. In contrast, metal-oxide gas sensors might be very useful for their usage as H2O2 sensor, since they have to be heated with an internal heater. On the other hand, they are very sensitive to humidity variations and have to be calibrated by performing measurements with all combinations of temperature, humidity and H2O2 concentrations that are possible within the sterilisation recipe. Additionally, temperature compensation should be inserted [20-22]. All these methods exhibit possible methods for the measurement of H2O2, but most of them have high restrictions with regard to the temperature used during HPV sterilisation, the required H2O2 concentration, selectivity and costs.
The aim of this work is to develop a new type of H2O2 sensor for the gas phase to perform on-line measurements under real-time conditions. Therefore, an automated sterilisation equipment at laboratory scale has been constructed in order to perform experiments with the developed new sensor type. The detection principle of the sensor takes benefit on the exothermic decomposition of H2O2. While H2O2 decomposes to water and oxygen, it leads to an enthalpy change of -98 kJ/mol, which should be measured quantitatively by the sensor device.

Experimental

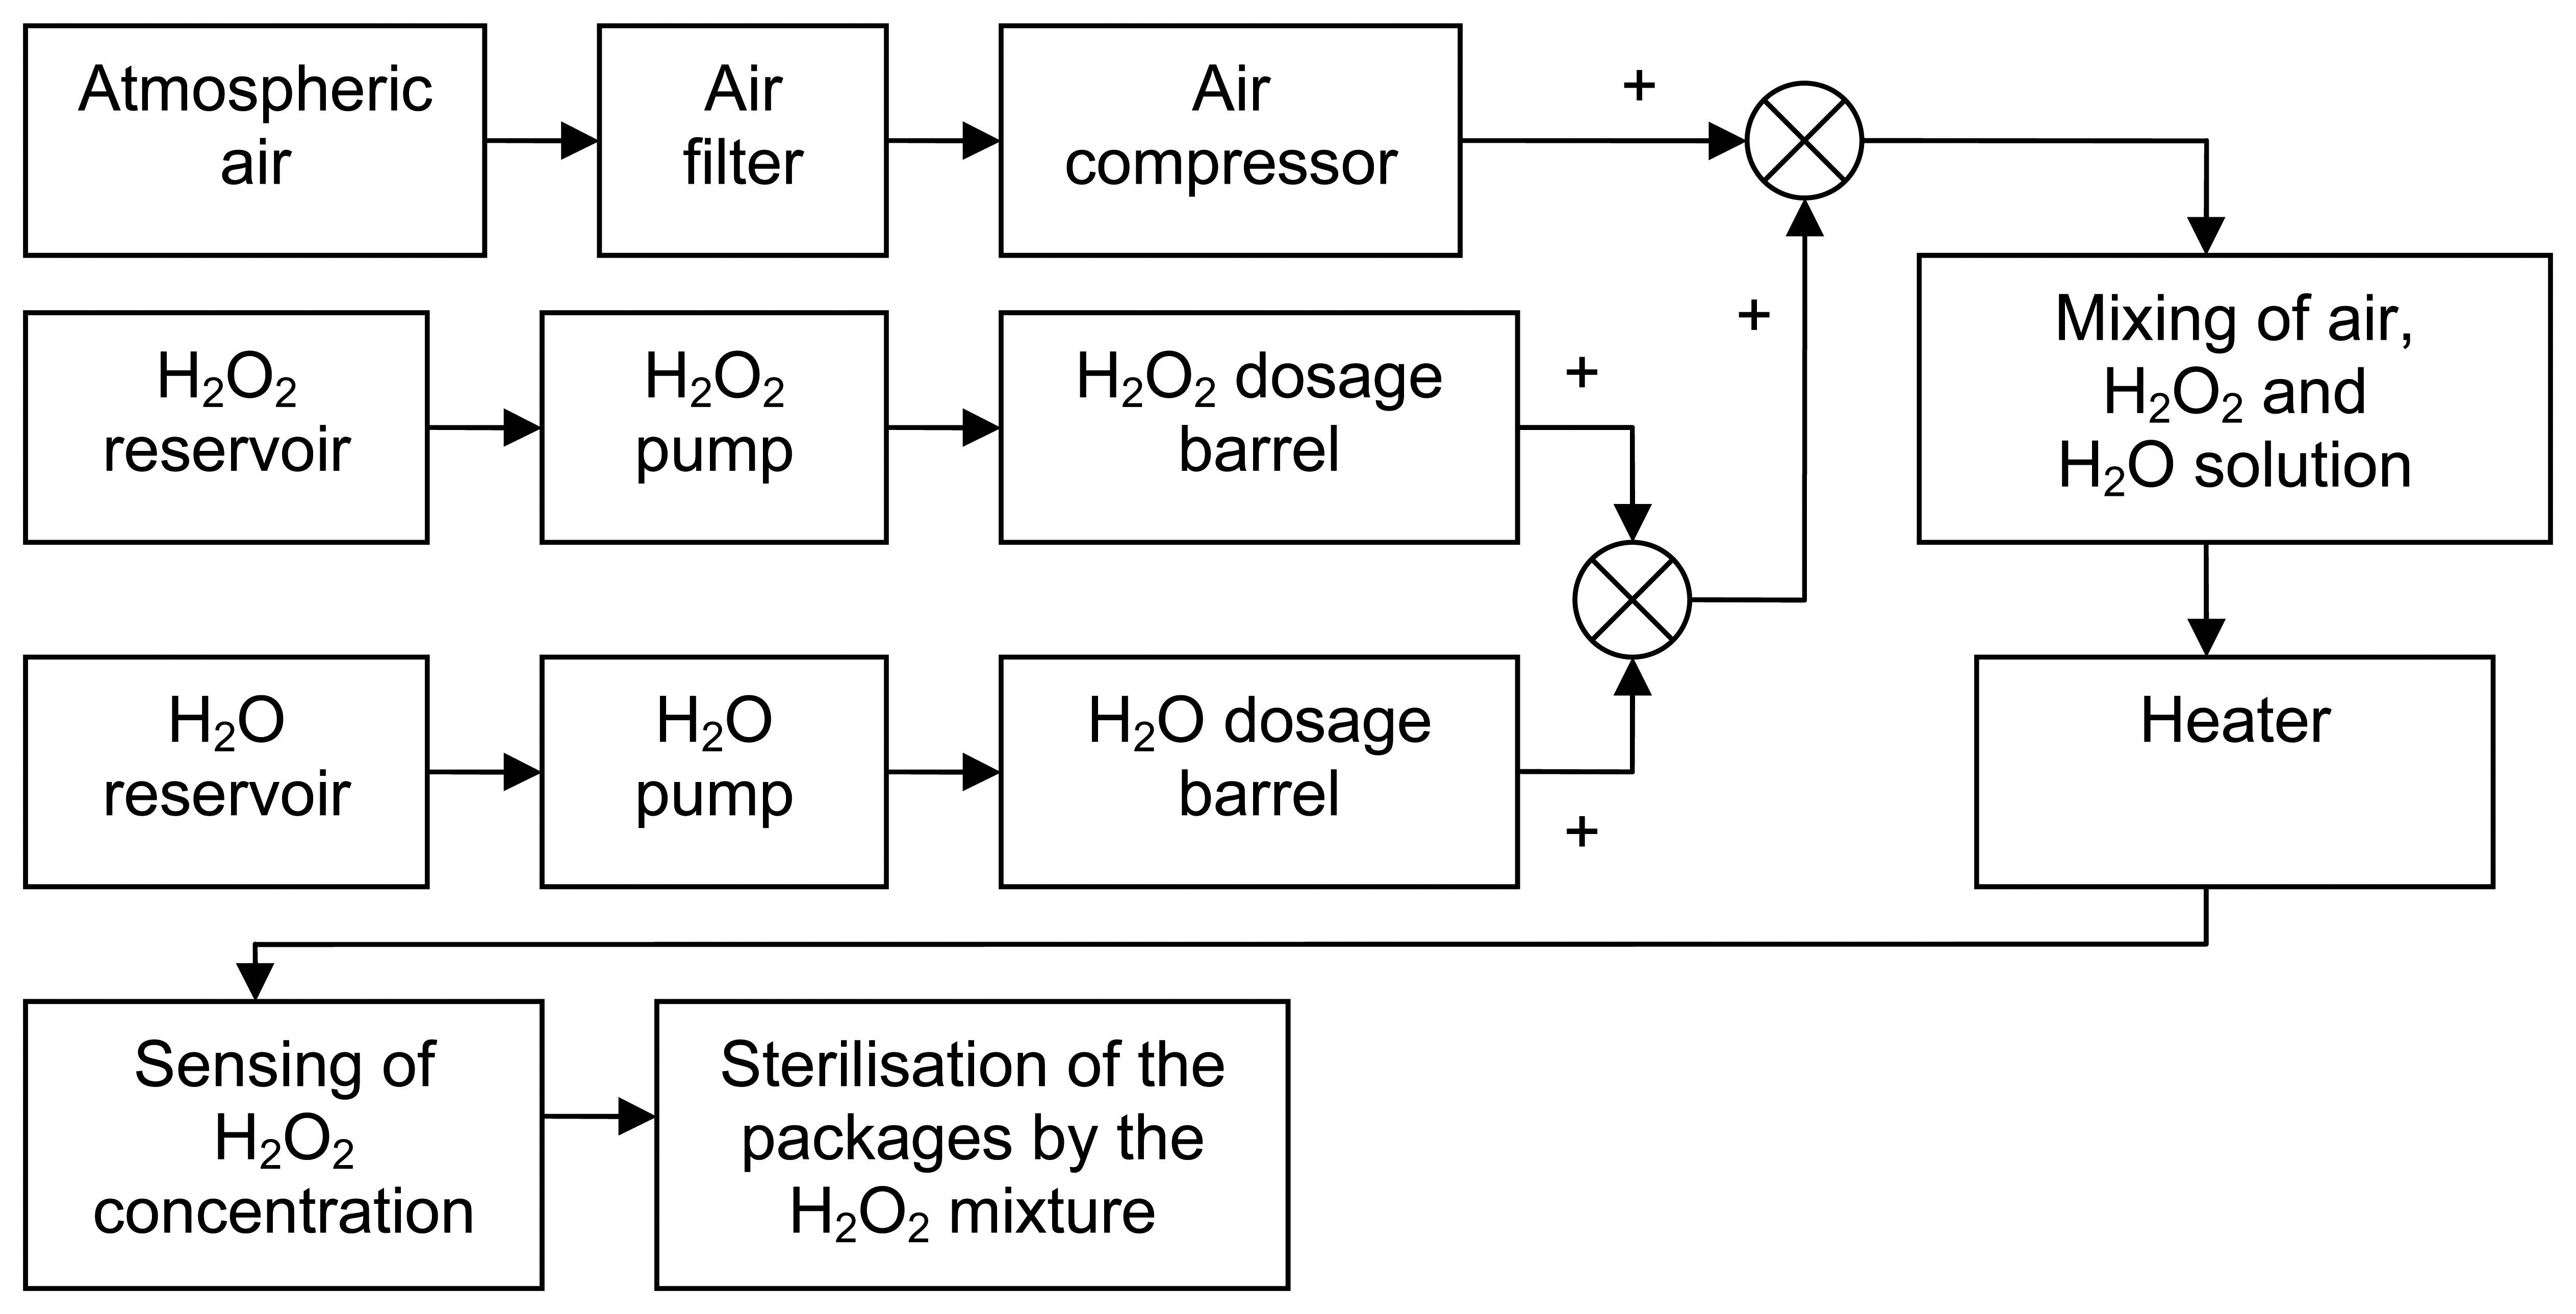
Sterilisation equipment
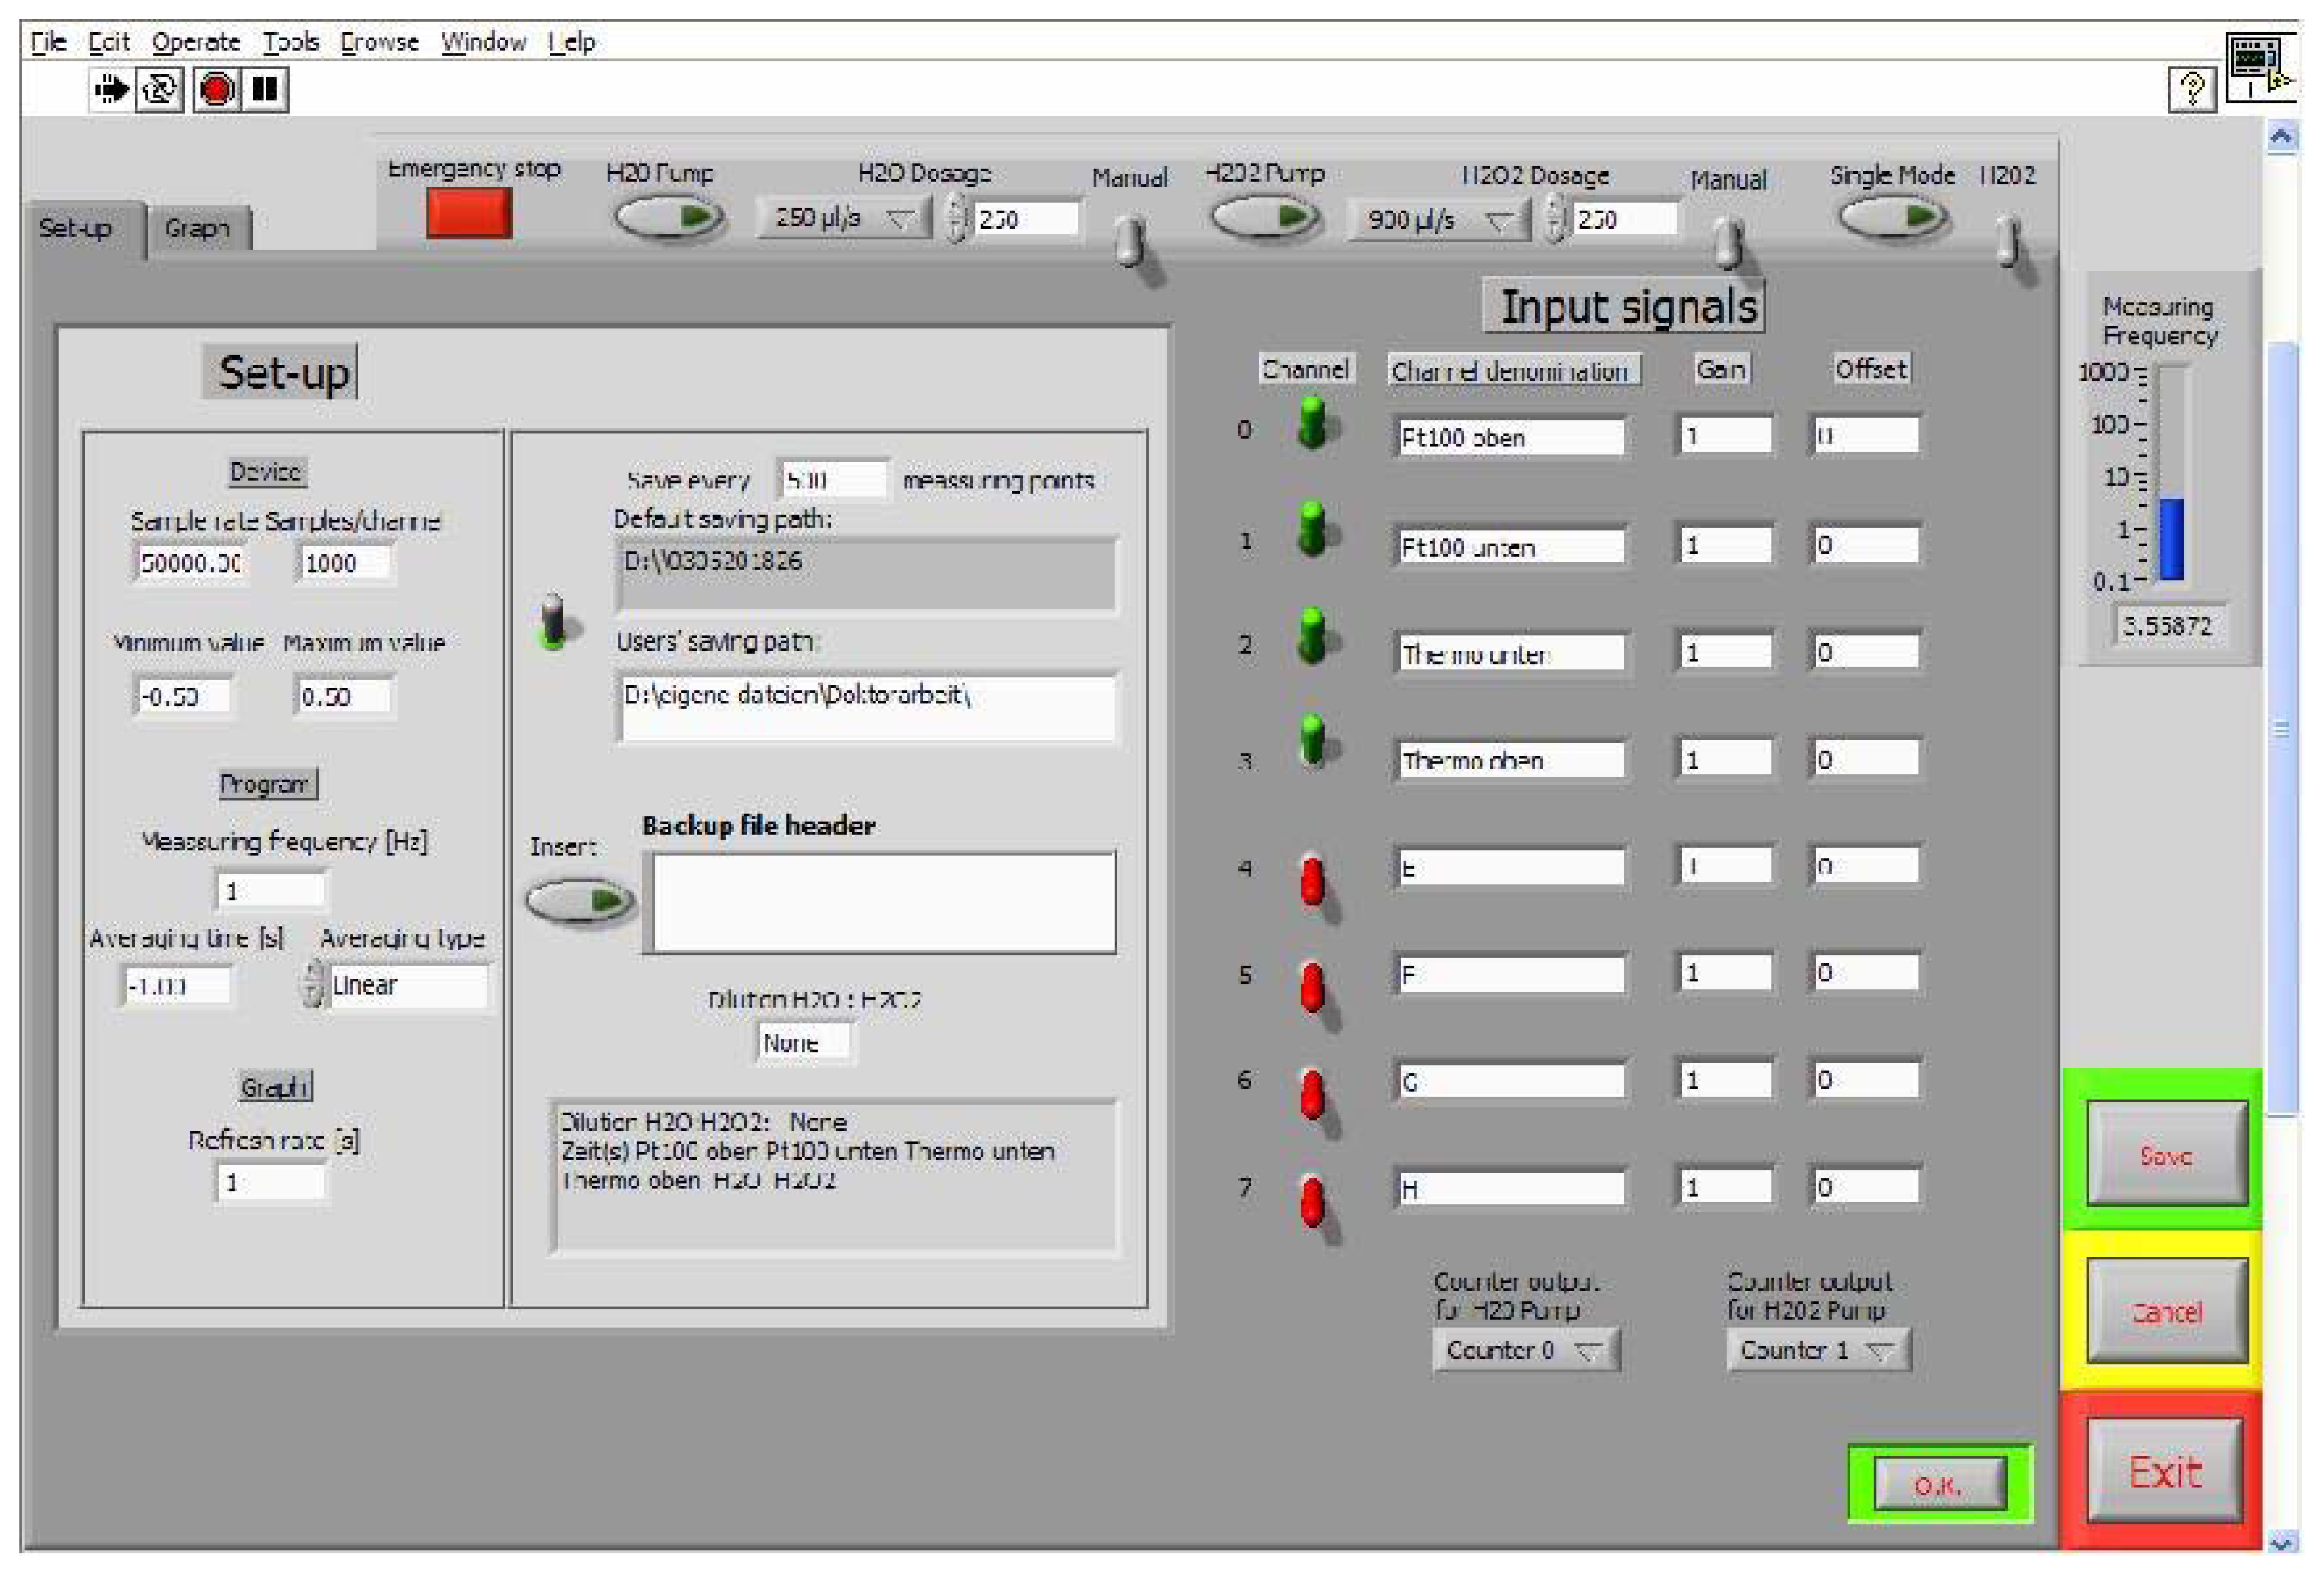
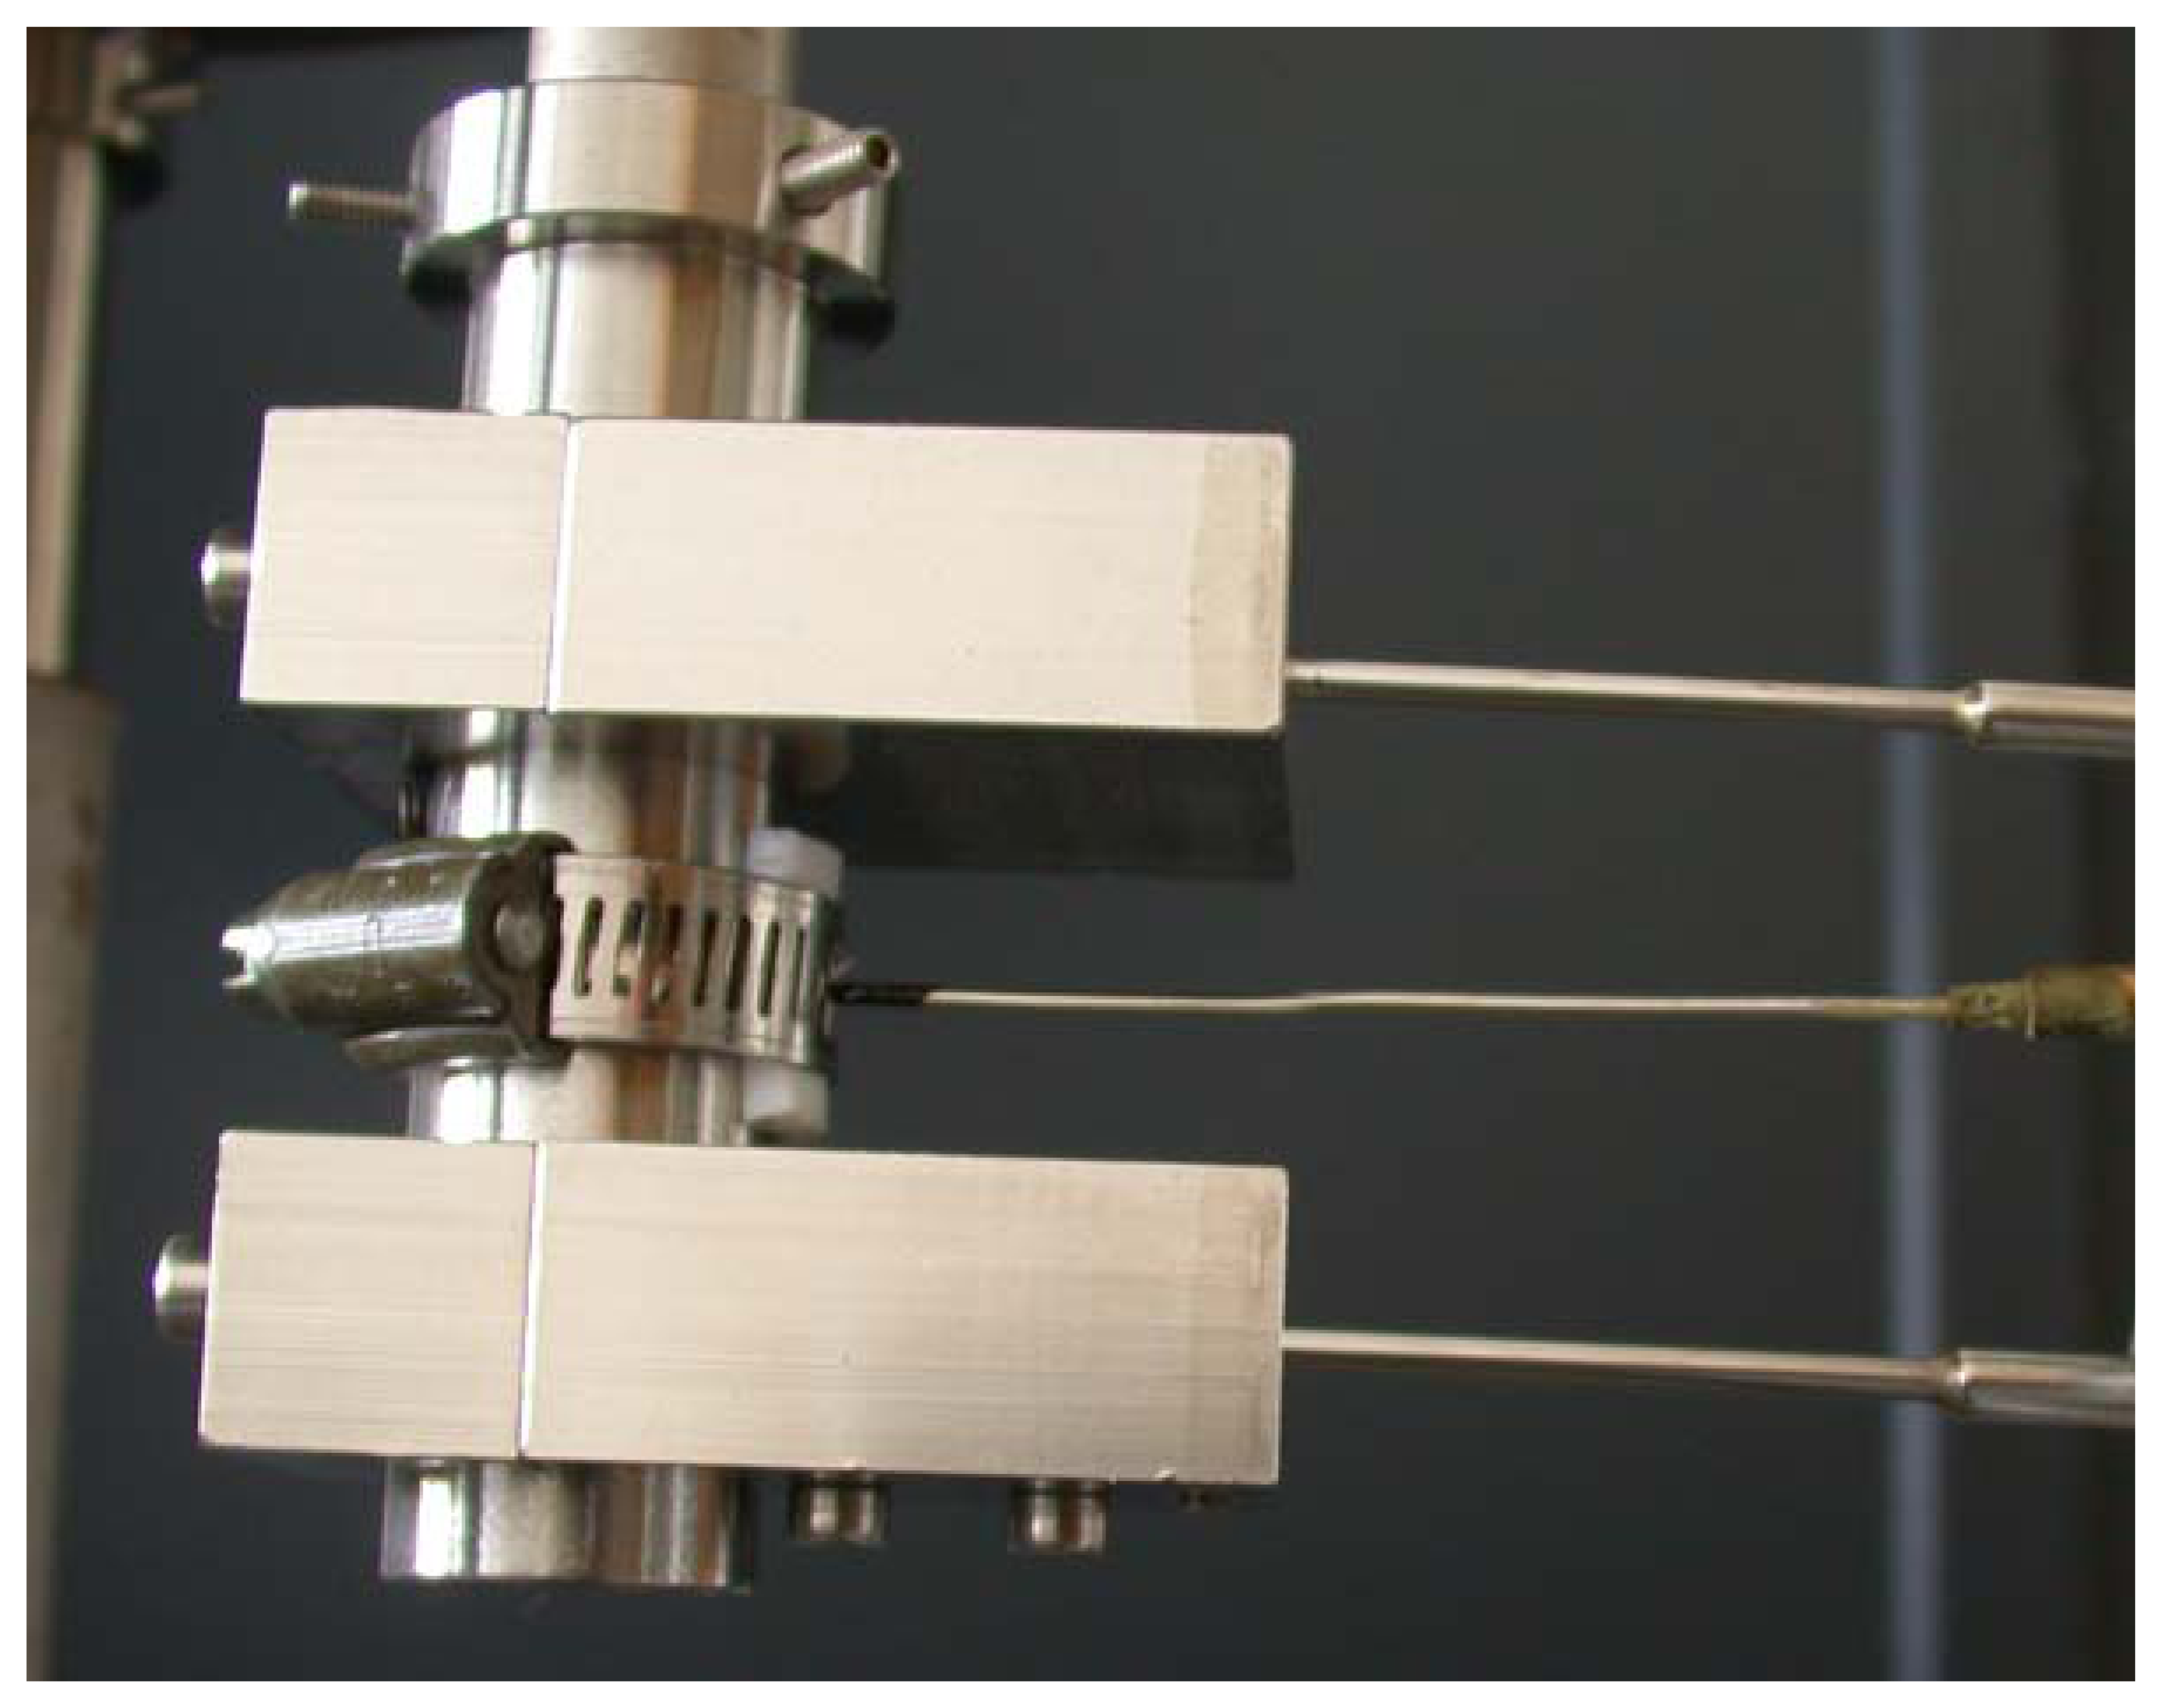
In order to perform sensor tests under conditions, like in industrial processes, the sterilisation equipment at laboratory scale has to be similar to those in industrial packaging facilities. In addition, equivalent parts for the simulation of failures in the sterilisation process have to be included. The block diagram of the sterilisation apparatus is shown in Fig. 1.
As sterilant, 35% H2O2 solution (stabilised) was used, which was feed through a dosage barrel into the carrier stream (air) and then, the aerosol was heated up to > 200 °C, so that the whole mixture was in the gaseous phase. This sterilisation gas was then feed in a distributor, where the gas was flowing through several sterilisation pipes under which the sterilisation good can be placed. In the case of testing the sensor, an additional exhaust was positioned under the sterilisation pipes. As already mentioned before, for the simulation of failures, different water concentrations can be additionally added, and the massflow and the temperature of the gas can be varied. To control the sterilisation equipment, a software tool has been developed that allows to operate up to eight analogue channels, where the data can be read out and the equipment can be adjusted to defined input values.
Fig. 2 shows a photograph of the user interface of the realised software tool. At the left side, the parameters of the DAQ (Data Acquisition) card can be changed and the data can be stored; moreover, the parameters of the spreadsheet file can be prompted. At the right side, the analogue input channels can be chosen and named, and the counter output for the dosage barrels can be chosen. In the upper part of the user interface, the dosage barrels can be switched on and off and the concentration of added H2O2 solution or water in μl/s can be adjusted by a list or by the user's input. To control the dosage barrels for the H2O2/H2O mixture, a frequency is feed through an optocoupler to the sterilisation apparatus. The frequency is proportional to the current H2O2/H2O content and therefore, to the concentration in the sterilisation pipe; the frequency is fixed by the 20 MHz onboard clock of the DAQ card.
The dosage barrels, the heater and the distributor were identical to those used in industrial packaging plants; they were made of stainless steel. To apply the sensors to the sterilisation pipes (where the H2O2 concentration is of interest), self-made adaptors have been constructed to fix different types of sensors into the pipes. Additionally, measuring cells, which can optionally work as diffusion cells, can be applied. With this set-up it is possible to vary the H2O2 concentrations from 0 Vol.% up to 20 Vol.% with different concentrations of water, and with varying temperatures and flow rates.

Sensor set-up

As sensor set-up, an array of temperature-sensitive PT100 thermistors or thermocouples has been chosen as transducer materials. Ideally, these stainless steel-covered temperature sensors possess no catalytic activity by themselves. Due to the contamination with dust particels or undesired corrosion, it is necessary to clean and passivate the steel; this has been done by rinsing them in liquid H2SO4 and then placing them in H2O2 solution. To realise a H2O2-sensitive temperature sensor, the thermistor and thermocouple are covered both with a catalytically active layer (with a defined activity) that has been fabricated by heating the transducer structure up to 400 °C and then, putting a droplet of HMnO4 on its surface. By placing the transducer structure for 2 hours at 450 °C in an oven, a layer of MnxOx+1 is grown. After the baking process, the resulting sensor has been washed in 35% H2O2 solution and then, been wiped with a tissue. With this cleaning process, redundant grains will be removed from the sensor surface. In Fig. 3, an array of temperature sensors is depicted. Here, the upper and the lower sensor are representing reference sensors that were placed in measuring cells. In the middle part, the H2O2-sensitive temperature-sensor device is fixed with a pipe clamp.

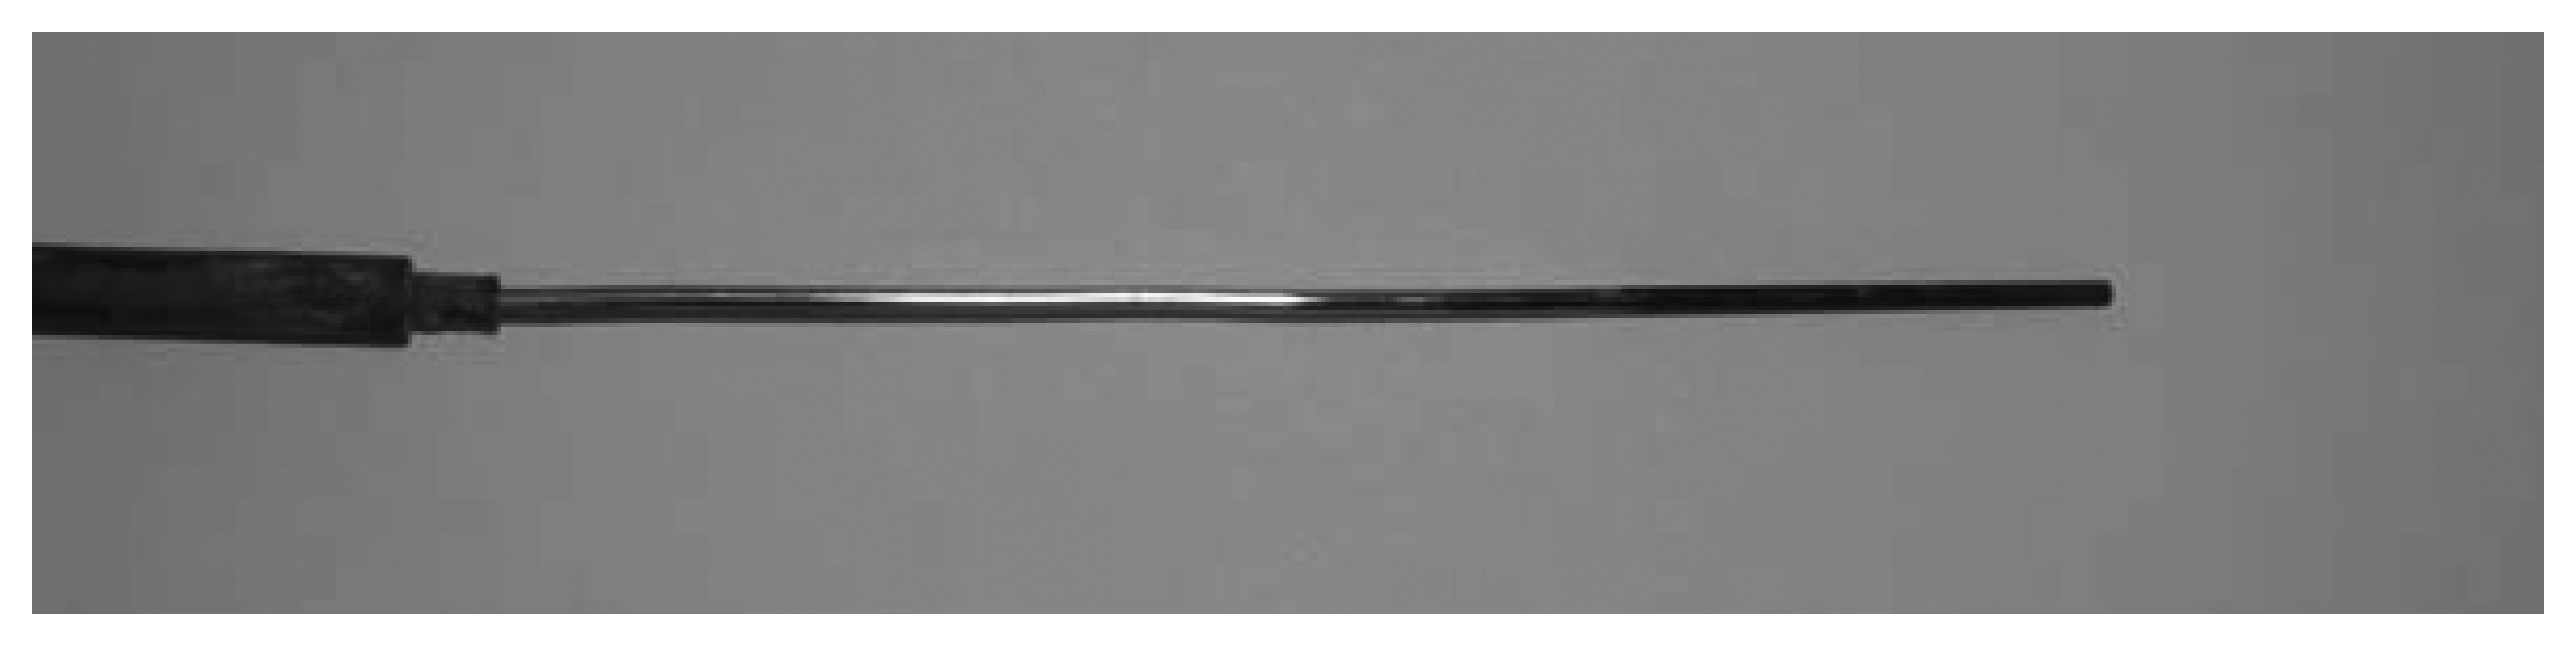
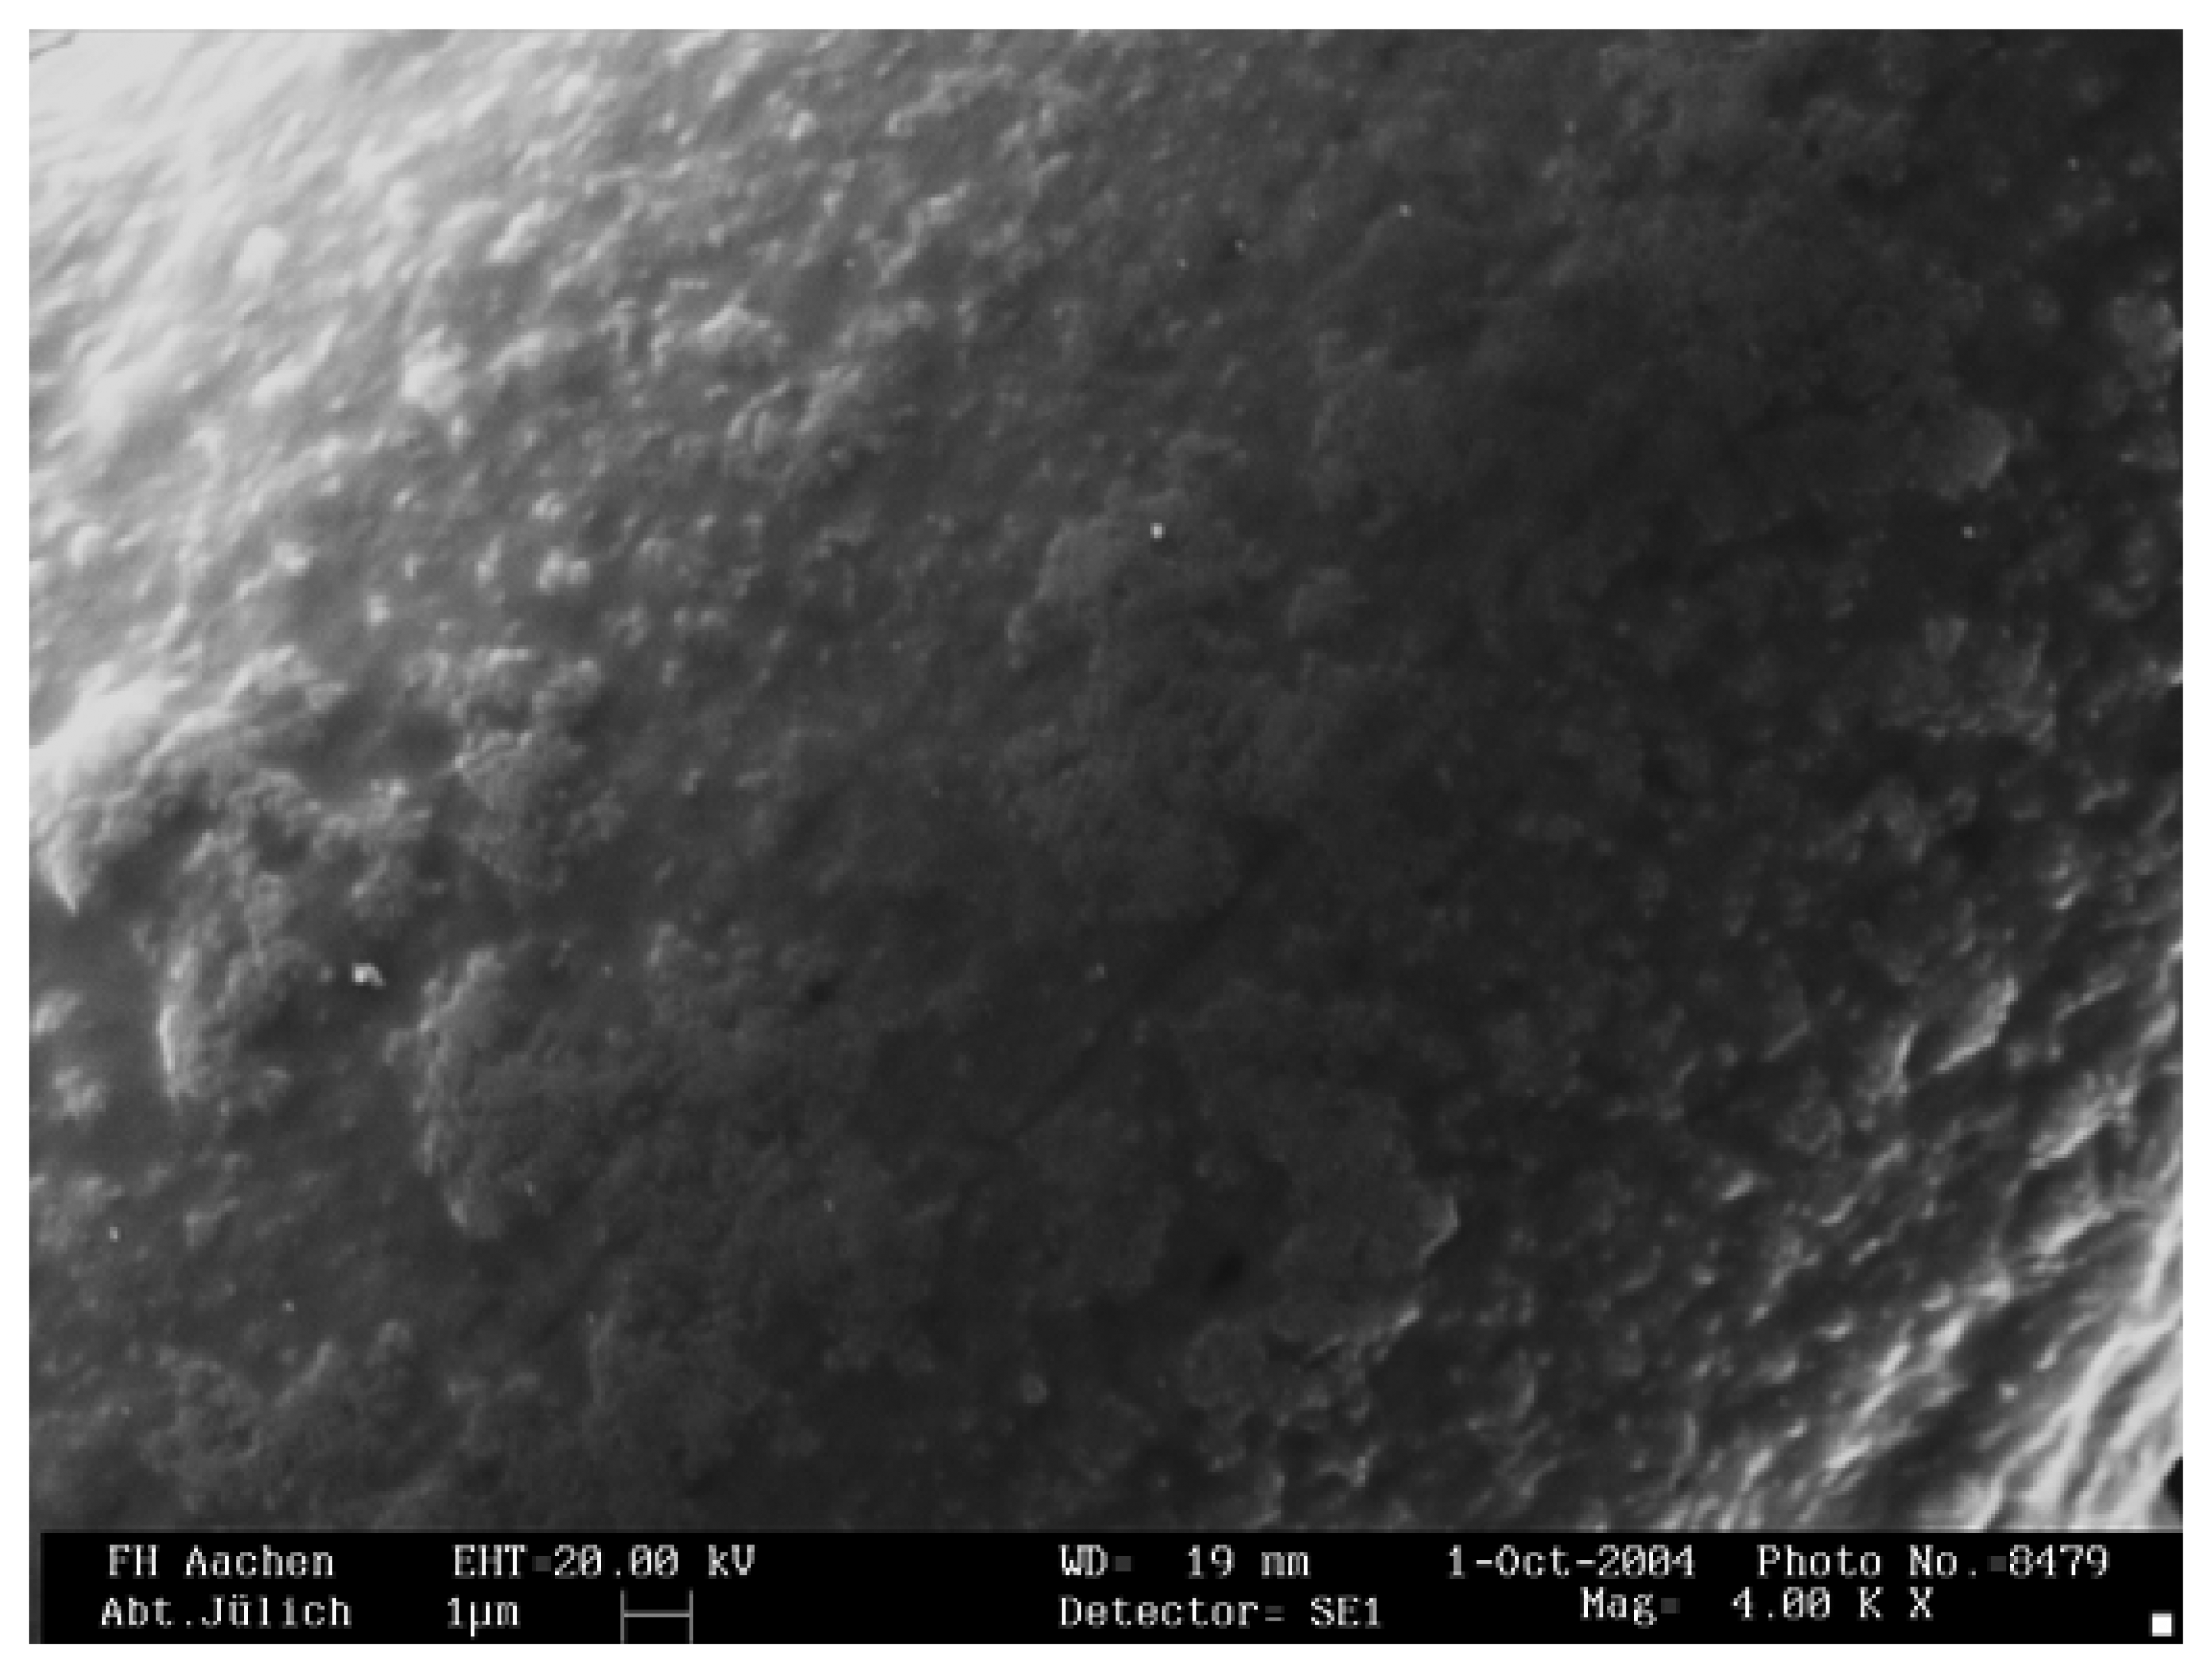
Fabricated H2O2 sensor

The H2O2-sensitive temperature sensor has been physically characterised by optical microscopy and by SEM (scanning electron microscopy). Fig. 4 exemplarily shows a photograph of an H2O2-sensitive thermocouple. The length of the steel-covered thermocouple is 120 mm and the catalytic layer covers about 1/3 of the sensor surface on the left side.
Fig. 5 presents a corresponding SEM image of the developed H2O2 sensor. It can be seen that the surface is grainy without any porosity. The SEM investigations could validate that the catalytically active layer has a thickness of about 0.4 μm and the composition is about 50% MnO2 and 50% Mn2O3 (analysed by EDX (energy dispersive X-ray) investigations). Such a composition yields a high catalytic activity, which is advantegeous in terms of the decomposition of the H2O2 on the surface during the redox-active process.

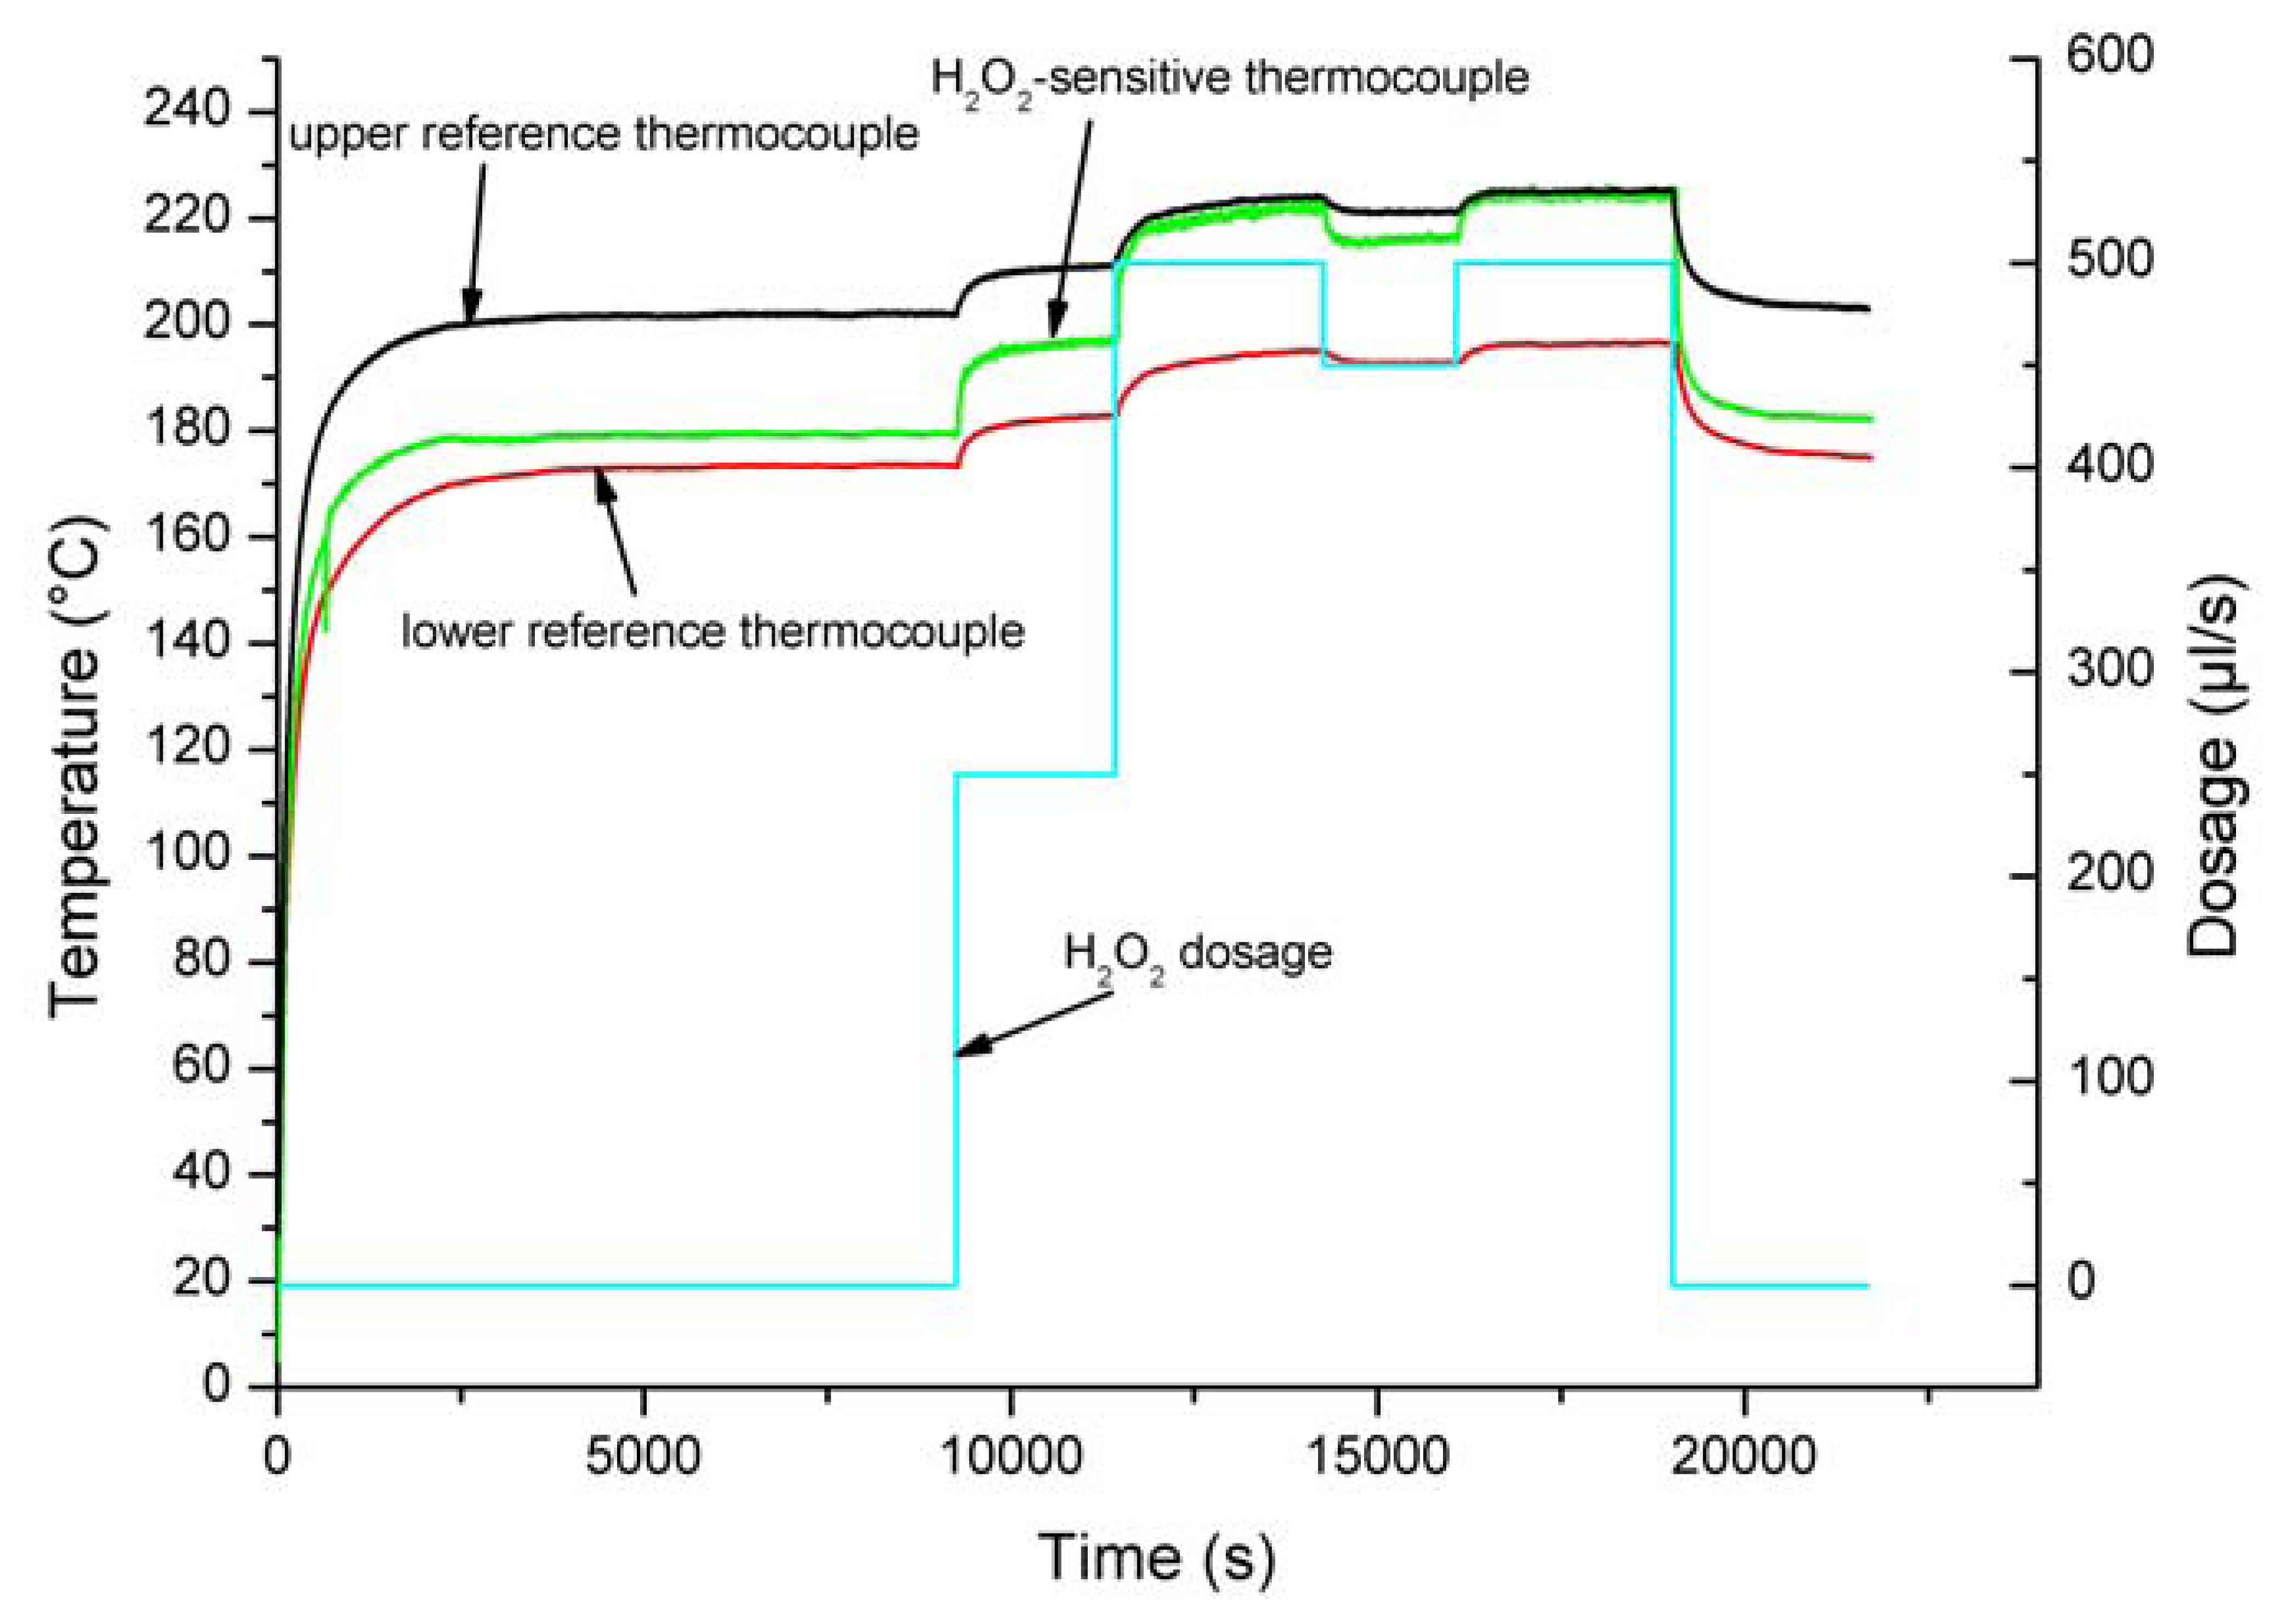
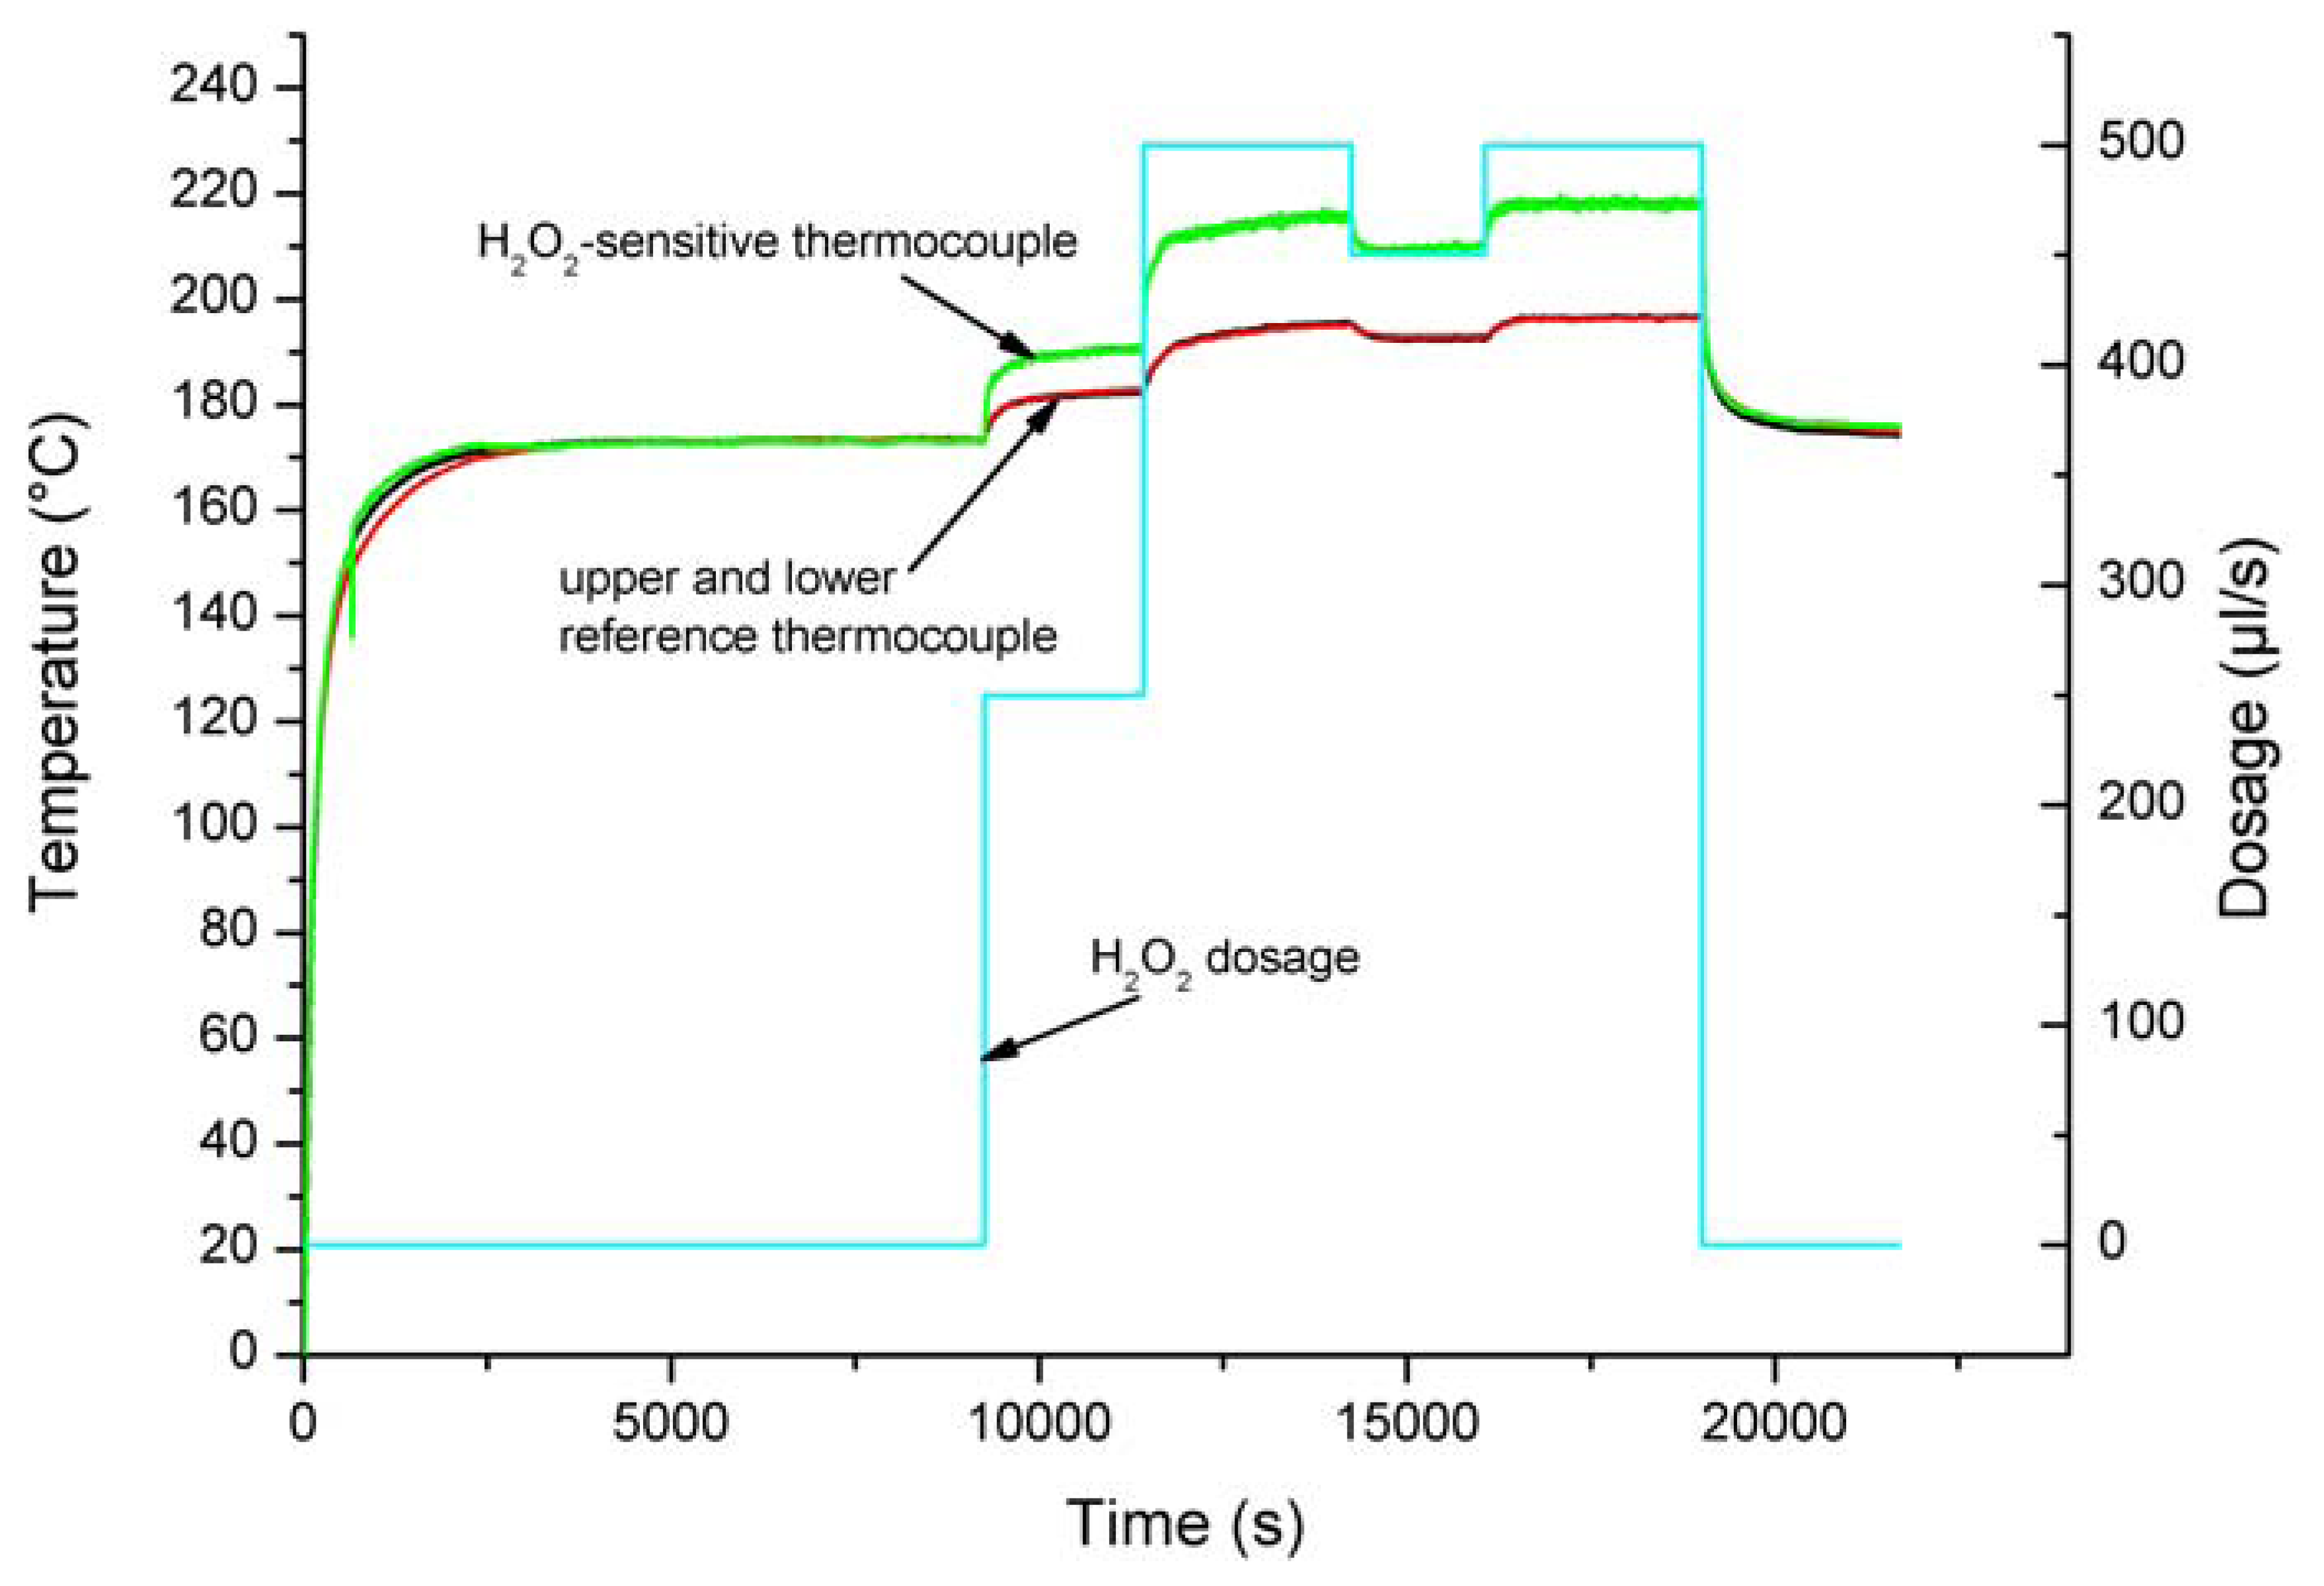
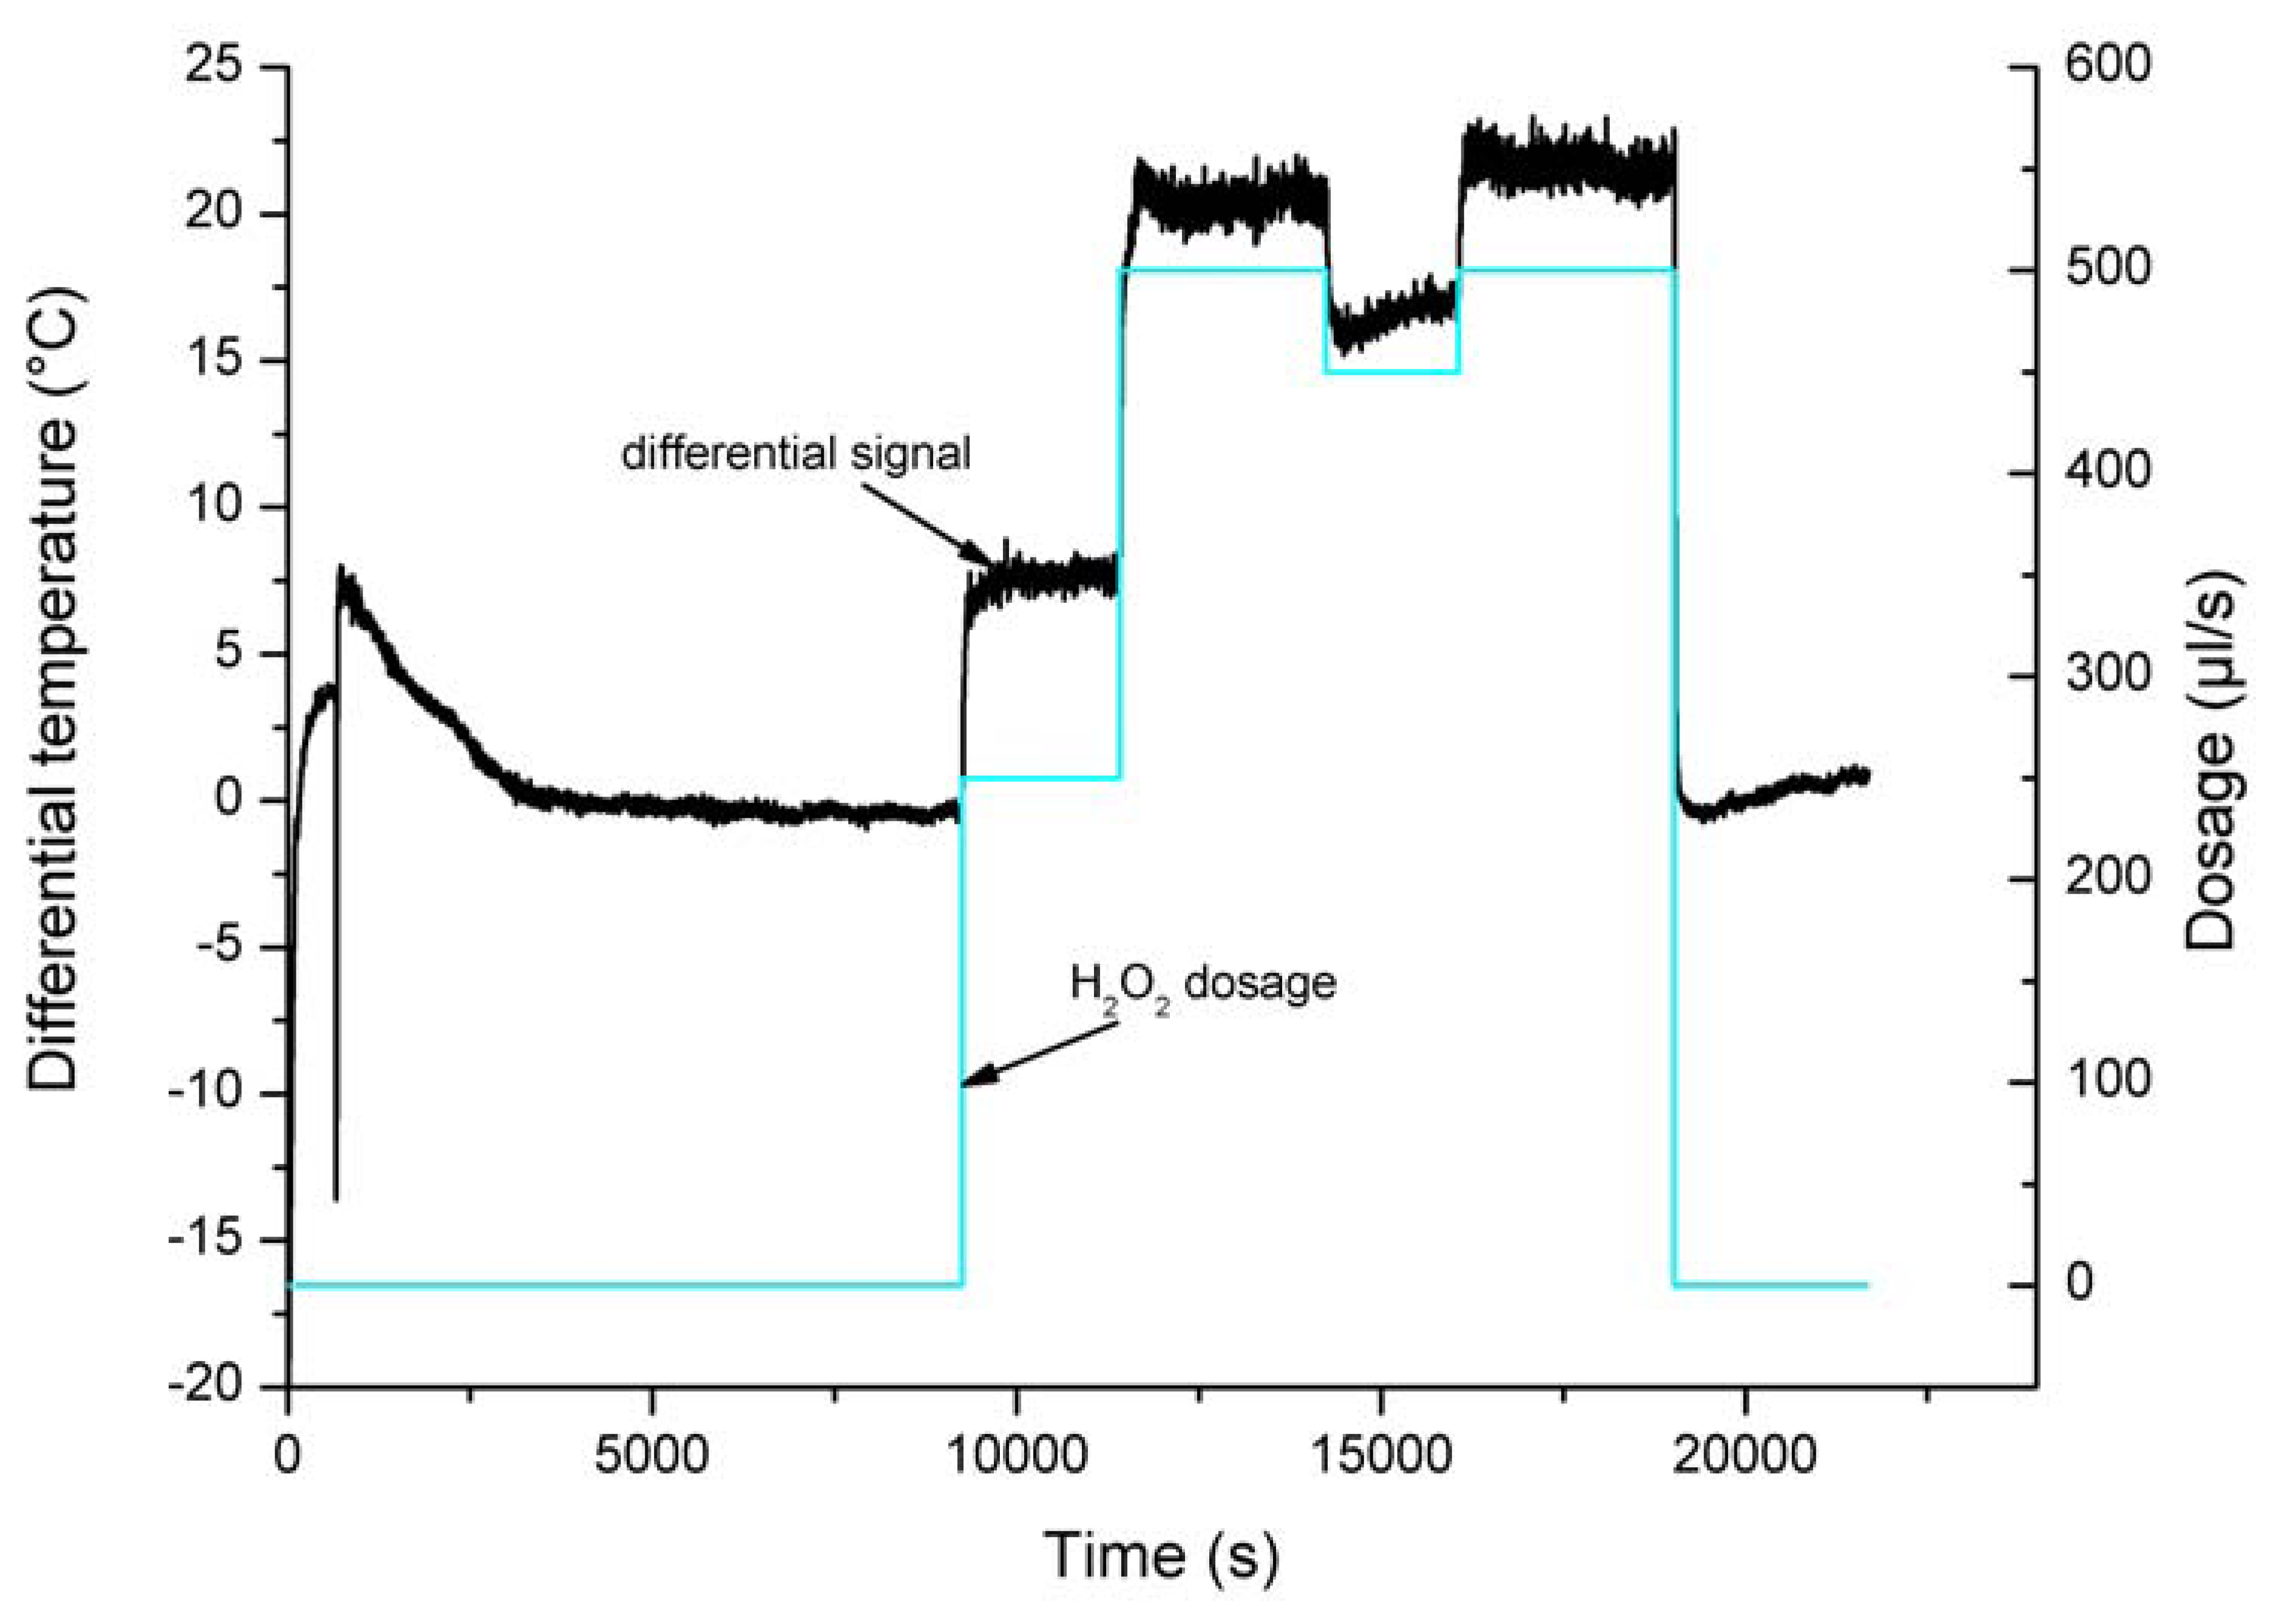
H2O2 measurement with the sensor array

Preliminary measurements have been realised with a differential set-up of two reference temperature sensors together with one H2O2-sensitive temperature sensor. The investigations have been performed in the developed automated sterilisation apparatus at laboratory scale. A constant air flow of 10 Nm3/h (standard cubic metre per hour) has been choosen with a gas temperature of about 270 °C and different dosages of H2O2 concentrations. In Fig. 6, a typical measurement cycle with the differential set-up is given: In the beginning of the measurement cycle (0-5000 s), there was just an air flow and the heater of the automated sterilisation equipment has been switched on. After 5000 s, the system seemed to be in equilibrium and the gas stream was heated to a temperature of 173.5 °C at the outlet of the sterilisation pipe. After 9250 s, a dosage of 250 μl/s H2O2 solution (∼2.5 Vol.%) has been feed to the constant air stream. The temperature signal of all three sensors has been immediately arised at this moment. This behaviour can be explained due to the thermal conductivity of H2O2 and water in the gas stream (in the case of the reference temperature sensors) as well as due to the additional decomposition of H2O2 in the case of the catalytically active H2O2 sensor. Further dosages of H2O2 have been added after 11417 s (500 μl/s H2O2), 14252 s (450 μl/s H2O2) and 16066 s (500 μl/s H2O2). After 19014 s, the dosage profile has been switched off. As can be seen from the diagram, an increase in the H2O2 concentration is accompanied by a raise in the sensor signal within the differential measurement set-up for both the reference sensors and the H2O2 sensor. The higher the H2O2 content, the higher the temperature change due to the (catalytically induced) heating effect.
In Fig. 7, the normalised temperature curves of Fig. 6 are presented. The normalisation has been carried out when the system is in equilibrium at the beginning of the measurement cycle, where no H2O2 is dosed. Equilibrium conditions have been achieved after a time period of 9000 s, where all temperature signals (reference sensors, H2O2 sensor) are shifted to a temperature of 173.5 °C. When the varying H2O2 content is dosed, the temperature step of the two reference sensors is nearly equal.
The temperature increase of both reference sensors from air to a dosage of 500 μl/s H2O2 solution is about 21.7 °C. In contrast, the increase of the H2O2-sensitive temperature sensor is about 42.4 °C, which can be explained due to the additional catalytic decomposition of H2O2 on the sensor surface.
In Fig. 8, the difference of the normalised H2O2-sensitive temperature-sensor signal (obtained from Fig. 7) and the reference signal has been evaluated. The diagram clearly demonstrates the response of the H2O2 sensor in the presence of H2O2 in the sterilisation process with regard to the reference sensor. Between a dosage of 0 and 500 μl/s H2O2, which is equal to a concentration of about 5 Vol.%, the resulting sensor signal increases for about 21.5 °C. There is a nearly linear dependence of the sensor signal with an average sensitivity of about 4 °C/Vol.% H2O2.

Summary and conclusions

An H2O2 sensor set-up at laboratory scale for industrial sterilisation processes has been developed, which fullfils the following requirements:
low-cost fabrication process of sensors,
temperature-resistant behaviour (< 300 °C),
stable sensor signals at H2O2 concentrations of up to 10 Vol.%,
no cross-sensitivity towards humidity, massflow, etc., and
low response time.
The H2O2 sensor, which basically consists of a steel-covered temperature sensor with an additional catalytic MnxOx+1 layer, has a sensitivity of about 4 °C/Vol.% H2O2. Due to the differential sensor set-up including additional reference sensors, the resulting sensor signal is not affected by changes in the heat conductivity of the gas stream. With respect to practical applications in industrial processes, the differential sensor set-up has been integrated to an automated sterilisation apparatus. The main parts of the laboratory scale equipment, like dosage barrels, heater, distributor and sterilisation pipe, are identical to those used in industrial sterilisation and packaging plants. The equipment is software-controlled, so that different concentrations of H2O2 can be adjusted. Further investigations will cover the long-term behaviour of the developed sensor set-up in harsh industrial environments as well as the characterisation of alternative temperature-sensitive transducer structures and material compositions.

Acknowledgments

The authors greatfully thank H. Dören and his team for the SEM images and the support for the analysis of the EDX investigations.

References

  1. Klapes, N.A.; Vesley, D. Vapor-phase hydrogen-peroxide as a surface decontaminant and sterilant. Applied and Enviro. Microbiology 1990, 56, 503. [Google Scholar]
  2. Webb, B.C. A validated calibration method for hydrogen peroxide vapour Sensors. Journal of Pharmaceutical Science & Technology 2001, 55, 49. [Google Scholar]
  3. Toniolo, R.; Geatti, P.; Bontempelli, G.; Schiavon, G. Amperometric monitoring of hydrogen peroxide in workplace atmospheres by electrodes supported on ion-exchange membranes. Journal of Electroanalytical Chemistry 2001, 514, 123. [Google Scholar]
  4. Engelhardt, P.; Hüner, J.; Kulozik, U. Shelf life extension of dairy products through the optimisation of the inactivation of microorganisms in foodstuff and on packaging material surfaces. Summary of research project 2004. AiF-FV 13202 N. [Google Scholar]
  5. Hall, S.B.; Khudaish, E.A.; Hart, A.L. Electrochemical oxidation of hydrogen peroxide at platinum electrodes. Part 1. An adsorption-controlled mechanism. Electrochim. Acta 1998, 43, 579. [Google Scholar]
  6. Hall, S.B.; Khudaish, E.A.; Hart, A.L. Electrochemical oxidation of hydrogen peroxide at platinum electrodes. Part II: effect of potential. Electrochim. Acta 1998, 43, 2015. [Google Scholar]
  7. Meyer, H.; Drewer, H.; Gründig, B.; Cammann, K. Two-dimensional imaging of O2, H2O2, and glucose distributions by an array of 400 individually addressable microelectrodes. Anal. Chem. 1995, 67, 1164. [Google Scholar]
  8. Schwake, A.; Ross, B.; Cammann, K. Chrono amperometric determination of hydrogen peroxide in swimming pool water using an ultramicroelectrode array. Sens. Actuators B 1998, 46, 242. [Google Scholar]
  9. Patent Application WO 99/53301.
  10. Janasek, D.; Vastarella, W.; Spohn, U.; Teuscher, N.; Heilmann, A. Ruthenium/rhodium modified gold electrodes for the amperometric detection of hydrogen peroxide at low potentials. Anal. Bioanal. Chem. 2002, 374, 1267. [Google Scholar]
  11. Eftekhari, A. Aluminum electrode modified with manganese hexacyanoferrate as a chemical sensor for hydrogen peroxide. Talanta 2001, 55, 395. [Google Scholar]
  12. Zheng, X.; Guo, Z. Potentiometric determination of hydrogen peroxide at MnO2-doped carbon paste electrode. Talanta 2000, 50, 1157. [Google Scholar]
  13. US Patent 5518591.
  14. Huang, H.; Dasgupta, P.K.; Genfa, Z. A pulse amperometric sensor for the measurement of atmospheric hydrogen peroxide. Anal. Chem. 1996, 68, 2062. [Google Scholar]
  15. Huang, H.; Dasgupta, P.K. Renewable liquid film-based electrochemical sensor for gaseous hydroperoxides. Talanta 1997, 44, 605. [Google Scholar]
  16. DE 19924856 A1.
  17. Holmstrom, S.D.; Cox, J.A. Solid-state voltammetric determination of gaseous hydrogen peroxide using nanostructured silica as the electrolyte. Electroanalysis 1998, 10, 597. [Google Scholar]
  18. Corveleyn, S.; Vandenbossche, G.M.R.; Remon, J.P. Near-infrared (NIR) monitoring of H2O2 vapor concentration during vapor hydrogen peroxide (VHP) sterilisation. Pharmaceutical Research 1997, 14, 294. [Google Scholar]
  19. Ostrovskaya, V.M.; Zolotov, Y.A.; Davydov, A.V. Test determination of hydrogen peroxide with reagent indicator strips. J. Anal. Chem. 1999, 54, 764. [Google Scholar]
  20. DE 19855120 A1.
  21. US Patent 5608156.
  22. Taizo, I.; Sinichi, A.; Kawamura, K. Application of a newly developed hydrogen peroxide vapor phase sensor to HPV sterilizer. J. Pharmaceutical Sci. Technol. 1998, 52, 13. [Google Scholar]
Figure 1. Block diagram and principle of the sterilisation apparatus.
Sensors 06 00308f1
Figure 2. User interface of the developed software.
Sensors 06 00308f2
Figure 3. Array of three temperature sensors in measuring cells which can optionally used as diffusion cell.
Sensors 06 00308f3
Figure 4. Photograph of the H2O2-sensitive temperature sensor.
Sensors 06 00308f4
Figure 5. SEM image of the sensor surface with a magnification of 4000.
Sensors 06 00308f5
Figure 6. H2O2 detection with the differential measurement set-up.
Sensors 06 00308f6
Figure 7. Normalised temperature signal of all sensors.
Sensors 06 00308f7
Figure 8. Difference signal of the normalised temperature of one reference sensor and the H2O2-sensitive temperature sensor.
Sensors 06 00308f8

