Review

Aspartate Aminotransferase (AST/GOT) and Alanine Aminotransferase (ALT/GPT) Detection Techniques

1
Department of Electrical Engineering and Computer Science, Korea Advanced Institute of Science and Technology, 373-1 Guseong-dong, Yuseong-gu, Daejeon, South Korea
2
Department of Biological Sciences, Korea Advanced Institute of Science and Technology, 373-1 Guseong-dong, Yuseong-gu, Daejeon, South Korea
*
Author to whom correspondence should be addressed.
Sensors 2006, 6(7), 756-782; https://doi.org/10.3390/s6070756
Submission received: 6 May 2006 / Accepted: 30 July 2006 / Published: 31 July 2006

Abstract

:
The levels of aspartate aminotransferase (AST/GOT) and alanine aminotransferase (ALT/GPT) in serum can help people diagnose body tissues especially the heart and the liver are injured or not. This article provides a comprehensive review of research activities that concentrate on AST/GOT and ALT/GPT detection techniques due to their clinical importance. The detection techniques include colorimetric, spectrophotometric, chemiluminescence, chromatography, fluorescence and UV absorbance, radiochemical, and electrochemical techniques. We devote the most attention on experimental principle. In some methods a few representative devices and important conclusions are presented.

1. Introduction

Aspartate aminotransferase (AST, EC 2.6.1.1) and alanine aminotransferase (ALT, EC 2.6.1.2) are enzymes found mainly in the liver, but also found in red blood cells, heart cells, muscle tissue and other organs, such as the pancreas and kidneys. AST and ALT formerly are called serum glutamic oxaloacetic transaminase (GOT) and serum glutamic pyruvic transaminase (GPT), respectively. AST or ALT levels are a valuable aid primarily in the diagnosis of liver disease. Although not specific for liver disease, it can be used in combination with other enzymes to monitor the course of various liver disorders. The normal concentrations in the blood are from 5 to 40 U l-1 for AST and from 5 to 35 U l-1 for ALT. However, when body tissue or an organ such as the liver or heart is diseased or damaged, additional AST and ALT are released into the bloodstream, causing levels of the enzyme to rise. Therefore, the amount of AST and ALT in the blood is directly related to the extent of the tissue damage. After severe damage, AST levels rise 10 to 20 times and greater than normal, whereas ALT can reach higher levels (up to 50 times greater than normal). On the other hand, the ratio of AST to ALT (AST/ALT) sometimes can help determine whether the liver or another organ has been damaged [1-6].
AST and ALT are also biological catalyst. Therefore, the assay of AST and ALT activity all based on the following enzyme reactions included original [Eqs.(1) and (2)] and succeeding [Eqs.(3)-(7)] reactions [7-9].
L aspartate + α ketoglutarate GOT oxalacetate + L glutamate
L alanine + α ketoglutarate GPT pyruvate + L glutamate
oxalacetate OAC pyruvate + C O 2
pyruvate + O 2 + phosphate POP acetylphosphate + C O 2 + H 2 O 2
L glutamate + O 2 GLOX α oxogluatrate + N H 3 + H 2 O 2
oxalacetate + NADH + H + p H 7.8 malate + N A D +
pyruvate + NADH + H + p H 7.4 L lactate + N A D +
Where GlOX is glutamate oxidase, POP is pyruvate oxidase, and OAC is oxalacetate decarboxylase.
Due to the clinical importance of AST/GOT and ALT/GPT in monitoring patients with liver diseases, AST/GOT and ALT/GPT detection have been researched by a number of scientists all over the world as well as International Federation of Clinical Chemistry (IFCC) and The Scandinavian Committee on Enzymes (SCE) [10-20]. In this work, we review the typical AST/GOT and ALT/GPT detection technologies (we call them GOT and GPT in the following description). For the most part we will focus on experimental principle and some important conclusions for which significant details on the discussion of the paper are available in journal publications.

2. Colorimetric Analysis

The principle of colorimetric analysis is based on the interaction between an enzyme and substrate to form and estimate colorimetrically a colored, light-absorbing complex by adding other reagent after stopping the enzyme reaction. Meanwhile, calibration curves must be made using measurand. By comparison and calculation, the generation amount of product or consumption amount of substrate can be reached. It can also be called end-point method, two-point method, sampling method, or fixed-time method. In most references, colorimetric analysis was known as fixed-time method.
Babson et al. [21] presented a colorimetric assay of serum GOT activity using a stabilized diazonium salt that reacts specifically with oxalacetic acid to yield a red colored compound. The authors suggested that the color reaction was more specific and sensitive for the reaction product, and the reagent blank was minimized. Matsuzawa and Katunuma [22] developed a rapid and accurate method for the determination of GPT and lactic dehydrogenase in serum and tissue using the diazonium salt and the coupling enzymes. They studied and discussed several factors affecting the coupling reactions in detail, and suggested that it was possible to measure the ranges of 0-150 mU in GPT assay and 0-1500 mU in lactic dehydrogenase assay by the present methods. It took about 5 min at 37 °C in a final volume of 2 ml to detect the mixtures. Lippi and Guidi [23] reported a colorimetric ultramicromethod for serum GOT and GPT determination. This method was based on the use of glutamate dehydrogenase for the enzymatic estimation of the glutamate formed. The dehydrogenation of the glutamate gave rise to the reduction of a diazonium salt, and it was possible to perform a photometric reading of the colored compound at 520 nm. Their experimental results showed that 20 μl serum and only 45 min incubation time at the temperature of 37 °C were necessary. The normal values never exceeded 54.5 U for the serum GOT and 52 U for GPT. Under conditions of viral hepatitis values of 390 U for GPT and 310 U for serum GOT were obtained. Bailey et al. [24] determined whether the ingestion of isoniazid interfered with the colorimetric reaction used in most autoanalyzers to measure serum GOT. Colormetric (autoanalytic) and noncolormetric (enzymatic) measurements of GOT were made on a venous blood sample from each of 100 hospital employees who were taking isoniazid to prevent tuberculosis. It was concluded that autoanalytic (colormetric) measurements of GOT in isoniazid recipients are reliable. A general colorimetric procedure for measuring GOT and GPT which were linked to the NADH/NAD+ system was described by Whitaker [25]. Two color reactions for determining the reduced coenzyme NADH were discussed. A colored formazan was produced by the reduction of the tetrazolium salt INT with NADH, electron transfer being facilitated by PMS; the formazan was stable and the extinction was read at 500 nm. The colored ferrous dipyridyl complex was produced following the reduction of a ferric salt with NADH in the presence of PMS; the colored complex was stable for 30 min, the extinction was read at 520 nm. An important extension on colorimetric method was reported by Oki et al.[26], who suggested a biochip which can analyze hepatic function quickly from the bedside or at home. The chip essentially consisted of two chips, one was used for mixing the substrate buffer solution with serums using a centrifugal method and the other was used for measuring the amounts of γ-glutamyltranspeptidase (γ-GTP), GOT and GPT in the serums employing a colorimetric method. The mixing and measurement channels were fabricated by molding their reverse patterns onto a poly (ethylene terephthalate) plate. The inner wall of the measurement channel was performed by a hydrophobic treatment to efficiently propagate the light efficiently. Calibration curves were obtained based on an end-point method for γ-GTP and a rate assay for GOT and GPT. Figure 1 shows a cross-sectional view of the measurement chip equipped with peripheral components and the actual mixing process. The mixing chip pattern was suggested by taking account of the concept that multiple-chambers with several branch channels were formed to ensure efficient contact of the solution with the inner walls of the mixing chambers, thus enhancing the mixing on the wall surfaces. The mixing of the stored solution in the chambers was carried out by means of a stirring process in one chamber group based on the chip rotation and the solution was transferred from one chamber group to another in which the same process was carried out. This series process was then repeated.

3. Spectrophotometric Measurement

Colorimetric analysis had been replaced by spectrophotometric analysis gradually from 1950s due to its limitations such as making calibration curve and stopping enzyme reaction. Meanwhile, spectrophotometric measurement has its obvious advantages such as continuous test and wide measurement range (visible light, UV, IR).
Karmen et al. [27] presented the spectrometric assay of GOT in human blood serum in 1955. Giusti et al. [28] presented a comparative study of some spectrophotometric and colorimetric procedures for the determination of serum GOT and GPT in hepatic diseases. Itoh and Srere [29] described a spectroscopic method for continuously measuring GOT activity. Oxaloacetate produced by GOT from aspartate [Eq.(2)] was condensed with acetyl CoA to form citrate and CoA in a system coupled with citrate synthase. The CoASH (reduced coenzyme A) formed was measured by its reaction with DTNB (5,5′-dithio-bis (2-nitrobenzoic acid)). The chromophore formed had a high molar extinction coefficient and absorbs at 412 nm. Rodgerson and Osberg [30] presented a rapid measurement of GOT and GPT activities in serum by double-beam spectrophotometry in a short-interval enzyme-activity analyzer. To better demonstrate the method described in the paper, they compared the previous method used was that of Amador and Wacker [31] for GOT, that of Henry et al. [32] for GPT. Reaction rates were measured on a Gilford Model 2000 system, a Beckman System T.R. enzyme activity analyzer and compared with a Beckman DSA 560 modified for enzyme analysis as previously described [33]. The Beckman System T.R. is an automated enzyme activity analyzer, the reaction being initiated by the addition of serum to the complete reagent mixture. The instrument is essentially a double beam spectrophotometer with limited wavelength capability. In one mode of operation, referred to here as single-beam, the change in absorbance in the test cuvette is referenced against water. In a second mode the instrument may be operated as a true double beam- two cuvettes, test and reference, may be filled with reagents independently; serum is then added to each cuvette simultaneously by means of a double sample probe. The time required to assess reaction rates may be within 3 min as compared to conventional methodology.
Hamada and Ohkura [34] demonstrated photometric method for the determination of serum GPT activity using pyruvate and glutamate as substrates. Yagi et al. [35] presented an enzymatic assay for GOT. They determined the α-oxoglutarate formed in transamination between l-glutamate and oxalacetate in a system coupled with hydroxyglutarate dehydrogenase and NADH by following a decrease in absorbance at 340 nm. The method allowed accurate determination of the initial velocity of the reaction, which was proportional to the enzyme concentration. The method was applicable to the determination of the enzyme activity in various materials including rat serum and bacterial crude extract. Phillip and Graham [36] monitored spectrophotometrically GOT activity by measuring the oxidation of NADH at 340nm because the GOT reaction [Eq.(1)] can be coupled to a succeeding reaction catalyzed by malate dehydrogenase [Eq.(6)].
Photometric detector based multidetection has been presented by Fernández-Romero et al. [37], whose device for determination of GOT was in an open-closed flow injection system. Figure 2 shows the open-closed configuration for GPT determination. The closed circuit allowed one to perform fixed-time and reaction rate measurements whose sensitivity can be increased by using the sum of the analytical signals. The determination range was between 1 and 500 U l-1 of GPT, sampling frequencies were up to 60 h-1. Their application to serum samples provided excellent results, with recoveries between 95 and 106% and averaging at 99.9%. Valero and Garcia-Carmona [38] presented a continuous spectrophotometric assay for good determining over a range of 0.05 to 2 nmol of l-glutamate. The assay, which involved the enzymes l-glutamate oxidase and GPT, was based on the recycling of l-glutamate into α-ketoglutarate, with the concomitant appearance of one molecule of hydrogen peroxide in each turn of the cycle. Similarly, we can also detect GOT or GPT using this method based on enzyme reaction.
Mayer et al. [39] presented constant time point resolved spectroscopy for l-glutamate detection via the C4 resonance of l-glutamate. By simulating the sequence using the full density matrix it was found that 121 chemical shift encoding steps in t1 with an increment Δt1 = 1.6 ms were sufficient to separate the glutamate C4 resonance. The simulations also showed that the highest signal-to-noise ratio was achieved at an average echo time of 131 ms. When using an eightfold undersampling scheme in f1 in order to reduce the minimum total measurement time, the average echo time was 139 ms with 17 encoding steps (Δt1 = 12.8 ms).
In these methods, however, extra instrumentation like spectrophotometer, 3-T Signa MR scanner, and so on are required and thus not suitable for point-of-care applications or home-use test systems [40]. Furthermore, they do not give reliable results when serum are icteric or lipemic, or contain products of hemolysis which are common in clinical samples [41].

4. Chemiluminescence

The chemiluminescence detection was chosen for GOT and GPT detection because of its high sensitivity, low background signal level and the wide range of measurable concentrations covering up to five decades of magnitude. However, there exists some inhibitors of chemiluminescence such as superoxide dismutase or N-nitro-L-arginine methyl ester hydrochloride, the reducing or eliminating must be considered before detection [42]. The general measuring principle was given below, according to the enzyme reaction sequence, l-alanine is converted to pyruvate generating l-glutamate [Eq. (2)]. l-glutamate is then catalysed by glutamate oxidase producing H2O2 [Eq.(5)] which can oxidize luminol generating chemiluminescence [Eq. (8)].
2 H 2 O 2 + luminol + 2 O H 4 H 2 O + N 2 + 3 aminophthalate + h υ
Janasek and Spohn [43] developed chemiluminometric flow injection analysis (FIA) procedures for the enzymatic determination of l-alanine, α-ketoglutarate and l-glutamate in the cultivation medium of mammalian cells. Both L-aspartate and l-glutamate can be determined selectively by the proposed chemiluminometric FIA procedure in the range between 5 μM and 1 mM. After replacing α-ketoglutarate by L-aspartate in the carrier solution, α-ketoglutarate can also be detected chemiluminometrically in the range between 20 and 500 μM. A packed bed flow microreactor containing GPT and glutamate oxidase immobilized on sieved porous glass beads was combined with a chemiluminescence detector for the generated hydrogen peroxide. Reaction 8 was catalyzed either by Co(II) ions or fungal peroxidase, which was immobilized in the detector flow cell. The FIA procedure was applied to determine l-alanine and α-ketoglutarate in cell cultivation media.
Marquette et al. [44] designed a multifunctional bio-sensing chip based on the electrochemiluminescent (ECL) detection of enzymatically produced hydrogen peroxide. Six different oxidases specific for choline, glucose, glutamate, lactate, lysine and urate were noncovalently immobilised on imidodiacetic acid chelating beads (glucose oxidase only) or on diethylaminoethyl (DEAE) anion exchanger beads, and spotted on the surface of a glassy carbon foil (25 mm2 square), entrapped in PVA-SbQ photopolymer (shown in Figure 3). The chip measurement was achieved by applying during 3 min a +850 mV potential between the glassy carbon electrode and a platinum pseudo-reference, while capturing a numeric image of the multifunctional bio-sensing chip with a CCD camera. The use of luminal supporting beads (DEAE-Sepharose) included in the sensing layer was shown to enable the achievement of spatially well defined signals, and to solve the hydrogen peroxide parasite signal which appeared between contiguous spots using luminol free in solution. The detection limits of the different biosensor were found to be 1 μM for glutamate, lysine and uric acid, 20 μM for glucose and 2 μM for choline and lactate. The detection ranges were 1-25 μM (uric acid), 1 μM-0.5 mM (glutamate and lysine), 20 μM-2 mM (glucose) and 2 μM-0.2 mM (choline and lactate).

5. Chromatography

First of all, it is worth while to point out that the chromatographic separation of the reaction mixture was more complex because of the presence of compounds with very similar chromatographic behavior with hydrophobicity and charge very different from each other. So it is very important to optimize the chromatographic conditions for the determination of both enzymes in a single serum sample [45]. Canepari and co-workers [45] presented a sensitive and reproducible assay of GOT activity by using high performance liquid chromatography (HPLC) based on UV detector. The main advantage was the direct measurement of the enzyme activity as micromoles of product (glutamate) formed [Eq.(1)] within a known period of time without any coupled reaction. Further, with the chromatographic method, all components of the reaction mixture were identified, allowing the reaction course to be controlled and the possible presence of side-reactions to be monitored. Carunchio et al. [46] then developed the method for a simultaneous assay for GOT and guanase activities in a single serum sample using HPLC. The method was based on direct detection of enzymatically formed products xanthine and glutamate [Eq.(1)], respectively. The method was sensitive enough to measure GOT and guanase activity simultaneously and accurately as low as 0.1 and 5 U l-1, respectively. Moreover, only 0.1 ml of serum was required in the present method for both analyses. The GOT activity values are demonstrated by the regression equation y = 0.79x+5.29, the correlation (r2) is 0.986. A gas-liquid chromatograph for GOT and GPT analysis by using determination of α-keto acids was presented by Ohmori et al. [47], whose device equipped with an electron capture detector. The authors examined the relation of GOT and GPT concentration to the reaction rate under the present method, it showed that a linear relationship was observed up to 2.4×10⁻² U of GOT or 1.66×10⁻² U of GPT. Meanwhile, sixteen serum samples were assayed for GOT and GPT by the gas-liquid chromatograph method and the calorimetric method. It indicated that the present method gave good correlation coefficients (r) of 0.977 or 0.988 and regression lines of y = 0.00663x + 0.0624 or y = 0.00935x + 0.0339 for GOT or GPT, respectively.

6. Fluorescence and UV Absorbance

Although fluorescence analysis has high sensitivity, it is necessary to point out that it can be affected by a large number of environmental factors including such parameters as pH, ionic strength, noncovalent interactions, light intensity, temperature and so on. Strict reagent, vessel and equipment conditions are also expected. If not, nonspecific fluorescence or fluorescence quenching may disturb the results. So it was usually used in research laboratory rather than routine laboratory [48, 49]. In a certain concentration range, when keeping the exciting light intensity, wave length, resolvent used and temperature, the emission light intensity is in direct proportion to the concentration of the sample in solution (it is the basis of quantitative analysis). Also, the exiting light can be adsorbed near the liquid level in high concentration solution and result in the decreasing of emission light. The impurity resolvent can generate serious errors. The suspended matter in solution has scattering process to light. The glassware instrument and detecting cell must also be kept serious clean. Temperature must be kept stable during measuring process owing to its serous effect on fluorescence intensity. The dissolved oxygen in solution can decrease the fluorescence intensity, if necessary, removing it by bubbling inactive gas.
Rietz and Guilbault [50] developed fluorimetric methods for the determination of the activity of the enzymes GOT, GPT and α-HBD both in solution and via a solid-surface method. In each case the rate of disappearance of NADH fluorescence at 455 nm (λex=365 nm) was measured and equated to the concentration of these enzymes in control serum and blood serum. The fluorescence of the NADH produced on enzymic reaction was measured. Linear responses were found in the ranges 2.2-106 U l-1 (GOT), 5-106 U l-1 (GPT) and 14-278 U l-1 (α-HBD).
Recently Khampha et al. [51] presented a fluorescence and UV absorbance method for specific determination of l-glutamate based on a FIA system (bi-enzymatic amplification system). The content of l-glutamate in the sample was amplified by cycling between l-glutamate dehydrogenase (GlDH) and a novel enzyme, D-phenylglycine aminotransferase (D-PhgAT). In this system, GlDH converts l-glutamate to α-oxoglutarate with concomitant reduction of NAD+ to NADH. D-PhgAT transfers an amino group from D-4-hydroxyphenylglycine to α-oxoglutarate, thus recycling l-glutamate. Accumulation of NADH in the course of the enzymatic recycling was monitored both by fluorescence and UV absorbance and used for quantification of l-glutamate. The assay was characterized by high long-term stability (at least 70 days) and good reproducibility (within-day and between-day RSDs were 4.3-7.3% and 8.9%). The fluorimetric assay was slightly more sensitive with l-glutamate detection limit of 0.4 μM and linear range of 2.5-50 μM. The assay was specific for l-glutamate, with recoveries between 95-103% in the presence of 17 different amino acids tested one by one. The NADH, amplified in the reactor according to the reaction cycle shown in Figure 4, was monitored both by fluorescence and UV detection. The authors suggested this method was also applied to analysis of GOT and GPT in real serum samples.
Also, Bonizzoni et al. [52] reported that a dicopper(II) octamine cage can selectively detect the l-glutamate ion in water at pH 7 via Cu2+/–COO coordinative interactions. In particular, l-glutamate is able to displace the quenched rhodamine indicator from the cage, whose fluorescence is then fully restored. Selectivity derives from the fact that glutamate possesses two negatively charged groups (i) which display a good affinity towards the two coordinatively unsaturated CuII centers and (ii) whose distance encompasses quite well the metal–metal distance within the cage. The use of a fluorescent indicator displaying coordinative affinity for the receptor (e.g., 6-carboxy-tetramethyl-rhodamine) comparable to that of the analyte provides a convenient sensing procedure (OFF–ON switching of fluorescence).
Interestingly, Okumoto et al. [53] developed a genentically encoded surface-displayed fluorescence resonance energy transfer (FRET)-based nanosensor for detection of glutamate. YbeJ from Escherichia coli fused to two variants of the green fluorescent protein was thus used as a recognition element for developing fluorescent indicator proteins for glutamate, reasoning that the hinge-bending motion could be allosterically transduced into a glutamate-dependent change in FRET efficiency between the attached fluorescent proteins.

7. Radiochemical Analysis

Radiochemical analysis is now used in few cases due to its complicated operation and harmful to our health. Parvin et al. [54] developed a greatly simplified radiometric assay of oxaloacetate based on the citrate synthase catalyzed conversion of labeled acetyl-CoA to citrate by using charcoal separation method for the selective adsorption of acetyl-CoA. Applications of this method for the sensitive assay of GOT and aspartate determination were demonstrated. Garrison et al. [55] described a radiochemical procedure for measuring GOT activity. The method was based on the exchange of tritium atoms at positions 2 and 3 of L-2,3-[3H] aspartate with water which exists in equilibrium between enol and keto tautomeric forms when this amino acid was transaminated in the presence of α-ketoglutarate to form oxaloacetate. The tritiated water was separated from the radiolabeled aspartate by passing the reaction mixture over a cation exchange column. Confirmation that the radioactivity in the product is associated with water was obtained by separating it by anion exchange HPLC and by evaporation. The radioactivity in each fraction was determined by liquid scintillation counting. The authors suggested that an important aspect of the radiochemical assay was its high sensitivity. It should be possible to assay GPT activity in brain tissue samples as small as 50 ng wet weight, using the present assay. The case can be explained by taking account of three methods. First, the specific activity of the radiolabeled aspartate may be increased 5-fold by decreasing the concentration of aspartate from 10 to 2 mM, keeping the total amount of radioactivity the same; the decrease in aspartate concentration should not affect the rate of the reaction significantly since this concentration of aspartate was near the estimated enzyme saturation range. Second, the time of incubation can be increased from 30 to 120 min, without affecting the linearity of the assay. Thus, it should be possible to achieve about a 20-fold increase in sensitivity by combining these two methods. The third approach was to reduce the blank value by decreasing the reaction volume from 20 to 5 ∼1, yielding another 4-fold increase in sensitivity. Perales et al. [56] presented the radioisotopic assay of GOT and GPT in biological samples through a novel and sensitive procedure, based on the conversion of [U-14C] α-ketoglutarate to L-[U-14C] glutamate. In human plasma, the generation of L-[U-14C] glutamate was proportional to the volume of plasma (20-60 μl) and to the length of incubation (30-90 min). The reaction velocity was related to the temperature with a Q10 close to 1.7 for GOT and 2.0 for GPT. At 37°C, the 95% confidence interval in healthy subjects ranged from 5.1 to 18.8 U ml-1 (mean value 11.9 U l-1) for GOT and from zero to 20.1 U l-1 (mean value 9.9 U l-1) for GPT. The intra-assay coefficient of variation did not exceed 2.5%.

8. Electrochemical Techniques

Among the detection techniques of GOT and GPT, much more attentions have been focused on electrochemical techniques. However, electrochemical measurements tended to suffer from poor signal resolution against the interferent levels present in serum samples. This poor performance can be attributed both to the nature of the electrocatalytic surface and to relatively low protein loadings for enzyme immobilized at the electrode. Here we review some typical works from electrode modification in detail. Similarly, we present some important conclusions in each work so that the readers can compare them easily.

8.1. Detection using Electrode without Modification

Kinetics-based differential pulse voltammetric (DPV) method for the determination of GPT activity in human serum with a gold microelectrode without modification was reported by He and Chen [41]. The pyruvate generated in the determination of the alanine [Eq.(2)] is converted to lactate by lactate dehydrogenase and the NADH is oxidized to NAD+ [Eq.(7)]. The production rate of NAD+ via GPT enzymatic reaction was measured electrochemically by following the increase in the DPV peak current of the NAD+ reduction peak. Electrochemical measurement was performed using electrochemical analyzer with a three-electrode system. A pretreated gold disk microelectrode (Ø=50 μm) [57] was used as working electrode, Ag-AgCl/KCl (0.1 M) as reference electrode and Pt wire as auxiliary electrode. The experimental temperature was controlled at 30 °C+0.1 °C. The authors suggested that the sensitivity of the DPV response of NAD+ was dependent on the pH of the sample solution and the instrumental parameters. The experiments indicated that the peak current was clearly dependent on pH and the greatest sensitivity was found at pH 7.0 to 8.5. The quantitative analysis based on the increase in the rate of DPV current response of NAD+Ip, nA min-1) was directly proportional to the GPT activity under the optimum conditions. A linear response over a range of GPT activity from 0-200 U l-1 was obtained under the optimal conditions. The detection limit was 0.3 U l-1.
Recently, You et al. [58] prepared a thin film electrode consisting of a 3.3% atomic concentration of iridium nanoparticles dispersed in graphite-like carbon (Ir-NDC) by a simple RF sputtering method. The Ir-NDC film electrode exhibited excellent electrocatalytic ability with regard to H2O2 reduction with low atomic concentration compared to the bulk Ir electrode. The Ir nanoparticles in the film were an average of 2 nm in diameter and their chemical structure was a mixture of Ir metal and Ir oxide. The effect of L-ascorbic acid can be suppressed due to the reductive detection of hydrogen peroxide. When applying this electrode for enzymatic glutamate detection. At a detection potential of -0.15 V (vs. Ag/AgCl), it could measure the concentration of glutamate without interferences from ascorbic acid and oxygen.

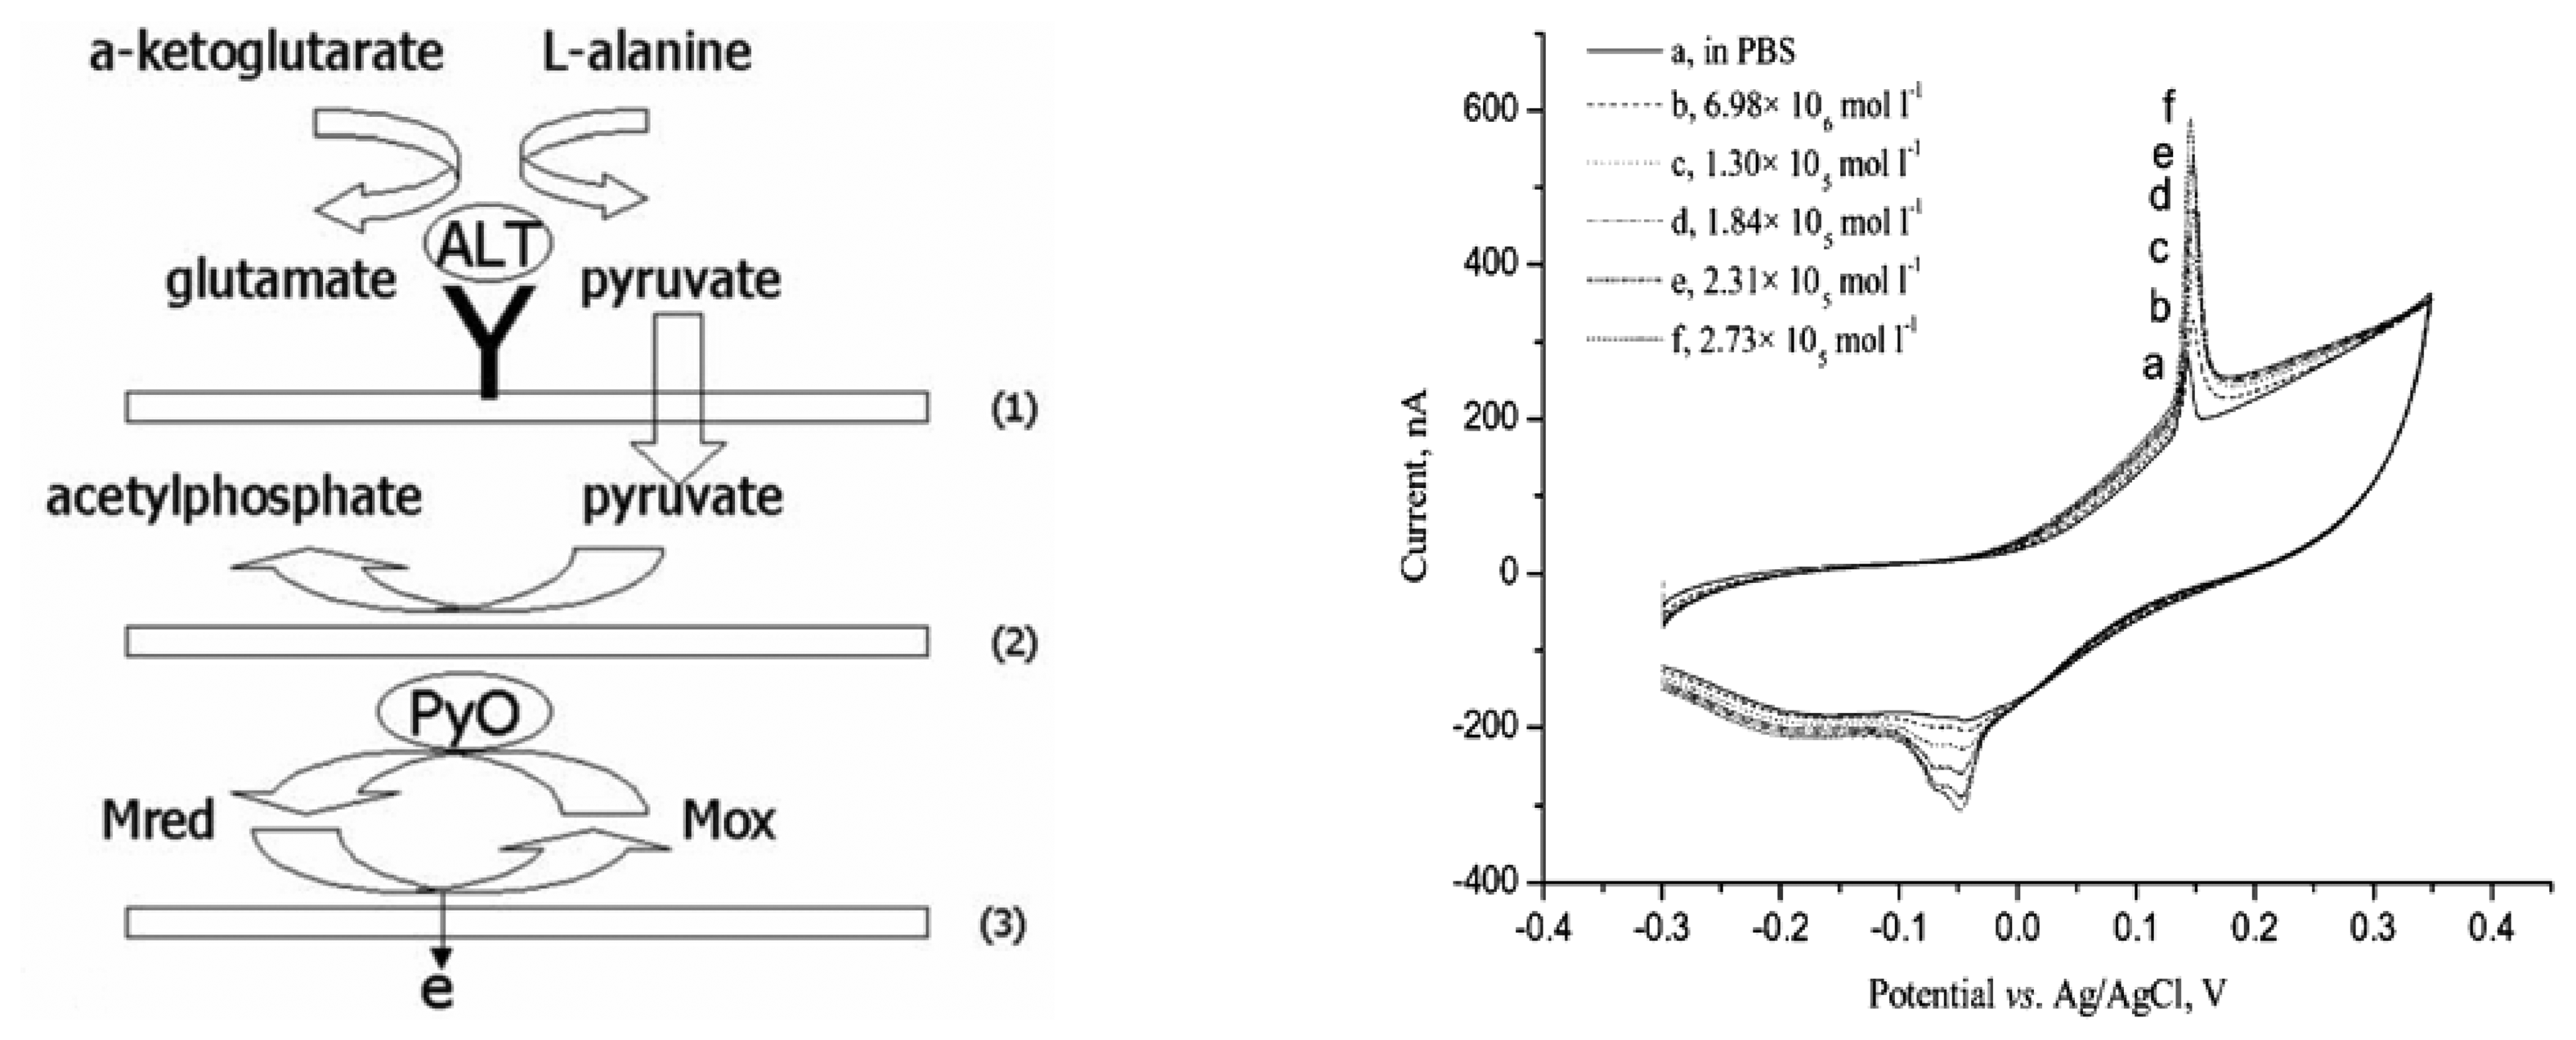
8.2. Detection using Pyruvate Oxidase Modified Electrode

Peguin et al. [59] determined pyruvate, GPT, and GOT with a specific enzyme electrode using pyruvate oxidase alone or mixed with oxaloacetate decarboxylase, immobilized on a preactivated membrane. With a two-electrode-based analyzer using pyruvate oxidase immobilized on one electrode and oxaloacetate decarboxylase and pyruvate oxidase co-immobilized and set on the second electrode, GOT and GPT activities were simultaneously determined in < 4 min under the same conditions at optimized substrate concentrations. A linear range of 6-30000 U l-1 in the sample, a detection limit of 3 U l-1, with RSD values of 4.1% and 4.5% and correlation coefficients (r) with the commercial kit of 0.997 and 0.996 for GPT and GOT, respectively, were obtained. Kihara et al. [60] determined GPT activity (5-1600 U l-1) in blood serum by using a pyruvate oxidase sensor consisting of the immobilized pyruvate oxidase coupled to a platinum electrode for measuring hydrogen peroxide, after a reaction occurred between l-alanine and α-ketoglutarate [Eq.(2)]. The required assay time was less than 60 s, and had a precision of 2-3%. Endogenous pyruvate should not interfere if measurements were made more than 30 s after starting the reaction. The authors suggested pyruvate oxidase was immobilized by adsorption on a wet poly (vinyl chloride) (PVC) membrane. Again, Kihara's group [61] realized sequential determination of GOT and GPT activities in serum. Oxalacetate decarboxylase and pyruvate oxidase were coimmobilized by adsorption on a wet poly (vinyl chloride) membrane. The activities of GOT and GPT in serum were sequentially determined by a bienzyme sensor consisting of the immobilized oxalacetate decarboxylase-pyruvate oxidase-PVC membrane and a hydrogen peroxide electrode. The assay required 14 min and had a precision of ca. 4%. The authors suggested that inherent properties of the wet PVC membrane such as rapid diffusion of substrates had advantages in the sequential enzymatic reactions. Therefore, the sequential determination of the GOT and GPT activities in serum using the bienzyme-PVC membrane electrode could be performed. They realized the sequential determination of GOT and GPT activities by operating as follows: After the GOT activity was measured by the addition of the substrate solution and serum in the cell, another substrate solution including l-alanine was fed into the cell. The two straight lines were obtained on graph paper with current increase vertically and time horizontally. The former rate (m1) and the latter rate (m2) of two straight lines refer to GOT activity and GOT and GPT activities, respectively. Therefore, the GPT activity was obtained as a function of the difference of m1 and m2. The immobilized bienzyme-PVC membrane in the cell was washed by the substrate solution after measurement and kept in the same solution.
Also of interest is the idea of Xuan and co-workers [62], who generated monoclonal antibodies to human recombinant GPT and designed an anti-GPT antibody immunosensor system using simple two layers of membrane. The GPT immunosensor was composed of the followings: (1) anti-GPT antibody-immobilized outer membrane; (2) pyruvate oxidase (PyO)-absorbed inner membrane; (3) a self assembled monolayer mediator-coated gold working electrode and an Ag/AgCl reference electrode. The new immunosensor system was separation-free and disposable, and needed small volume of sample. The authors suggested the amperometric detection mechanism of GPT-enzymatic activity operated following a sequence of three reactions. Firstly alanine is converted to pyruvate by GPT [Eq.(2)]. Secondly pyruvate is oxidized to acetylphosphate mediated by a redoxcouple (Mox/Mred) at the PyO layer [Eq.(4)]. Thirdly the pulse voltage of 0.3 V reoxidizes the metal and the oxidation current was measured. In the reaction, the oxidation current is proportional to the amount of pyruvate. The production of pyruvate depended solely on the concentration of GPT, which is selectively captured by the anti-GPT antibody immobilized on the nylon membrane. With the optimal concentration of l-alanine and α-ketoglutarate at 10-2 and 10-4 M, respectively, the ALT immunosensor demonstrated a wide dynamic range, spanning five orders of magnitude (10 pg ml-1 – 1 μg ml-1) and a low detection limit of 10 pg ml-1. The sensitivity of the immunosensor was 26.3 nA/(ng ml-1). Figure 5 shows the preparation and assembly for the electrochemical cell with anti-GPT mAb and PyO and the typical cyclic voltammograms of GPT immunosensor.

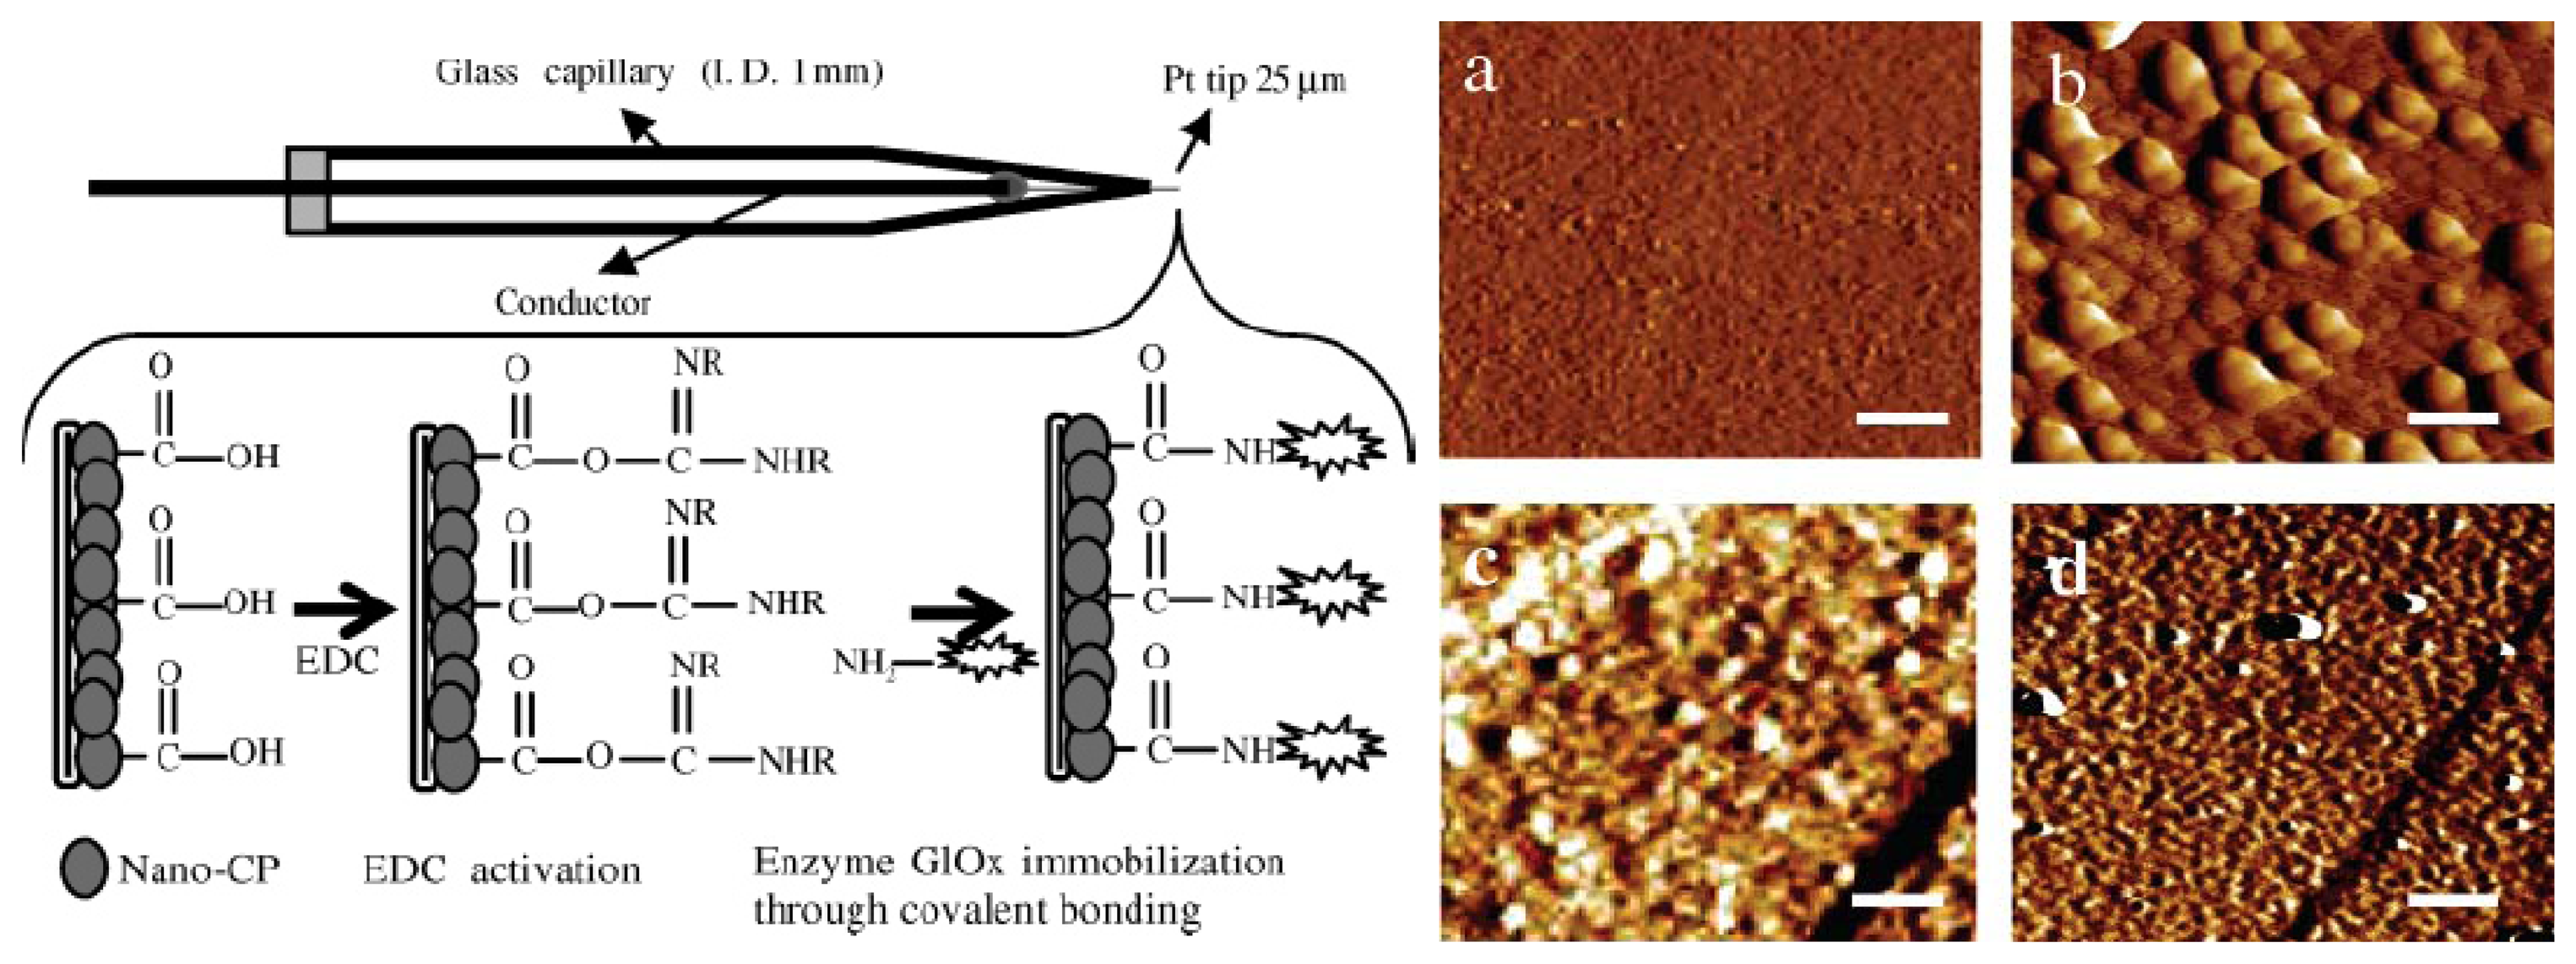
8.3. Detection using Glutamate Oxidase Modified Electrode

As can be seen from the Eqs. (1) and (2), l-glutamate was produced by GOT and GPT, so l-glutamate sensors can usually be used for GOT and GPT detection. Pan and Arnold [63] presented a Nafion/glutamate oxidase biosensor for glutamate detection. Nafion was evaluated as a means to enhance selectivity of glutamate measurements performed with the glutamate oxidase based biosensor. The authors suggested some interfering responses of easily oxidized species such as ascorbic acid, uric acid and acetaminophen can be reduced in the presence of Nafion and the extent of this reduction depended on the thickness of the Nafion layer. Nafion also reduced the electrode response to hydrogen peroxide. The Nafion layer added an additional diffusion barrier which lowers the flux of hydrogen peroxide to the electrode surface, thereby lowering the monitored current. This biosensor can be used for detection GOT and GPT by using the relationship between the assumption amount of glutamate GOT and GPT activity. Ye et al. [64] described an l-glutamate biosensor using l-glutamate oxidase coupled with flow injection analysis system. l-glutamate immobilized onto a platinized Pt electrode. The activity of l-glutamate oxidase was determined using a spectrophotometric method based on the production of H2O2. A three electrode system was used in a flow through cell. The cyclic voltammetric approach to activating the platinum wire was carried out with a potentiostat. A flow injection analysis system is shown in Figure 6. l-glutamate was enzymatically produced by GOT or GPT [Eqs.(1)-(2)] in serum, therefore, as a potential application, this system can be applied to measure GOT and GPT activity.
Oldenziel and Westerink [65] detected l-glutamate using amperometric hydrogel-coated glutamate microsensors, which constructed by coating a carbon fiber electrode (10 μm diameter; 300-500 μm long) with a five-component redox-hydrogel, in which l-glutamate oxidase, horseradish peroxidase, and ascorbate oxidase are wired via poly-(ethylene glycol) diglycidyl ether to an osmium-containing redox polymer. Coating with a thin Nafion film completes the construction. The microsensor is amperometrically operated at -150 mV versus an Ag/AgCl reference electrode. The authors suggested that optimalization in hydrogel composition improved the properties of the microsensors in terms of sensitivity, current density, detection limit, interference by ascorbic acid, and linearity. Finally, a more than 4-fold increase in sensitivity was obtained, while the interference by AA was reduced. Rahman et al. [66] prepared the functionalized conducting polymer (CP) of 5, 2′:5′, 2″-terthiophene-3′-carboxylic acid on a platinum microelectrode through the electropolymerization process using cyclic voltammetry and was used as a substrate for the immobilization of enzymes. The nanoparticles of the CP were obtained at a high scan rate in the cyclic voltammetric experiment. A needle-type amperometric glutamate microbiosensor based on the covalent immobilization of glutamate oxidase onto the CP layer was fabricated for in vivo measurements (shown in Fig.7). A linear calibration plot for glutamate was obtained between 0.2 and 100 μM with a detection limit of 0.1±0.03 μM. The response time of this microbiosensor was less than 10 s.
Castillo et al. [67] presented an approach to detect glutamate in a non-invasive way by means of a 24-well platform consisting of an array of 72 planar working electrodes, each having a size of 1.0 mm, arranged in a three electrodes/well distribution. The working electrodes are modified with a bienzyme redox hydrogel integrating glutamate oxidase and horseradish peroxidase, and the low operating potential of −50mV versus Ag/AgCl eliminates most of the possible oxidative interferences. A low detection limit of 0.5 μM l-glutamate, a response time of about 35 s, and a linear range of up to 60 μM are the main characteristics of the sensor. Also, Castillo et al. [68] simultaneous detected nitric oxide and glutamate using an array of individually addressable electrodes, in which the individual electrodes in the array were suitably modified with a highly sensitive nitric oxide sensing chemistry or a glutamate oxidase/redox hydrogelbased glutamate biosensor. In a sequence of modification steps one of the electrodes was covered first with a positively charged Ni porphyrin entrapped into a negatively charged electrodeposition paint followed by the manual modification of the second working electrode by a bienzyme sensor architecture based on crosslinked redox hydrogels with entrapped peroxidase and glutamate oxidase. The current responses recorded at each electrode clearly demonstrate the ability of the individual electrode in the array to detect the analyte towards which its sensitivity and selectivity were targeted without interference from the neighbouring electrode or other analytes present in the test mixture. A representation of the design of the electrode array at the bottom of a well used in this investigation is shown in Figure 8.
O'Neill et al [69] designed glutamate biosensor using four Pt, Au, Pd and glassy carbon (GC) as electrode materials. Glutamate oxidase cross-linked onto poly(o-phenylenediamine) (PPD) was chosen as the type 1 biosensor (PPD/GlOx), incorporating PPD as the permselective element to detect H2O2 directly on the electrode surface at relatively high applied potentials. GlOx and horseradish peroxidase/redox polymer modified electrodes (Os2+PVP/HRP/GluOx) that relied on enzyme-catalysed H2O2 detection at lower applied potentials were used as type 2 biosensors. Of the type 1 biosensors, GC/PPD/GlOx appears too insensitive to glutamate for applications in media of low glutamate concentration, with the highest LOD (∼2 μM). The three metals, however, showed sufficient sensitivity and stability for biosensor applications. Pt/PPD/GlOx was the most sensitive, but Pt might be difficult to electrodeposit in custom-designed cell media wells. Type 1 Au and Pd-based biosensors showed similar behaviors, and a final choice might depend on other considerations, such as compatibility with other chemistries in the detection cell. When compared to type 2 (HRP) designs, only the Pt-based biosensors showed similar sensitivity to glutamate. However, although HRP-modified biosensors appear to outperform those based on the PPD design, the latter includes a permselective membrane making them suitable for applications in biological media containing high concentrations of ascorbate. Such a membrane would not be feasible for the HRP design because of the requirement for PVP-bound Os2+ to access the electrode. Mikeladze et al [70] fabricated and characterized an amperometric bienzyme l-glutamate sensitive microelectrodes for monitoring changes of l-glutamate concentration. The design of the glutamate microelectrodes is based on incorporating l-glutamate oxidase and horseradish peroxidase into a redox-hydrogel containing PVI19-dmeOs as the redox mediator and immobilizing this system onto the surface of platinum microdisk electrodes using a dip-coating procedure. For amperometric measurements of l-glutamate, these redox hydrogel-based bienzyme microelectrodes can be operated at low working potentials (-50 mV vs. Ag/AgCl) decreasing the influence of electroactive interferants possibly present in biological samples. The l-glutamate microsensors are characterized by a good operation stability and sensitivity (0.038±0.005 mA M-1), a low detection limit (0.5 μM in a conventional amperometric set-up and 0.03 μM in a Faraday cage, defined as three times the signal-to-noise ratio), a linear range up to 50 μM and a response time of about 35 s.
A probe amperometric glutamate biosensor for detecting transaminases in human blood serum was presented by Compagnone et al. [71]. Calibration curves of glutamate were linear in the range 1-1000 mumol l-1, with a response time of < 1 min. This probe was subsequently applied to the measurement of activities of GOT and GPT in human sera. Analytical recovery studies demonstrated the suitability of the glutamate sensor by measuring 91-99% of added glutamate, 92-106% of added GOT, and 101-105% of added GPT. Transaminase activity measured in 80 sera correlated well with results obtained with a spectrophotometric procedure. Cooper et al. [72] demonstrated platinized activated carbon electrode immobilized by glutamate oxidase and the enzyme electrodes for the amperometric determination of l-glutamate in a stirred aqueous solution by the electrochemical detection of enzymically produced hydrogen peroxide at +320 mV vs. Ag/AgCl. Electrochemical experiments were done in a two-electrode stirred cell which contained a 5-mm diameter compacted Ag/AgCl combined reference and auxiliary electrode which surrounded a 1.5-mm diameter recessed gold contact in which the platinized carbon working electrode was placed. A linear calibration graph was obtained between 2 μM and 2 mM with a steady-state response time of 1 min by the method. The glutamate oxidase electrode was subsequently applied to the measurement of GOT and GPT in serum. The responses of the enzyme electrode to GOT and GPT activities were linear over the clinically relevant range (5-500 U l-l), and correlated well (r = 0.99) with the methods used for routine clinical analysis.
Recently Mizutani et al. [73, 74] have found that a polyion complex consisting of poly-L-lysine and poly (4-styrenesulfonate) was useful for realizing the hydrogen peroxide transducer with a rapid response. The polyion complex layer showed permselectivity based on the solute size with a cut-off molecular weight of about 100 [74]. The polyion complex had been proven to be useful as the support for immobilizing enzymes for the substrates whose molecular weights were lower than 100 (e.g. L-lactic acid and ethanol) [73-76]: the permeation of the interferents into the enzyme-containing polyion complex was restricted, whereas the analyte permeated easily to undergo the enzymatic reaction. On the other hand, an enzyme electrode to the analyte with the molecular weight being larger than 100 (e.g. glucose) could be prepared by the use of a bilayer-membrane system consisting of an enzyme layer and polyion complex layer [77]; first, the polyion complex layer was prepared on the base electrode surface, then an enzyme layer was formed on the anti-interfering layer. Amino groups on poly-L-lysine were useful for attaching enzyme molecules; the enzyme could easily be immobilized on the polyion complex layer by placing enzyme and glutaraldehyde solutions on the layer. Further, the hydrogen peroxide produced through the enzymatic reaction permeated quickly into the hydrophilic polyion complex layer, which resulted in a rapid electrode response. The characteristics of this L-gulutamate sensing electrode such as high sensitivity, rapid response and low interferential level made it particularly suitable for the determination of transaminase activities in human sera. On the basis of the previous works mentioned above, Mizutani's group [78] presented an amperometric l-glutamate-sensing electrode by immobilizing glutamate oxidase on a polyion complex layer-modified electrode. First, a monolayer of 3-mercaptopropionic acid was made on the surface of a gold electrode by immersing it in an ethanol solution containing the modifier. Next, aqueous solutions of poly-L-lysine and poly (4-styrenesulfonate) were successively placed on the electrode surface and allowed to dry. Finally, a GlOx layer was formed on the poly-L-lysine: poly(4-styrenesulfonate)-complex layer by crosslinking the enzyme by the addition of a glutaraldehyde solution. The use of thin bilayer system with the inner, polyion complex membrane, which showed permselectivity based on the solute size with the molecular cut-off of :100, brought high performance characteristics to the l-glutamate-sensing electrode; it showed high sensitivity (detection limit, 20 nM), rapid response (100% response time, 3 s), low interferential level (the ratio of response for L-ascorbic acid to that for the same concentration of L-glutamic acid, 8×10⁻²), and high stability (usable for more than a month). The bilayer-based electrode was useful for the rapid measurement of GOT and GPT in serum sample: each transaminase (0.2-1000 U l-1) could be determined within 10 s.
Also of interest is the electrode modification of Chen et al. [40] who presented a highly sensitive and stable l-glutamate sensor for the rapid detection of the GPT activity in serum which was composed of immobilized l-glutamate oxidase in a photo-crosslinkable polymer (PVA-SbQ) membrane on a palladium-deposited screen-printed carbon strip (SPCS) electrode. The biocatalyst scheme to measure GPT is illustrated in Figure 9. A photo-crosslinkable polymer PVA-SbQ was thought to be suitable for fabrication of a thin enzyme membrane (about 1μm thick) [79]. Enzyme can be immobilized in the matrix with high surface density and retain their functional characteristics to a large extent for several months upon repetition of wetting and drying [80]. Moreover, enzymes can be immobilized in this polymer using photolithography techniques [81, 82], which can be adapted to mass production using ordinary screen-printing or semiconductor-fabrication processes on a planar electrode [79, 83]. Palladium was chosen to modify the SPCS electrode because it not only increased the surface area but also dramatically decreased the overpotential of the reduction of hydrogen peroxide and improved its electrochemical response [84]. Furthermore, as aggregates of palladium particles form many open “micropockets”, the enzyme film can be strongly adsorbed into the three-dimensional matrix [85], contributing to the shelf life of the enzyme electrode. The optimal substrate composition for the detection of GPT activity was 1 mM α-ketoglutarate and 100 mM l-alanine. The GPT activity in serum could be determined within 3 min. The response of the sensor to GPT activity was linear over the range of 8-250 U l-1. Good correlation between the sensor and the Sigma GPT assay kit was achieved (r2 = 0.9958).
Also, some works focused on not only electrode modification but also analysis system design. Typically, a miniaturized analysis system for the rapid assay of liver transaminases activities by means of hybrid technology was produced by Moser et al. [86, 87]. Figure 10 shows a top view of the microsystem and a schematic cross section of the integrated device. Microfluidics was realized with printed circuit board technology and combined with thin film glutamate biosensors. The biosensor array comprises two glutamate sensors and two inactive sensors. The glutamate sensors utilize the enzyme glutamate oxidase immobilized in a photo crosslinked pHEMA hydrogel membrane of typically 7 μm thickness in the dry state. Hydrogen peroxide in enzyme reaction [Eqs.(1,2,5)] oxidized on a platinum electrode provided the signal. This integration of sample treatment and sensing functions in a miniaturized device not only minimized the sample volume required but also increased the reliability of the analysis performed. Sample and reagent volumes required were 70 μl each and assay time was 4.5 min. The miniaturized system had an outer dimension of 42×22×1.5 mm3 and a total internal volume of 11 μl. By comparison the traditional spectrophotometric techniques of transaminase acivity assays, the authors suggested that this novel analytical device offered serious advantages. Most importantly, readout can be obtained within few minutes. Sample volume requirement was reduced too. Since the assay was not optically transduced, even the use of whole blood samples seemed realistic. No NADH and no soluble enzymes were required in the assay and therefore the stability of the substrate solutions was enhanced.

8.4. L-Lactate Biosensor for GOT and GPT Detection

According to Eqs.(1), (2), (3) and (7), as one of the products of a series of bio-chemistry reactions, L-lactate biosensor were developed for GOT and GPT detection. Typically, Suman et al. [88] developed an amperometric enzyme electrode for determination of lactate. To prepare this electrode, commercial lactate oxidase from pediococcus species has been immobilized through glutaraldehyde coupling onto polyaniline-co-fluoroaniline film deposited on an Indium tin oxide (ITO) coated glass plate. This plate acted as working electrode when combined with Pt electrode as counter electrode to the electrometer for the development of a biosensor. The method is based on generation of electrons from H2O2, which is formed from lactic acid by immobilized lactate oxidase. The concentration of lactic acid is directly proportional to the current measured. The enzyme electrode showed optimum response when operated at 42 °C in 0.05 M, sodium phosphate buffer pH 6.5 for 50 s. The biosensor showed a good performance with a linear response range from 0.1 to 5.5 mM. The minimum detection limit of the method is 0.1 mM and sensitivity of the sensor is 1.18 μA mM-1 lactate. Kwan et al. [89] prepared a novel trienzyme sensor for the amperometric determination of lactate by immobilizing salicylate hydroxylase (SHL, E.C.1.14.13.1), L-lactate dehydrogenase (LDH, E.C. 1.1.1.27), and pyruvate oxidase (PyOD, E.C. 1.2.3.3) on a Clark-type oxygen electrode. The enzymes were entrapped by a poly(carbamoyl) sulfonate (PCS) hydrogel on a Teflon membrane. A Teflon membrane was used to fabricate the sensor in order to avoid interferences. The sensor has a fast response (2 s) and short recovery times (2 min). The total test time for a measurement by using this lactate sensor (4 min) was faster than using a commercial lactate testing kit (up to 10 min). The sensor has a linear range between 10 and 400 μM lactate, with a detection limit of 4.3 μM. A good agreement (r2 = 0.9984) with a commercial lactate testing kit was obtained in beverage sample measurements. The schematic diagram of the trienzyme system is shown in Figure 11.

9. Conclusions and Outlook

In this work we have reviewed a sampling of reported typical AST/GOT and ALT/GPT detection technologies. The objective is to present the method from its experimental principles, in order to provide a glimpse into the current-state-of-the-art in each of these techniques. In addition to these experimental principles, we have also reviewed some important conclusions in order to provide a comparison.
Among these techniques, some such as colorimetric, spectrophotometric, chemiluminescence, and fluorescence have been well established and widely used while others such as radiochemical technique have been used in few cases. As we have stated, recently, the majority of GOT and GPT assay research has been concentrated in electrochemical methods (the chemistry and biochemisrtry involve in the enzymatic reaction) due to its highest sensitivity. Although many different strategies have been proposed for the AST and ALT detection using biosensors, they tended to suffer from poor signal resolution against the interferent levels present in serum samples. As expected, easily oxidized species in serum such as ascorbic acid, uric acid and acetaminophen can generate positive interfering signal. This poor performance can be attributed both to the nature of the electrocatalytic surface and to relatively low protein loadings for enzyme immobilized at the electrode. As for electrochemical biosensors, most attentions have been focused on the fabrication of electrodes and their surface modifications.
Microelectromechanical systems (MEMS) have recently entered the forefront of instrumentation development in analytical chemistry. MEMS offer the researcher many advantages, including high sample throughput, high sample processing rates, minimized consumption of sample and reagent manufacturing cost and system integration [90-92] have reviewed a sampling of recently reported (between 2000 and mid 2003) integrated microfluidic devices, otherwise known as lab-on-a-chip. In their review they provide an in-depth look at the “state-of-the-art” in integrated microfludic devices for a broad range of application areas from on-chip DNA analysis, immunoassays and cytometry to advances in integrated detection technologies for and miniaturized fuel processing devices. Lv and co-workers [93] have reported a chemiluminescence (CL) biosensor on a chip coupled to microfluidic system for determination of glucose in human serum. The CL biosensors measured 25×45×5 mm in dimension, was readily produced in ananlytical laboratrory. Glucose oxidase was immobilized onto controlled-pore glass via glutaraldehyde activation and packed into a reservoir. The analytical reagents, including luminol and ferricyanide, were electrostatically co-immobilized on an anion-exchange resin. The most characteristic of the biosensor was to introduce the air as the carrier flow in stead of the common solution carrier for the first.
Our laboratory has been carrying research on integrated bio-MEMS [94-97]. We have proposed and implemented a single cell-based assay device for fast and parallel single-cell monitoring and high-throughput drug screening. The proposed single-cell assay device was designed so that a single cell was autonomously captured in a cell-positioning site by a pre-defined fluid stream. Specific liquid including drugs or reagents can be supplied to each single-cell through a drug injection channel [97]. We also proposed a new DNA sample preparation microfluidic chip for nucleic acid probe assay. The proposed microfluidic chip was composed of three parts: microfilter, micromixer and DNA purifiction chip. We have fabricated a microsieve type filter with an array of 2.2μm diameter holes and demonstrated that the mixing can be successfully achieved for low Reynold numbers below 50 by using the fabricated micromixer. The fabricated DNA purification chip had shown a binding capacity of 15ng/cm2 and a minimum extractable input concentration of 100copies/200μL. The proposed microfluidic chip can be applied for low-cost, disposable sample preparation of NA probe assays [96]. On the basis of our previous work, presently, we are investigating the assay of GOT and GPT in serum by using electrochemical techniques coupled with micorfluidic chip. The small dimensions of the device, the stability of the reagents used, and the relatively simple measurement electronics should allow the development of a hand held device for the point of care assay of GOT and GPT. Lastly, we also believe this new sensing device of combining “top-down” with “bottom-up” techniques could provide an opportunity for micro-total-analytical- system (μ-TAS).

Acknowledgments

This work was supported by Brain Korea 21 project, the School of Information Technology, Korea Advanced Institute of Science and Technology in 2006, and the National Research and Development Program (NRDP, 2005-01274) for the biomedical function monitoring biosensor development sponsored by the Korea Ministry of Science and Technology (MOST).

References and Notes

  1. Hafkenscheid, J.C.M.; Dijt, C.C.M. Determination of serum aminotransferases: activation by pyridoxal-5′-phosphate in relation to substrate concentration. Clin. Chem. 1979, 25, 55–59. [Google Scholar]
  2. Sampson, E.J.; Whitner, V.S.; Burtis, C.A.; McKneaily, S.S.; Fast, D.M.; Bayse, D.D. An interlaboratory evaluation of the IFCC methodfor aspartate aminotransferasewith use of purified enzyme materials. Clin. Chem. 1980, 26, 1156–1164. [Google Scholar]
  3. Jacobs, D.S. Laboratory Test Handbook., 4th ed.; Cleveland, OH; Lexi-Comp Inc., 1996. [Google Scholar]
  4. Purcell, G.V.; Behenna, D.B.; Walsh, P.R. Alanine aminotransferase and aspartate aminotransferase measurements with two automated analyzers, SMAC and the ABA-100, Compared. Clin.Chem. 1979, 25, 780–782. [Google Scholar]
  5. http://www.medfriendly.com/aspartateaminotransferase.html.
  6. http://www.medfriendly.com/alanineaminotransferase.html.
  7. Wang, J.Y. Biological Chemistry, 3rd ed.; Higher Education Press: Beijing, 2002. [Google Scholar]
  8. Bergmeyer, H.U.; Bernst, E. Glutamate-oxaloacetate transaminase: UV-assay manual method, in. Bergmeyer, H.U., Ed.; In Methods of Enzymatic Analysis., 2nd English Ed; Academic Press: New York, 1963; pp. 727–733. [Google Scholar]
  9. Bergmeyer, H.U.; Bernst, E. lutamate-pyruvate transaminase: UV-assay manual method, in. Bergmeyer, H.U., Ed.; In Methods of Enzymatic Analysis., 2nd English Ed; Academic Press: New York, 1963; pp. 752–758. [Google Scholar]
  10. Hanson, C.; Cleland, W. Kinetic studies of glutamic oxaloacetic transaminase isozymes. Biochem. 1964, 3, 338–345. [Google Scholar]
  11. Saier, M.; Jenkins, W. Alanine aminotoransferase: purification and properties. J. Biol. Chem. 1967, 242, 91–100. [Google Scholar]
  12. Bergmeyer, H.U.; Horder, M.; Rey, J. Approved recommendation on IFCC methods for the measurement of catalytic enzymes. Part 2: IFCC method for aspartate aminotransferase. J. Clin. Chem. Clin. Biochem. 1986a, 24, 497–510. [Google Scholar]
  13. Bergmeyer, H.U.; Horder, M.; Rey, J. Approved recommendation on IFCC methods for the measurement of catalytic enzymes. Part 3: IFCC method for alanine aminotransferase. J. Clin. Chem. Clin. Biochem. 1986b, 24, 481–495. [Google Scholar]
  14. Jung, K.; Grützmann, K.D. Comparative determinations of aminotransferase activities in serum with so-called “optimised” methods. Clin. Chim. Acta 1977, 81, 299–304. [Google Scholar]
  15. Gella, F.J.; Olivella, T.; Pastor, M.C.; Arenas, J.; Moreno, R.; Durban, R.; Gomez, J.A. A simple procedure for the routine determination of aspartate aminotransferase and alanine aminotransferase with pyridoxal phosphate. Clin. Chim. Acta 1985, 153, 241–247. [Google Scholar]
  16. Lustig, V.; Diamandis, A.P.; Goldberg, D.M. Evaluation of commercially formulated aspartate aminotransferase and alanine aminotransferase activity determinations by the scandinavian committee on enzymes and IFCC methods as modified for use with automated enzyme analysers. Clin. Biochem. 1988, 21, 283–290. [Google Scholar]
  17. Goldberg, D.M.; Remtulla, M.A.; Lustig, V. The Diagnostic accuracy of three recommended methods for serum aspartate aminotransferase assays in patients suspected of myocardial infarction and hepatobiliary diseases. Clin. Biochem. 1988, 21, 323–328. [Google Scholar]
  18. Schumann, G.; Bonora, R.; Ceriotti, F.; Férard, G.; Ferrero, C.A.; Franck, P.F.H.; Gella, F.J.; Hoelzel, W.; Jørgensen, P.J.; Kanno, T.; Kessner, A.; Klauke, R.; Kristiansen, N.; Lessinger, J.M.; J.Linsinger, T.P.; Misaki, H.; Panteghini, M.; Pauwels, J.; Schiele, F.; Schimmel, H.G. IFCC primary reference procedures for the measurement of catalytic activity concentrations of enzymes at 37 °C: Part 4. Reference procedure for the measurement of catalytic concentration of alanine-aminotransferase. Clin. Chem. Lab Med. 2002, 40, 718–724. [Google Scholar]
  19. Schumann, G.; Bonora, R.; Ceriotti, F.; Férard, G.; Ferrero, C.A.; Franck, P.F.H.; Gella, F.J.; Hoelzel, W.; Jørgensen, P.J.; Kanno, T.; Kessner, A.; Klauke, R.; Kristiansen, N.; Lessinger, J.M.; Linsinger, T.P.; Misaki, H.; Panteghini, M.; Pauwels, J.; Schiele, F.; Schimmel, H.G.; Weidemann, G.; Siekmann, L. IFCC primary reference procedures for the measurement of catalytic activity concentrations of enzymes at 37 °C: Part 5. Reference procedure for the measurement of catalytic concentration of aspartate-aminotransferase. Clin. Chem. Lab Med. 2002, 40, 725–733. [Google Scholar]
  20. Schumann, G.; Klauke, R. New IFCC reference procedures for the determination of catalytic activity concentrations of five enzymes in serum: preliminary upper reference limits obtained in hospitalized subjects. Clin. Chim. Acta 2003, 327, 69–79. [Google Scholar]
  21. Babson, A.L.; Shapiro, P.O.; Williams, P.A.R.; Phillips, G.E. The use of a diazonium salt for the determination of glutamic-oxalacetic transaminase in serum. Clin. Chim. Acta 1962, 7, 199–205. [Google Scholar]
  22. Matsuzawa, T.; Katunuma, N. Colorimetric assays for serum alanine transaminase and lactic dehydrogenase using diazonium zinc salt. Anal. Biochem. 1966, 17, 143–153. [Google Scholar]
  23. Lippi, U.; Guidi, G. A new colorimetric ultramicromethod for serum glutamicoxalacetic and glutamic-pyruvic transaminase determination. Clin. Chim. Acta 1970, 28, 431–437. [Google Scholar]
  24. Bailey, W.C.; DeRouen, T.A.; Ziskind, M.M.; Greenberg, H.B. Autoanalytic (colormetric) determinations of SGOT in isoniazid recipients are reliable. Am. Rev. Respir Dis. 1975, 111, 237–238. [Google Scholar]
  25. Whitaker, J.F. A general colorimetric procedure for the estimation of enzymes which are linked to the NADH/NAD+ system. Clin. Chim. Acta 1969, 24, 23–27. [Google Scholar]
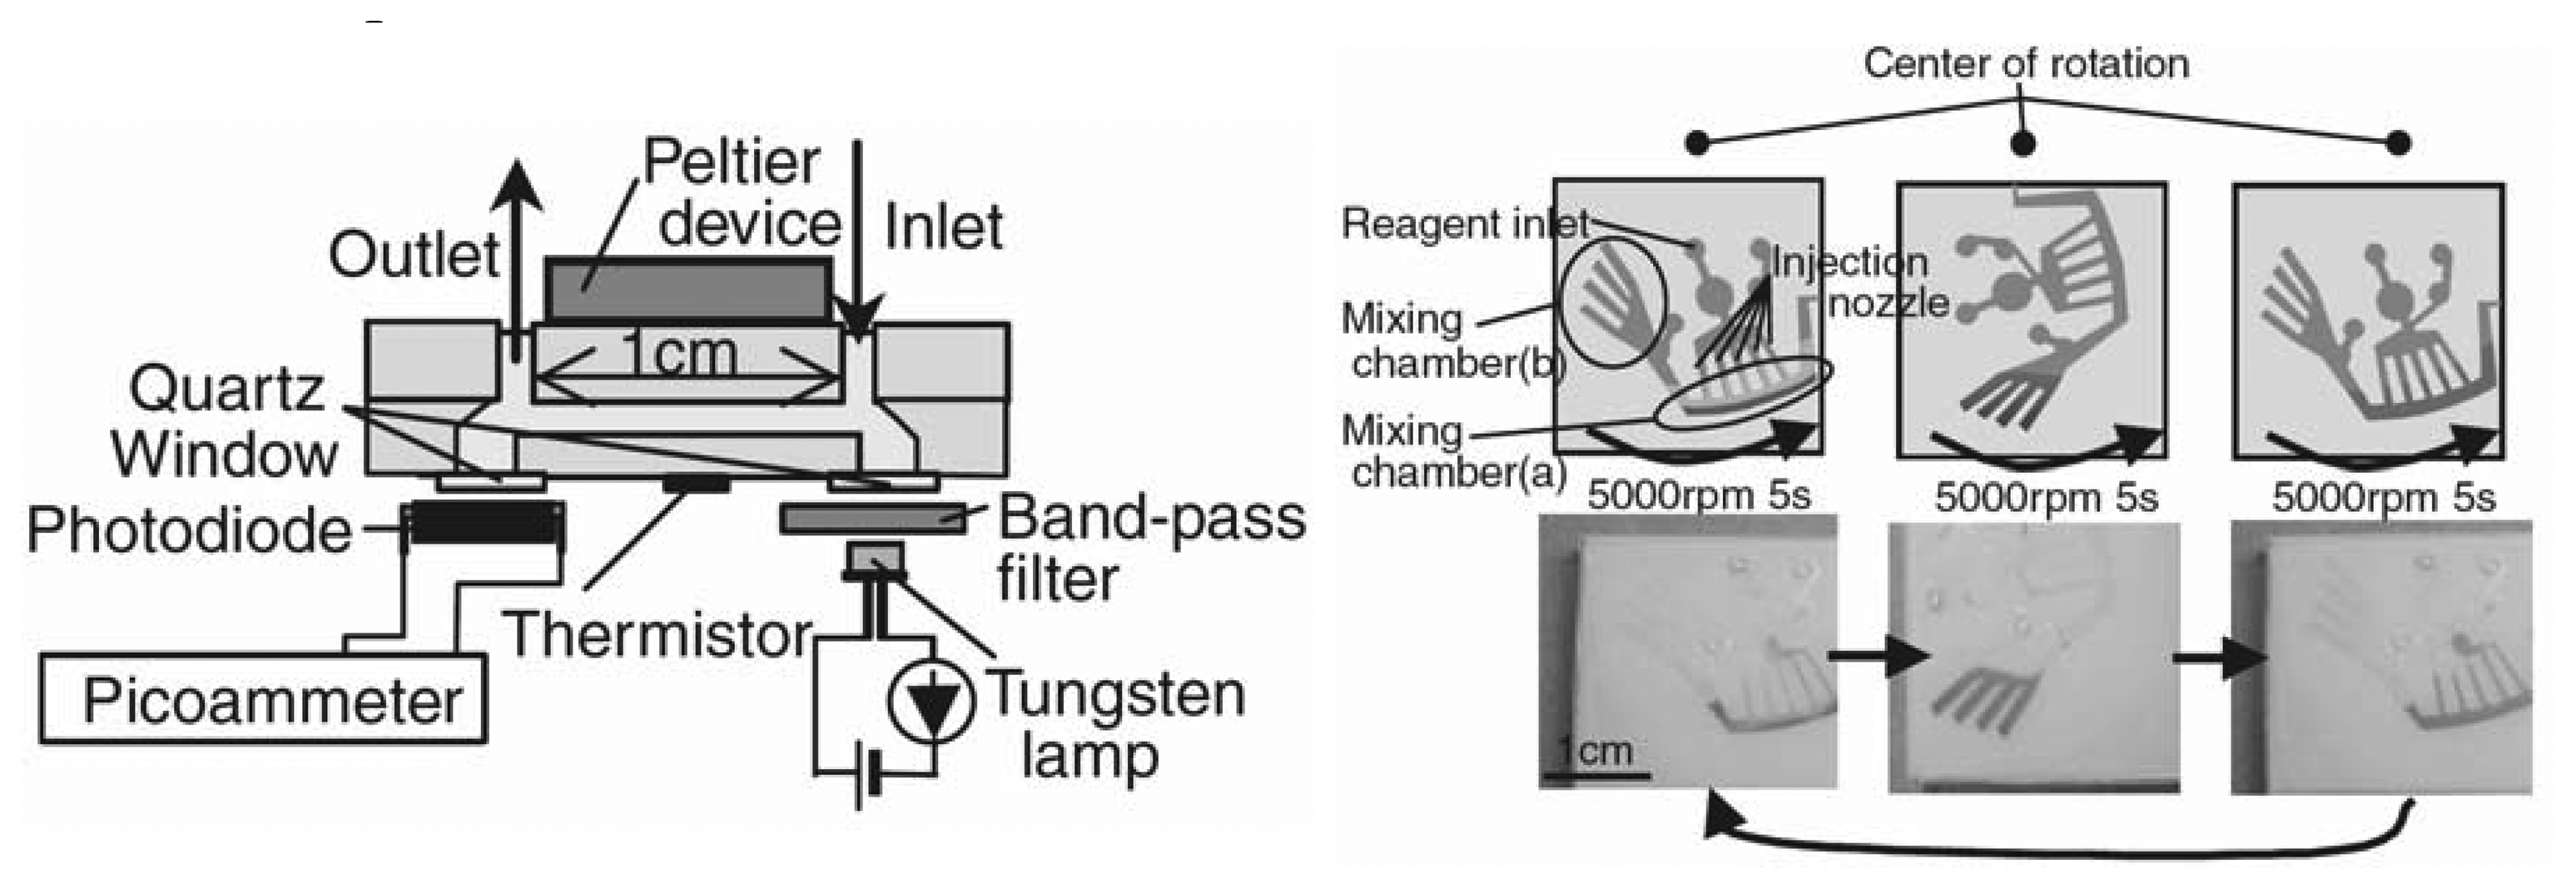
  26. Oki, A.; Ogawa, H.; Takamura, Y.; Horiike, Y. Biochip which examines hepatic function by employing colorimetric method. Jpn. J. Appl. Phys. 2003, 42, L342–L345. [Google Scholar]
  27. Karmen, A. A note on the spectrometric assay of glutamic-oxalacetic transaminase in human blood serum. J. Clin. Invest. 1955, 34, 131–133. [Google Scholar]
  28. Giusti, G.; Ruggiero, G.; Cacciatore, L. A comparative study of some spectrophotometric and colorimetric procedures for the determination of serum glutamic-oxaloacetic and glutamic-pyruvic transaminase in hepatic diseases. Enzymol. Biol. Clin. 1969, 10, 17–38. [Google Scholar]
  29. Itoh, H.; Srere, P.A. A new assay for glutamate-oxaloacetate transaminase. Anal. Biochem. 1970, 35, 405–410. [Google Scholar]
  30. Rodgerson, D.O.; Osberg, I.M. Sources of error in spectrophotometric measurement of aspartate aminotransferase and alanine aminotransferaseActivities in serum. Clin.Chem. 1974, 20, 43–50. [Google Scholar]
  31. Amador, E.; Wacker, W.B.C. Serum glutamic-oxaloacetic transaminase activity: A new modification and an analytical assessment of current assay technics. Clin. Chem. 1962, 8, 343–350. [Google Scholar]
  32. Henry, R.J.; Chiamori, N.; Golub, O.J.; Berkman, S. Revised spectrophotometric methods for the determination of glutamic-oxalacetic transaminase, glutainic-pyruvic transaminase, and lactic dehydrogenase. Am. J. Clin. Pathol. 1960, 34, 318–322. [Google Scholar]
  33. Pearson, J.R.; Pinfield, B.R.; Cooper, D. A system for computer analysis of kinetic enzyme data from a modified Beckman DSA-560. Clin. Chem. 1972, 18, 775–777. [Google Scholar]
  34. Hamada, H.; Ohkura, Y. A new photometric method for the determination of serum glutamate pyruvate transaminase activity using pyruvate and glutamate as substrates. Chem. Pharm. Bull 1976, 24, 1865–1869. [Google Scholar]
  35. Yagi, T.; Kagamiyama, H.; Ohtawara, S.; Soda, K.; Nozaki, M. A new assay for L-aspartate: 2-oxoglutarate aminotransferase. Anal. Biochem. 1979, 100, 20–24. [Google Scholar]
  36. Phillip, M.A.; Graham, R.P. Designing a coupled assay system for aspartate aminotransferase. Biochem. Edu. 1995, 23, 40–41. [Google Scholar]
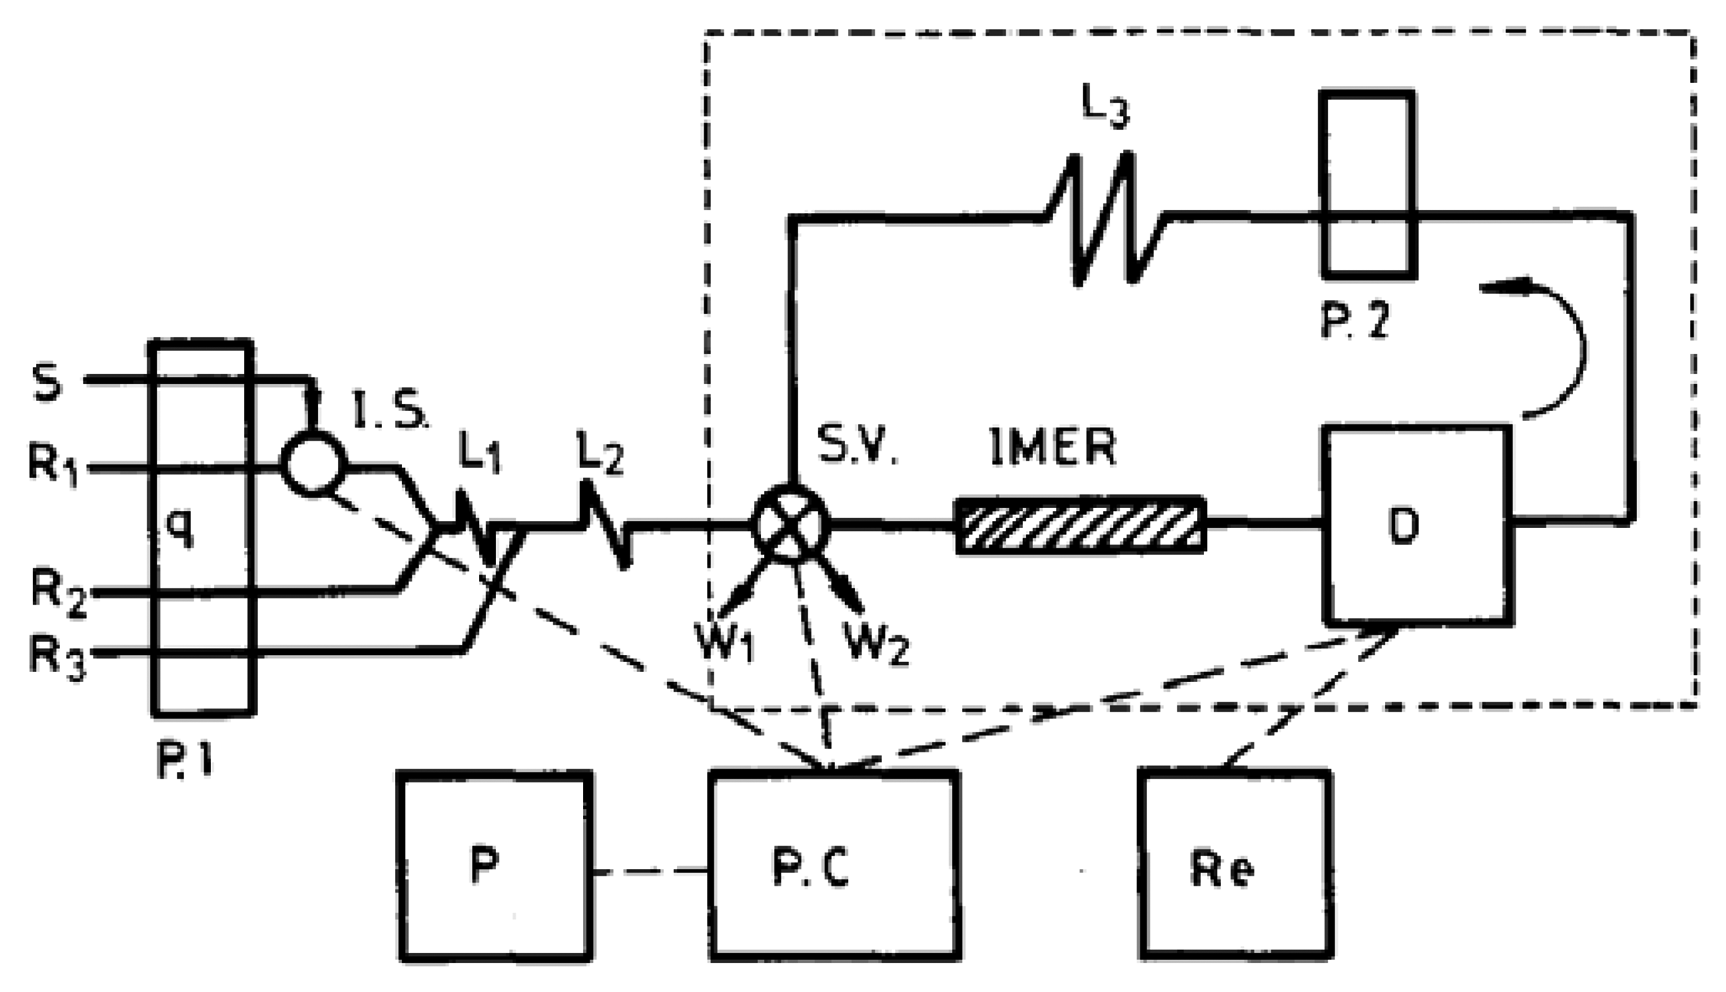
  37. Fernández-Romero, J.M.; Luque de Castro, M.D.; Valcfircel, M. Determination of alanine aminotransferase in human serum in an open-closed flow injection configuration. J. Biotechnol. 1990, 14, 43–52. [Google Scholar]
  38. Valero, E.; Garcia-Carmona, F. A Continuous spectrophotometric method based on enzymatic cycling for determining l-glutamate. Anal. Biochem. 1998, 259, 265–271. [Google Scholar]
  39. Mayer, D.; Spielman, D.M. Detection of glutamate in the human brain at 3 T using optimized constant time point resolved spectroscopy. Magn. Reson. Med. 2005, 54, 439–442. [Google Scholar]
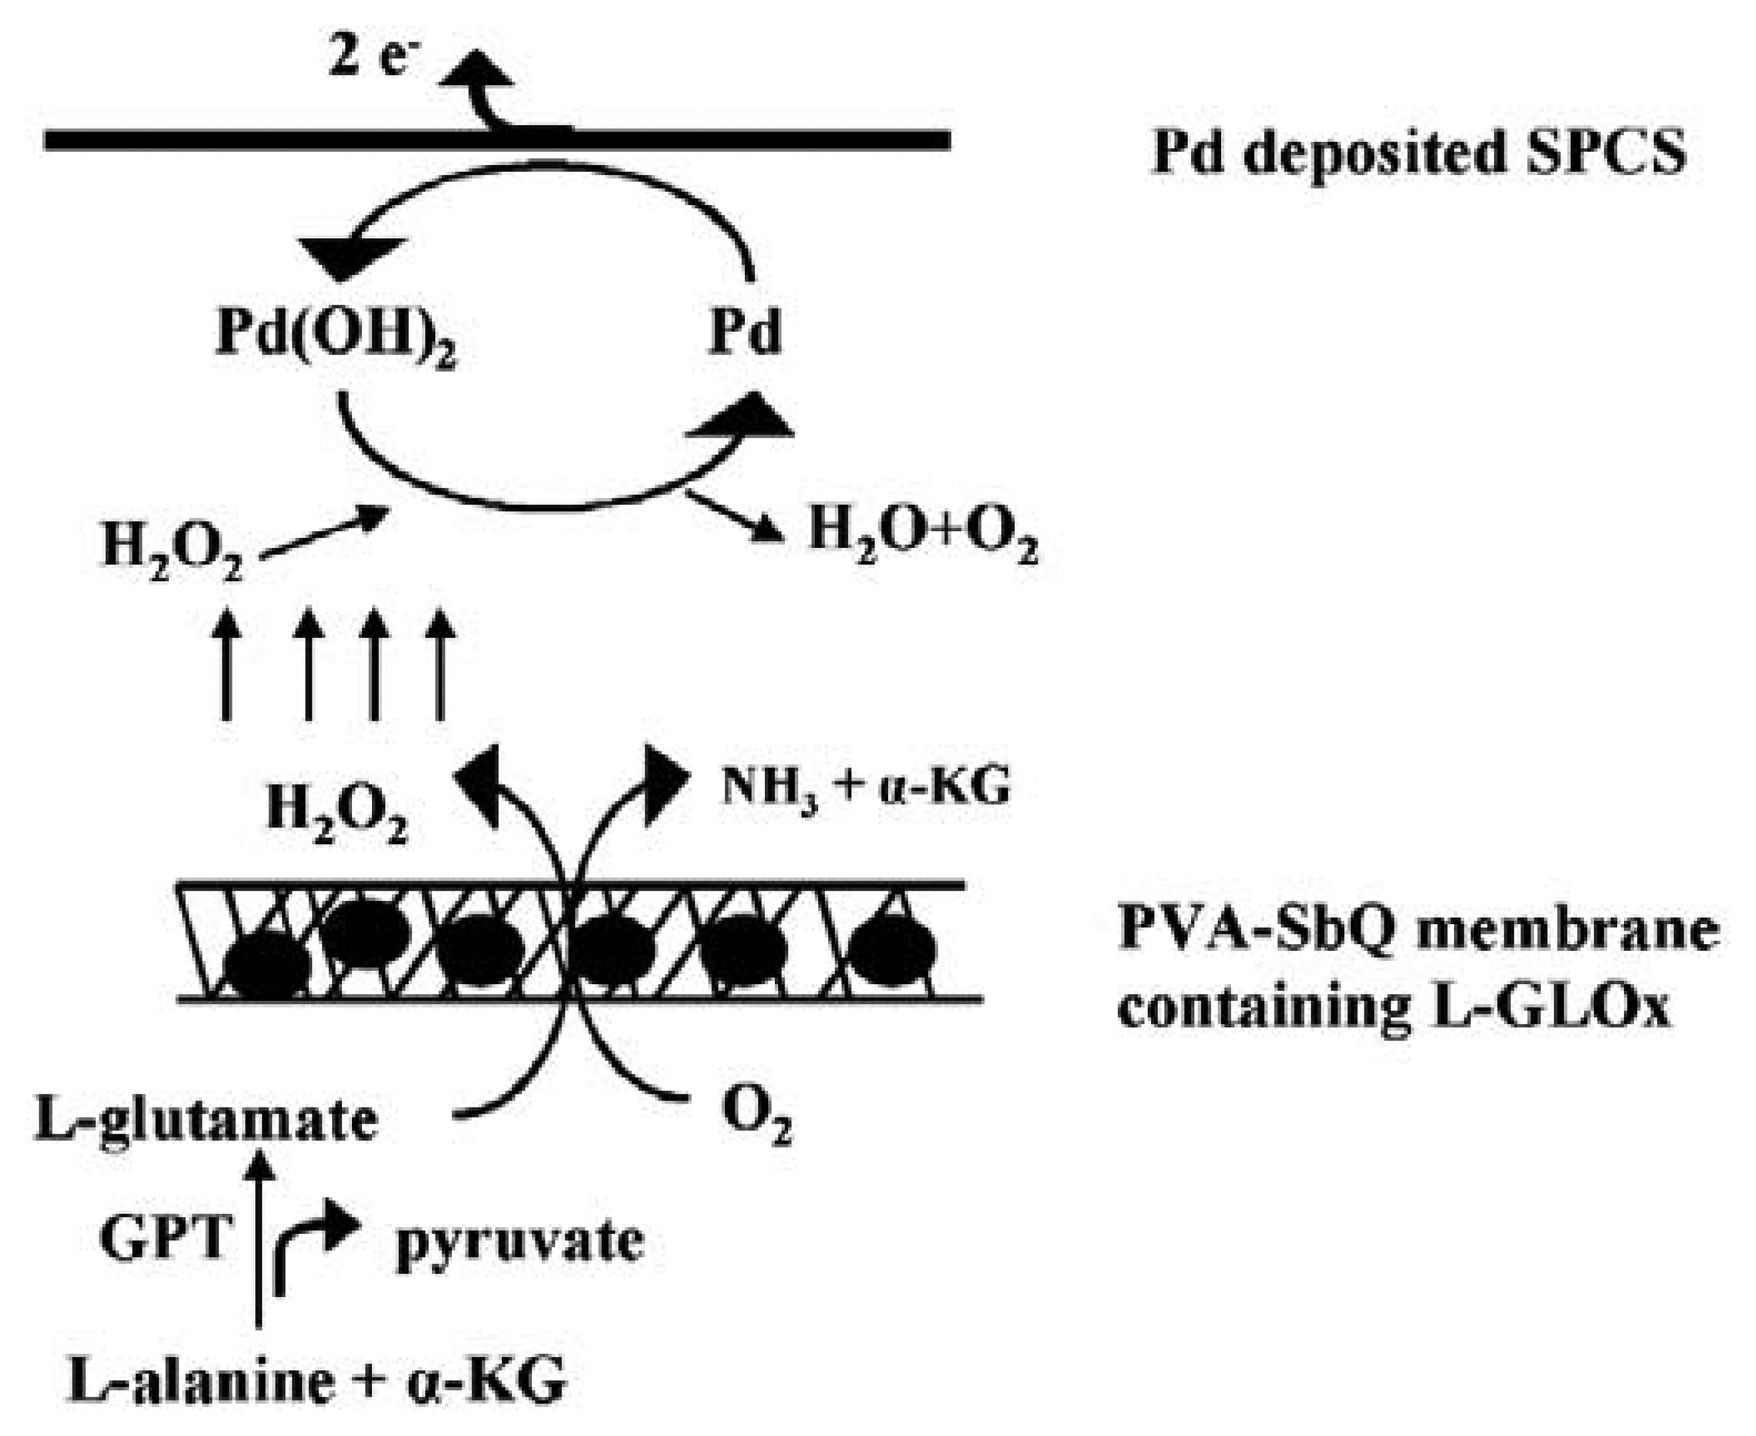
  40. Chang, K.S.; Hsu, W.L.; Chen, H.Y.; Chang, C.K.; Chen, C.Y. Determination of glutamate pyruvate transaminase activity in clinical specimens using a biosensor composed of immobilized l-glutamate oxidase in a photo-crosslinkable polymer membrane on a palladium-deposited screen-printed carbon electrode. Anal. Chim. Acta 2003, 481, 199–208. [Google Scholar]
  41. He, Y.N.; Chen, H.Y. The kinetics-based electrochemical determination of serum glutamate pyruvate transaminase activity with a gold microelectrode. Anal. Chim. Acta 1997, 353, 319–323. [Google Scholar]
  42. Catz, S.D.; Carreras, M.C.; Poderoso, J.J. Nitric oxide synthase inhibitors decrease human polymorphonuclear leukocyte luminol-dependent chemiluminescence. Free Radic. Biol. Med. 1995, 19, 741–748. [Google Scholar]
  43. Janasek, D.; Spohn, U. Chemiluminometric flow injection analysis procedures for the enzymatic determination of l-alanine, α-ketoglutarate and lglutamate. Biosens. Bioelectron. 1999, 14, 123–129. [Google Scholar]
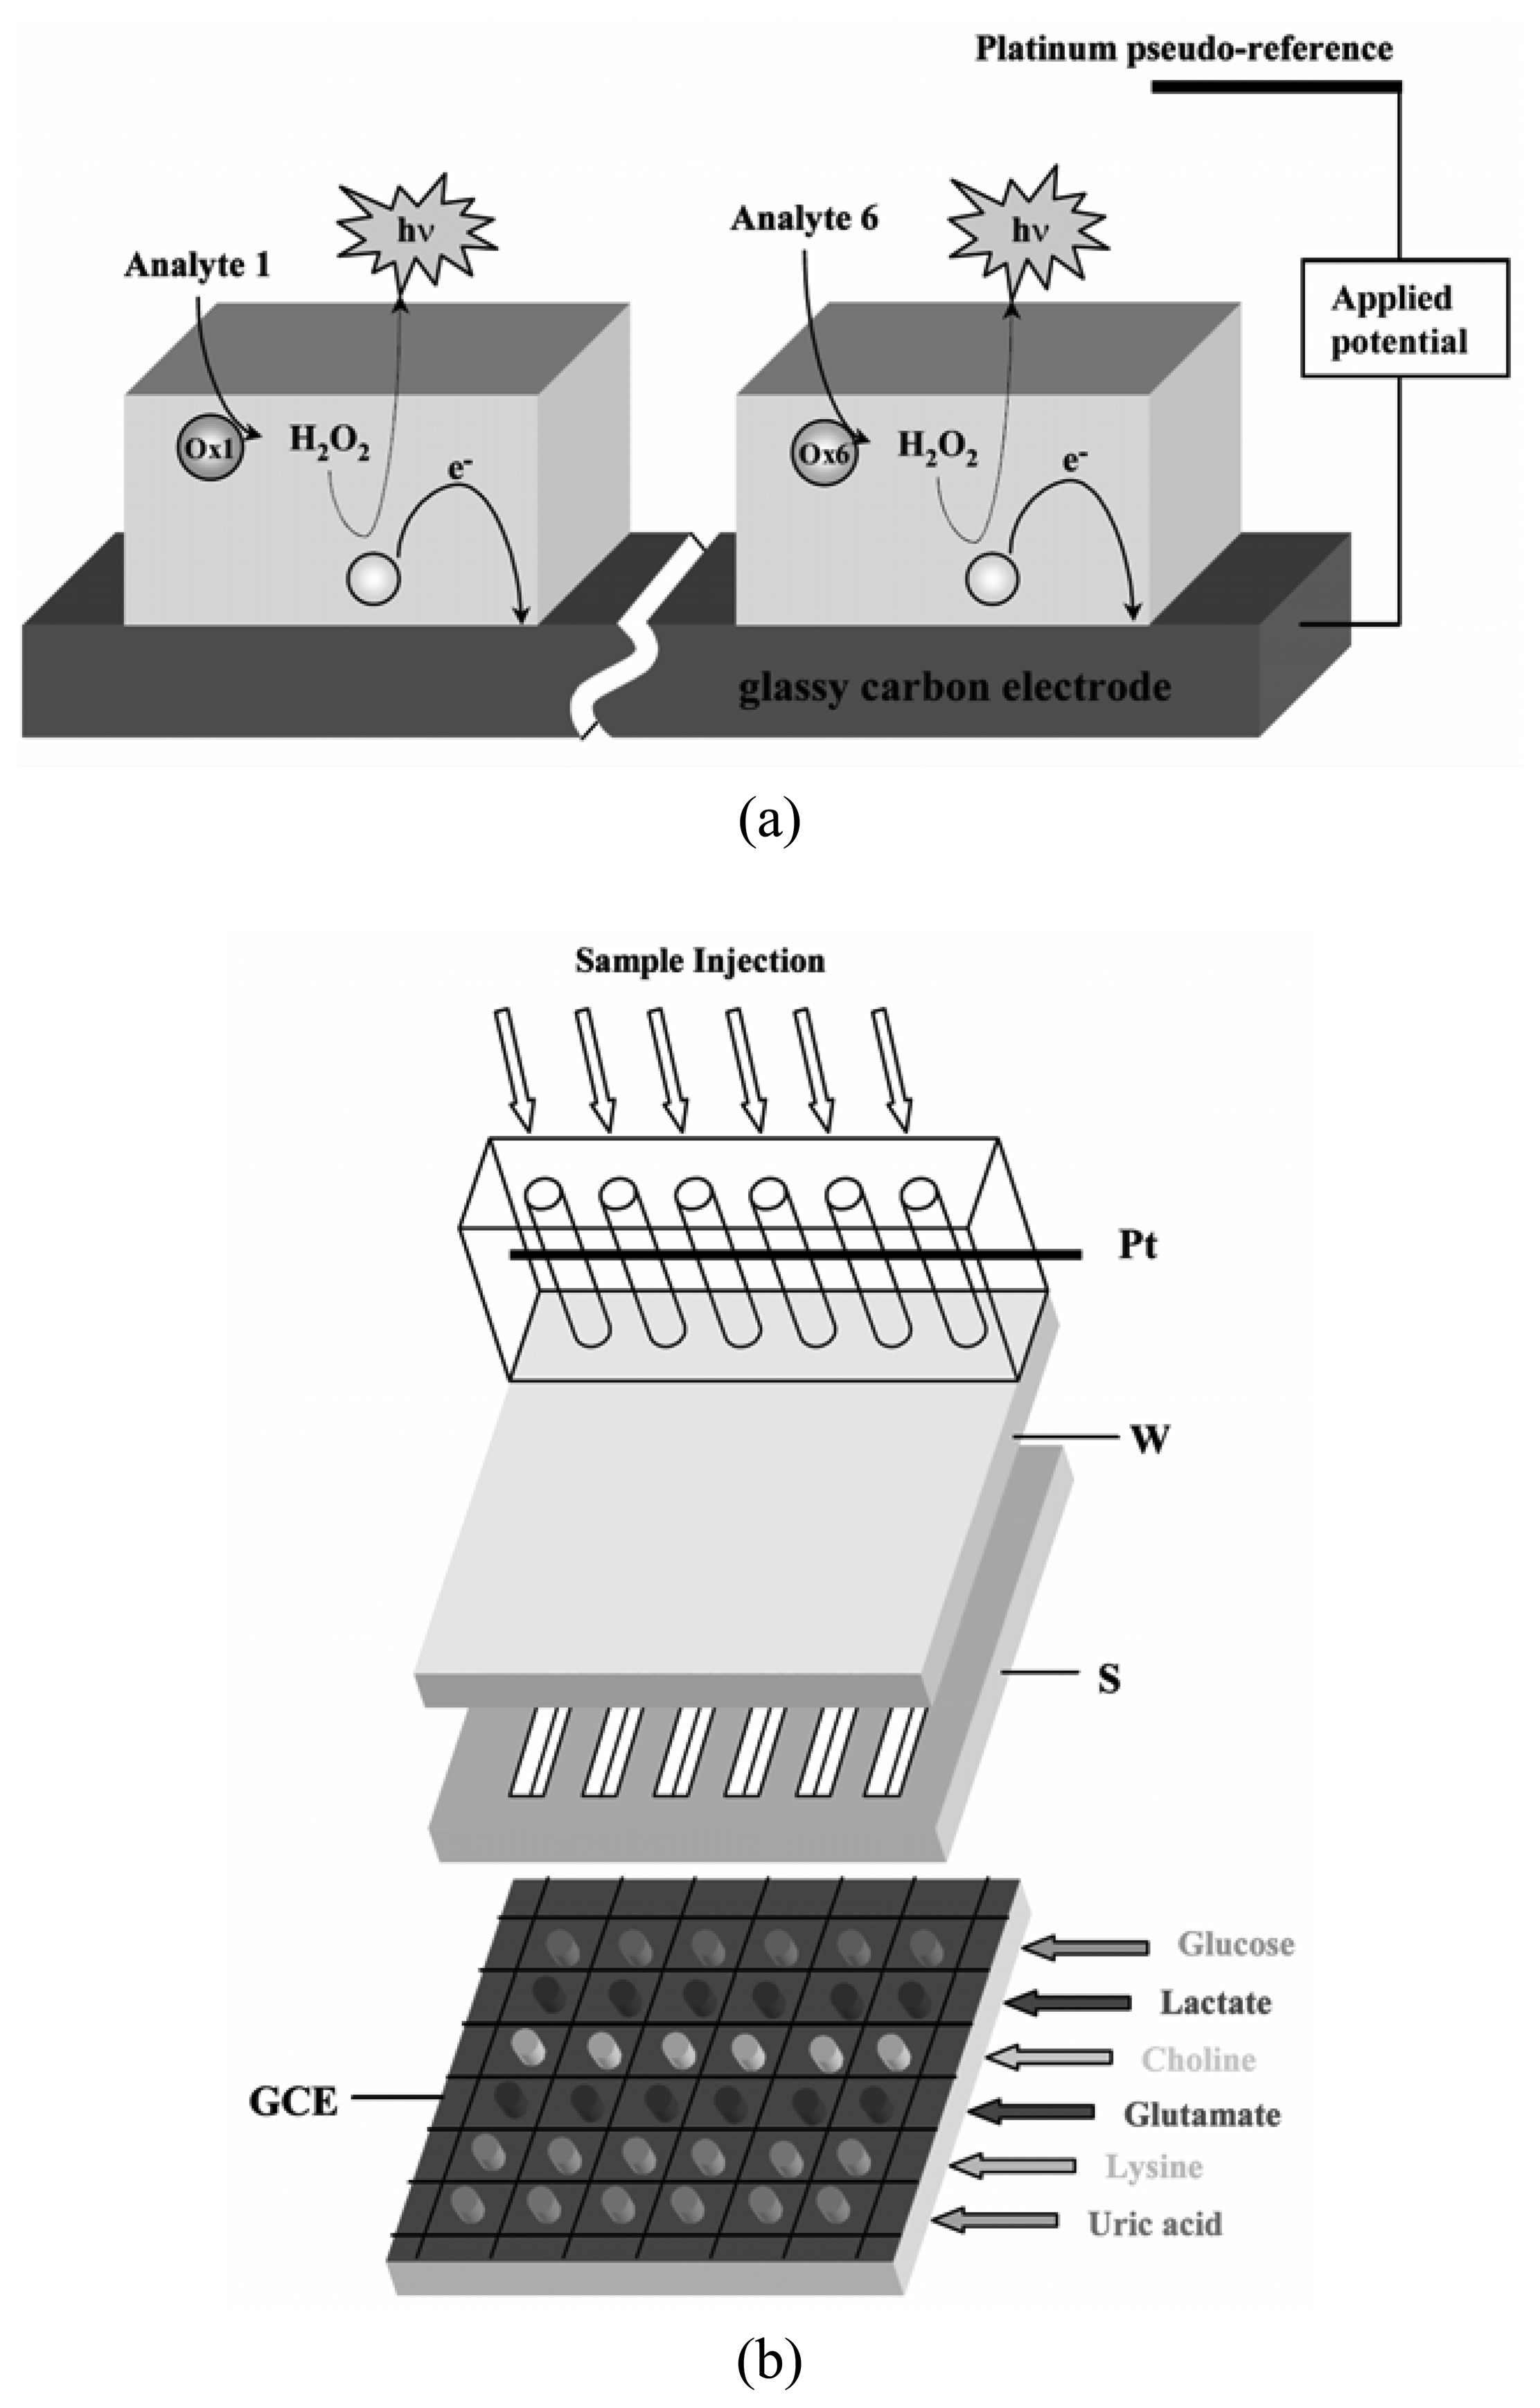
  44. Marquette, C.A.; Degiuli, A.; Blum, L.J. Electrochemiluminescent biosensors array for the concomitant detection of choline, glucose, glutamate, lactate, lysine and urate. Biosens. Bioelectron. 2003, 19, 433–439. [Google Scholar]
  45. Canepari, S.; Carunchio, V.; Girelli, A.M.; Messina, A. Determination of aspartate aminotransferase activity by high-performance liquid chromatography. J. Chromatogr. B 1994, 656, 191–195. [Google Scholar]
  46. Carunchio, V.; Castellano, R.; Girelli, A.M.; Messina, A. Simultaneous assay for aspartate aminotransferase and guanase in human serum by high-performance liquid chromatography. J. Chromatogr. B 1997, 689, 305–311. [Google Scholar]
  47. Ohmori, S.; Tanaka, Y.; Ikeda, M.; Hirota, K. A Sensitive determination of α-keto acids by gas-liquid chromatography and its application to the assay of l-glutamate Dehydrogenase and Aminotransferases. Anal. Biochem. 1981, 112, 204–212. [Google Scholar]
  48. Zhuang, X.W.; Ha, T.J.; Kim, H.D.; Centner, T.; Labeit, S.; Chu, S. Fluorescence quenching: A tool for single-molecule protein-folding study. PNAS 2000, 97, 14241–14244. [Google Scholar]
  49. Takeuchi, T.; Sumida, J. Indirect detection of halide ions via fluorescence quenching of quinine sulfate in microcoluman ion chromatograph. Anal. Sci. 2004, 20, 983–985. [Google Scholar]
  50. Rietz, B.; Guilbault, G.G. Fluorimetric assay of serum glutamate oxaloacetate transaminase, glutamate pyruvate transaminase and α-hydroxybutyrate dehydrogenàse by solution and solid surface fluorescent methods. Anal. Chim. Acta 1975, 77, 191–198. [Google Scholar]
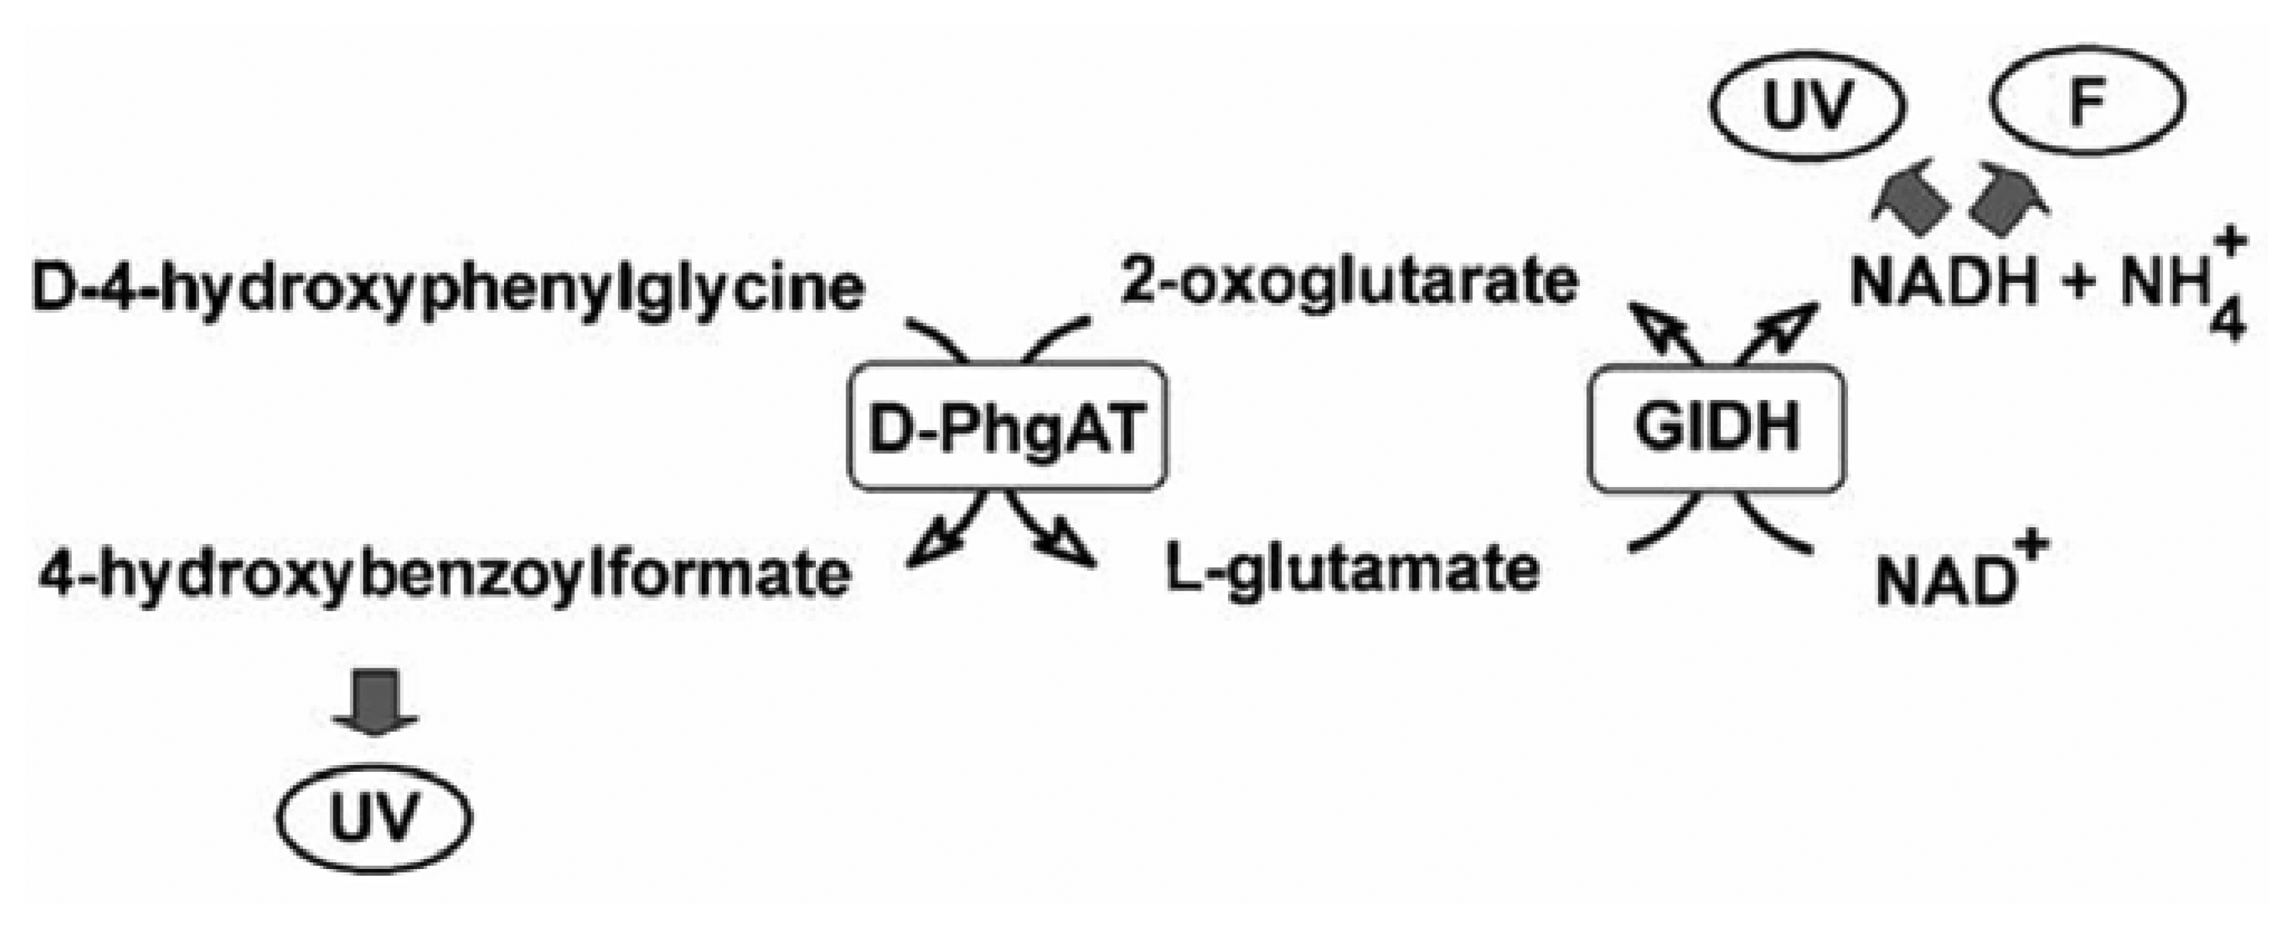
  51. Khampha, W.; Yakovleva, J.; Isarangkul, D.; Wiyakrutta, S.; Meevootisom, V.; Emnéus, J. Specific detection of l-glutamate in food using flow-injection analysis and enzymatic recycling of substrate. Anal. Chim. Acta 2004, 518, 127–135. [Google Scholar]
  52. Bonizzoni, M.; Fabbrizzi, L.; Piovani, G.; Taglietti, A. Fluorescent detection of glutamate with a dicopper(II) polyamine cage. Tetrahedron 2004, 60, 11159–11162. [Google Scholar]
  53. Okumoto, S.; Looger, L.L.; Micheva, K.D.; Reimer, R.J.; Smith, S.J.; Frommer, W.B. Detection of glutamate release from neurons by genetically encoded surface-displayed FRET nanosensors. PNAS 2005, 102, 8740–8745. [Google Scholar]
  54. Parvin, R.; Caramancion, M.N.V.; Pande, S.V. Convenient rapid determination of picomole amounts of oxaloacetate and aspartate. Anal. Biochem. 1980, 104, 296–299. [Google Scholar]
  55. Garrison, D.; Beattie, J.; Namboodiri, M.A.A. A radiochemical microassay for aspartate aminotransferase activity in the nervous system. Anal. Biochem. 1988, 172, 96–103. [Google Scholar]
  56. Perales, M.A.; Sener, A.; Malaisse, W.J. Radioisotopic assay of aspartate and alanine aminotransferase. Clin. Biochem. 1992, 25, 105–107. [Google Scholar]
  57. He, Y.N.; Chen, H.Y. An improved ELISA for the determination of thyroglobulin with differential pulse voltammetry. Anal. Lett. 1996, 29, 2463–2474. [Google Scholar]
  58. You, T.Y.; Niwa, O.; Kurita, R.; Iwasaki, Y.; Hayashi, K.; Suzuki, K.; Hirono, S. Reductive H2O2 detection at nanoparticle iridium/carbon film flectrode and its application as l-glutamate enzyme sensor. Electroanalysis 2004, 16, 54–59. [Google Scholar]
  59. Peguin, S.; Coulet, P.R.; Bardeletti, G. Pyruvate oxidase and oxaloacetate decarboxylase enzyme electrodes Simultaneous Determination of Transaminases with a Two-electrode-based Analyzer. Anal. Chim. Acta 1989, 222, 83–93. [Google Scholar]
  60. Kihara, K.; Yasukawa, E.; Hayashi, M.; Hirose, S. Determination of glutamate-pyruvate transaminase activity in blood serum with a pyruvate oxidase/poly(vinyl chloride) membrane sensor. Anal. Chim. Acta 1984, 159, 81–86. [Google Scholar]
  61. Kihara, K.; Yasukawa, E.; Hirose, S. Sequential Determination of Glutamate oxalacetate transaminase and glutamate pyruvate transaminase activities in serum using an immobilized bienzyme-poly(viny1 chloride) membrane electrode. Anal. Chem. 1984, 56, 1876–1880. [Google Scholar]
  62. Xuan, G.S.; Oh, S.W.; Choi, E.Y. Development of an electrochemical immunosensor for alanine aminotransferase. Biosens. Bioelectron. 2003, 19, 365–371. [Google Scholar]
  63. Pan, S.; Arnold, M.A. Selectivity enhancement for glutamate with a Nafion/glutamate oxidase biosensor. Talanta 1996, 43, 1157–1162. [Google Scholar]
  64. Ye, B.C.; Li, Q.S.; Li, Y.R.; Li, X.B.; Yu, J.T. l-glutamate biosensor using a novel l-glutamate oxidase and its application to flow injection analysis system. J. Biotechnol. 1995, 42, 45–52. [Google Scholar]
  65. Oldenziel, W.H.; Westerink, B.H.C. Improving glutamate Microsensors by optimizing the composition of the redox hydrogel. Anal. Chem. 2005, 77, 5520–5528. [Google Scholar]
  66. Rahman, M.A.; Kwon, N.H.; Won, M.S.; Choe, E.S.; Shim, Y.B. Functionalized conducting polymer as an enzyme-immobilizing substrate: an amperometric glutamate microbiosensor for in vivo measurements. Anal. Chem. 2005, 77, 4854–4860. [Google Scholar]
  67. Castillo, J.; Blöchl, A.; Dennison, S.; Schuhmann, W.; Csöregi, E. Glutamate detection from nerve cells using a planar electrodes array integrated in a microtiter plate. Biosens. Bioelectron. 2005, 20, 2116–2119. [Google Scholar]
  68. Castillo, J.; Isik, S.; Blöchl, A.; Pereira-Rodrigues, N.; Bedioui, F.; Csöregi, E.; Schuhmann, W.; Oni, J. Simultaneous detection of the release of glutamate and nitric oxide from adherently growing cells using an array of glutamate and nitric oxide selective electrodes. Biosens. Bioelectron. 2005, 20, 1559–1565. [Google Scholar]
  69. O'Neill, R.D.; Chang, S.C.; Lowry, J.P.; McNeil, C.J. Comparisons of platinum, gold, palladium and glassy carbon as electrode materials in the design of biosensors for glutamate. Biosens. Bioelectron. 2004, 19, 1521–1528. [Google Scholar]
  70. Mikeladze, E.; Schulte, A.; Mosbach, M.; Blöchl, A.; Csöregi, E.; Solomonia, R.; Schuhmann, W. Redox hydrogel-based bienzyme microelectrodes for amperometric monitoring of l-glutamate. Electroanalysis 2002, 14, 393–399. [Google Scholar]
  71. Compagnone, D.; Federici, G.; Massoud, R.; Santoro, L.; Anichini, M.; Palleschi, G. Analysis for transaminases in serum with an amperometric glutamate electrode. Clin. Chem. 1992, 38, 2306–2310. [Google Scholar]
  72. Cooper, J.M.; McNeil, C.J.; Spoors, J.A. Amperometric enzyme electrode for the determination of aspartate aminotransferase and alanine aminotransferase in serum. Anal. Chim. Acta 1991, 245, 57–62. [Google Scholar]
  73. Mizutani, F.; Yabuki, S.; Hirata, Y. Amperometric L-lactate sensing electrode based on polyion complex layer containing lactate oxidase: application to serum and milk samples. Anal. Chim. Acta 1995, 314, 233–239. [Google Scholar]
  74. Mizutani, F.; Yabuki, S.; Hirata, Y. Amperometric biosensors using poly-L-lysine: poly (4-styrenesulfonate) membranes with immobilized enzymes. Denki Kagaku 1995, 63, 1100–1105. [Google Scholar]
  75. Mizutani, F.; Yabuki, S.; Hirata, Y. Flow injection analysis of L-lactic acid using an enzyme-polyion complex-coated electrode as the detector. Talanta 1996, 43, 1815–1820. [Google Scholar]
  76. Mizutani, F.; Yabuki, S.; Iijima, S. Amperometric alcohol-sensing electrode based on a polyion complex membrane containing alcohol oxidase. Anal. Sci. 1997, 13, 83–87. [Google Scholar]
  77. Mizutani, F.; Sato, Y.; Hirata, Y.; Sawaguchi, T.; Yabuki, S. Glucose oxidase–polyion complex-bilayer membrane for elimination of electroactive interferents in amperometric glucose sensor. Anal. Chim. Acta 1998, 364, 173–179. [Google Scholar]
  78. Mizutani, F.; Sato, Y.; Sawaguchi, T.; Yabuki, S.; Iijima, S. Rapid measurement of transaminase activities using an amperometric l-glutamate-sensing electrode based on a glutamate oxidase-polyion complex-bilayer membrane. Sens. Actuators B 1998, 52, 23–29. [Google Scholar]
  79. Sohn, B.K.; Cho, B.W.; Kim, C.S.; Kwon, D.H. ISFET glucose and sucrose sensors by using platinum electrode and photo-crosslinkable polymers. Sens. Actuators B 1997, 41, 7–11. [Google Scholar]
  80. Jaffrezic-Renault, N.; Senillou, A.; Martelet, C.; Wan, K.; Chovelon, J.M. ISFET microsensors for the detection of pollutants in liquid media. Sens. Actuators B 1999, 59, 154–164. [Google Scholar]
  81. Renneberg, R.; Sonomoto, K.; Katoh, S.; Tanaka, A. Oxygen diffusivity of synthetic gels derived from polymers. Appl. Microbiol. Biotechnol. 1988, 28, 1–7. [Google Scholar]
  82. Rouillon, R.; Tocabensand, M.; Marty, J.L. Stabilization of chloroplasts by entrapment in polyvinylalcohol bearing styrylpyridinium groups. Anal. Lett. 1994, 27, 2239–2248. [Google Scholar]
  83. Perdomo, J.; Sundermeier, C.; Hinkers, H.; Martínez Morell, O.; Seifert, W.; Knoll, M. Containment sensors for the determination of L-lactate and glucose. Biosens. Bioelectron. 1999, 14, 27–32. [Google Scholar]
  84. Chi, Q.J.; Dong, S.J. Flow-injection analysis of glucose at an amperometric glucose sensor based on electrochemical deposition of palladium and glucose oxidase on a glassy carbon electrode. Anal. Chim. Acta 1993, 278, 17–23. [Google Scholar]
  85. Dong, S.J.; Deng, Q.; Cheng, G.J. Cholesterol sensor based on electrodeposition of catalytic palladium particles. Anal. Chim. Acta 1993, 279, 235–240. [Google Scholar]
  86. Moser, I.; Jobst, G.; Aschauer, E.; Svasek, P.; Varahram, M.; Urban, G. Miniaturized thin film glutamate and glutamine biosensors. Biosens. Bioelectron. 1995, 10, 527–532. [Google Scholar]
  87. Moser, I.; Jobst, G.; Svasek, P.; Varahram, M.; Urban, G. Rapid liver enzyme assay with miniaturized liquid handling system comprising thin film biosensor array. Sens. Actuators B 1997, 44, 377–380. [Google Scholar]
  88. Suman, S.; Singhal, R.; Sharma, A.L.; Malthotra, B.D.; Pundir, C.S. Development of a lactate biosensor based on conducting copolymer bound lactate oxidase. Sens. Actuators B 2005, 107, 768–772. [Google Scholar]
  89. Kwan, R.C.H.; Hon, P.Y.T.; Mak, K.K.W.; Renneberg, R. Amperometric determination of lactate with novel trienzyme/poly(carbamoyl) sulfonate hydrogel-based sensor. Biosens. Bioelectron. 2004, 19, 1745–1752. [Google Scholar]
  90. Erickson, D.; Li, D.Q. Integrated microfluidic devices. Anal. Chim. Acta 2004, 507, 11–26. [Google Scholar]
  91. Erickson, D.; Liu, X.Z.; Krull, U.; Li, D.Q. Electrokinetically controlled DNA hybridization microfluidic chip enabling rapid target analysis. Anal. Chem. 2004, 76, 7269–7277. [Google Scholar]
  92. Yamaguchi, A.; Jin, P.; Tsuchiyama, H.; Masuda, T.; Sun, K.; Matsuo, S.; Misawa, H. Rapid fabrication of electrochemical enzyme sensor chip using polydimethylsiloxane microfluidic channel. Anal. Chim. Acta 2002, 468, 143–152. [Google Scholar]
  93. Lv, Y.; Zhang, Z.J.; Chen, F.N. Chemiluminescence microfluidic system sensor on a chip for determination of glucose in human serum with immobilized reagents. Talanta 2003, 59, 571–576. [Google Scholar]
  94. Yun, K.S.; Lee, D.H.; Kim, M.S.; Kim, H.S.; Lee, G.M.; Yoon, E. High throughput bio-molecule detection using microbead-based assay with quantum dot fluorescence in a microfluidic chip. Proceedings of International Conference on Miniaturized Systems for Chemistry and Life Sciences (micro TAS'04), Malmo, Sweden, September. 2004; pp. 222–224.
  95. Kim, J.H.; Kim, B.G.; Nam, H.; Park, D.E.; Yun, K.S.; Yoon, J.B.; You, J.; Yoon, E. A disposable DNA sample preparation microfluidic chip for nucleic acid probe assay. IEEE International MEMS Conference 2002, Las Vegas, USA, Jan. 2002; pp. 133–136.
  96. Im, M.S.; Cho, I.J.; Yun, K.S.; Yoon, E. An electronmagnetically actuated polymer micro-pen for picoliter biological assay patterning. 13th International Conference on Solid-State Sensors and Actuators (Transducers'05), Digest of Technical Papers Seoul, Korea, June. 2005; pp. 1588–1591.
  97. Yun, K.S.; Yoon, E. Micro/Nanofluidic device for single-cell-based assay. Biomed. Microdevices 2005, 7, 35–40. [Google Scholar]
Figure 1. (Left) Cross-sectional illustration of the chip for measurement of γ-GTP, GOT and GPT. (Right) Illustrations and photographs of actual operation of mixing chip [26].
Sensors 06 00756f1
Figure 2. Open-closed configuration for determination of GPT. P.1, P.2: peristaltic pump; I.S.: injection system; S.V.: selecting valve; R1, R2, R3: Tris buffer; IMER: enzymatic reactor; L1, L2, L3: reactor; D: spectrophotometer flow-cell; P.C: computer; P: printer[37].
Sensors 06 00756f2
Figure 3. Schematic representation of the sensing layer organisation and reaction. (a) The Ox1 and Ox6 sphere represent the oxidase charged beads, the green sphere represents the luminol supporting beads. (b) Organisation of the ECL multifunctional bio-sensing chip. GCE: glassy carbon electrode, Pt: platinum pseudo-reference electrode, S: silicone spacer, W: plexiglas window [44].
Sensors 06 00756f3
Figure 4. Enzymatic cycling for the determination of 0.4 (fluorescence) and 0.7 (UV) μM l-glutamate using GlDH and D-PhgAT. Each turn of the cycle generates one molecule each of NADH and 4-hydroxybenzoylformate, which were detected by UV absorbance at 340 nm. NADH was also detected fluorometrically (λex = 340 nm, λem = 460 nm) [51].
Sensors 06 00756f4
Figure 5. (Left) The sequence of electrochemical redox reactions of the two layers of antibody immobilized- and enzyme absorbed-membranes, and a mediator gold electrode. (1) Anti-GPT antibody-immobilized or bare-outer nylon membrane; (2) PyO-absorbed inner nylon membrane; (3) SAM-coated gold-working electrode. (Right) Cyclic voltammograms of GPT immunosensor at different concentrations of l-alanine and α-ketoglutarate in PBS (pH 7.4). a, b, c, d, e, and f represent the profiles of oxidation current response at 0, 6.98×10⁻⁶, 1.30×10⁻⁵, 1.84×/10-5, 2.31×10⁻⁵ and 2.73×/10-5 M l-alanine and α-ketoglutarate, respectively [62].
Sensors 06 00756f5
Figure 6. The Schematic diagram of (a) the FIA apparatus and (b) the flow through cell. PS: potentiostat; C: carrier; PM: potentiometer; AE: auxiliary electrode; RE: reference electrode; WE: working electrode; S: sample; V: valve; W: waste; R: recorder. 1: outlet; 2: reference electrode chamber; 3: auxiliary electrode chamber; 4: inlet; 5: enzyme electrode chamber; 6: cable; 7: Teflon; 8: platinum wire enzyme electrode [64].
Sensors 06 00756f6
Figure 7. (Left) Design of a Pt microelectrode (25 μm) and schematic representation of the fabrication of a GlOx/nano-CP/Pt microbiosensor. (Right) AFM images (scale bar, 750 nm) of (a) a bare HOPG electrode and (b)-(d) nano-CP grown onto the HOPG electrodes through electropolymerization using cyclic voltammetry at a scan rate of (b) 0.1, (c) 0.5, and (d) 1.0 V s-1 [66].
Sensors 06 00756f7
Figure 8. (Left) Representation of the array of electrode employed in this study: i, ii and iii are working electrodes; iv, v and vi are counter electrodes; and vii is the reference electrode. (Right) Photograph of the well plate with and without the membrane insert positioned over the integrated electrodes on the bottom [68].
Sensors 06 00756f8
Figure 9. Schematic diagram displaying the enzyme and electrode reactions involved in the GPT activity determination at an SPCS/Pd/PVA-SbQ/L-GlOx electrode [40].
Sensors 06 00756f9
Figure 10. (Left) Schematic top view of the microsystem. (Right) Schematic cross section of the integrated device [87].
Sensors 06 00756f10
Figure 11. Schematic diagram of a SHL/LDH/PyOD trienzyme lactate biosensor (SHL: salicylate hydroxylase, LDH: L-lactate dehydrogenase, PyOD: pyruvate oxidase) [89].
Sensors 06 00756f11

