Calibration of a Sensor Array (an Electronic Tongue) for Identification and Quantification of Odorants from Livestock Buildings

Abstract
:1. Introduction
2. Experimental
2.1. Sensor array, i.e. the electronic tongue (ET)
2.2. Preparation of test mixtures of key odorants
2.3. Experimental design
2.4. Multivariate data analysis
2.5. Artificial neural networks (ANNs)
3. Results and discussion
3.1. Test mixtures of key odorants containing ammonium at pH 6
3.2. Test mixtures of key odorants containing p-cresolate at pH 6
3.3. Test mixtures of key odorants containing ammonium at pH 8
3.4. Test mixtures of key odorants containing p-cresolate at pH 8
3.5. Potential of ET for on-line measurement of odorants
4. Conclusion
Acknowledgments
References
- Schiffman, S. S.; Bennett, J. L.; Raymer, J. H. Quantification of odors and odorants from swine operations in North Carolina. Agr. Forest Meteorol. 2001, 108, 123–240. [Google Scholar]
- Powers, W. J. Keeping science in environmental regulations: The role of the animal scientist. J. Dairy Sci. 2003, 86, 1045–1051. [Google Scholar]
- Persaud, K. C.; Khaffaf, S. M.; Payne, J. S.; Pisanelli, A. M.; Lee, D. H.; Byun, H. G. Sensor array techniques for mimicking the mammalian olfactory system. Sens. Actuator B-Chem. 1996, 36, 267–273. [Google Scholar]
- Sarig, Y. Potential applications of artificial olfactory sensing for quality evaluation of fresh produce - review. J. Agr. Eng. Res. 2000, 77, 239–258. [Google Scholar]
- Schiffman, S. S.; Miller, E. A. S.; Suggs, M. S.; Graham, B. G. The effect of environmental odors emanating from commercial swine operations on the mood of nearby residents. Brain Res. Bull. 1995, 37, 369–375. [Google Scholar]
- Revah, S.; Morgan-Sagastume, J. M. Biotechnology for odor and air pollution; Shareefdeen, Z., Singh, A., Eds.; Springer: New York, 2005; Vol. 1, Chapter 3; p. 29. [Google Scholar]
- Hansen, N. G.; Rindel, K. Bioscrubbing, an effective and economic solution to odour control at wastewater treatment plants. Water Sci. Technol. 2000, 41, 155–164. [Google Scholar]
- Kraakman, B. Biotechnology for odor and air pollution; Shareefdeen, Z., Singh, A., Eds.; Springer: New York, 2005; Vol. 1, Chapter 16; p. 355. [Google Scholar]
- Abu-Khalaf, N.; Haselmann, K. F.; Iversen, J. J. L. Identification and quantification of odorants in an air wet scrubber using direct aqueous injection-gas chromatography (DAI-GC) and solid phase extraction-gas chromatography (SPE-GC). Submitted for publication.
- Shin, H. S.; Ahn, H. S. Simple, rapid, and sensitive determination of odorous compounds in water by GC-MS. Chromatographia 2004, 59, 107–113. [Google Scholar]
- Kim, H.; Murthy, S.; McConnell, L. L.; Peot, C.; Ramirez, M.; Strawn, M. Characterization of wastewater and solids odors using solid phase microextraction at a large wastewater treatment plant. Water Sci. Technol. 2002, 46, 9–16. [Google Scholar]
- Razote, E. B.; Maghirang, R. G.; Seitz, L. M.; Jeon, I. J. Characterization of volatile organic compounds on airborne dust in a swine finishing barn. Trans. ASAE 2004, 47, 1231–1238. [Google Scholar]
- Gostelow, P.; Parsons, S. A.; Stuetz, R. M. Odour measurements for sewage treatment works. Water Res. 2001, 35, 579–597. [Google Scholar]
- Vlasov, Y.; Legin, A.; Rudnitskaya, A. Electronic tongues and their analytical application -review. Anal. Bioanal. Chem. 2002, 373, 136–146. [Google Scholar]
- Legin, A.; Rudnitskaya, A.; Vlasov, Y.; Di Natale, C.; Davide, F.; D' Amico, A. Tasting of beverages using an electronic tongue. Sens. Actuator B-Chem. 1997, 44, 291–296. [Google Scholar]
- Legin, A.; Rudnitskaya, A.; Vlasov, Y.; Di Natale, C.; Mazzone, E.; D' Amico, A. Application of electronic tongue for quantitative analysis of mineral water and wine. Electroanalysis 1999, 11, 814–820. [Google Scholar]
- Turner, C.; Rudnitskaya, A.; Legin, A. Monitoring batch fermentation with an electronic tongue. J. Biotechnol. 2003, 103, 87–91. [Google Scholar]
- Legin, A.; Kirsanov, D.; Rudnitskaya, A.; Iversen, J. J. L.; Seleznev, B.; Esbensen, K. H.; Mortensen, J.; Houmoller, L. P.; Vlasov, Y. Multicomponent analysis of fermentation growth media using the electronic tongue (ET). Talanta 2004, 64, 766–772. [Google Scholar]
- Rudnitskaya, A. L. A.; Seleznev, B.; Vlasov, Y. Recognition of liquid and flesh food using an ‘electronic tongue’. Int. J. Food Sci. Technol. 2002, 37, 375–385. [Google Scholar]
- Auger, J.; Arnault, I.; Legin, A.; Rudnitskaya, A.; Seleznev, B.; Sparfel, G.; Dore, C. Comparison of gas chromatography-mass spectrometry and electronic tongue analysis for the classification of onions and shallots. Int. J. Environ. Anal. Chem. 2005, 85, 971–980. [Google Scholar]
- Gouma, P.; Sberveglieri, G.; Dutta, R.; Gardner, J.W.; Hines, E. L. Novel materials and applications of electronic noses and tongues. MRS Bull. 2004, 29, 697–700. [Google Scholar]
- Winquist, F.; Krantz-Rulcker, C.; Lundstrom, I. Electronic tongues. MRS Bull. 2004, 29, 726–731. [Google Scholar]
- Soderstrom, C.; Boren, H.; Winquist, F.; Krantz-Rulcker, C. Use of an electronic tongue to analyse mold growth in liquid media. Int. J. Food Microbiolo. 2003, 83, 253–261. [Google Scholar]
- O'Neil, D. H.; Philips, V. R. A review of the control of odor nuisance from livestock buildings: part 3, properties of the odorous substances which have been identified in livestock wastes or in the air around. J. Agr. Eng. Res. 1992, 53, 23–50. [Google Scholar]
- Singh, A.; Ward, O. Biotechnology for odor and air pollution; Shareefdeen, Z., Singh, A., Eds.; Springer: New York, 2005; Vol. 1, Chapter 5; p. 101. [Google Scholar]
- McNevin, D.; Barford, J. Biofiltration as an odour abatement strategy. Biochem. Eng. J. 2000, 5, 231–242. [Google Scholar]
- Pravdova, V.; Pravda, M.; Guilbault, G. G. Role of chemometrics for electrochemical sensors. Anal. Lett. 2002, 35, 2389–2419. [Google Scholar]
- Kirk, R. E.; Othmer, D. F. Encyclopedia of chemical technology; John Wiley & Sons, Inc.: New York, 1991; pp. 162–163. [Google Scholar]
- Le, P. D.; Aarnink, A. J. A.; Ogink, N. W. M.; Becker, P. M.; Verstegen, M. W. A. Odour from animal production facilities: its relationship to diet. Nutr. Res. Rev. 2005, 18, 3–30. [Google Scholar]
- Datta, I.; Allen, G. Biotechnology for odor and air pollution; Shareefdeen, Z., Singh, A., Eds.; Springer: New York, 2005; Vol. 1, Chapter 6; p. 126. [Google Scholar]
- Squillace, P. J.; Pankow, J. F.; Korte, N. E.; Zogorski, J. S. Review of the environmental behavior and fate of methyl tert-butyl ether. Environ. Toxicol. Chem. 1997, 16, 1836–1844. [Google Scholar]
- Budavari, S.; O'Neil, M. J.; Smith, A.; Heckelman, P. E.; Kinneary, J. F. The Merck index: an encyclopedia of chemicals, drugs and biologicals; Merck Research Laboratories: Whitehouse Station, NJ, 1996; p. 1468. [Google Scholar]
- Syracuse Research Corporation 2005. Interactive PhysProp Database Demo. http://www.syrres.com/esc/physdemo.htm visited on 8, March, 2004.
- Williams, P. C. Near Infrared Technology in the Agricultural and Food Industries; Williams, P., Norris, K. H., Eds.; American Association of Cereal Chemists: St. Paul, MN, USA, 2001; Vol. 2, Chapter 8; p. 145. [Google Scholar]
- Despagne, F.; Massart, D. L. Neural networks in multivariate calibration. Analyst 1998, 123, 157R–178R. [Google Scholar]
- Jurs, P. C.; Bakken, G. A.; McClelland, H. E. Computational methods for the analysis of chemical sensor array data from volatile analytes. Chem. Rev. 2000, 100, 2649–2678. [Google Scholar]
- Burns, J. A.; Whitesides, G. M. Feed-forward neural networks in chemistry - mathematical systems for classification and pattern-recognition. Chem. Rev. 1993, 93, 2583–2601. [Google Scholar]
- Richards, E.; Bessant, C.; Saini, S. Multivariate data analysis in electroanalytical chemistry -review. Electroanalysis 2002, 14, 1533–1542. [Google Scholar]
- Svozil, D.; Kvasnicka, V.; Pospichal, J. Introduction to multi-layer feed-forward neural networks. Chemom. Intell. Lab. Syst. 1997, 39, 43–62. [Google Scholar]
- Wold, S.; Sjostrom, M.; Eriksson, L. PLS-regression: a basic tool of chemometrics. Chemom. Intell. Lab. Syst. 2001, 58, 109–130. [Google Scholar]
- Dieterle, F.; Busche, S.; Gauglitz, G. Different approaches to multivariate calibration of nonlinear sensor data. Anal. Bioanal. Chem. 2004, 380, 383–396. [Google Scholar]
- Lammertyn, J.; Peirs, A.; De Baerdemaeker, J.; Nicolai, B. Light penetration properties of NIR radiation in fruit with respect to non-destructive quality assessment. Postharvest Biol. Technol. 2000, 18, 121–132. [Google Scholar]
- Copper, J. The use of artificial neural networks for knowledge discovery in bioinformatics. TIBETS 2004, 1, 144–153. [Google Scholar]
- Maier, H. R.; Dandy, G. C. Empirical comparison of various methods for training feed-forward neural networks for salinity forecasting. Water Resour. Res. 1999, 35, 2591–2596. [Google Scholar]
- NeuralWare. NeuralWorks Predict, The complete solution for neural data modeling, user guide; NeuralWare Inc.: Pittsburgh, 2003. [Google Scholar]
- Fearn, T. Assessing calibrations: SEP, RPD, PER and R2. NIR news 2002, 13, 12–14. [Google Scholar]
- Arogo, J.; Westerman, P. W.; Heber, A. J. A review of ammonia emissions from confined swine feeding operations. Trans. ASAE 2003, 46, 805–817. [Google Scholar]
- Vlasov, Y.; Legin, A.; Rudnitskaya, A.; Di Natale, C.; D'Amico, A. Nonspecific sensor arrays (“electronic tongue”) for chemical analysis of liquids (IUPAC Technical Report). Pure Appl. Chem. 2005, 77, 1965–1983. [Google Scholar]
- Soderstrom, C.; Rudnitskaya, A.; Legin, A.; Krantz-Rulcker, C. Differentiation of four Aspergillus species and one Zygosaccharomyces with two electronic tongues based on different measurement techniques. J. Biotechnol. 2005, 119, 300–308. [Google Scholar]
- Singh, A.; Shareefdeen, Z.; Ward, O.P. Biotechnology for odor and air pollution; Shareefdeen, Z., Singh, A., Eds.; Springer: New York, 2005; Vol. 1, Chapter 8; p. 167. [Google Scholar]
- Sheridan, B. A.; Curran, T. P.; Dodd, V. A. Biofiltration of n-butyric acid for the control of odour. Bioresour. Technol. 2003, 89, 199–205. [Google Scholar]
- Timmer, B.; Olthuis, W.; van den Berg, A. Ammonia sensors and their applications - a review. Sens. Actuator B-Chem. 2005, 107, 666–677. [Google Scholar]


| No. | Odorant | Chemical abstract service (CAS #) | Molecular formula | Molecularmass (g mol-1) | Solubility inH2O at 25°C(g l-1) | pKa | Henry's constant(H) atm. l. mol-1 | Vapourpressure at 25°C(mm Hg) | Octanol-waterpartitioncoefficient(log p) | Melting point °C | Boiling point °C |
|---|---|---|---|---|---|---|---|---|---|---|---|
| 1. | n-butyric acid | 107-92-6 | C4H8O2 | 88.11 | 60 | 4.82 | 5.35 × 10⁻⁴ | 1.65 | 0.79 | -5.7 | 163.7 |
| 2. | iso-valeric acid | 503-74-2 | C5H10O2 | 102.13 | 40.7 | 4.77 | 8.33 × 10⁻⁴ | 0.44 | 1.16 | -29.3 | 176.5 |
| 3. | phenol | 108-95-2 | C6H6O | 94.11 | 82.8 | 9.99 | 3.33 × 10⁻⁴ | 0.35 | 1.46 | 40.9 | 181.8 |
| 4. | 4-methyl phenol (p-cresol) | 106-44-5 | C7H8O | 108.14 | 21.5 | 10.3 | 1 × 10⁻³ | 0.11 | 1.94 | 35.5 | 201.9 |
| 5. | 3-methyl indole (skatole) | 83-34-1 | C9H9N | 131.18 | 0.498 | ≈ 16.7 a | 2.13 × 10⁻³ | 0.00555 | 2.60 | 97.5 | 266 |
| 6. | ammonia | 7664-41-7 | NH3 | 17.03 | 482 | 9.25 | 1.61 × 10⁻² | 7510 | 0.23 | -77.7 | -33.4 |
| Odorant | Dimensionlessair-water partitioncoefficient | Minimum key odorant concentration in air c | Maximum key odorant concentration in air c | Minimum equivalent equilibrium key odorant concentration in water d, e | Maximum equivalent equilibrium key odorant concentration in water d, e | Interval of concentrations used in experiments | |||
|---|---|---|---|---|---|---|---|---|---|
| (KAW)b | mg/m3 | mg/m3 | mg/m3 | M | mg/m3 | M | Minimum (M) | Maximum (M) | |
| n-butyric acid | 2.19 × 10⁻⁵ | 0.001 | 0.7 | 46 | 5.2 × 10⁻⁷ | 32 × 103 | 3.6 × 10⁻⁴ | 10-7 | 10-3 |
| iso-valeric acid | 3.40 × 10⁻⁵ | 0.002 | 0.21 | 59 | 5.8 × 10⁻⁷ | 62 × 102 | 6.0 × 10⁻⁵ | 10-7 | 10-4 |
| phenol | 1.36 × 10⁻⁵ | 0.001 | 0.0078 | 73 | 7.8 × 10⁻⁷ | 57 × 101 | 6.1 × 10⁻⁶ | 10-7 | 10-5 |
| p-cresol | 4.09 × 10⁻⁵ | 0.002 | 0.041 | 49 | 4.5 × 10⁻⁷ | 10 × 102 | 9.3 × 10⁻⁶ | 10-7 | 10-5 |
| skatole | 8.70 × 10⁻⁵ | 0.00049 | 0.003 | 5.6 | 4.3 × 10⁻⁸ | 34 | 2.6 × 10⁻⁷ | 10-8 | 10-6 |
| ammonia | 6.54 × 10⁻⁴ | 0.01 | 18 | 15 | 8.9 × 10⁻⁷ | 27 × 103 | 1.6 × 10⁻³ | 10-7 | 10-3 |
| Odorant | Mixture containing ammonium | Mixture containing p-cresolate | Minimum | Concentration numbers g | Maximum | ||||
|---|---|---|---|---|---|---|---|---|---|
| 1 | 2 | 3 | 4 | 5 | 6 | 7 | |||
 | |||||||||
| M | M | M | M | M | M | M | |||
| n-butyrate | X f | X | 10-7 | 10-6 | 10-5 | 5 × 10⁻⁵ | 10-4 | 5 × 10⁻⁴ | 10-3 |
| iso-valerate | X | X | 10-7 | 5 × 10⁻⁷ | 10-6 | 5 × 10⁻⁶ | 10-5 | 5 × 10⁻⁵ | 10-4 |
| phenolate | X | X | 10-7 | 3 × 10⁻⁷ | 5 × 10⁻⁷ | 10-6 | 3 × 10⁻⁶ | 5 × 10⁻⁶ | 10-5 |
| p-cresolate | X | 10-7 | 3 × 10⁻⁷ | 5 × 10⁻⁷ | 10-6 | 3 × 10⁻⁶ | 5 × 10⁻⁶ | 10-5 | |
| skatole | X | X | 10-8 | 3 × 10⁻⁸ | 5 × 10⁻⁸ | 10-7 | 3 × 10⁻⁷ | 5 × 10⁻⁷ | 10-6 |
| ammonium | X | 10-7 | 5 × 10⁻⁶ h / 10-6 | 10-5 | 5 × 10⁻⁵ | 10-4 | 5 × 10⁻⁴ | 10-3 | |
| pH | Test mixture of key odorants | Sufficient electrodes out of 14 | Key odorant i | Identified (I) and quantified (Q) key odorant |
|---|---|---|---|---|
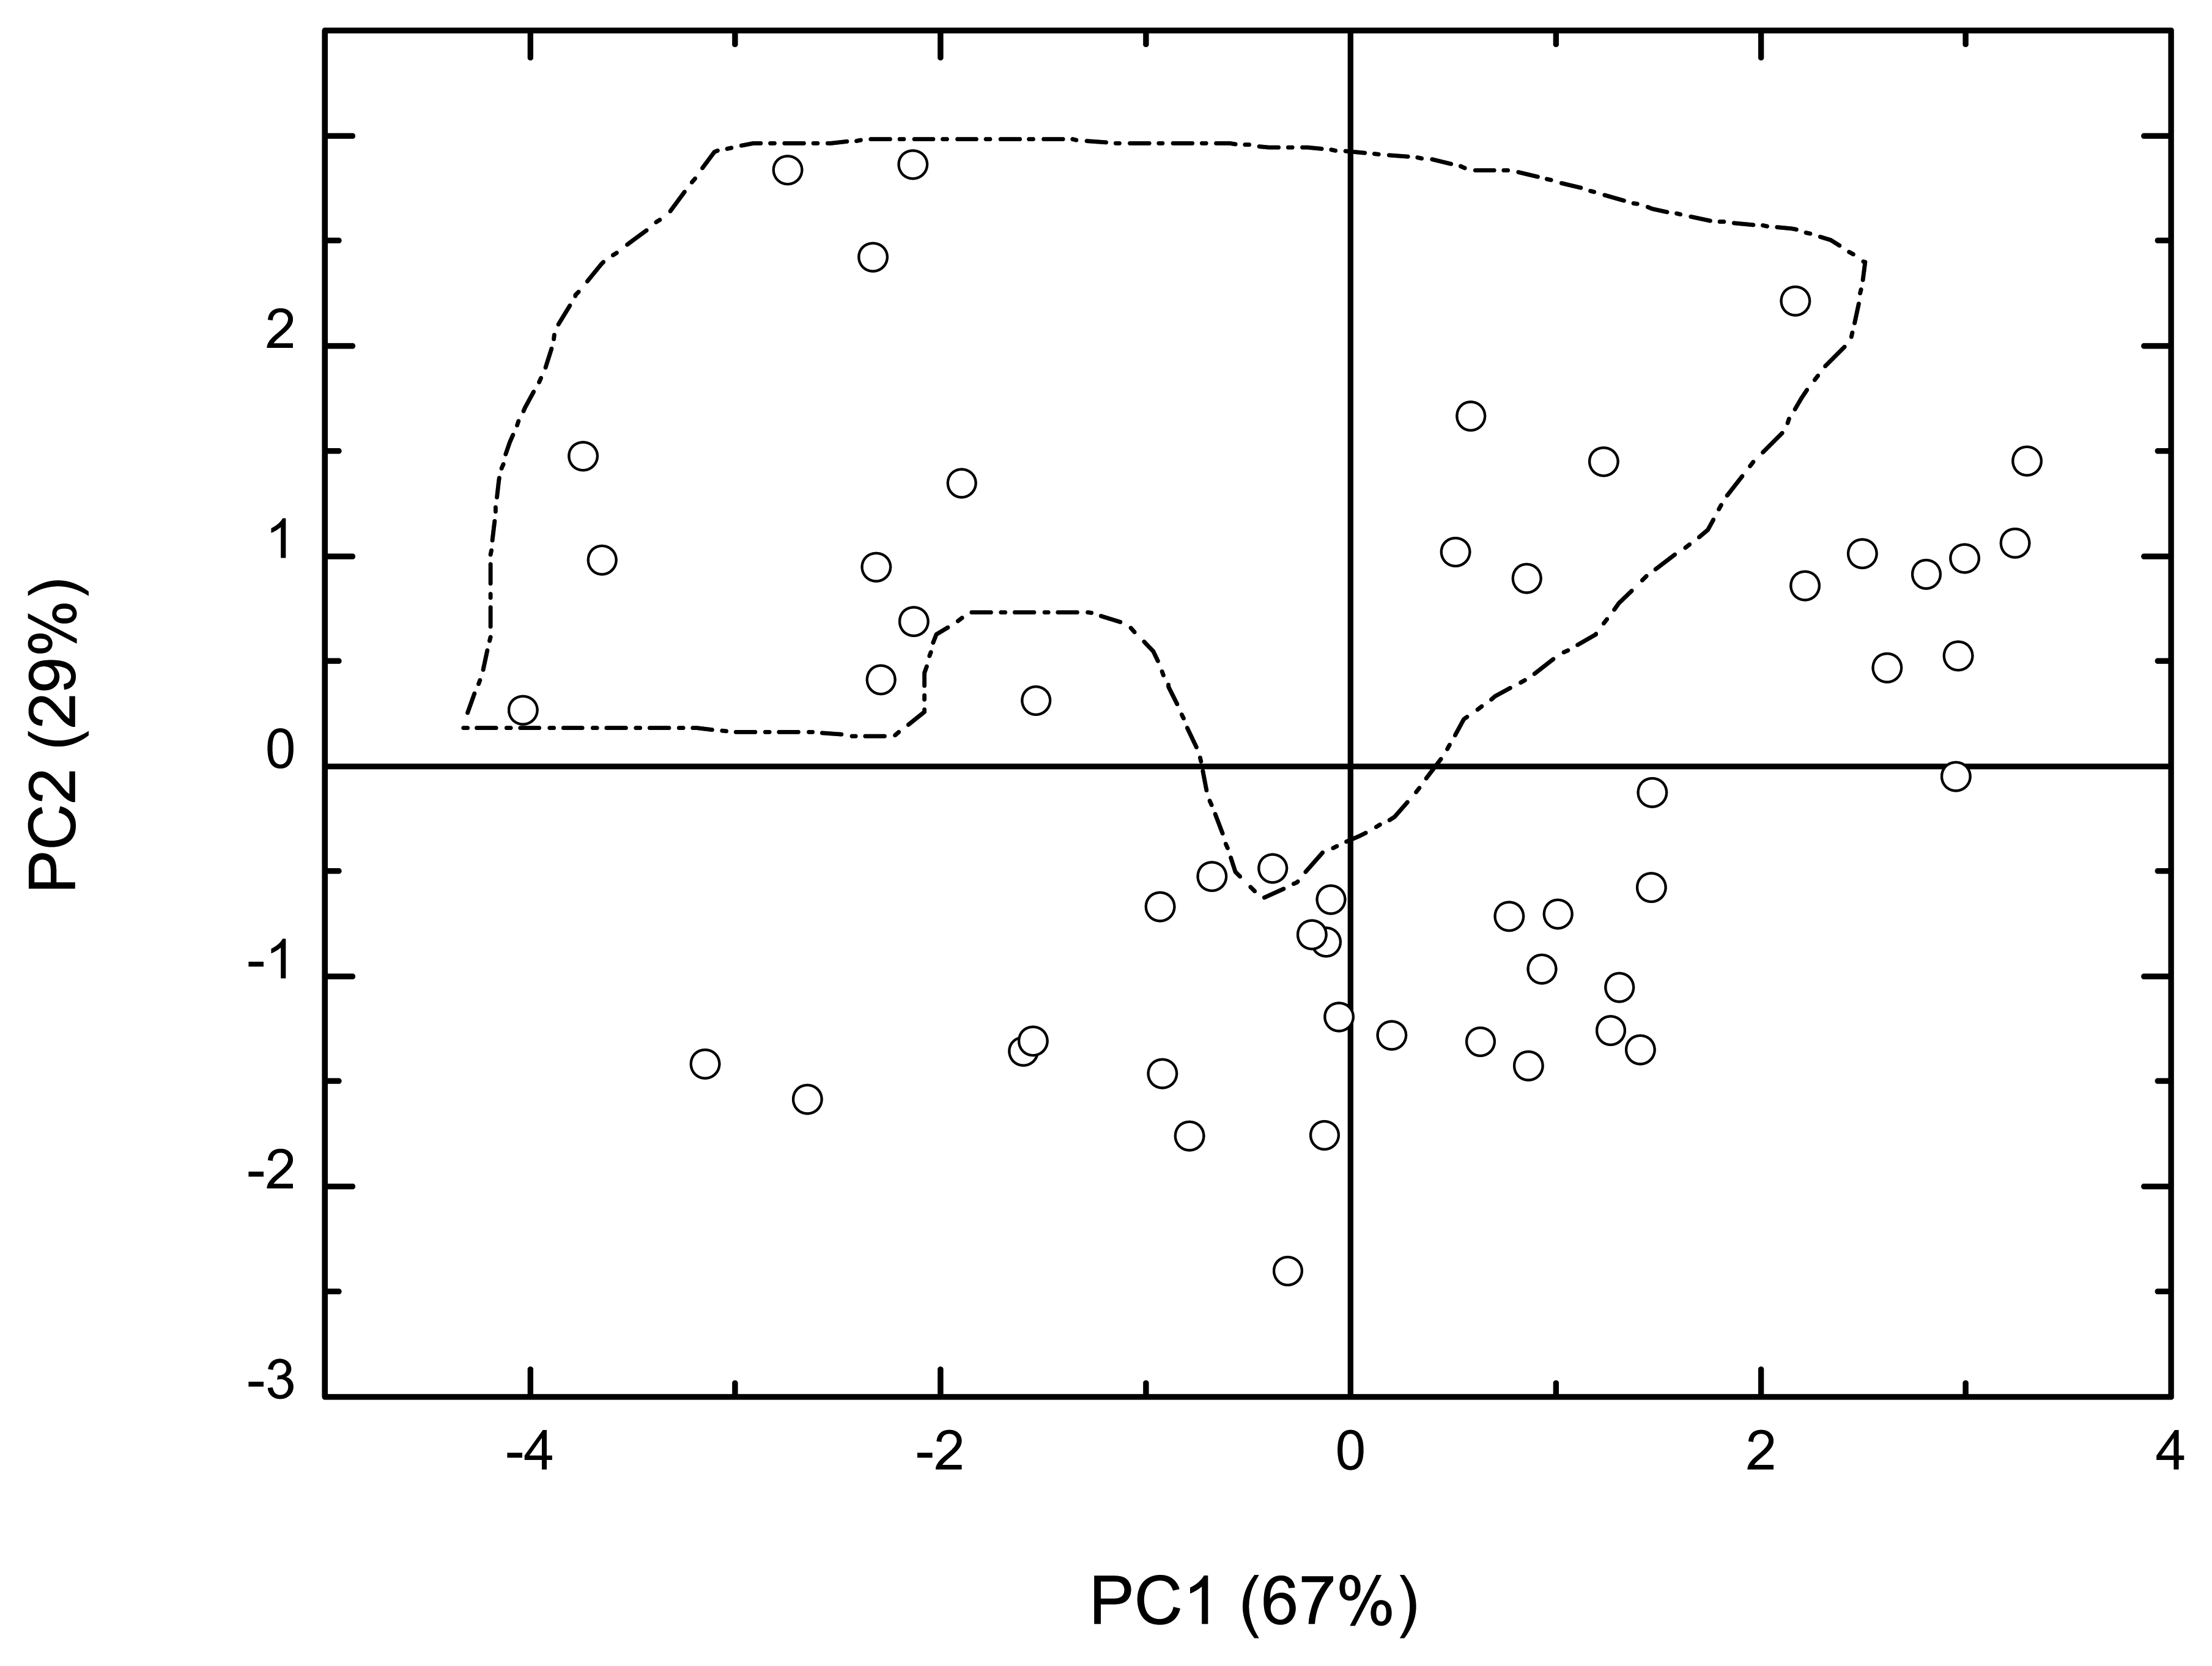
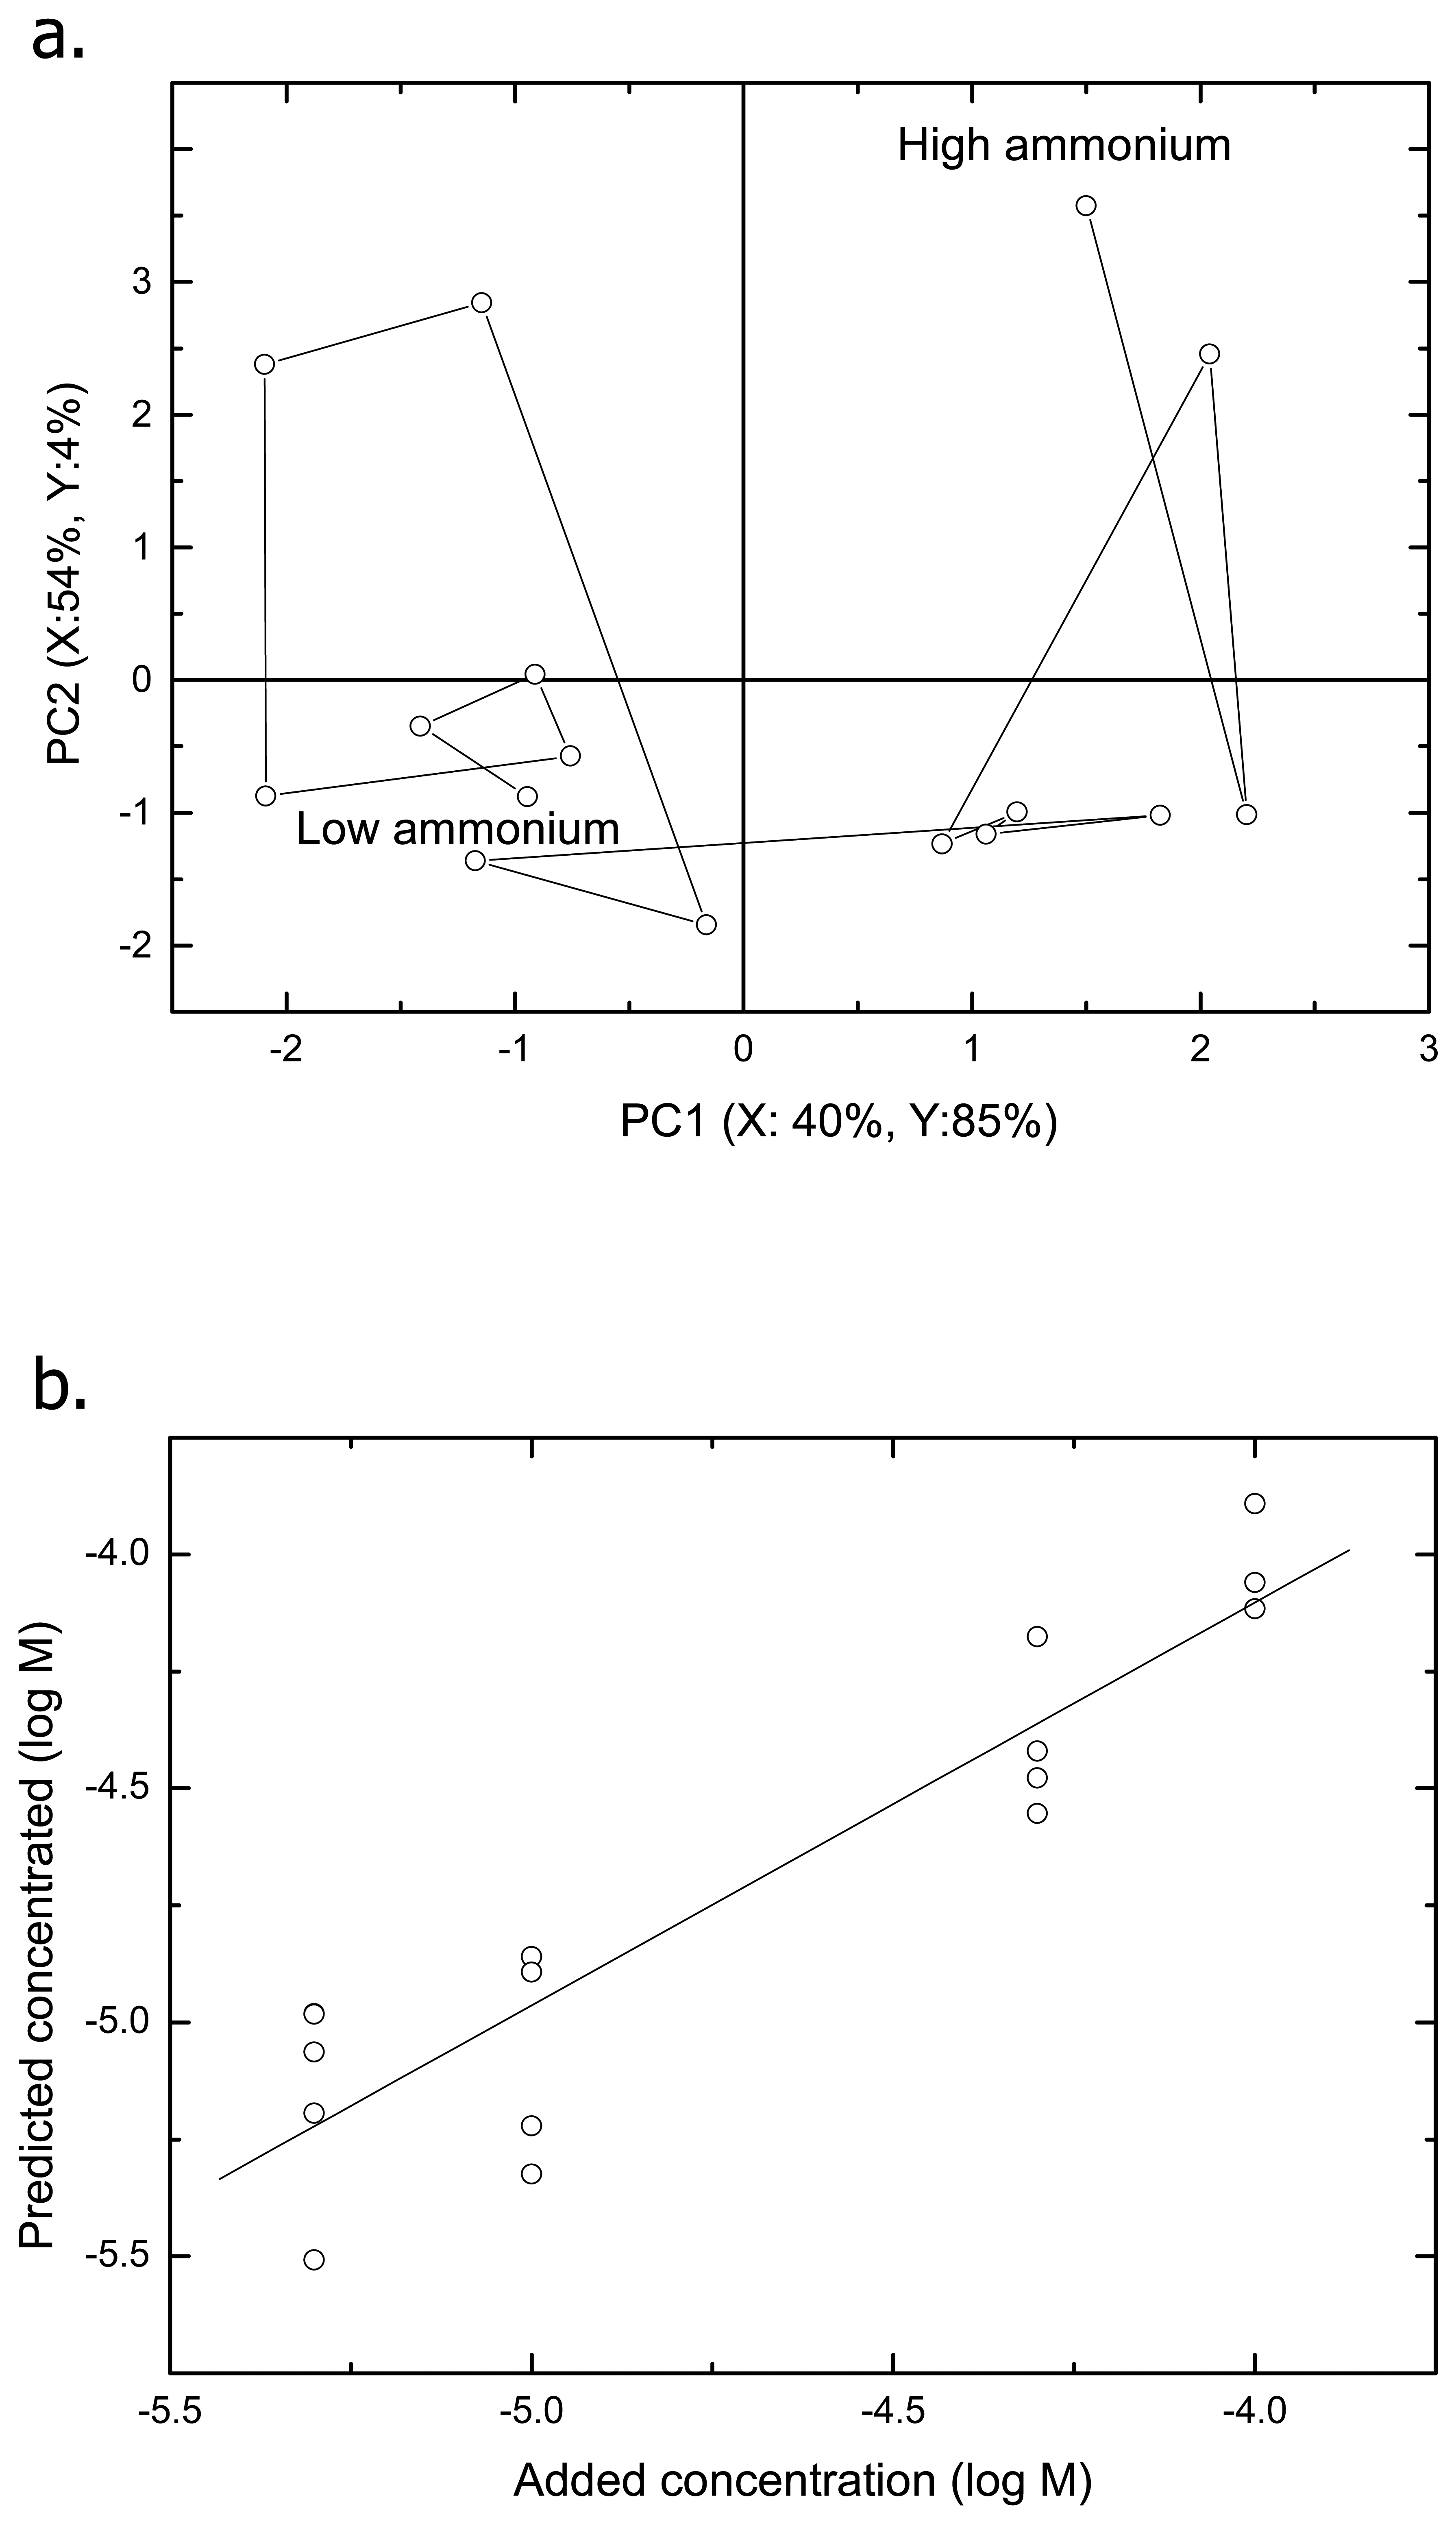
| 6 | Containing ammonium | 2, 5, 6, 7, 8, 9 | ammonium | I. between 10-4 - 10-3 M (Fig. 1) |
| 2, 5, 6, 7, 8, 9 | ammonium | I. between 10-7 - 10-3 M, when concentration of n-butyrate was < 10-4 M (Fig. 2) | ||
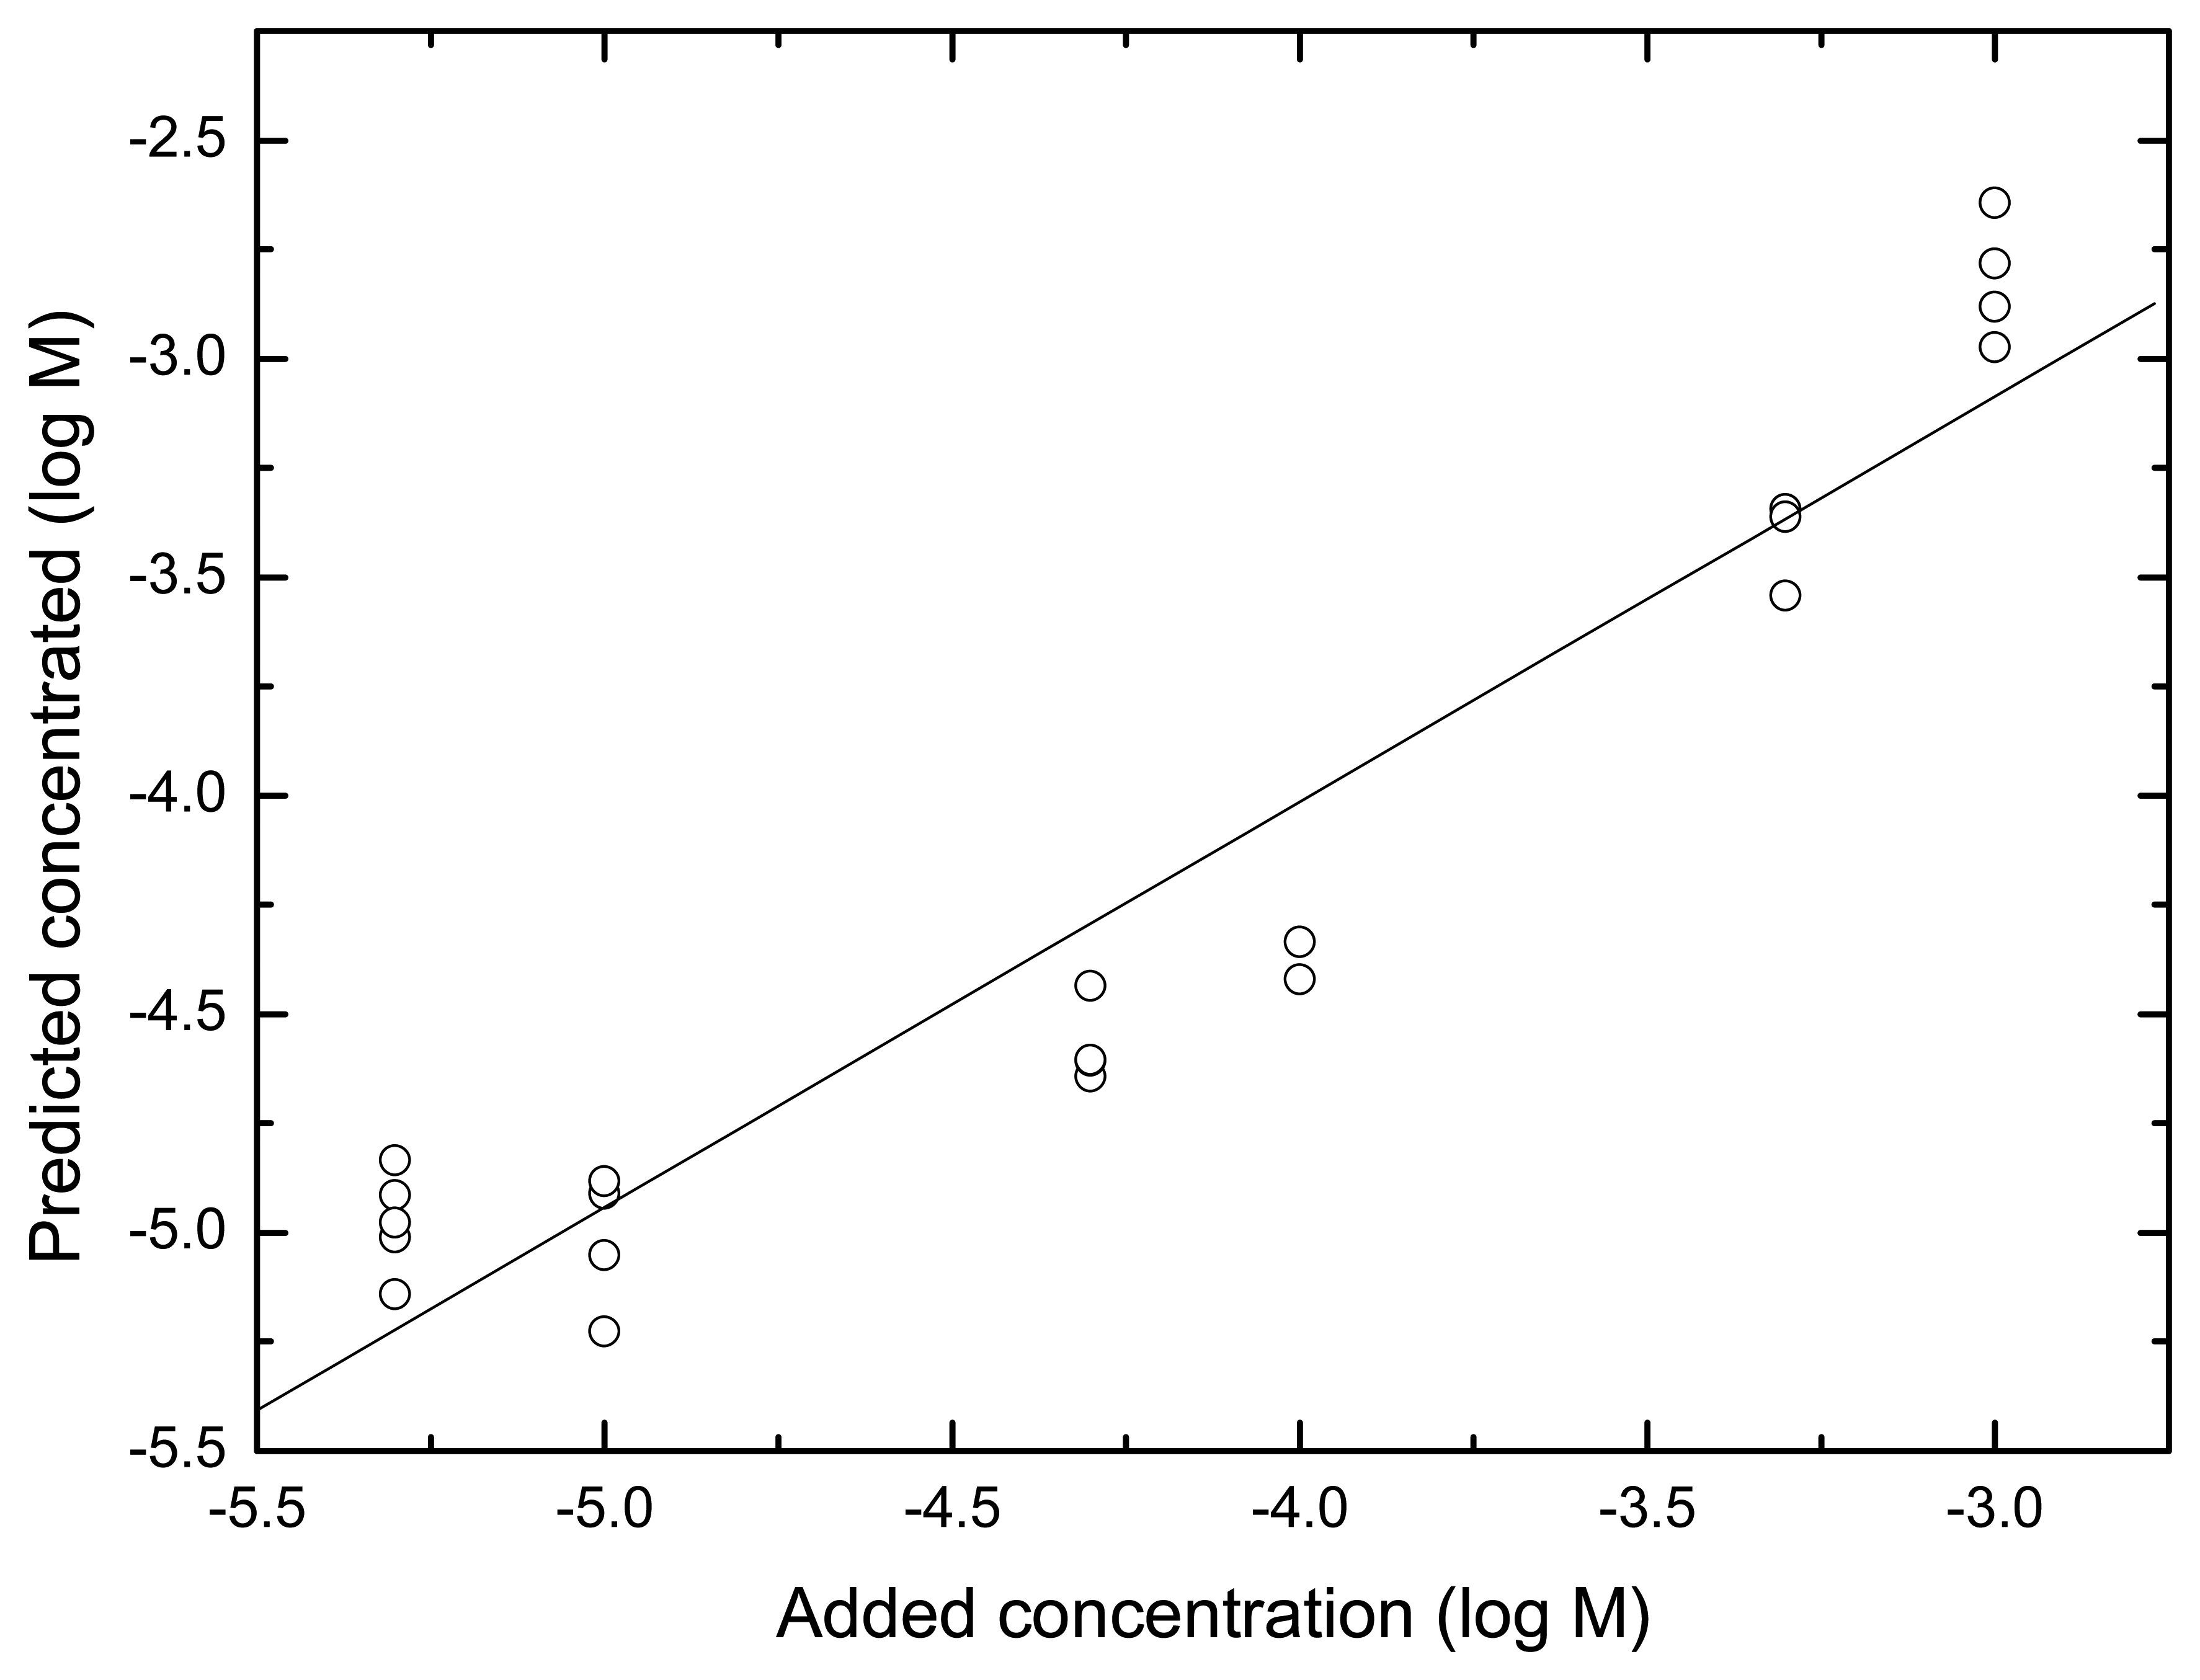
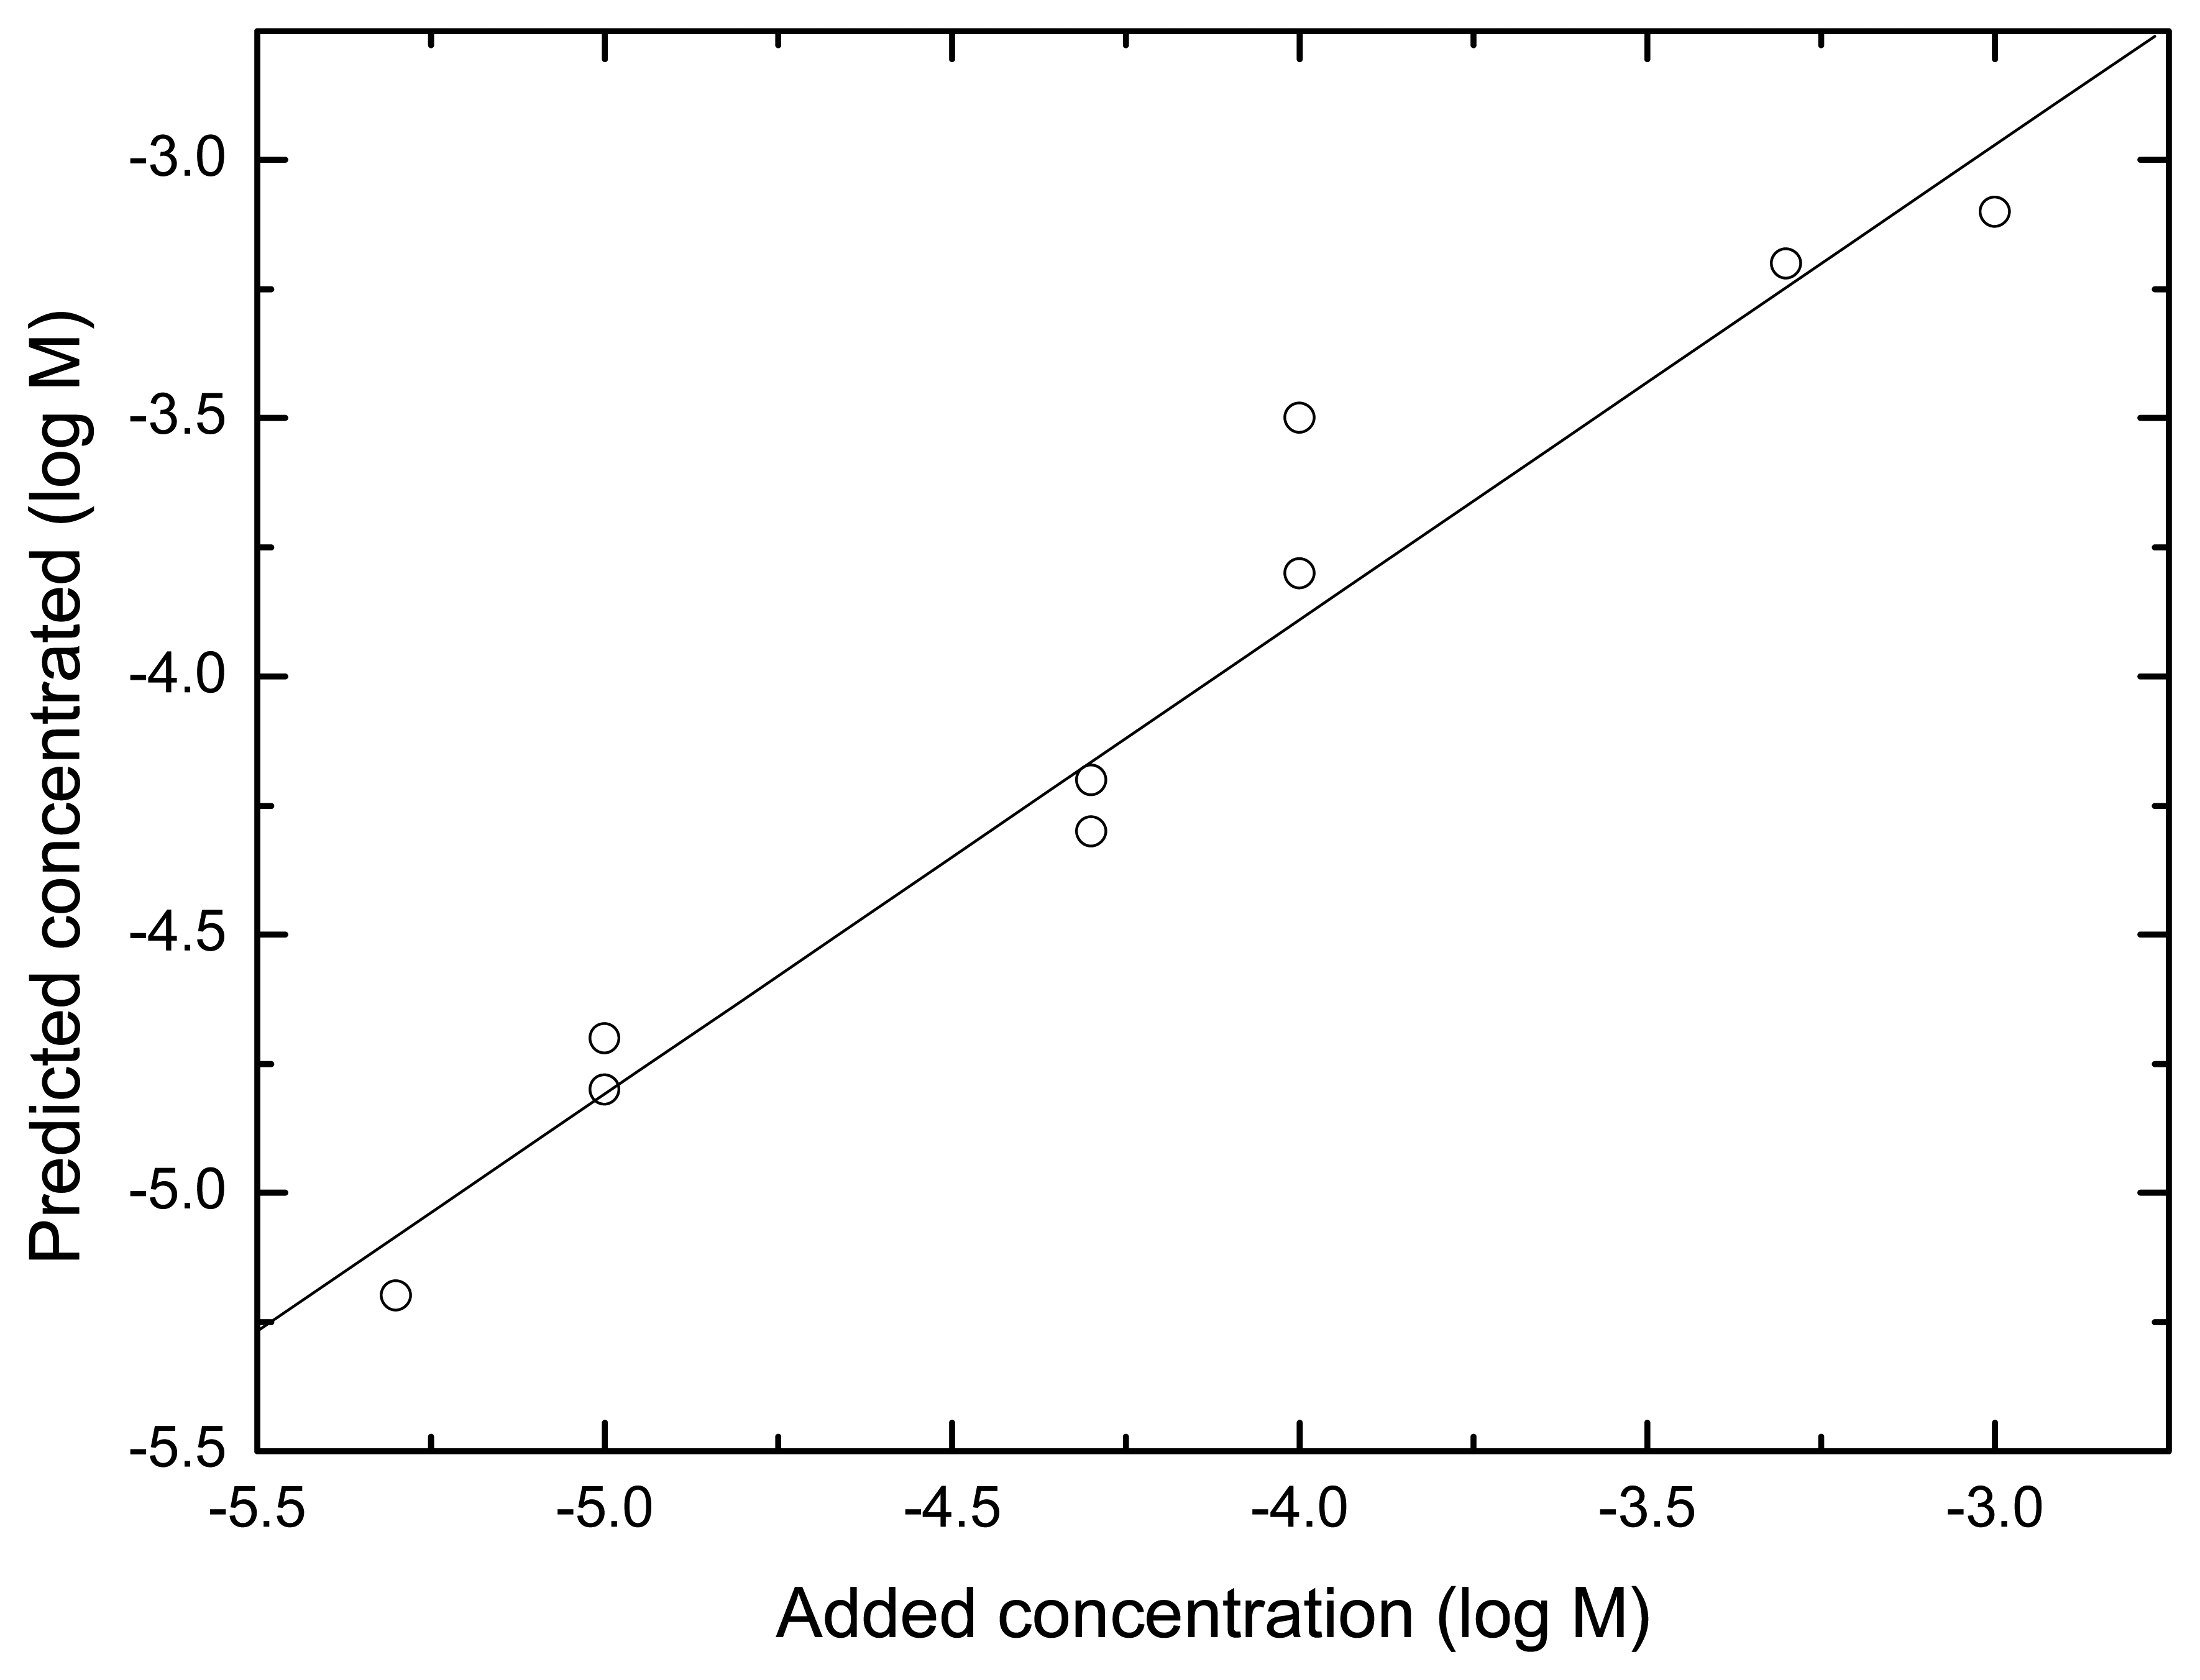
| 2, 5, 6, 7, 8, 9 | ammonium | Q. between 5 × 10⁻⁶ - 10-3 M, when concentration of n-butyrate was < 10-4 M (Fig. 3 and Fig. 4) | ||
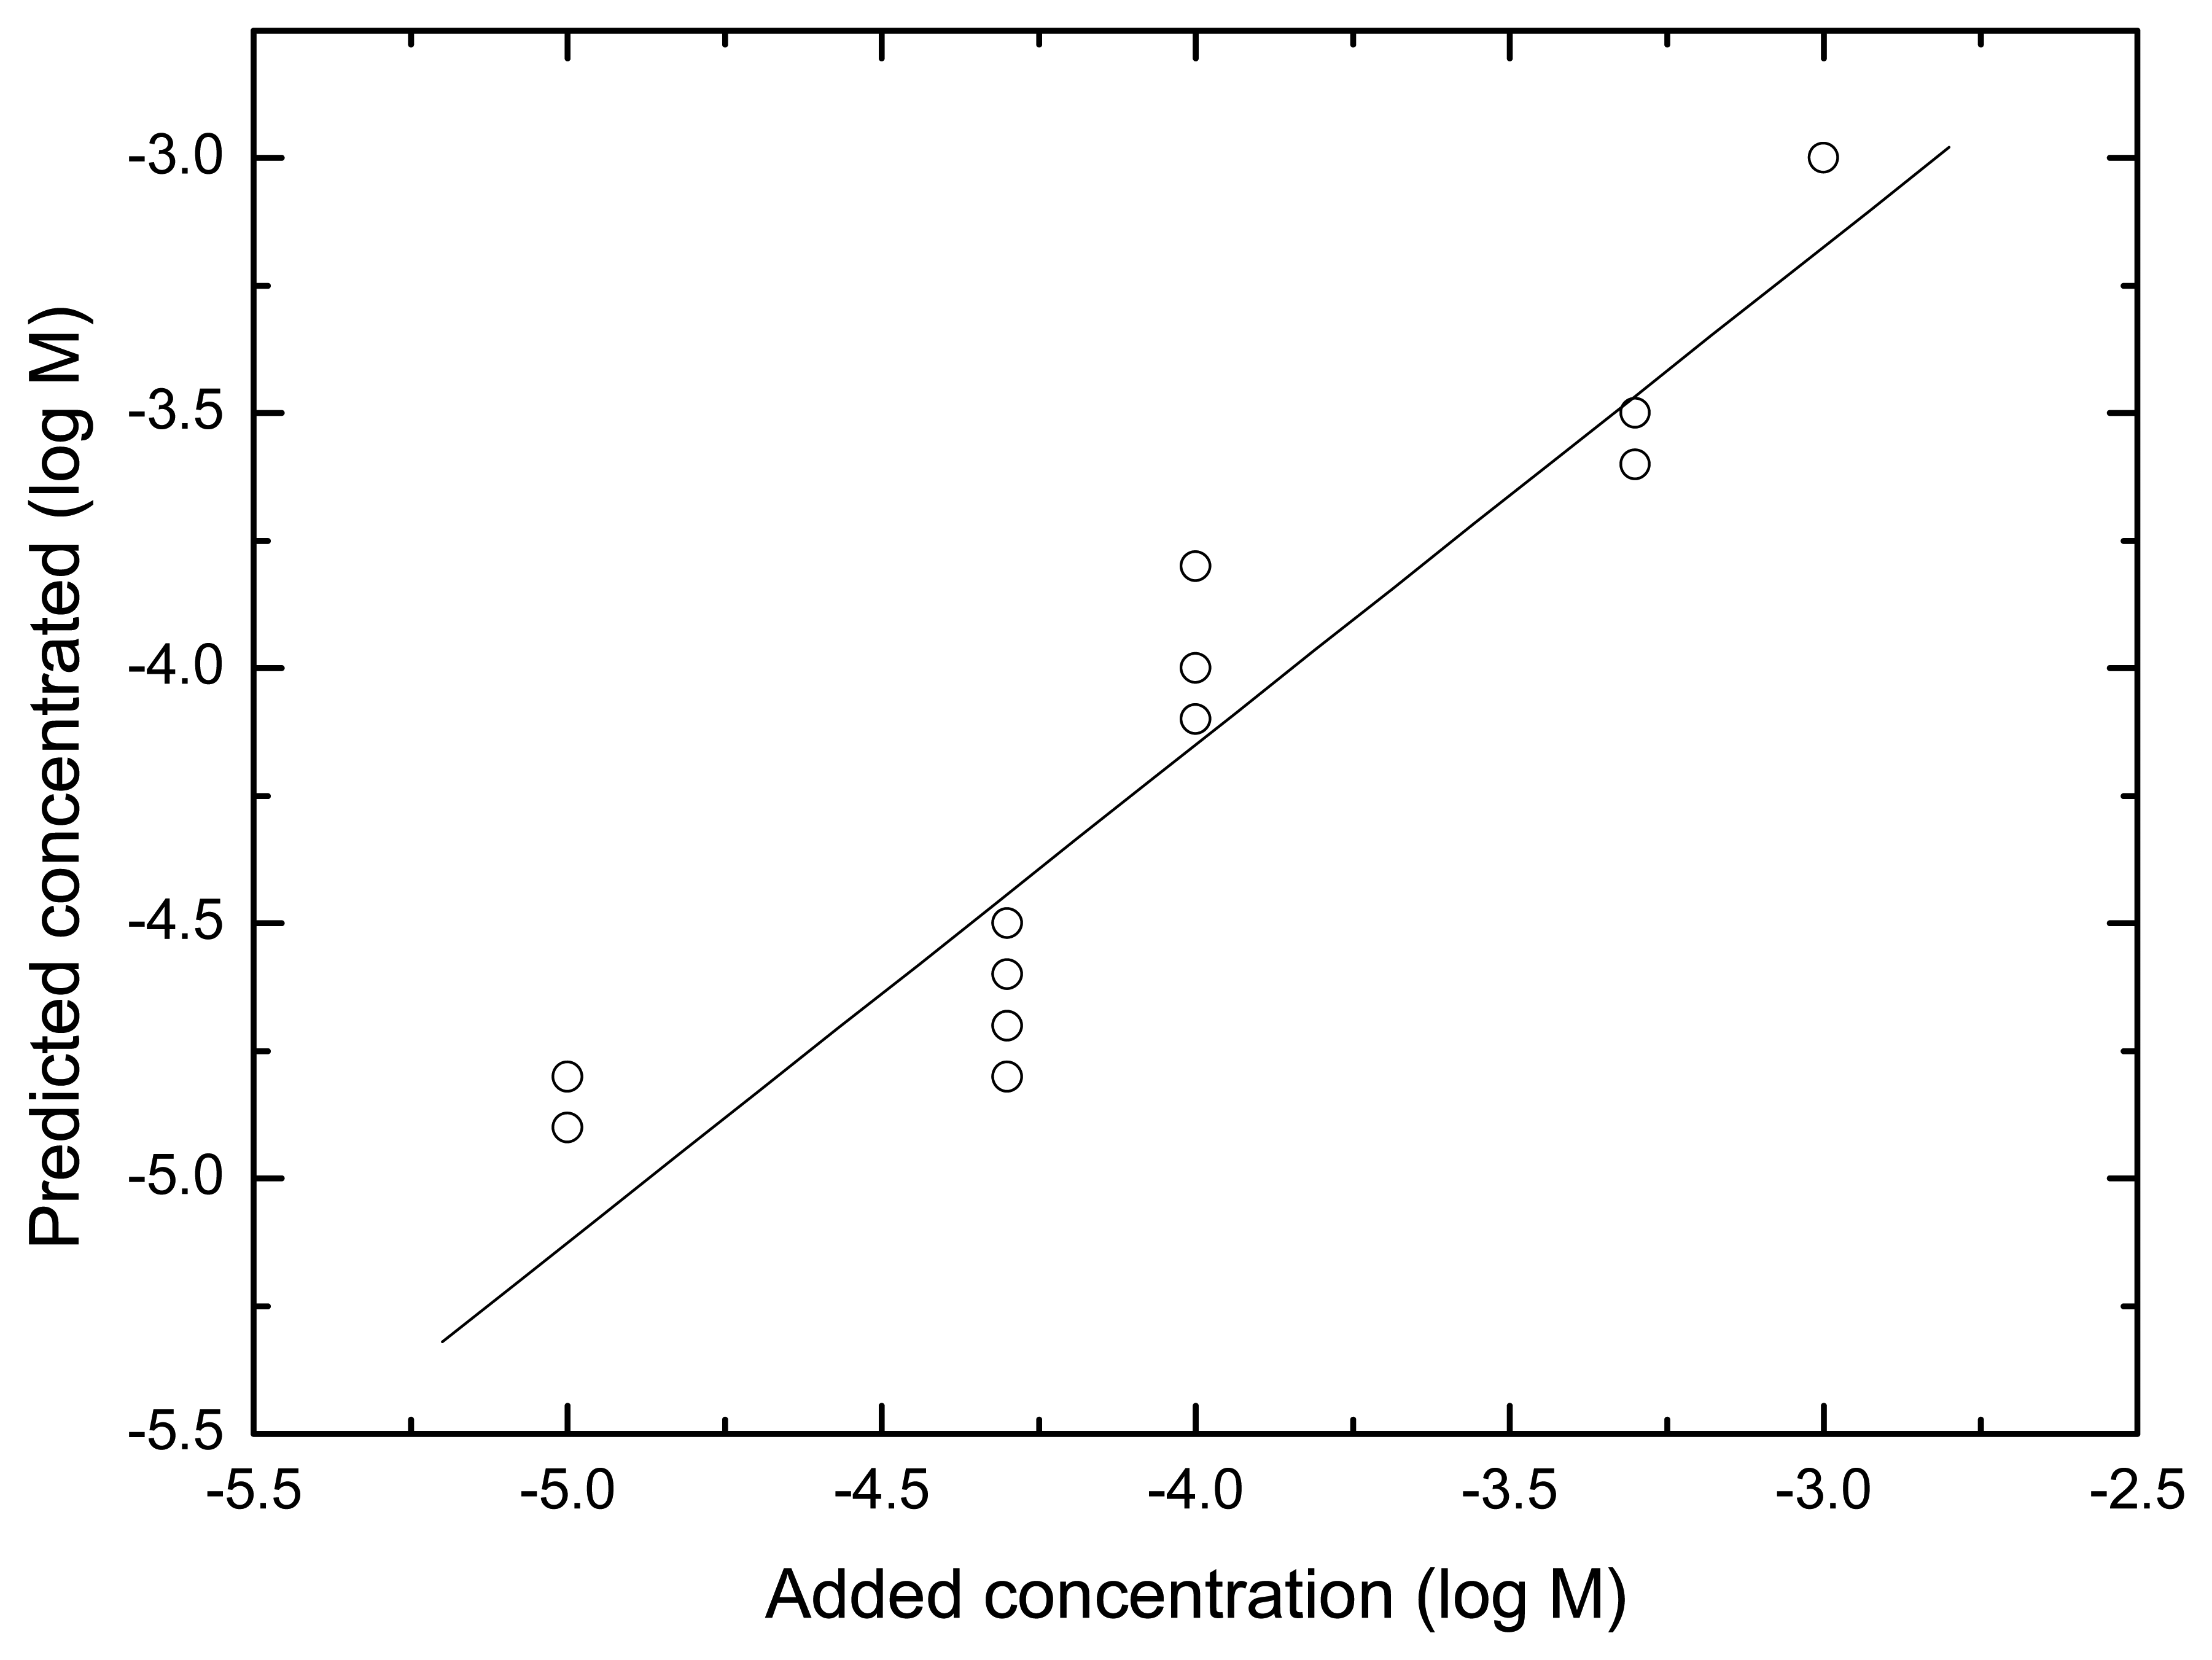
| 2, 5, 6, 7, 8, 9 | n-butyrate | Q. between 10-5 - 10-3 M, when concentration of ammonium was < 5 × 10⁻⁴ M (Fig. 5) | ||
| 2, 5, 6, 7, 8, 9 | ammonium | I. between 5 × 10⁻⁶ - 10-4 M, when concentration of n-butyrate was < 10-4 M, and concentration of ammonium was < 5 × 10⁻⁴ M (Fig. 6 a) | ||
| 2, 5, 6, 7, 8, 9 | ammonium | Q. between 5 × 10⁻⁶ - 10-4 M, when concentration of n-butyrate was < 10-4 M, and concentration of ammonium was < 5 × 10⁻⁴ M (Fig. 6 b) | ||
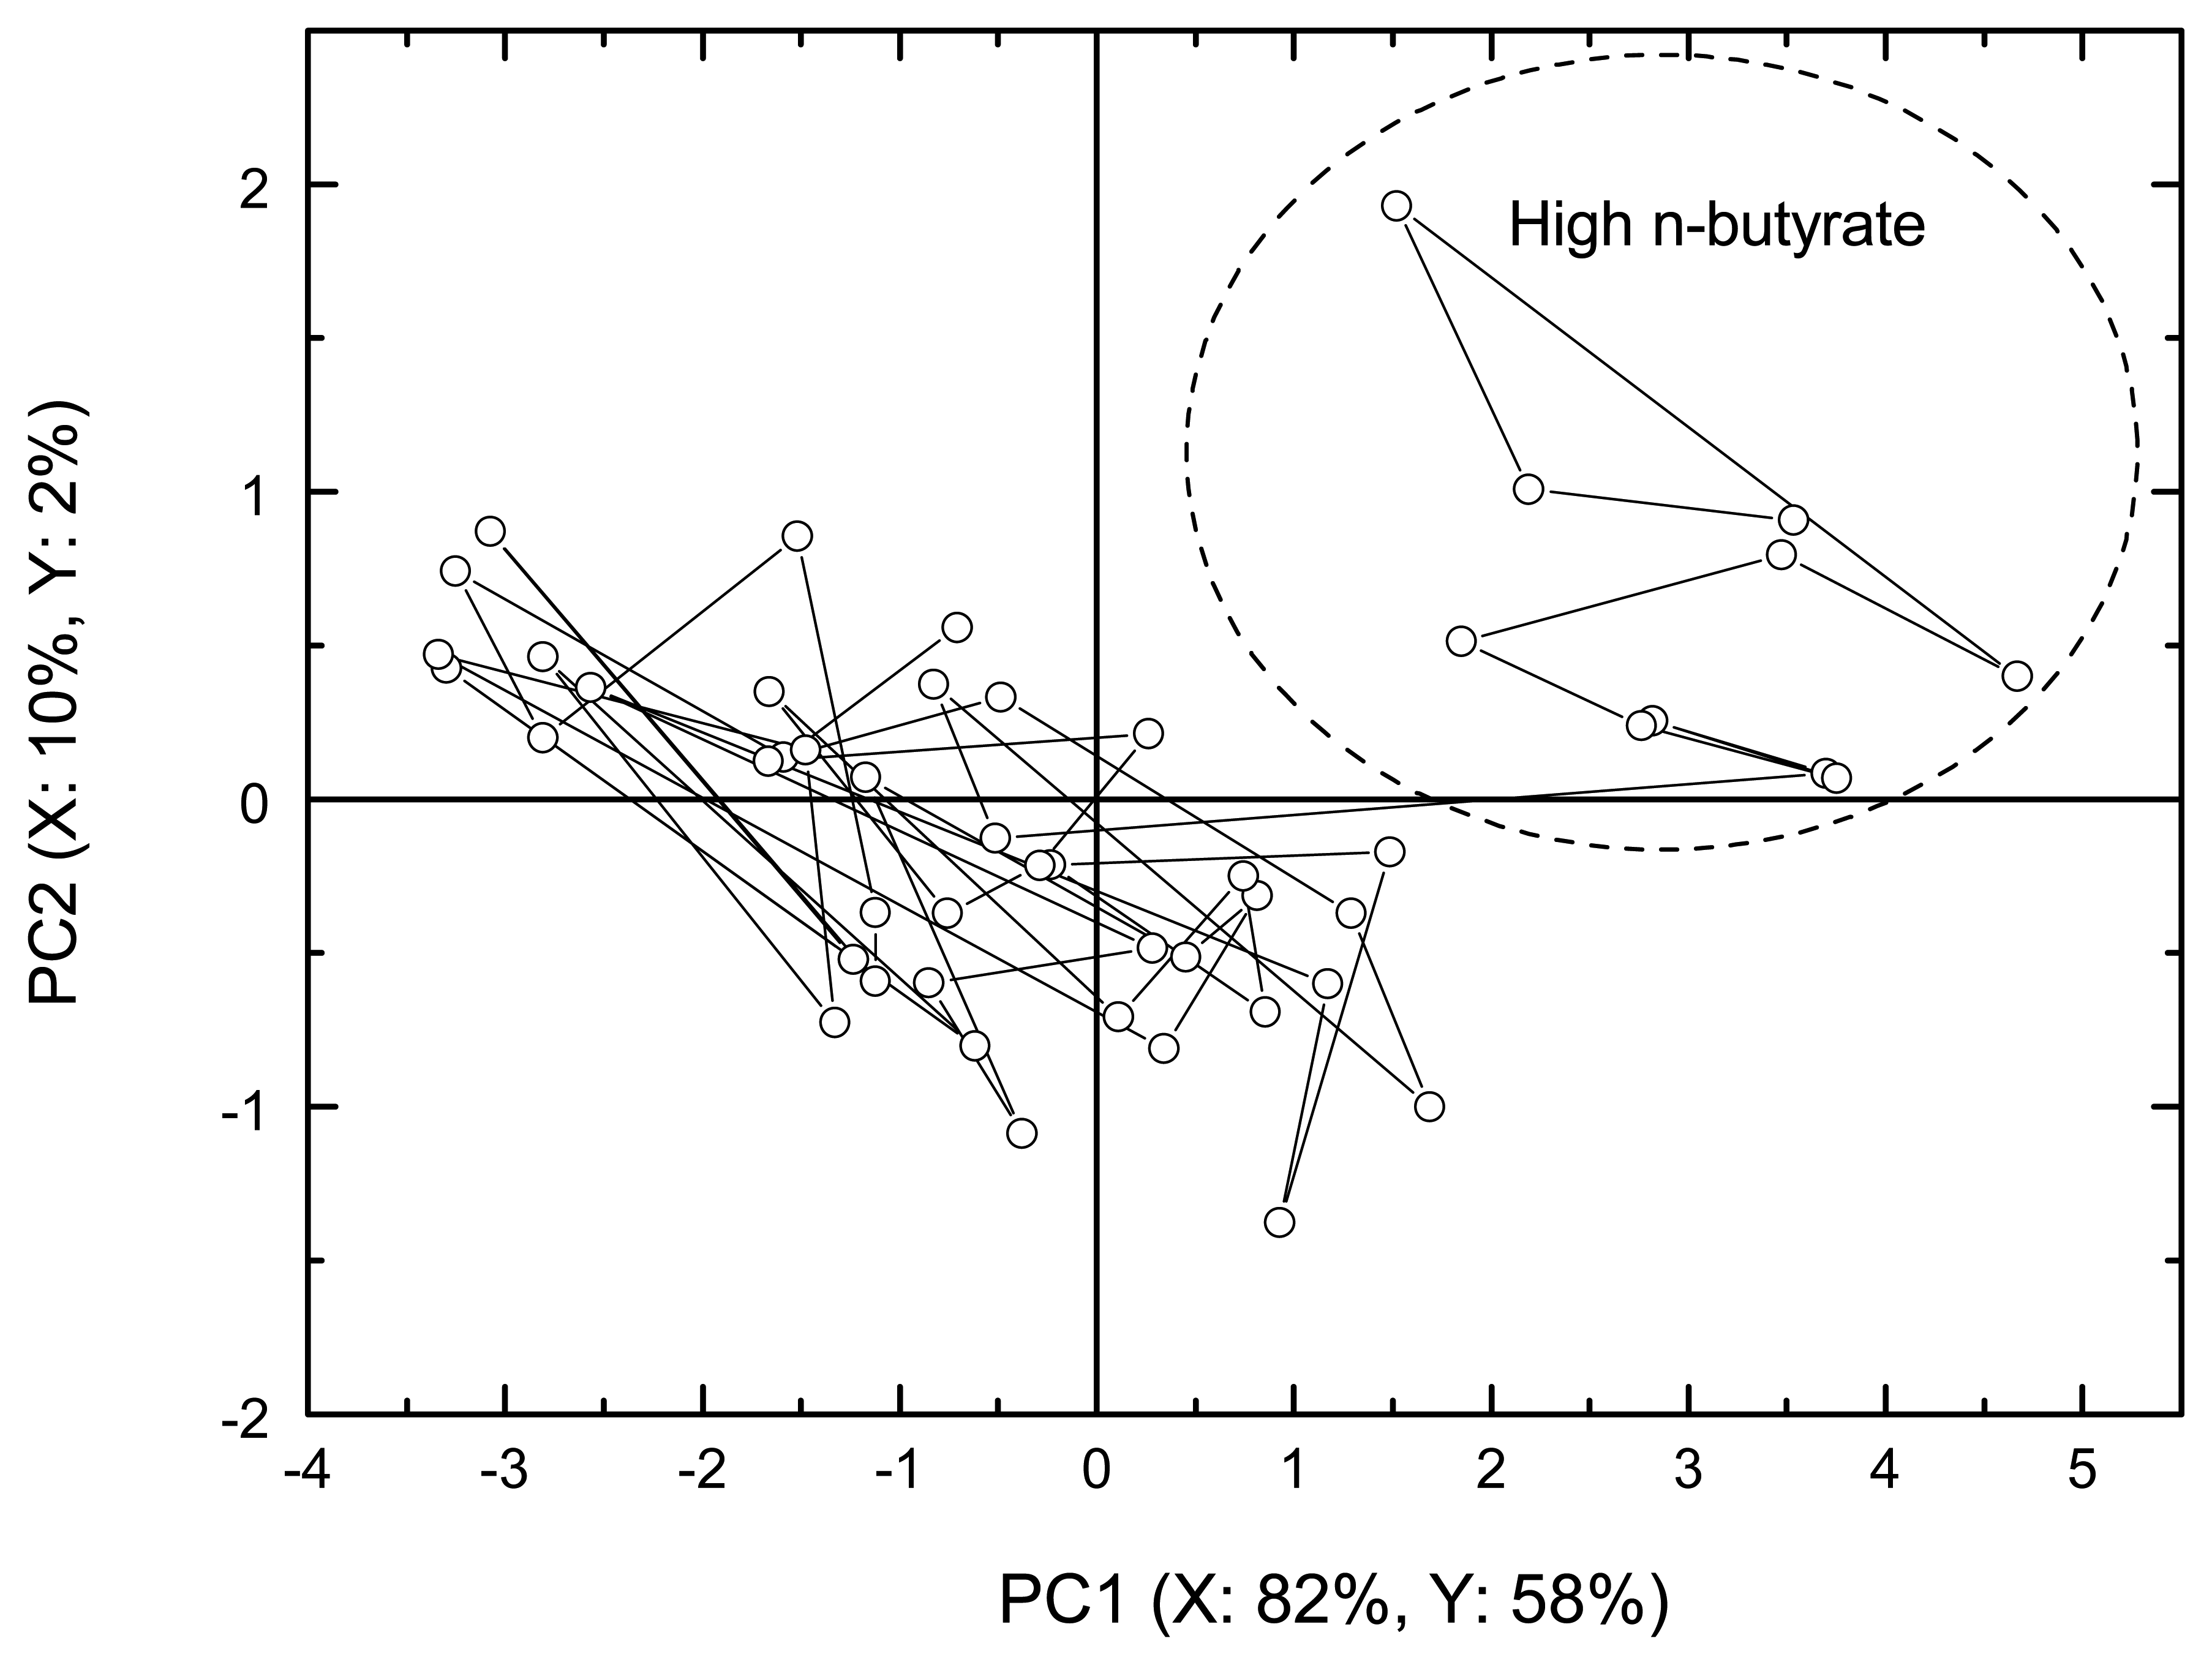
| 6 | Containing p-cresolate | 1, 2, 4, 5, 8 | n-butyrate | I. between 5 × 10⁻⁴ - 10-3 M (Fig. 7) |
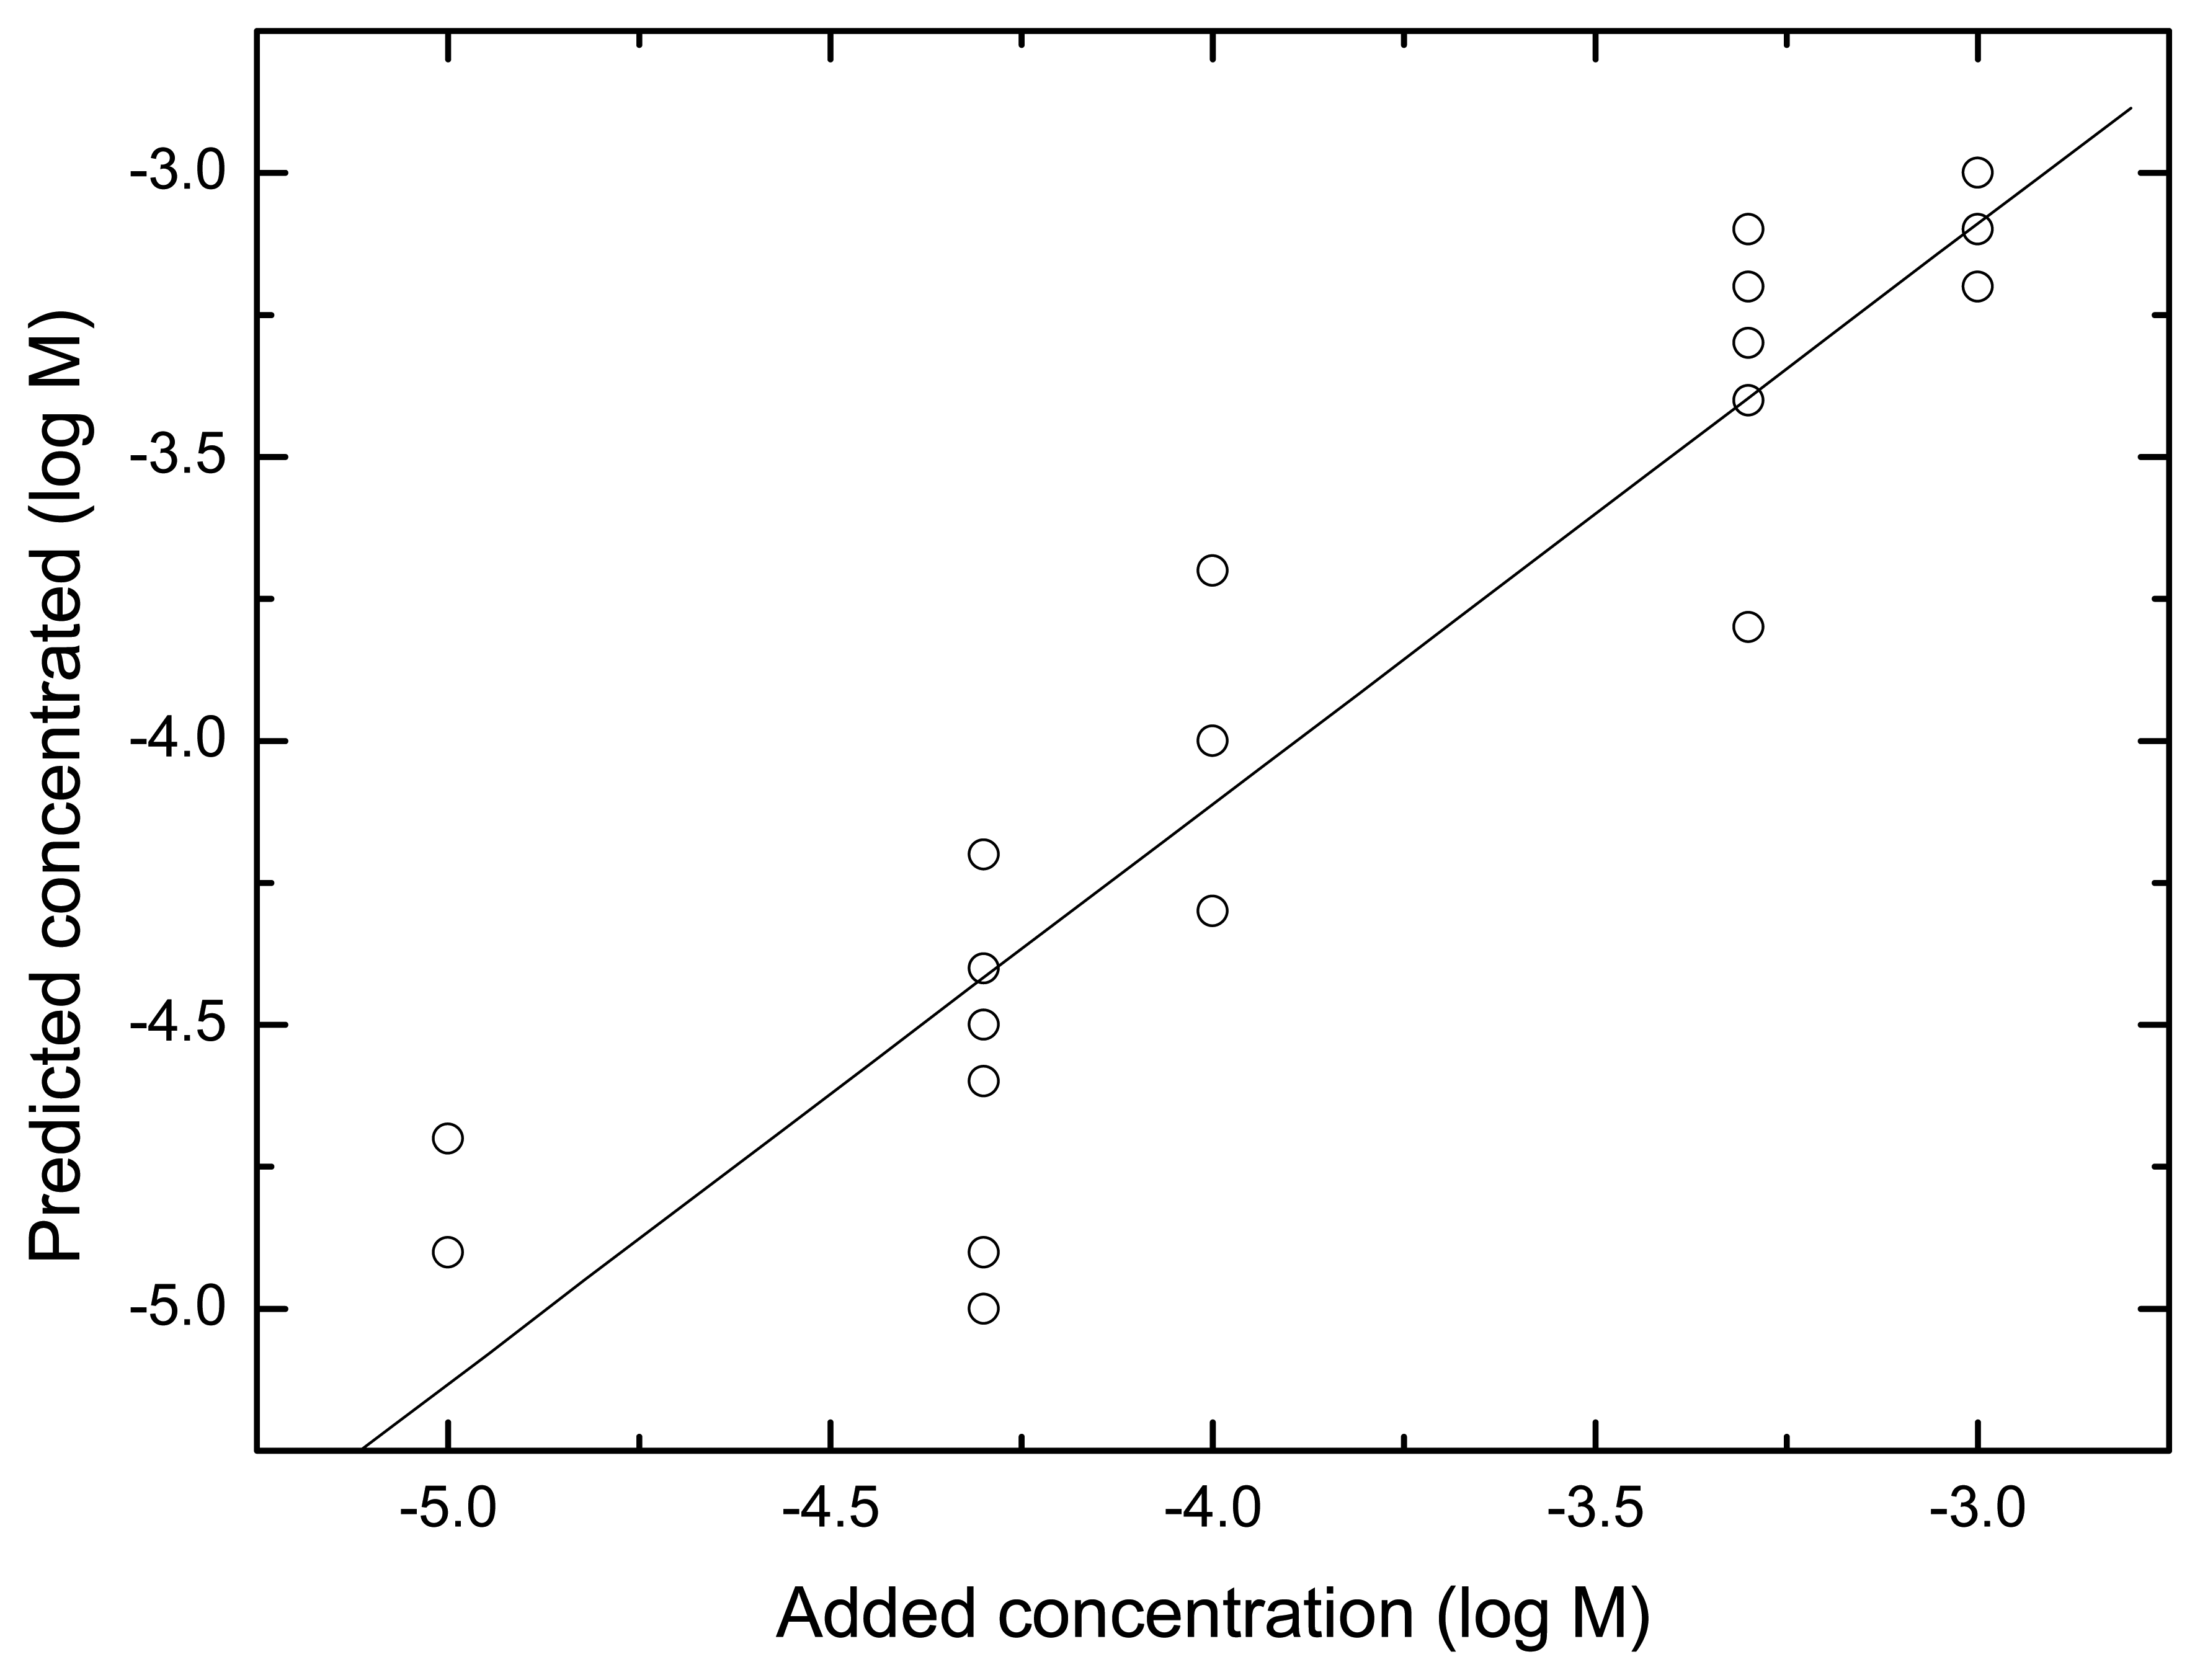
| 1, 2, 4, 5, 8 | n-butyrate | Q. between 10-5 - 10-3 M (Fig. 8) | ||
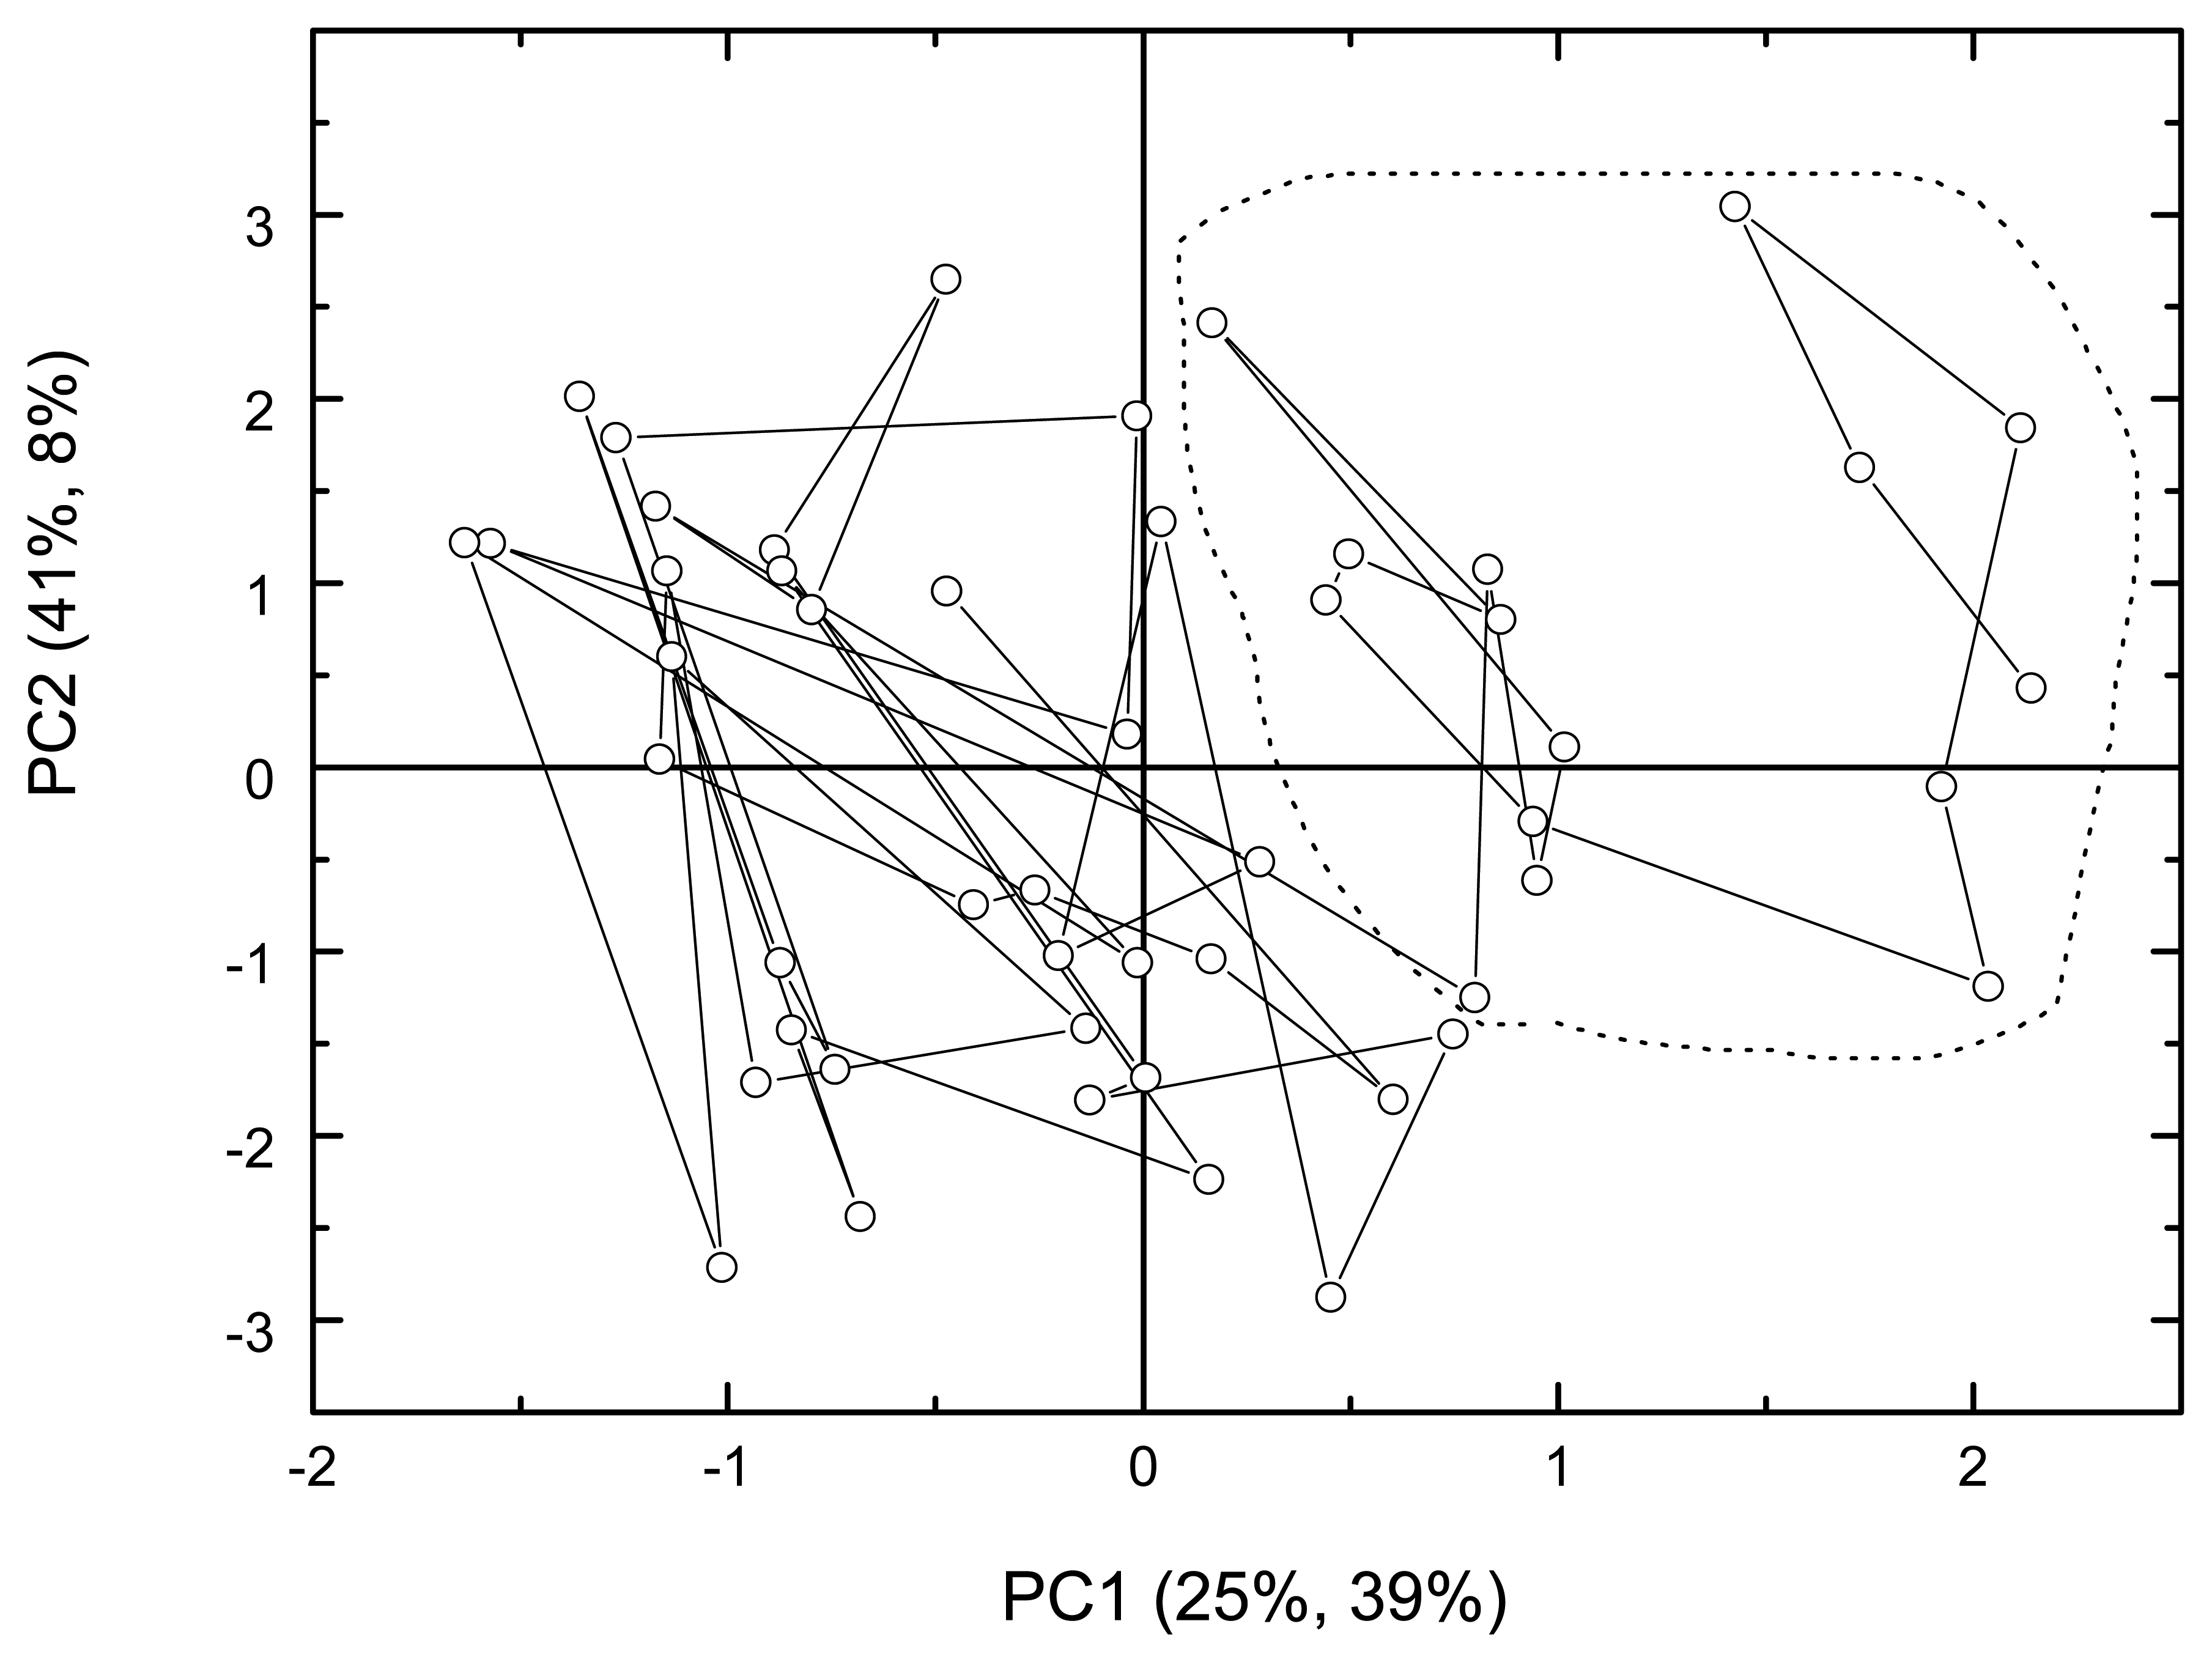
| 8 | Containing ammonium | 1, 2, 4, 5, 7, 8 | n-butyrate | I. between 5 × 10⁻⁴ - 10-3 M (Fig. 9) |
| 1, 2, 4, 5, 7, 8 | n-butyrate | Q. between 10-5 - 10-3 M (Fig. 10) | ||
| 1, 5, 7, 8 | phenolate | Q. between 10-6 - 10-5 M, when concentration of n-butyrate and ammonium were < 5 × 10⁻⁴ M (Fig. 11) | ||
| 8 | Containing p-cresolate | 2, 5, 6, 7, 8, 9 | n-butyrate | I. between 5 × 10⁻⁴ - 10-3 M (Fig. 12) |
| 2, 5, 6, 7, 8, 9 | n-butyrate | Q. between 5 × 10⁻⁵- 10-3 M (Fig. 13) |
| pH | Test mixture of key odorants | Electrode no. | StDev j (mV) | RSD j (%) |
|---|---|---|---|---|
| 6 | Containing ammonium | 1-14 | 0 - 11 | 0 - 4.8 |
| 2, 5, 6, 7, 8, 9 | 0 - 5.6 | 0 - 3.4 | ||
| 6 | Containing p-cresolate | 1-14 | 0 - 17.3 | 0 - 15.5 |
| 1, 2, 4, 5, 8 | 0 - 6.8 | 0 - 3.5 | ||
| 8 | Containing ammonium | 1-14 | 0 - 2.6 | 0 - 8.4 |
| 1, 2, 4, 5, 7, 8 | 0 - 1.6 | 0 - 0.7 | ||
| 1, 5, 7, 8 | 0 - 1.6 | 0 - 0.7 | ||
| 8 | Containing p-cresolate | 1-14 | 0 - 2.1 | high l |
| 1-11, 14 | 0 - 2.1 | 0 - 0.9 | ||
| 2, 5, 6, 7, 8, 9 | 0 - 1.6 | 0 - 0.4 |
© 2007 by MDPI ( http://www.mdpi.org). Reproduction is permitted for noncommercial purposes.
Share and Cite
Abu-Khalaf, N.; Lønsmann Iversen, J.J. Calibration of a Sensor Array (an Electronic Tongue) for Identification and Quantification of Odorants from Livestock Buildings. Sensors 2007, 7, 103-128. https://doi.org/10.3390/s7010103
Abu-Khalaf N, Lønsmann Iversen JJ. Calibration of a Sensor Array (an Electronic Tongue) for Identification and Quantification of Odorants from Livestock Buildings. Sensors. 2007; 7(1):103-128. https://doi.org/10.3390/s7010103
Chicago/Turabian StyleAbu-Khalaf, Nawaf, and Jens Jørgen Lønsmann Iversen. 2007. "Calibration of a Sensor Array (an Electronic Tongue) for Identification and Quantification of Odorants from Livestock Buildings" Sensors 7, no. 1: 103-128. https://doi.org/10.3390/s7010103