Lightning Sensors for Observing, Tracking and Nowcasting Severe Weather

Department of Geophysics and Planetary Sciences, Tel Aviv University, 69978 Israel
Sensors 2008, 8(1), 157-170; https://doi.org/10.3390/s8010157
Submission received: 7 November 2007
/
Accepted: 7 January 2008
/
Published: 21 January 2008
(This article belongs to the Special Issue Sensors for Disaster and Emergency Management Decision Making)
Abstract
:Severe and extreme weather is a major natural hazard all over the world, often resulting in major natural disasters such as hail storms, tornados, wind storms, flash floods, forest fires and lightning damages. While precipitation, wind, hail, tornados, turbulence, etc. can only be observed at close distances, lightning activity in these damaging storms can be monitored at all spatial scales, from local (using very high frequency [VHF] sensors), to regional (using very low frequency [VLF] sensors), and even global scales (using extremely low frequency [ELF] sensors). Using sensors that detect the radio waves emitted by each lightning discharge, it is now possible to observe and track continuously distant thunderstorms using ground networks of sensors. In addition to the number of lightning discharges, these sensors can also provide information on lightning characteristics such as the ratio between intra-cloud and cloud-to-ground lightning, the polarity of the lightning discharge, peak currents, charge removal, etc. It has been shown that changes in some of these lightning characteristics during thunderstorms are often related to changes in the severity of the storms. In this paper different lightning observing systems are described, and a few examples are provided showing how lightning may be used to monitor storm hazards around the globe, while also providing the possibility of supplying short term forecasts, called nowcasting.
1. Introduction
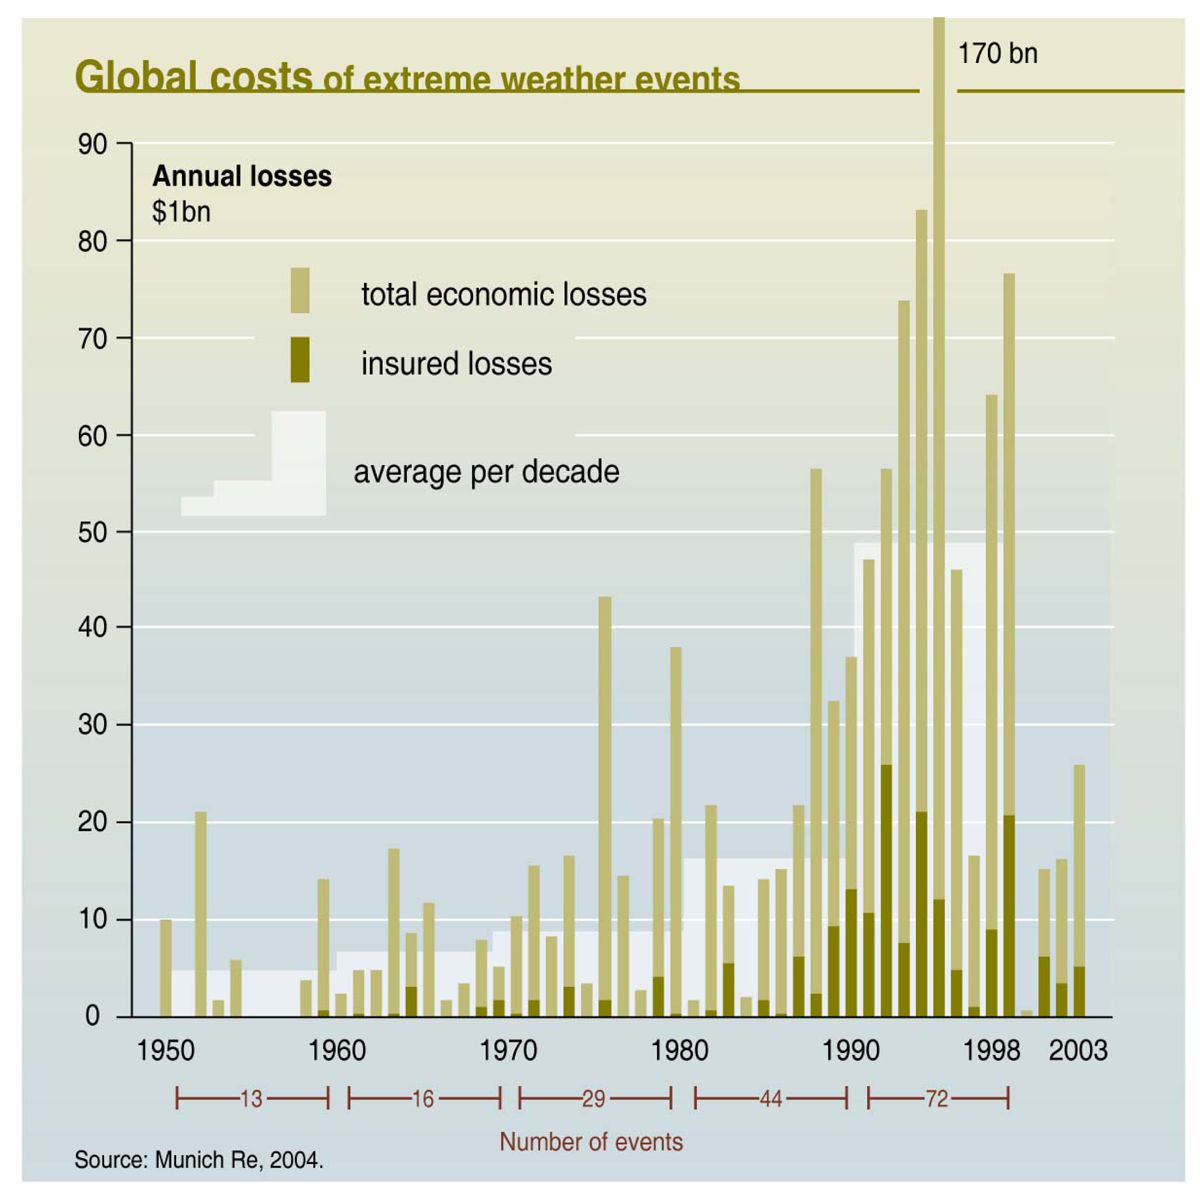
Extreme weather events can be very destructive as a result of hail, tornados, wind storms, hurricanes and intense rainfall that can occur over short periods of time, often also resulting in flash floods. In the last 50 years there has been a significant increase in the damage caused by extreme weather events (Figure 1), with the damage from extreme weather events increasing every decade, and the economic costs dramatically increasing during the 1990s. The cause of this large increase is debatable. On the one hand, there is evidence that the global climate is changing (1), with increases in extreme weather events observed over the past 50 years, and further increases are predicted for the future. On the other hand, with the growing population of the world, not only are extreme weather events better detected and reported, but more people are living in harm's way. The increasing population along coastlines will result in increasing losses and damages from hurricanes, even without any change in the frequency or intensity of hurricanes. Whatever the cause, the hazards and losses are increasing dramatically, and hence the importance of monitoring and understanding these extreme weather events. While better monitoring and detection of these extreme weather events will not reduce the number or severity of these events, early warning can significantly reduce the loss of life.
While many developed countries have radar networks to track storms and precipitation, the majority of the world is not covered by such observation systems. Satellites can give global estimates of rainfall, however geostationary satellites provide coarse spatial resolution, while polar orbiting satellites provide poor temporal coverage of storms. Since intense thunderstorms can develop in less than an hour, and last only a few hours, there is a need to develop sensors to monitor such hazardous storms continuously, especially in undeveloped regions of the globe where other observations systems are lacking.
Lightning is one aspect of severe storms that can be monitored continuously, and from great distances. Lightning is an electrical discharge either within clouds (IC), or between clouds and the ground (CG). The rapid acceleration of charge during the lightning flash generates electromagnetic radiation in all frequency bands. These radio waves propagate away from the lightning channel and get channeled within the Earth-ionosphere waveguide around the globe. Hence, radio waves from lightning can propagate around the globe over distances of thousands of kilometers, and further. The attenuation of these radio waves depends on the frequency of the radiation. The highest frequencies are attenuated first, while the lowest frequencies can travel great distances. For this reason lightning sensors that are used locally around individual thunderstorms are typically very high frequency (VHF) ones, which detect the lightning channel in high spatial and temporal detail (2). On regional scales the VHF radiation cannot be detected, and therefore on these scales the lightning sensors detect the very low frequency (VLF) radiation that manages to propagate distances of thousands of kilometers before decaying (3). Finally, it is also possible to detect global lightning activity if the sensors are sensitive in the extremely low frequency (ELF) band (4). Therefore, electromagnetic ground-based lightning sensors provide the possibility of monitoring thunderstorms continuously in remote regions of the globe.
2. Lightning Sensors
Lightning sensors detect and locate electrical activity in thunderstorms using a number of different methodologies. These include direction finding (DF) (5), time-of-arrival (TOA) techniques (6), a combination of these two (7), and interferometry methods(8). All techniques need a number of sensors within a network to get reliable data on the location of a lightning flash. The DF method uses two orthogonal magnetic loop antennas, where the azimuth angle to the flash is obtained by simple trigonometry. The TOA method uses the small differences in the arrival times of the radio wave at different stations to determine the optimum distance to the flash from a network of synchronized stations. Today with GPS timing, the TOA method supplies more accurate locations compared with the DF methods. However, today combinations of both methods are often used to enhance the accuracy of lightning detection networks.
2.1. Very High Frequency (VHF) sensors
By using VHF sensors, the high-frequency components of the lightning discharge can be reconstructed in either two or three dimensions. While this method supplies great detail about lightning in individual thunderstorms, it cannot be used over large regional areas, and cannot supply other important information about the discharge peak current, charge, and polarity. Nevertheless, these systems offer great possibilities for early warning systems in regions with higher risk of losses (e.g. airports, industry, sport events, etc.) (9, 10). These VHF systems provide information on the storm development, the intensity of the storm, and the likelihood of severe weather.
VHF direction finding is termed interferometry (IF) since the phase difference of signals arriving at different antennas is used in determining both the azimuth and elevation of the radiation emitted from the lightning channel (8, 11, 12). As with DF methods, the IF method of detecting the pulse location is less accurate than the TOA method.
The TOA method in the VHF band was first proposed by Proctor (13), using at least 4 sensors spaced tens of kilometers apart, all with accurate timing. A more modern system using this methodology (2) with GPS timing detects radiation around 63 MHz, during a 100μs time interval. If the radiation exceeds a noise threshold, the peak signal times are recorded with 50 ns time resolution using a 20 MHz digitizer accurately phase locked to the 1 pulse per second output of a GPS receiver. Events detected by at least 6 sensors are then located in three dimensional space and time.
VHF networks normally consist of 10-20 stations separated by tens of kilometers, all within approximately 60 km of the center of the network. Each station is elevated some 15 meters above the ground and detects radio frequency bursts in the frequency range from 60-150 MHz. Many different VHF systems have been developed, including the SAFIR, LDAR, LMA and PROFEO networks.
An example of the detection of an individual lightning flash using the VHF method is shown in Figure 2 (14). The top panel represents the temporal evolution of the radiation sources (color represents time) as a function of detection altitude. The single flash lasted approximately 1.5 second, and connected to ground at second 22 (triangle), with two separate connection points with the ground. The VHF sensors are shown by the green boxes in the plan view (bottom left). This flash covered a horizontal scale of around 75km. The additional panels show east-west and north-south vertical projections of the lightning discharge.
2.2 Very Low Frequency (VLF) sensors
Due to the lower attenuation of the atmospheric radio waves at VLF frequencies (3-30 kHz) (15), VLF sensors can be separated by hundreds to thousands of kilometers, while still being able to detect the VLF radiation emitted by individual lightning flashes. Many such regional networks using VLF sensors have been set up around the globe (16, 6, 17, 18). The radio waves detected in the VLF range are known as atmospherics, or “sferics”. Both DF and TOA methods can be used in locating the source of the VLF sferics, while the peak VLF field can be related to the peak current of the parent lightning. The VLF sensors are either orthogonal magnetic loop antennas, or a vertical electric field whip antenna. The size can range from a few centimeters to tens of meters, depending on the sensitivity required. Using additional electric field sensors, the polarity (positive or negative) of the parent lightning can also be determined. Hence, VLF networks provide wide geographical coverage together with additional important information about the type and strength of the lightning flashes. These parameters may also have important uses in understanding which storms will develop into severe weather events.
Most lightning networks used today around the globe are of the VLF type, since they supply great regional coverage, reasonable spatial accuracy, while also providing additional information about the lightning return stroke (peak current, polarity, multiplicity, etc.). Some networks of this type are the NALDN, EUCLID, UK-ATD, ZEUS, RINDAT, LINET and WWLLN.
The one disadvantage of using VLF sensors over large regions is that the sensors are sensitive primarily to vertically oriented lightning discharges, while the detection efficiency of these flashes depends on the spacing of the sensors. Hence, much of the horizontal intracloud (IC) lightning is not detected by these large scale networks. Since intracloud lightning makes up ∼70% of all lightning, VLF networks are limited in their ability to track the entire development of thunderstorms. Nevertheless, they allow us to monitor thunderstorm activity at great distances from the sensors, and recent VLF networks have started to cover the entire globe (19). An example from the WWLLN network (World Wide Lightning Location Network) is shown in Figure 3, where the blue dots represent the lightning locations detected by the VLF sensors shown by the red asterisks. The lightning flashes agree well with the cloud images from the METEOSAT satellite. As shown in the figure, all areas producing lightning in Africa at this time (1400UT) are detected using sensors located at great distances from the thunderstorms. The closest sensors are located in Durban, Cape Town, Ascension Island, Lisbon and Tel Aviv. It should be noted that at these distances only the most intense lightning discharges are detected by the network. Nevertheless, for the real time detection and warning of natural hazards, such a network may be sufficient in remote regions of the globe. The WWLLN uses an improved time-of-group-arrival (TOGA) methodology for determining the time of arrival of the sferic at each station. Due to dispersion of the waveforms in the Earth-ionosphere waveguide, the normal TOA method leads to inaccuracies in the time the pulse arrives at the station, and hence the distance to the parent lightning. Using the group velocity allows for more accurate timing, and locations errors of less than 10 km anywhere on the globe (20).
2.3 Extremely Low Frequency (ELF) sensors
In the ELF (3-300 Hz) range the radio waves from lightning undergo very little attenuation, and hence manage to propagate around the globe a number of times before decaying into the background noise (21). An interesting phenomenon, called the Schumann resonances (SR), occurs due to the constructive interference of these ELF as they propagate around the globe. Due to the circumference of the Earth (∼40,000 km) the Schumann resonances occur at 8, 14, 20 ….Hz, supplying a continuous measure of global lightning activity.
ELF sensors are normally a combination of horizontal magnetic induction coils, and vertical electric field sensors. The induction coils are approximately 1.5 meters long, and buried in the ground to reduce noise levels. The coils need to be sensitive at the pT (10-12 Tesla) level in order to detect global lightning signals. The vertical electric antenna is normally a ball-antenna 2-10 meters above the ground. Most ELF stations detect only the horizontal magnetic ELF fields, while a complete ELF station will observe three components of the electromagnetic field (Hx, Hy and Ez). Intense lightning discharges, associated with a large charge transfer and often high peak current (22, 23) often exceed the SR background level by a factor of 10. When these very intense lightning discharges can be isolated from the background global activity, is it possible to determine the source locations even when using only a single ELF station (24, 25, 26, 27).
The ELF lightning location can be obtained with either multi-station or single-station techniques. The multi-station techniques are more accurate, but require more complicated and expensive facilities, involving a network of direction finders or time-of-arrival sensors (28), as is the case with the VHF and VLF methods. Single-station ELF systems usually combine a direction finder with a source-receiver distance estimation technique, using the relationship between the electric and the magnetic field components (23, 24, 26, 29). However, the location of the source lightning using ELF techniques has an accuracy of 500-1000km when using a single-station measurement. Although this is a fairly poor resolution, a single station can nevertheless supply real time global coverage of intense lightning flashes.
3. Applications for hazardous weather conditions
Lightning frequencies, polarities, and lightning types (IC and CG) are known to be related to microphysical and dynamical processes within storms (30). Hence, monitoring continuously lightning activity can supply important information about storm development and intensity. Numerous case studies have been published where lightning activity has been observed to change dramatically before the start of severe damaging weather.
Price and Murphy (31) studied a wind storm called a derecho, where 12.5 million trees were destroyed in a national park along the US-Canada border within a few hours. A derecho is a straight-line wind storm (unlike a tornado with spiraling winds) that occurs under very specific meteorological conditions. While normally the majority of cloud-to-ground (CG) lightning detected by VLF sensors has negative polarity (CG-), during this derecho the positive fraction of lightning (CG+) rose to 80% for more than 2 hours.
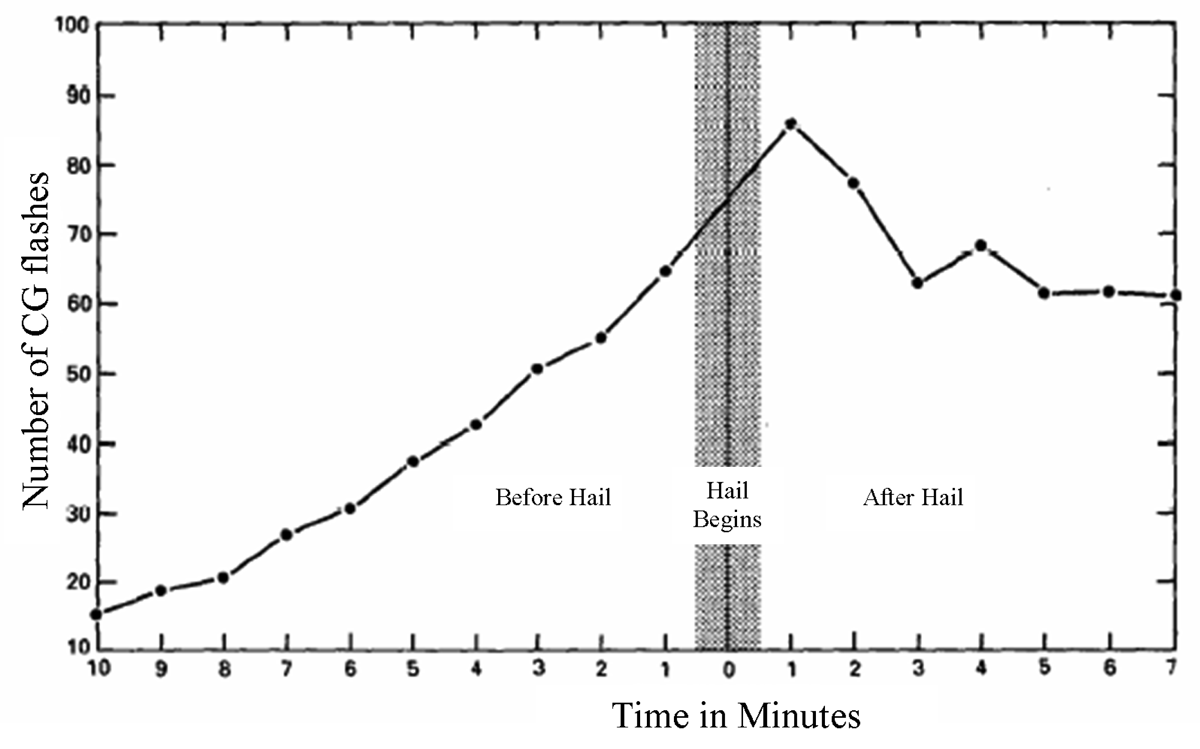
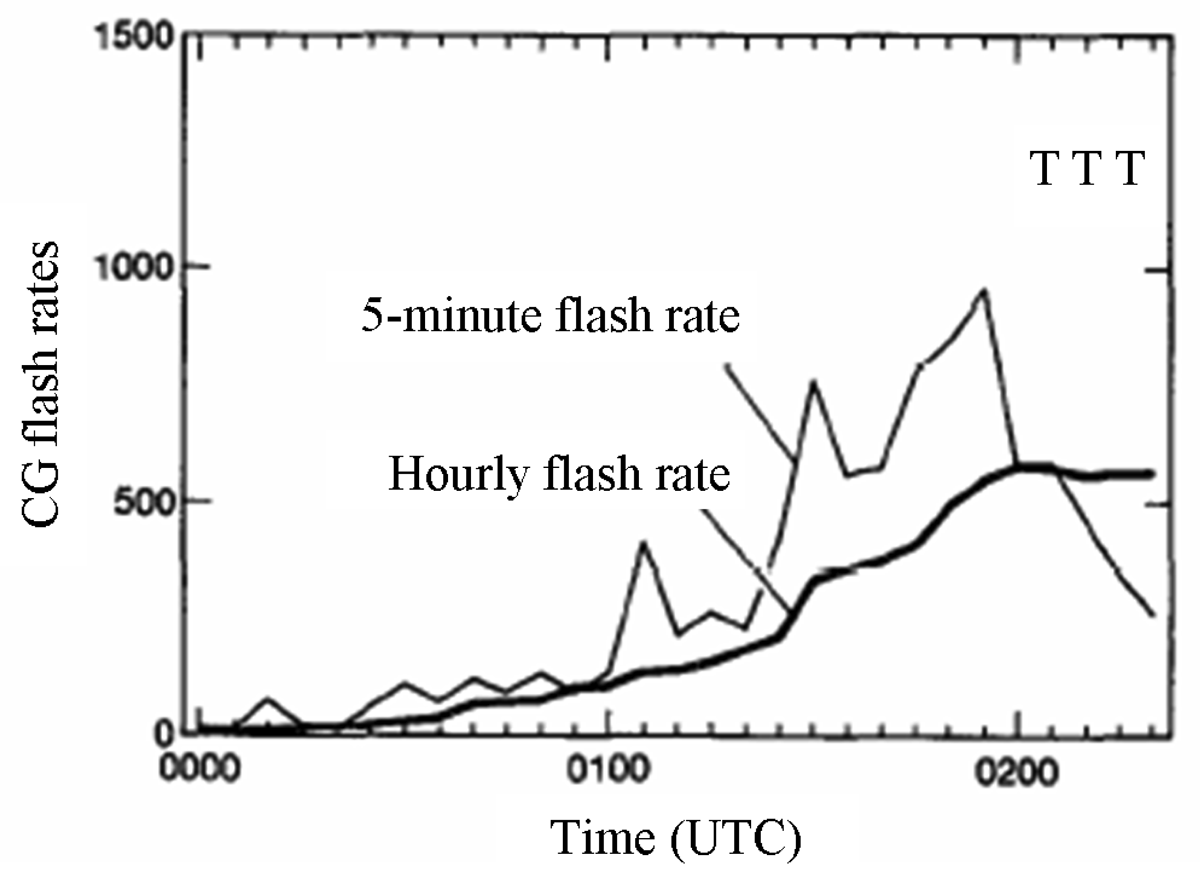
Carey et al. (32) and others (33) have detected significantly anomalous lightning activity associated with tornados. On 30 May 1998, a tornado devastated the town of Spencer, South Dakota. The Spencer tornado (rated F4 on the Fujita tornado intensity scale) was the third and most intense of five tornados produced by a single supercell storm during an approximate 1-h period. The supercell produced over 76% CG+ lightning and a peak CG+ flash rate of 18 flashes min-1 (5-min average) during a 2-h period surrounding the tornado damage. Kane (34) and Perez et al.(35) have shown a peak in lightning activity prior to the formation of dozens of tornadoes in the United States. Figure 4 shows one example showing the intensification of lightning activity shortly before the occurrence of a tornado, and the decrease in lightning activity commonly observed during the tornado lifetime.
Changnon (36) studied the spatial and temporal relationship between damaging hail and CG lightning. Lightning activity was always closely associated with hail (Figure 5), with the peak lightning activity generally associated with the start of the hail falling on the ground. In addition, the thunderstorm cells where CG flashes were closely associated with hail typically developed 9 min before hail was observed, and at a point 5 km upstorm from first hail, suggesting that CG flashes began as the hailstones were developing aloft. The hailstorm's severity was also found to be well correlated to the rate of flashing during the hailfall.
Carey and Rutledge (37) found extremely high IC-to-CG ratios (IC/CG ∼ 20-70) and predominantly CG+ lightning (over 74%) when storms are producing large hail and weak tornados. Similar results were found during the STEPS project in the United States (38) and observations in southern Europe (39).
Many studies have looked at the connection between lightning and rainfall in severe storms, some of which can produce flash floods with dramatic consequences to loss of life and damage to infrastructure and property. Soula et al. (40) showed that in a flash flood that killed more than 80 persons, the CG flash density was exceptionally high, and the peak flash rate averaged over 5-minute periods reached 11.6 min-1 within the cell area. The evolution of the CG flash rate and the radar reflectivity were closely correlated, with a very good agreement between the location of the intense rain at the ground and the high CG flash density. More importantly, the flash rate reached high values before the arrival of the precipitation at the ground, which provides hope that lightning could possibly be used for early warnings (nowcasting) of flash floods. Many studies show a positive correlation between lightning and precipitation amounts (41, 42, 43, 44, 45) allowing lightning to be used as a possible parameter for estimating rainfall in regions of the globe without radar coverage.
It has also recently been shown that lightning activity may also be linked to hurricane generation (46, 47). Not only was it shown that the majority of Atlantic hurricanes start off as intense thunderstorms over the African continent, but the large difference in the number of Atlantic hurricanes between 2005 and 2006 is also reflected in a significant difference in the amount of lightning over tropical Africa during these years.
Finally, lightning monitoring may also be valuable for studying the Earth's changing climate. Numerous studies have shown a connection between global lightning activity and the Earth's temperature(48, 49, 50), the amount of water vapour in the upper tropospheric(51), the production of nitrogen oxides (NOx) in the atmosphere(52, 53), and cloud cover(54). Hence lightning monitoring may be useful for studying both severe weather and climate change.
4. Summary and Conclusions
This paper presents a range of ground-based lightning sensors that can be used for tracking, monitoring and even nowcasting of thunderstorms that produce hazardous weather conditions around the globe. These sensors detect the electromagnetic radiation emitted by lightning discharges in different frequency bands, from very high frequencies (VHF) in the megahertz range, to very low frequencies (VLF) in the kilohertz range, and even extremely low frequencies (ELF) in the 3-300 Hz range (Table 1). The different sensors can detect different aspects of the lightning flash, and at different ranges. Sensors using lower detection frequencies manage to detect lightning to greater distances. However, as the frequency decreases so does the spatial accuracy and the detection efficiency.
Depending on the hazard imposed by severe weather, different detection systems should be chosen. For example, the protection of a small area such as an airport, nuclear power plant, sports event, etc., would benefit greatly from a VHF system that can detect all lightning types, both within and below clouds, while mapping the 3-D structure of each lightning discharge within a storm. For hazards in remote regions, such as civil aviation over the Mediterranean Sea, VLF systems are preferable, giving regional real time coverage of the location, development and motion of thunderstorms. For global studies of lightning climatology for risk assessment, ELF systems may be preferable, supplying an integration of the lightning activity on a regional or global scale continuously, while also being able to detect individual intense lightning discharges anywhere on the globe.
Changes in observed lightning characteristics can often be linked to changes in the severity of storms, and the hazards associated with them. Numerous studies have shown connections between changes in lightning characteristics in storms and wind damage, hail amounts, tornado initiation, flash floods, and even hurricane formation. However, there are also exceptions where either changes in lightning characteristics are not related to severe weather, or severe weather was not associated with significant changes in lightning activity. Hence, this field of research is still wide open, but presents an exciting challenge for scientist due to the large impact these extreme weather events have on society, especially with recent trends showing a large increase in economic losses due to extreme weather events.
Acknowledgments
Part of this research is supported by the European Union FP6 FLASH project, under grant no. 036852.
References and Notes
- Intergovernmental Panel on Climate Change (IPCC). Climate Change 2007: The Physical Science Basis. World Meteorological Organization (WMO) and UN Environment Programme (UNEP) 2007. [Google Scholar]
- Rison, W.; Thomas, R.J.; Krehbiel, P.R.; Hamlin, T.; Harlin, J. A GPS-based three dimensional lightning mapping system: Initial observations in central New Mexico. Geophys. Res. Lett. 1999, 26, 3573–3576. [Google Scholar]
- Wood, T.G.; Inan, U.S. Long-range tracking of thunderstorms using sferic measurements. J. Geophys. Res. 2002, 107, D21. 4553. [Google Scholar] [CrossRef]
- Greenberg, E.; Price, C. A global lightning location algorithm based on the electromagnetic signature in the Schumann resonance band. J. Geophys. Res. 2004, 109. D21111. [Google Scholar] [CrossRef]
- Krider, E.P.; Noggle, R.C.; Uman, M.A. A gated wideband magnetic direction-finder for lightning return strokes. J. Appl. Meteor. 1976, 15, 301–306. [Google Scholar]
- Lee, A.C.L. Ground truth confirmation and theoretical limits of an experimental VLF arrival time difference lightning flash locating system. Quart. J. Roy. Meteor. Soc. 1989, 115, 1147–1166. [Google Scholar]
- Cummings, K.L.; Murph, M.J.; Bardo, E.A.; Hiscox, W. L.; Pyle, R.B.; Pifer, A.E. A combined TOA/MDF technology upgrade of the US National Lightning Detection Network. J. Geophys. Res. 1998, 103(D8), 9035–9044. [Google Scholar]
- Hayenga, C.O.; Warwick, J.W. Two-dimensional interferometric positions of VHF lightning sources. J. Geophys. Res. 1981, 86, 7451–7462. [Google Scholar]
- Kawasaki, Z.I.; Yamamoto, K.; Matsuura, K.; Richard, P.; Matsui, T.; Sonoi, Y.; Shimokura, N. SAFIR operation and evaluation of it's performance. Geophys. Res. Lett. 1994, 21(12), 1133–1136. [Google Scholar]
- Goodman, S.; Blakeslee, R.; Christian, H.; Koshak, W.; Bailey, J.; Hall, J.; McCaul, E.; Buechler, D.; Darden, C.; Burks, J.; Bradshaw, T.; Gatlin, P. The North Alabama Lightning Mapping Array: Recent severe storm observations and future prospects. Atmos. Res. 2005, 76(1-4), 423–437. [Google Scholar]
- Richard, P.; Auffray, G. VHF-UHF interferometric measurements, applications to lightning discharge mapping. Radio Sci. 1985, 20, 171–192. [Google Scholar]
- Shao, X.M.; Krehbiel, P.R.; Thomas, R.J.; Rison, W. Radio interferometric observations of cloud-to-ground lightning phenomena in Florida. J. Geophys. Res. 1995, 100, 2749–2783. [Google Scholar]
- Proctor, D.E. A hyperbolic system for obtaining VHF radio pictures of lightning. J. Geophys. Res. 1971, 76, 1478–1489. [Google Scholar]
- Krehbiel, P.R.; Thomas, R.J.; Rison, W.; Hamlin, T.; Harlin, J.; Davis, M. GPS-based mapping system reveals lightning inside storms. Eos, Transactions American Geophysical Union 2000, 81(3), 21–21. [Google Scholar]
- Pierce, E.T. Atmospherics and radio noise. Lightning, Vol. 1: Physics of Lightning 1977, 351–384. [Google Scholar]
- Krider, E.P.; Noggle, R.C.; Pifer, A.E.; Vance, D.L. Lightning direction finding systems for forest fire detection. Bull. Amer. Meteot. Soc. 1980, 61, 980–986. [Google Scholar]
- Defer, E.; Lagouvardos, K.; Kotroni, V. Lightning activity in the eastern Mediterranean region. J. Geophys. Res. 2005, 110(D24). [Google Scholar] [CrossRef]
- Lay, E.H.; Jacobson, A.R.; Holzworth, R.H.; Rodger, C.J.; Dowden, R.L. Local time variation in land/ocean lightning flash density as measured by the World Wide Lightning Location Network. J. Geophys. Res. 2007, 112(D13). [Google Scholar] [CrossRef]
- Rodger, C.J.; Werner, S.; Brundell, J.B.; Lay, E.H.; Thomson, N.R.; Holzworth, R.H.; Dowden, R.L. Detection efficiency of the VLF World-Wide Lightning Location Network (WWLLN): initial case study. Annales Geophysicae 2006, 24(12), 3197–3214. [Google Scholar]
- Lay, E.H.; Holzworth, R.H.; Rodger, C.J.; Thomas, J.N.; Pinto, O., Jr.; Dowden, D.L. WWLL global lightning detection system: Regional validation study in Brazil. Geophys. Res. Lett. 2004, 31. L03102. [Google Scholar] [CrossRef]
- Price, C.; Pechony, O.; Greenberg, E. Schumann resonances in lightning research. J. of Lightning Res. 2007, 1, 1–15. [Google Scholar]
- Ogawa, T.; Tanka, Y.; Miura, T.; Yasuhara, M. Observations of natural ELF electromagnetic noises by using the ball antennas. J. Geomagn. Geoelectr. 1966, 18, 443–454. [Google Scholar]
- Huang, E.; Williams, E.; Boldi, R.; Heckman, S.; Lyons, W.; Taylor, M.; Nelson, T.; Wong, C. Criteria for sprites and elves based on Schumann resonance observations. J. Geophys. Res. 1999, 104(D14), 16943–16952. [Google Scholar]
- Kemp, D.T.; Ll. Jones, D. A new technique for the analysis of transient ELF electromagnetic disturbances within the Earth–ionosphere cavity. J. Atmos. Terr. Phys. 1971, 33, 567–572. [Google Scholar]
- Burke, C.P.; Ll. Jones, D. Global radiolocation in the lower ELF frequency band. J. Geophys. Res. 1995, 100(D12), 26263–26272. [Google Scholar]
- Greenberg, E.; Price, C. A global lightning location algorithm based on the electromagnetic signature in the Schumann resonance band. J. Geophys. Res. 2004, 109(D21). [Google Scholar] [CrossRef]
- Price, C.; Greenberg, E.; Yair, Y.; Sátori, G.; Bór, J.; Fukunishi, H.; Sato, M.; Israelevich, P.; Moalem, M.; Devir, A.; Levin, Z.; Joseph, J.H.; Mayo, I.; Ziv, B.; Sternlieb, A. Ground-based detection of TLE-producing intense lightning during the MEIDEX mission on board the Space Shuttle Columbia. Geophys. Res. Lett. 2004, 31. L20107 doi:1029/2004GL020711. [Google Scholar]
- Rafalsky, V.A.; Shvets, A.V.; Hayakawa, M. One-site distance-finding technique for locating lightning discharges. J. Atmos. Solar-Terr. Phys. 1995, 57(11), 1255–1261. [Google Scholar]
- Price, C.; Asfur, M.; Lyons, W.; Nelson, T. An improved ELF/VLF method for globally geolocating sprite-produced lightning. Geophys. Res. Lett. 2002, 29(3). [Google Scholar] [CrossRef]
- Williams, E.R. The electrification of severe storms. Severe Convective Storms 2001, 27(49), 570. [Google Scholar]
- Price, C.; Murphy, B. Lightning activity during the 1999 Superior Derecho. Geophys. Res. Lett. 2002, 29(23), 57.1–57.4. [Google Scholar]
- Carey, L.D.; Petersen, W.A.; Rutledge, S.A. Evolution of Cloud-to-Ground Lightning and Storm Structure in the Spencer, South Dakota, Tornadic Supercell of 30 May 1998. Mon. Wea. Rev. 2003, 131(8), 1811–1131. [Google Scholar]
- Seimon, A. Anomalous cloud-to-ground lightning in an F5-tornado-producing supercell thunderstorm on 28 August 1990. Bull. Amer. Met. Soc. 1993, 74(2), 189–203. [Google Scholar]
- Kane, R.J. Correlating lightning to severe local storms in the northeastern United States. Weather and Forecasting 1991, 6(1), 3–12. [Google Scholar]
- Perez, A. H.; Wicker, L.J.; Orville, R.E. Characteristics of cloud-to-ground lightning associated with violent tornadoes. Mon. Wea. Rev. 1997, 12(3), 428–437. [Google Scholar]
- Changnon, S.A. Temporal and Spatial Relations between Hail and Lightning. J. Appl. Meteor. 1992, 31(6), 587–604. [Google Scholar]
- Carey, L.A.; Rutledge, S.A. Electrical and multiparameter radar observations of a severe hailstorm. J. Geophys. Res. 1998, 103(D12), 13979–14000. [Google Scholar]
- Kyle, C.W.; Rutledge, S.A.; Tessendorf, S.A. The 29 June 2000 supercell observed during STEPS. Part II: Lightning and charge structure. J. Atmos. Res. 2005, 62(12), 4151–4177. [Google Scholar]
- Soula, S.; Seity, Y.; Feral, L.; Sauvageot, H. Cloud-to-ground lightning activity in hail-bearing storms. J. Geophys. Res. 2004, 109. D02101. [Google Scholar] [CrossRef]
- Soula, S.; Sauvageot, H.; Molinié, G.; Mesnard, F.; Chauzy, S. The CG lightning activity of a storm causing a flash-flood. Geophys. Res. Lett. 1998, 25(8), 1181–1184. [Google Scholar]
- Piepgrass, M.V.; Krider, E.P.; Moore, C.B. Lightning and surface rainfall during Florida thunderstorms. J. Geophys. Res. 1982, 87(C13), 11193–2001. [Google Scholar]
- Tapia, A.; Smith, J.; Dixon, M. Estimation of convective rainfall from lightning observations. J. Appl. Meteorol. 1998, 37(11), 1497–1509. [Google Scholar]
- Petersen, W.A.; Rutledge, S.A. On the relationship between cloud-to-ground lightning and convective rainfall. J. Geophys. Res. 1998, 103(12), 14025–14040. [Google Scholar]
- Zhou, Y.; Qie, X.; Soula, S. A study of the relationship between cloud-to-ground lightning and precipitation in the convective weather system in China. Annales Geophysicae 2002, 20(1), 107–113. [Google Scholar]
- Price, C.; Federmesser, B. Lightning-rainfall relationships in Mediterranean winter thunderstorms. Geophys. Res. Lett. 2006, 33. L07813. [Google Scholar] [CrossRef]
- Price, C.; Yair, Y.; Asfur, M. East African lightning as a precursor of Atlantic hurricane activity. Geophys. Res. Lett. 2007, 34. L09805 doi:1029/2006GL028884. [Google Scholar]
- Chronis, T.; Williams, E.; Anagnostou, M.; Petersen, W. African lightning: indicator of tropical Atlantic cyclone formation. EOS, Transactions, American Geophysical Union 2007, 88(40), 397–408. [Google Scholar]
- Williams, E.R. The Schumann Resonance: a global tropical thermometer. Science 1992, 256, 1184–1186. [Google Scholar]
- Price, C. Global surface temperatures and the atmospheric electric circuit. Geophys. Res. Lett. 1993, 20, 1363–1366. [Google Scholar]
- Williams, E.R. Lightning and climate: A review. Atmos. Res. 2005, 76, 272–287. [Google Scholar]
- Price, C.; Asfur, M. Can lightning observations be used as an indicator of upper-tropospheric water vapor variability? Bull. Amer. Meteor. Soc. 2006, 87, 291–298. [Google Scholar]
- Price, C.; Penner, J.; Prather, M. NOx from Lightning, Part I: Global Distribution Based on Lightning Physics. J. Geophys. Res. 1997, 102, 5929–5941. [Google Scholar]
- Schumann, U.; Huntrieser, H. The global lightning-induced nitrogen oxides source. Atmos. Chem. Phys. Discuss. 2007, 7, 2623–2818. [Google Scholar]
- Sato, M.; Fukunishi, H. New evidence for a link between lightning activity and tropical upper cloud coverage. Geophys. Res. Lett. 2005, 32. L12807. [Google Scholar] [CrossRef]
Figure 1.
Annual global costs (in billions of US dollars) of extreme weather events from 1950 to 2003 (Munich Re, 2004; UNEP/GRID, 2005 - http://maps.grida.no/go/graphic/global_costs_of_extreme_weather_events.) The decadal number of extreme meteorological events is also shown.
Figure 1.
Annual global costs (in billions of US dollars) of extreme weather events from 1950 to 2003 (Munich Re, 2004; UNEP/GRID, 2005 - http://maps.grida.no/go/graphic/global_costs_of_extreme_weather_events.) The decadal number of extreme meteorological events is also shown.

Figure 2.
VHF observations of an individual lightning discharge in a thunderstorm (14). Each dot represents a source of radiation along the lightning channel, as a function of time (color), altitude and direction (north-south and east-west).
Figure 2.
VHF observations of an individual lightning discharge in a thunderstorm (14). Each dot represents a source of radiation along the lightning channel, as a function of time (color), altitude and direction (north-south and east-west).
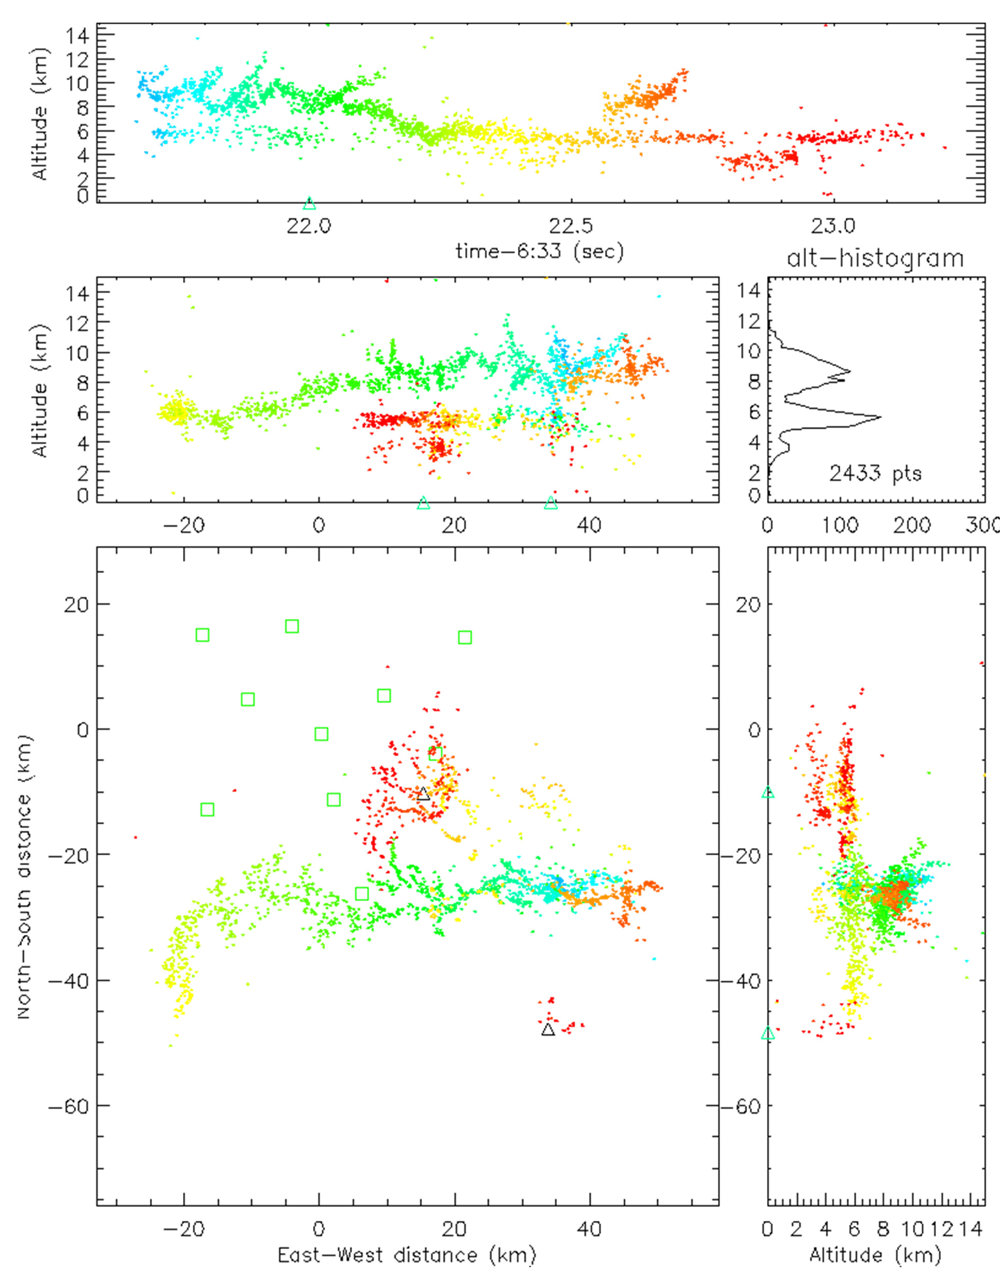
Figure 3.
Lightning locations (blue dots) between 1300-1400UT on 11 March 2007. The VLF lightning sensors are located at the locations marked by the red asterisks, and the red line represents the position of the day-night terminator (sunset) ( http://webflash.ess.washington.edu/).
Figure 3.
Lightning locations (blue dots) between 1300-1400UT on 11 March 2007. The VLF lightning sensors are located at the locations marked by the red asterisks, and the red line represents the position of the day-night terminator (sunset) ( http://webflash.ess.washington.edu/).
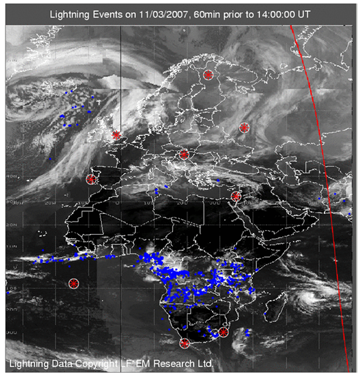
Figure 4.
The 5-min and hourly CG lightning prior to a tornado (T) in the United States(34).
Figure 4.
The 5-min and hourly CG lightning prior to a tornado (T) in the United States(34).

Figure 5.
The temporal evolution of lightning activity associate with 48 hail events in the United States(36).
Figure 5.
The temporal evolution of lightning activity associate with 48 hail events in the United States(36).

Table 1.
Summary of three main types of lightning sensors used for tracking thunderstorms. See text for explanations of abbreviations.
| Sensors | Frequency (Hz) | Location Techniques | Spatial Coverage | Location Accuracy | Type of Lightning Detected | Detection Efficiency (% of total) |
|---|---|---|---|---|---|---|
| VHF | ∼ 108 | TOA, IF | Local | meters | Total: IC, CG | >90% |
| VLF | ∼104 | DF, TOA | Regional | kilometers | Mainly CG | <25% |
| ELF | ∼10 | DF | Global | Megameters | CG | <5% |
© 2008 by MDPI Reproduction is permitted for noncommercial purposes.
Share and Cite
MDPI and ACS Style
Price, C. Lightning Sensors for Observing, Tracking and Nowcasting Severe Weather. Sensors 2008, 8, 157-170. https://doi.org/10.3390/s8010157
AMA Style
Price C. Lightning Sensors for Observing, Tracking and Nowcasting Severe Weather. Sensors. 2008; 8(1):157-170. https://doi.org/10.3390/s8010157
Chicago/Turabian StylePrice, Colin. 2008. "Lightning Sensors for Observing, Tracking and Nowcasting Severe Weather" Sensors 8, no. 1: 157-170. https://doi.org/10.3390/s8010157