An Integrated GIS-Expert System Framework for Live Hazard Monitoring and Detection

1
University of Windsor, Department of Earth and Environmental Sciences, 401 Sunset Ave., Windsor, Ontario, Canada, N9B 3P4
2
Environmental Research Systems Institute, 380 New York Street, Redlands, California, USA
*
Author to whom correspondence should be addressed.
Sensors 2008, 8(2), 830-846; https://doi.org/10.3390/s8020830
Submission received: 4 January 2008
/
Accepted: 1 February 2007
/
Published: 8 February 2008
(This article belongs to the Special Issue Sensors for Disaster and Emergency Management Decision Making)
Abstract
:In the context of hazard monitoring, using sensor web technology to monitor and detect hazardous conditions in near-real-time can result in large amounts of spatial data that can be used to drive analysis at an instrumented site. These data can be used for decision making and problem solving, however as with any analysis problem the success of analyzing hazard potential is governed by many factors such as: the quality of the sensor data used as input; the meaning that can be derived from those data; the reliability of the model used to describe the problem; the strength of the analysis methods; and the ability to effectively communicate the end results of the analysis. For decision makers to make use of sensor web data these issues must be dealt with to some degree. The work described in this paper addresses all of these areas by showing how raw sensor data can be automatically transformed into a representation which matches a predefined model of the problem context. This model can be understood by analysis software that leverages rule-based logic and inference techniques to reason with, and draw conclusions about, spatial data. These tools are integrated with a well known Geographic Information System (GIS) and existing geospatial and sensor web infrastructure standards, providing expert users with the tools needed to thoroughly explore a problem site and investigate hazards in any domain.
1. Introduction
Hazard managers, administrators, and planners involved in hazard evaluation as well as those in decision making positions need improved methods beyond simple data analysis to monitor hazards that have the potential to harm populations and critical infrastructure. The use of computer-based software tools such as spatial decision support systems (SDSS) to help users explore current conditions can aid them in making complex decisions. An SDSS embodies geomatics principles for situating decision-making in space, often using a geographic information system (GIS) component to provide spatial analysis functionality.
Current sensor web infrastructure technology, as well as the analysis tools that use the collected data, takes a data-centric approach. Raw data is used to feed relatively static analysis methods while interpretation of the result is left to the user. By shifting towards a more information-centric approach to collect and use sensor measurements, we can enable more advanced analysis techniques. These techniques can make use of stored knowledge about not only sensor measurements and what they represent, but also how they were made and the landscape context which surrounds them. Our goal is to perform information-centric analysis within a GIS-based decision support environment using expert knowledge and to show how this can improve the interpretation of results by both the software and a human expert user. However, since most GIS tools do not support knowledge-based reasoning, any monitoring system built upon a GIS tends to be rather data-centric. This means that we must first enable the information-based perspective within the SDSS.
This paper presents our approach to enabling this information-centric perspective through the development of an SDSS and associated infrastructure which can be used to monitor any domain of interest; as an example, our current work focuses on monitoring slopes for geotechnical hazards [1]. Part of this infrastructure includes the use of ontologies, or formal encodings of domain concepts and their interrelationships, to represent important concepts in the monitoring and sensor web domains. Several examples of applying ontologies to sensor network research and sensor data have emerged in recent years, including OntoSensor [2], Microsoft's SenseWeb project [3], and work by Avancha et al. [4] and Goodwin et al. [5].
We apply our ontologies as part of REASON (Real-time Evaluation Applying Sensor ONtologies), a spatial decision support framework which can be used to build a domain-specific SDSS through the use of ontologies, or formal encodings of domain concepts and their interrelationships. REASON is built on a framework which integrates an expert system with a GIS. An expert system is a software tool that supports problem representation and reasoning with expert knowledge. It is particularly well suited to handling situations where the problem is poorly structured and so is not amenable to traditional programming or automation methods. This meshes well with the domain of hazard monitoring as we are often working in unstructured problem spaces with varying degrees of data availability. The C Language Integrated Production System (CLIPS), and the ArcGIS geomatics tool were coupled to produce ArcAgents (described in [6]). In this system the CLIPS engine provides the reasoning support, while ArcGIS handles the spatial analysis responsibilities. ArcAgents provides the bridge between the two, allowing the CLIPS engine to make inferences on the results of ArcGIS spatial analysis functions as well as on the spatial relationships between features stored in the GIS layers. The use of an expert system language such as CLIPS provides resources needed for the types of analysis which cannot be accomplished by simple data-centric analysis methods. Concepts in the domain of interest (such as shear zones, critical slope movement, and relationships between material blocks) and more general spatial and temporal concepts (such as adjacency and connectedness) can be described within the expert system using ‘rules’. These concepts can then be related to the observations, represented as ‘facts’ made in the monitored environment. The expert system can then apply deductive reasoning to the facts, concepts, and rule-based relationships to uncover implicit observations that are identified as important to the hazard problem. We apply ArcGIS as our GIS engine as it is the industry standard for GIS technology, and is most likely to be familiar or available to many expert users. CLIPS, ArcGIS, and ArcAgents form the main backbone of REASON. Section 2 explores the use of SDSS for hazard monitoring and shows how an SDSS is built using REASON.
In order to use an expert system's capability to assist with complex evaluation in geotechnical hazard monitoring, the system must have access to current data relevant to the problem. Real-time observations from sensors are becoming available using a variety of related sensor network, telemetry, and observation service technologies that rely on emerging geospatial data standards. In Section 3 we describe the creation of sensor data that can be used to feed an ontology-based SDSS. Our system is driven by sensor data stored in a Sensor Observation Service (SOS) [7] database. The data is pulled from the database and, through the use of a transformation engine, is converted on-the-fly into CLIPS code that can be used for knowledge-based analysis. This paper also explores the concept of sensor webs and how they can be used for geotechnical hazard monitoring by showing an example monitoring application in Section 4.
2. REASON: A Spatial Decision Support Framework Incorporating Sensor Data
2.1. Spatial Decision Support Systems
A decision support system (DSS) is an interactive, computer-based system designed to support a user or group of users in achieving more effective decision making while solving a semi-structured decision problem. A spatial decision support system (SDSS) supports problem domains which have a strongly spatial aspect [8]. Since the problem of hazard detection is often unstructured and open-ended, an SDSS is a natural choice for this type of problem investigation. Spatial decision support systems provide an environment for expert users to apply their expertise to solve domain-specific problems. By aiding users in decision making and providing them with access to large amounts of significant spatial data, SDSS are powerful problem-solving tools.
In the hazards domain, SDSS can be very effective for handling the management and monitoring of spatial data. Typical data-centric approaches to hazard monitoring have resulted in systems which can perform some basic analysis routines based on quantifiable parameters such as thresholds and ranges [e.g. 9-12]. These approaches certainly have a useful place in this domain, however by shifting the approach to one which is more information-centric we can accomplish the same goals as more data-centric systems, while at the same time draw deductive conclusions from the data we are receiving and their relationships, which may be of interest to an expert user. These conclusions could take the form of areas of emerging concern or precursor conditions to potential hazards based on accumulated knowledge of a domain, or comparisons with other sites with similar characteristics and the outcomes of prior situations at these sites, making automated monitoring a more ‘intelligent’ process.
2.2 REASON
The REASON (Real-time Evaluation Applying Sensor ONtologies) spatial decision support framework, which is described in detail in [6], is a tool which can be used to develop a spatial decision support system to monitor a user-defined domain. It is a platform for the evaluation of sensor data, assuming that the data are represented in an appropriate format (a concept discussed more thoroughly in Section 3). It was developed using the ArcAgents tool which bridges CLIPS, a programming language geared toward the development of expert systems, and ESRI's ArcGIS. REASON makes use of ontologies to partition and organize the knowledge it has about a given problem domain. Ontologies are often used where knowledge definition is a key component of the problem-solving process. One of the most general definitions of an ontology is a “specification of a conceptualization” [13]. By specifying the concepts relevant to a universe of interest, and the relationships between those concepts, a more formalized definition of a domain can be created. When the ontology is created in a machine-readable language, then software can be created that works with this stored knowledge to drive analysis methods. The ontological structure we use is a variant on one proposed by O'Brien and Gahegan [14], in which there are four separate but related ontologies which are used to contain all of the knowledge required by the system (Figure 1). These ontologies contain facts which describe the relevant concepts and objects in the problem domain, and rules which govern their behaviour. The “Spatial-Temporal Ontology” is the high-level ontology used to define foundational concepts such as geometry, topology, and temporal relationships. Two mid-level ontologies build on the concepts from the Spatial-Temporal ontology: the “Domain Ontology” and the “Sensor Ontology”. The domain ontology is used to describe the concepts related to the domain being observed, for example shear zones and downslope motion. The sensor ontology describes the sensors which are used to perform the observation. Finally, the low-level “Application Ontology” contains the concepts and logic related to the execution and capabilities of our given monitoring application. This includes the decision trees which govern the analysis of incoming and archived sensor data. The application ontology builds on the knowledge from the two mid-level (Sensor and Domain) ontologies, and thus from the spatial-temporal ontology as well.
One of the key design features of REASON is that the mechanism to bring data into the system has been abstracted so various types of data and sources can be used within the system in a common way. Different monitoring scenarios will have different data requirements, and quite often these monitoring and database requirements will determine how the data are stored. Low power networks will require short messages with minimal transmitted information, whereas higher power, wired networks may be able to transmit messages with more complex structures. When an SDSS is built upon the REASON framework, it defines the data source(s) it will use and provides an implementation of the abstract DATA-SOURCE class which defines how the SDSS should connect to and disconnect from the data source, as well as how data are updated and how update cycles are handled. In this way, any data source can be used within a REASON SDSS. Data can be stored in ESRI shapefiles, databases, spreadsheets, text files, XML files, or any other format as long as an appropriate data source class is created. The example system described in Section 4, as well as the supporting infrastructure from Section 3, make use of a Sensor Web Enablement (SWE) Sensor Observation Service (SOS) database for retrieving sensor measurements and descriptions. The system has also been tested successfully using Excel spreadsheets as a data source.
A Sensor Observation Service can store, manage, and organize sensor data as well as sensor descriptions. These data are used as responses to queries, allowing parties that are interested in the data, such as a software tool or expert user, to query the server for data that are relevant to their needs. By creating an implementation of the DATA-SOURCE class that can communicate with an SOS server we can effectively tie REASON to an SOS, providing the user with the most relevant and detailed information about their monitored site. The Sensor Observation Service is part of the Open Geospatial Consortium's Sensor Web Enablement activity which will be further explored in Section 3.2.
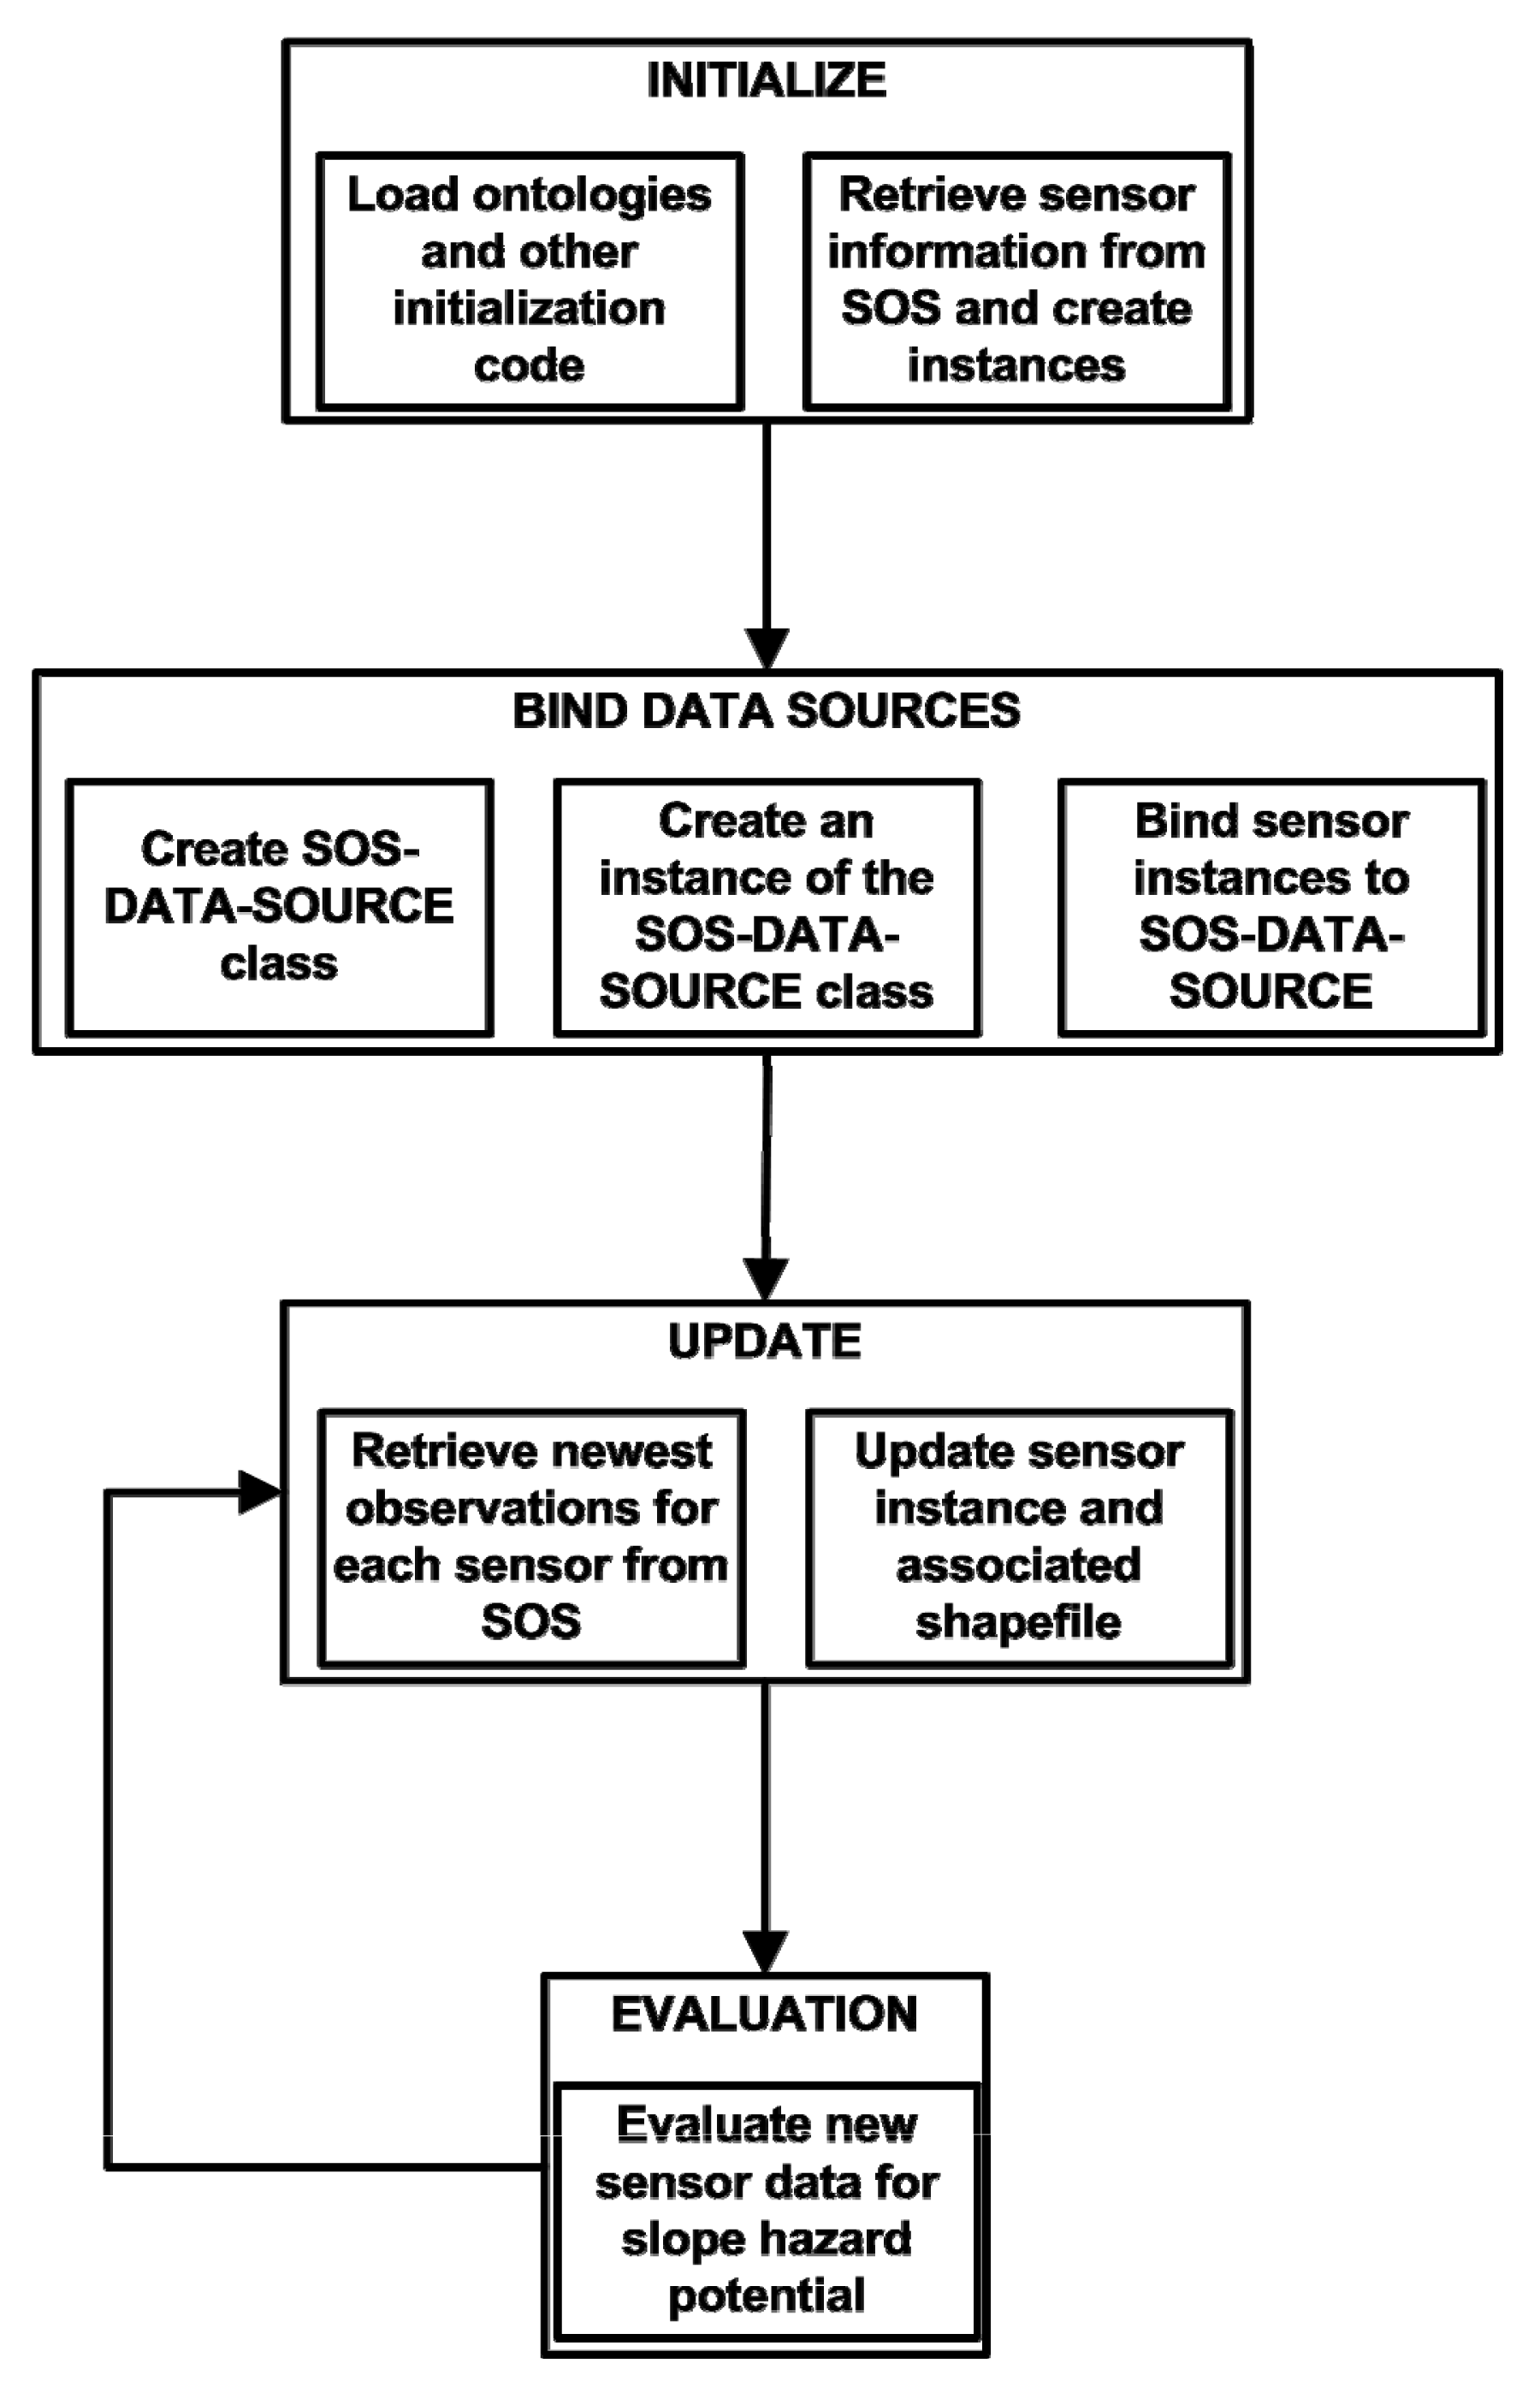
Figure 2 shows the detailed methodology of the REASON workflow loop in the case of interaction with an SOS server. The abstracted data source mechanism is used to connect to an SOS and retrieve values in order to drive analysis. When the system in initialized the ontologies are loaded into the CLIPS knowledge base. These ontologies contain the majority of the code that are used to operate the system. Initialization is completed when the sensor descriptions are retrieved from the SOS and converted into CLIPS code and stored in the knowledge base. The “Bind Data Sources” step consists of binding an instance of the data source class to the CLIPS code representing the sensors. This tells REASON where it can retrieve information about the given sensor, including new measurements. The “Update” portion of the workflow retrieves the newest observations for the sensors through SOS queries. The resulting XML documents are converted on-the-fly into CLIPS code which is used to update the GIS layers and CLIPS code associated with the sensors. Evaluation is then carried out on the new values as defined in the application ontology (see Section 4 for a sample decision tree that is used to analyze sensor data). When evaluation is completed, new values are acquired from the data source and the process repeats itself until the system is told to release the resources associated with the data source and terminate.
Since the REASON DATA-SOURCE mechanism is abstracted, observations can be drawn from Excel or database tables to generate facts which correspond to an ontology built using templates (such as those found in the CLIPS language), or alternatively encodings from geospatial standards (discussed in Section 3.2 below) can be used to generate instances of an object-oriented ontology (an ontology with hierarchical characteristics similar to an object-oriented programming language), with minimal changes to the actual decision-making logic. The knowledge of the domain is separated from the other knowledge in the system, so creating a monitoring system that works in a different domain (flood monitoring, for example) only involves changing the domain ontology to one which describes our new domain of interest, and creating a new rule set within the application ontology which governs what we are interested in monitoring. All of the other knowledge related to sensors and spatial-temporal relationships may be reused.
3. ENGINE: Creating Ontology Compliant Geodata
3.1 Sensor Webs
With the continual advancement of sensor technology and wireless technology [15, 16], sensor webs have become a very useful mechanism for automated data collection. Sensor webs are tools used for automated collection and storage of sensor observations. More specifically, they are structures which move measurement data through a structured network from the sensors which collect the data to the applications which use them. They facilitate the collection, distribution, and dissemination of large amounts of spatially significant data, turning the Earth's surface, subsurface, oceans, and atmosphere into sensible entities [17]. As would be expected, this process can result in the collection of large amounts of data which can be used to feed analysis within a specified problem domain. Since the aim for any information-driven decision support system is to provide an expert user with relevant information that helps them to make informed decisions, sensor webs prove extremely valuable in providing data that may be transformed into current, timely information that is relevant to the problem.
3.2 Data Representation
Sensor webs can rapidly collect large amounts of data, which has created a need for methods to discover, provide, exchange, and archive this data. These methods are used to encode sensor observations as well as the context under which they were made. The Open Geospatial Consortium's (OGC) Sensor Web Enablement (SWE) [18] working group has responded to this need by developing standardized ways of encoding this information. Two of the key encodings that the OGC provides are the Sensor Model Language (SensorML) and Observations and Measurements (O&M). SensorML is used to model and encode the geometric, dynamic, and observational characteristics of sensors and sensor systems and their parameters [19]. O&M is used to model and encode observations and measurements made of phenomena, including those made by sensors [20].
These encodings provide a common mechanism to represent sensor descriptions and observations as well as to discover sensors for use within various applications. This is worthwhile when trying to answer simple questions, but to answer more complex questions we need more information about measurements, such as how they were made, the way they are structured, the conditions under which they were made, and the type of sensor which made them. We could achieve this connection using symbolic links provided in the various documents, but the use of ontologies integrates all of our concepts into a single realm of knowledge. Using an ontology that defines all of the important concepts and relationships in our monitoring domain means software applications can be built which understand their domain of interest. This subsequently gives the application an increased ability to derive knowledge from sensor data as the ontology can provide context for the measurements rather than just raw numerical values.
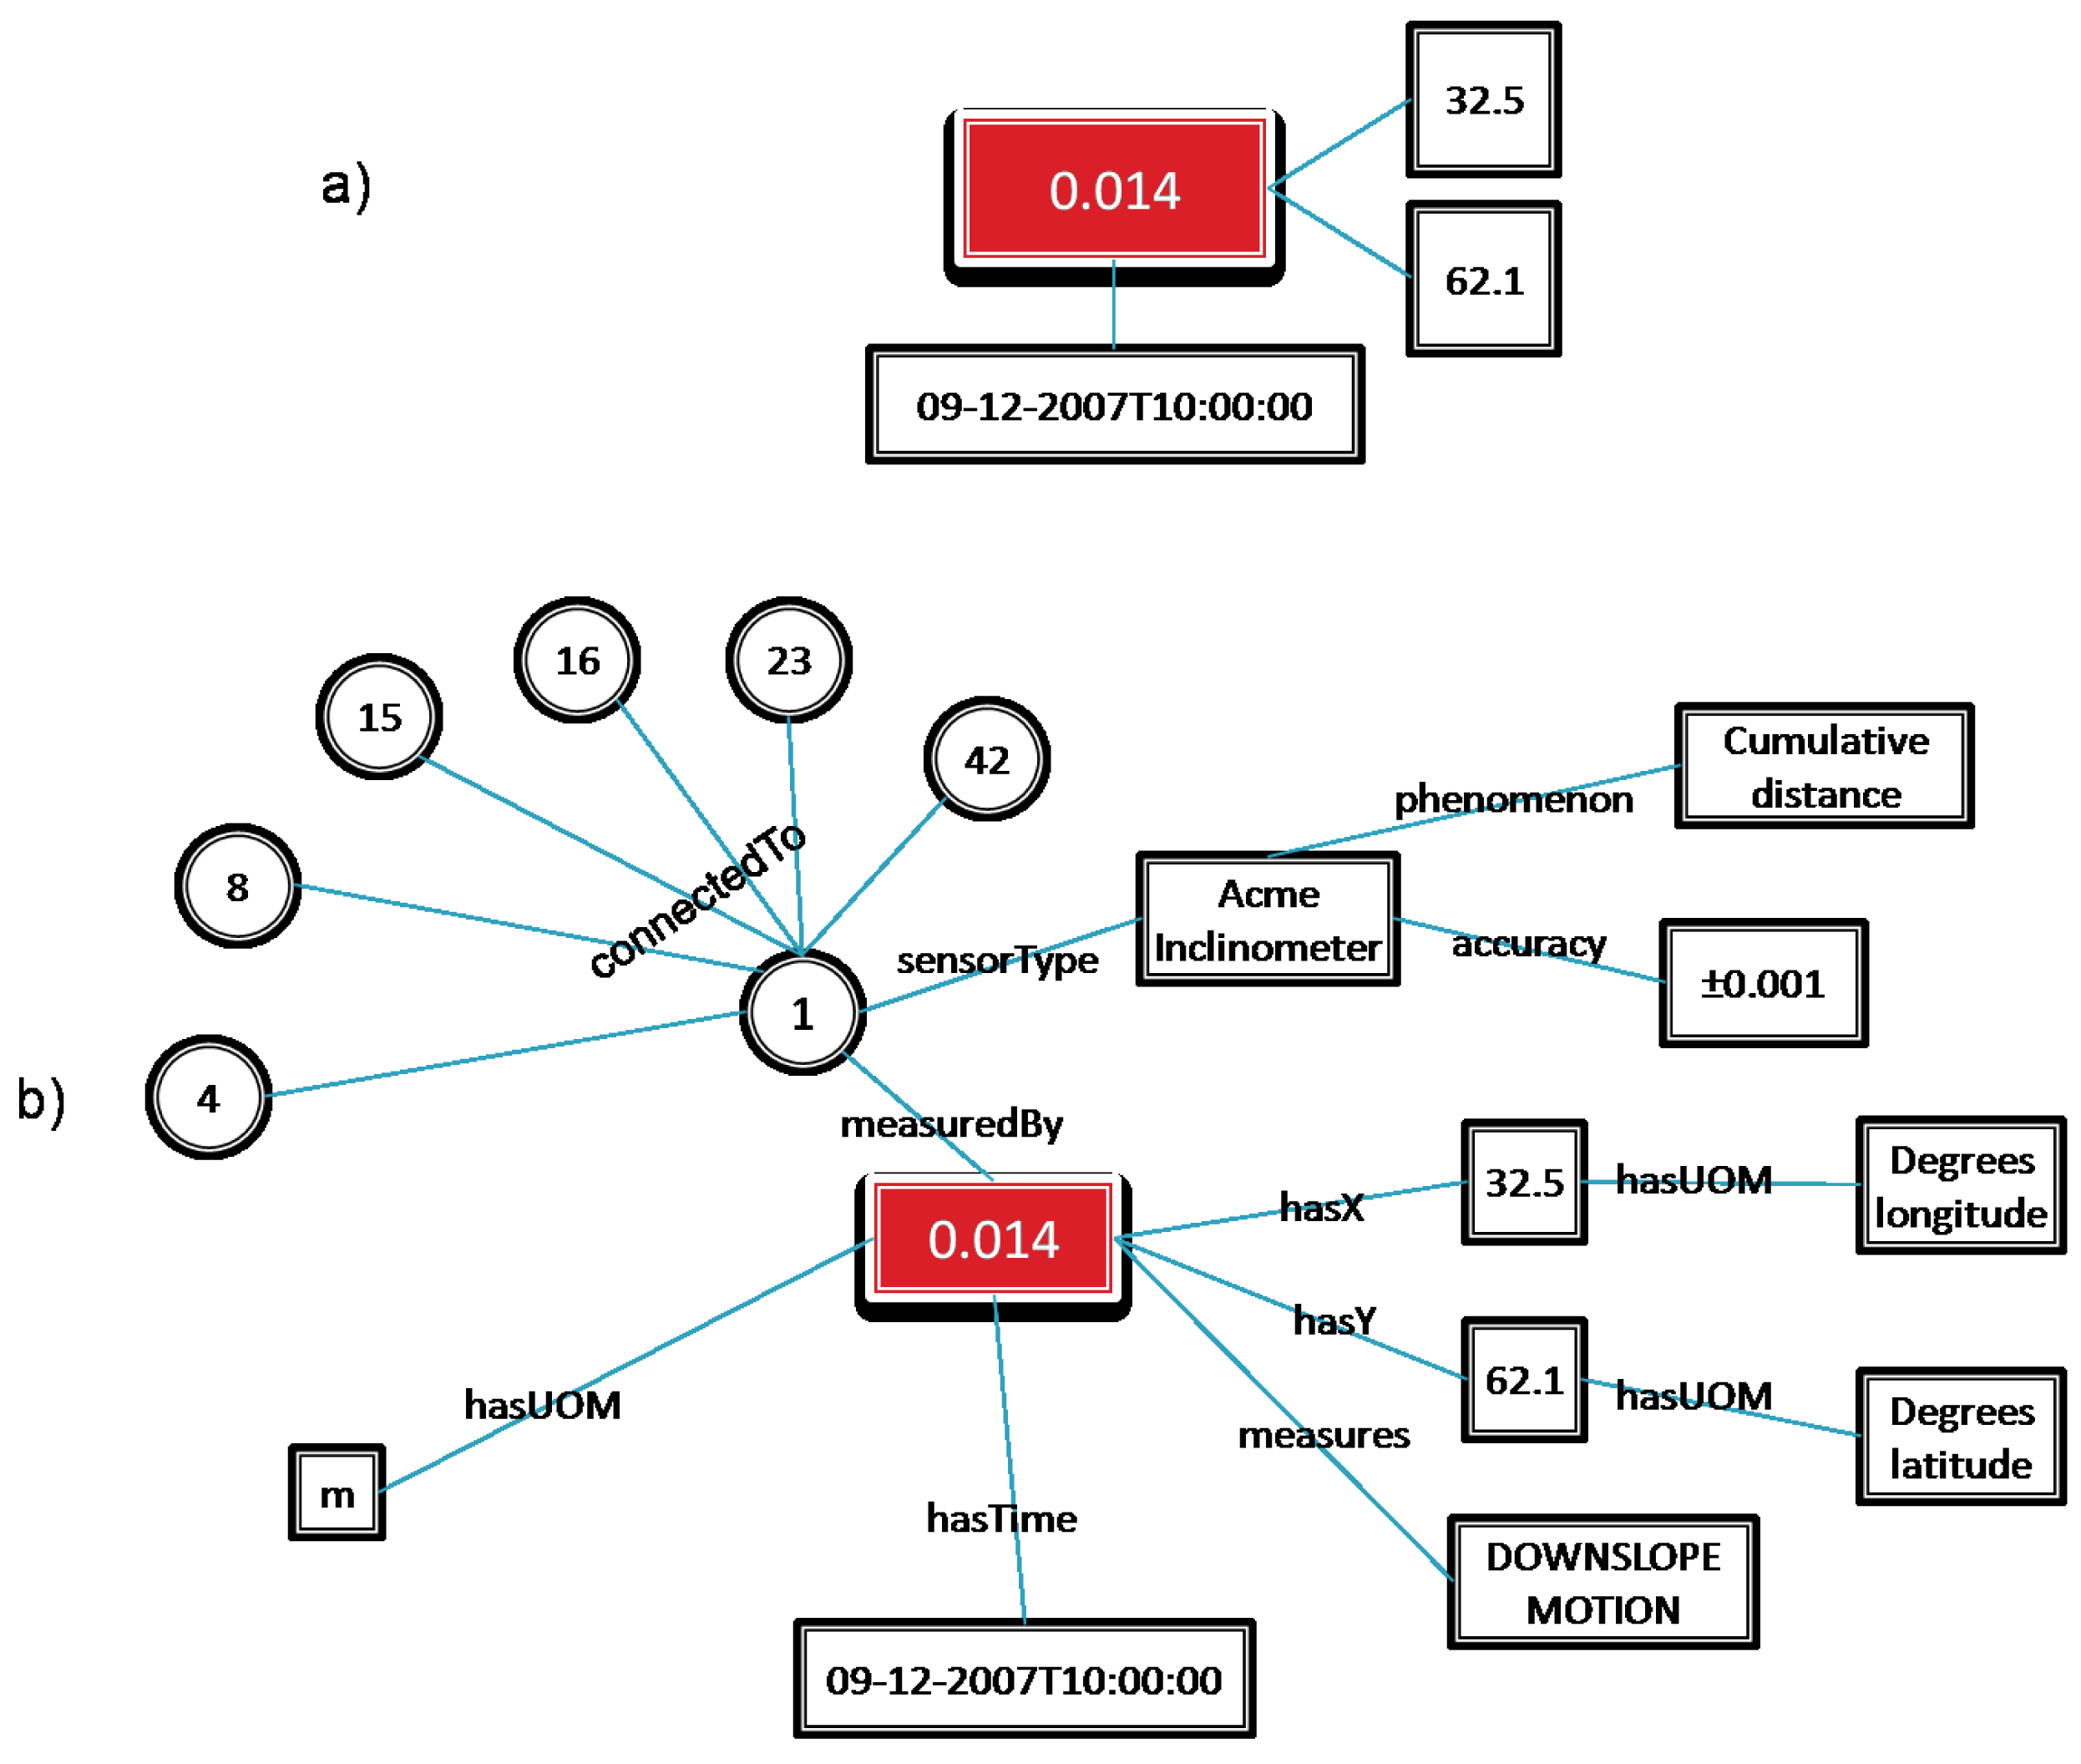
Figure 3 shows an example of how data that conforms to an ontology can be used to model the concepts and relationships of the domain in a way that enables this style of analysis. Figure 3a shows the data-centric approach to the representation of a sensor observation. The measurement (0.014) has implicit relationships to its attributes, and by separately examining the structure and contents of the attributes as described in an external resource one can interpret what they represent. Figure 3b shows the measurement data structured so they conform to an ontology. In this case the relationships between the measurement and its attributes are explicitly defined, allowing a computer system to navigate the information and connect that knowledge to other knowledge it may have, such as the attributes of other sensors (represented as circles in Figure 3b) that are connected to the sensor that made the measurement.
3.3 Using the Data
Sensor networks collect large amounts of data, and when real-time data are combined with archived data, the amount of data can be overwhelming to explore manually. When a decision maker wishes to explore a problem or test a hypothesis, the need to deal with large amounts of data, some of which may be irrelevant, becomes a serious issue. Adding meaning to the data becomes a key factor in allowing the expert user to filter observations down to only those that are relevant to their problem. Of course, decisions regarding relevance may depend on other related observations. If the decision support system can make use of the meaning of the data and an understanding of the problem domain, it can help by automatically filtering out the least relevant observations. For these reasons we want to create data that enables decision support systems (such as those described in Section 2), using emerging sensor data representation standards.
Moving from raw sensor data to an ontological representation, which can enable an inferencing system like REASON to assess meaning and therefore relevance, can be a complex process. It can involve several transformation steps, and every transformation has the potential for a loss of semantic information [21]. The domain expert typically will not be as well versed in lossless data manipulation and transformation as a knowledge engineer would be, and besides, the goal is to have them spend their time analyzing problems, not manipulating data. For these reasons, it is important to automate the process of converting between representations. Technologies such as eXtensible Stylesheet Language Transformations (XSLT) allow manipulation of XML documents without a need for explicit parsing. We have created a set of XSLT templates which convert SensorML and O&M documents, along with other associated encodings, into a Web Ontology Language (OWL; format. The resulting documents become instances of associated ontologies which are based on the SensorML and O&M structures.
Probst et al. [22] laid out a framework for mapping the Observations and Measurements encoding to an ontological structure. In their discussion paper, the concepts in O&M were logically organized and related to each other to form an ontology in OWL. The ontology specified the concepts and relationships needed to represent observations; however, it did not include the structures required to create specific instances which could hold real data. Since the representation of actual measurement data as instances of the ontology was vital to our problem, we made these additions (in the form of OWL data type properties) to create a more complete modelling of the sensor observation domain.
We then used a similar procedure to create a sensor ontology based on SensorML. This ontology defines the concepts and relationships expressed in the SensorML specification, organizing them into an ontological framework. This provides the contextual information required to give meaning to the observations made by sensors, similar to the notion presented in Figure 3. These two ontologies were then merged and aligned into a single ontology. Individual sensor observations as described by O&M documents, and descriptions of specific sensors as described by SensorML documents, are then transformed into instances of this ontology. The ontology and its associated instances can then be supplied to the reasoning engine, giving the SDSS and the expert user the information they need to make informed decisions in a structure that is well suited to reasoning.
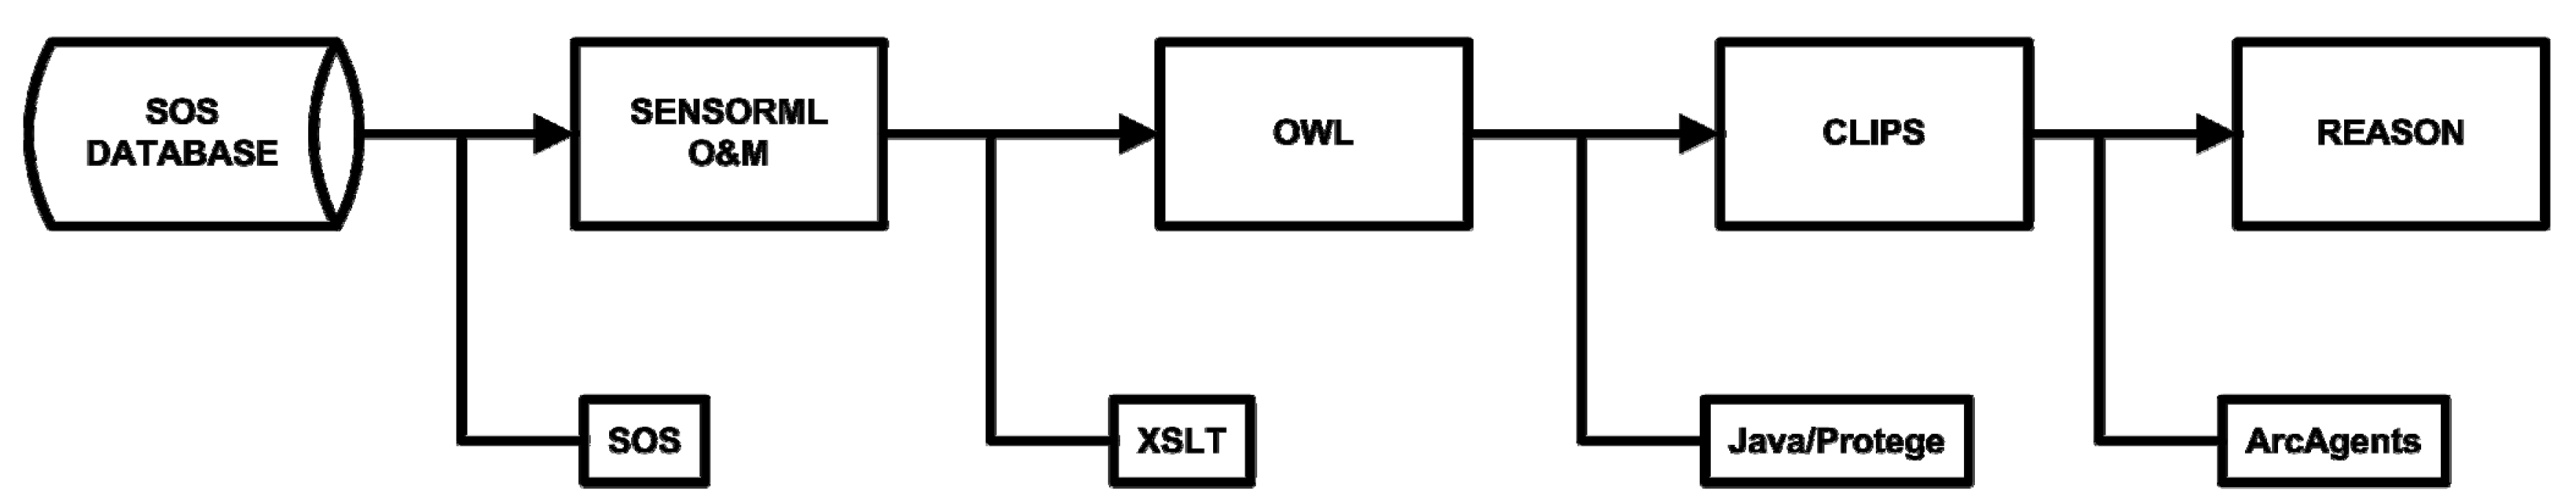
This transformation is achieved using a series of XSLT templates which are used to map the various structures found in the SensorML and O&M documents to concepts in the OWL ontology. When a structure is encountered in the input document, the corresponding OWL concept is created in the output document, along with any relationships and attributes that are required. This process continues for all structures in the input document. Our REASON system is built to work on knowledge stored in the CLIPS language so that it can integrate with other tools (such as ArcGIS) and analysis code written in other languages such as C++ or Java. Therefore, we must undertake an additional step of converting the OWL representation of our ontology into a CLIPS representation. Fortunately, the Protege ontology editor [23] provides just such a facility. The editor can be used to load an OWL ontology and export that ontology as CLIPS code, and since the source code is available, this functionality was automated using some Java code. An overarching controller program called ENGINE (ENcoding Geospatial INformation and Expertise) controls the conversion of SensorML and O&M documents through to CLIPS code with a single command (Figure 4). This automation makes it simple for an SDSS (or an adventurous expert user) to request that their data be transformed into CLIPS without having to worry about the inner workings of the transformation engines.
The ontological representations define not only the concepts represented in the O&M observation documents, but the explicit relationships between those concepts as well. When these documents are validated against the ontology they are checked for consistency, ensuring that any concepts that have been defined are done so in accordance with the ontology, and that any relationships are valid for all objects involved. Further, some of the standards and encodings we are working from have some overlapping concepts, so the XSLT templates also homogenize these different encodings. For example, the coordinates of the station which made the measurement in the O&M document are represented in the Geography Markup Language (GML) as a space-delimited list of values. The Sensor Web Enablement coordinate data type has a similar structure, and would also be valid in the measurement description. Whichever representation is used for the location of the measurement, the conversion tool will transform that representation into a more familiar (x,y) representation which matches most parameter list formats.
One of the advantages of such a structured representation is that it makes filtering large amounts of data down to what is relevant to the problem domain a simpler task. For example, rules can be created in the reasoning engine which can filter incoming data based on a number of parameters, such as the type of observation, the phenomena being measured, or the magnitude or significance of the observation. These same rules could also be used to filter archived data. Since information related to both the measurement processes and the phenomena being measured is tied to the observations themselves through the ontology, we can use this information to discover more relevant data from existing sensor catalogs. If our domain ontology is adequately detailed we will have some indication of what types of measurements would be useful to our monitoring problem, and we can use this information along with our current knowledge base to search for other supplementary information.
4. Using Sensor Data for Hazard Monitoring
As mentioned earlier, REASON is a framework for building spatial decision support systems in any monitoring domain which can be adequately described. To illustrate the ability to create an effective hazard monitoring system based on REASON, and applying the data transformations described in Section 3, we present an example application created to monitor a potentially unstable slope. The monitoring of slopes and other unstable areas for geotechnical hazards presents some unique challenges which demonstrate the value of a hazard monitoring system built using ontologies. Quite often the slopes we wish to monitor are in remote areas, and manual collection of this data can be challenging, costly, and time consuming. It can also be a hazardous process if we suspect that the slope is unstable. By automating data collection through the use of sensor networks, we can install the instruments which monitor the slope-related phenomena of most interest, and have the collected data routed to a central database where decision makers (human or machine) can access it. This eliminates costly excursions to perform manual collection from in-situ or probe-type sensors.
An illustrative SDSS was developed which monitors daily motion of sensors within a hypothetical slope model [5]. This model contains one hundred cycles of sample inclinometer measurements for several measurement positions within a slope. Figure 5 shows the slope model as it is viewed in cross-section within ArcMap. The model contains four different material layers in the active area of the slope, and three shear zones. The model contains twelve inclinometers installed in vertical boreholes with six measurement locations on each instrument. For the purposes of visualization and analysis, each measurement location is modeled separately, resulting in seventy-two measurement locations. Using the spatial analysis capabilities of ArcGIS, we can use the positions of each measurement location to determine with which borehole and which inclinometer each location is associated.
The model also contains water level measurements from piezometers in standpipes for the same timeframe. These measurements are taken at six locations spaced relatively evenly along the slope. These locations allow an estimated water table to be calculated for the slope at any time based on simple linear interpolation between the standpipes.
Using the processing routine discussed in Section 2.2 (Figure 2), new values for each sensor are loaded from the Sensor Observation Service at each time step, and evaluation of these new values is performed using a decision tree which makes use of both the water table and slope motion measurements and the encoded expert knowledge to classify various sections (termed ‘rock masses’ here) of the slope according to subjective alert levels. The analysis proceeds according to the following simple steps (represented as a decision tree in Figure 6):
The position of each inclinometer data collection location is used to determine parameters that describe the motion of the slope. First, the boreholes are identified based on the horizontal coordinates of the sensor. The sensors with similar horizontal coordinates are grouped together into boreholes. Then each sensor is examined for activity according to a set of rules that define what is considered relevant motion (in this case, increasing in displacement with an increment greater than one percent of the current cumulative displacement). This ensures that even though a sensor moves it is not necessarily considered active, since all inclinometers are expected to exhibit some downslope motion. Active sensors are then categorized according to the rock mass to which they belong. Finally, active zones (rock masses) of the slope are determined based on whether or not the zone contains a certain percentage of active sensors.
If active rock masses are found then REASON uses the SOS to gather piezometer measurements in order to supplement its analysis. It uses a combination of the inclinometer measurements as well as the water table measurements in order to further classify the activity level in each rock mass. The decision tree classifies all rock masses at every time step as having an alert level from one to six, with six being the most severe. The conditions for these alert levels are as follows:
- Alert Level 6: The rock mass is active, the water table currently intersects the rock mass, and the water table is rising.
- Alert Level 5: The rock mass is active, the water table currently intersects the rock mass, and the water table is falling.
- Alert Level 4: The rock mass is active, the water table currently intersects the rock mass below the active rock mass, and the water table is rising.
- Alert Level 3: The rock mass is active, the water table currently intersects the rock mass below the active rock mass, and the water table is falling.
- Alert Level 2: The rock mass is active, and the water table does not intersect the active rock mass or the rock mass below.
- Alert Level 1: The rock mass is not active.
The decision tree specifies the steps that are taken to identify alert levels based on the above criteria. These rules capture basic slope mechanics [24], and were chosen based on the ability to simply demonstrate the capabilities of the system. The system also checks the quality of incoming data by ensuring that the values used for analysis are reasonable. The standpipe measurements were simulated to include measurement errors such as missing values, and these are detected during the execution of the decision tree. When a missing value is detected, interpolation of the water table position is performed using the next closest standpipe reading, provided that it is reasonable.
Since the concepts of the various zones and the sensors are understood by the system, it knows that seeing a certain level of motion within a zone may be something that the hazard manager wishes to investigate, and that coordinated motion within a single material block is of particular interest, and thus it notifies the user through both log messages and a visual cue by changing the symbology of the appropriate GIS layer to correspond to the alert levels. The goal of this (or any) SDSS is not to replace the expert user's decision-making ability [25], but to supplement their decision-making capability by focusing their attention on the most relevant, problem-oriented information where possible and burdening them with as little irrelevant information as possible.
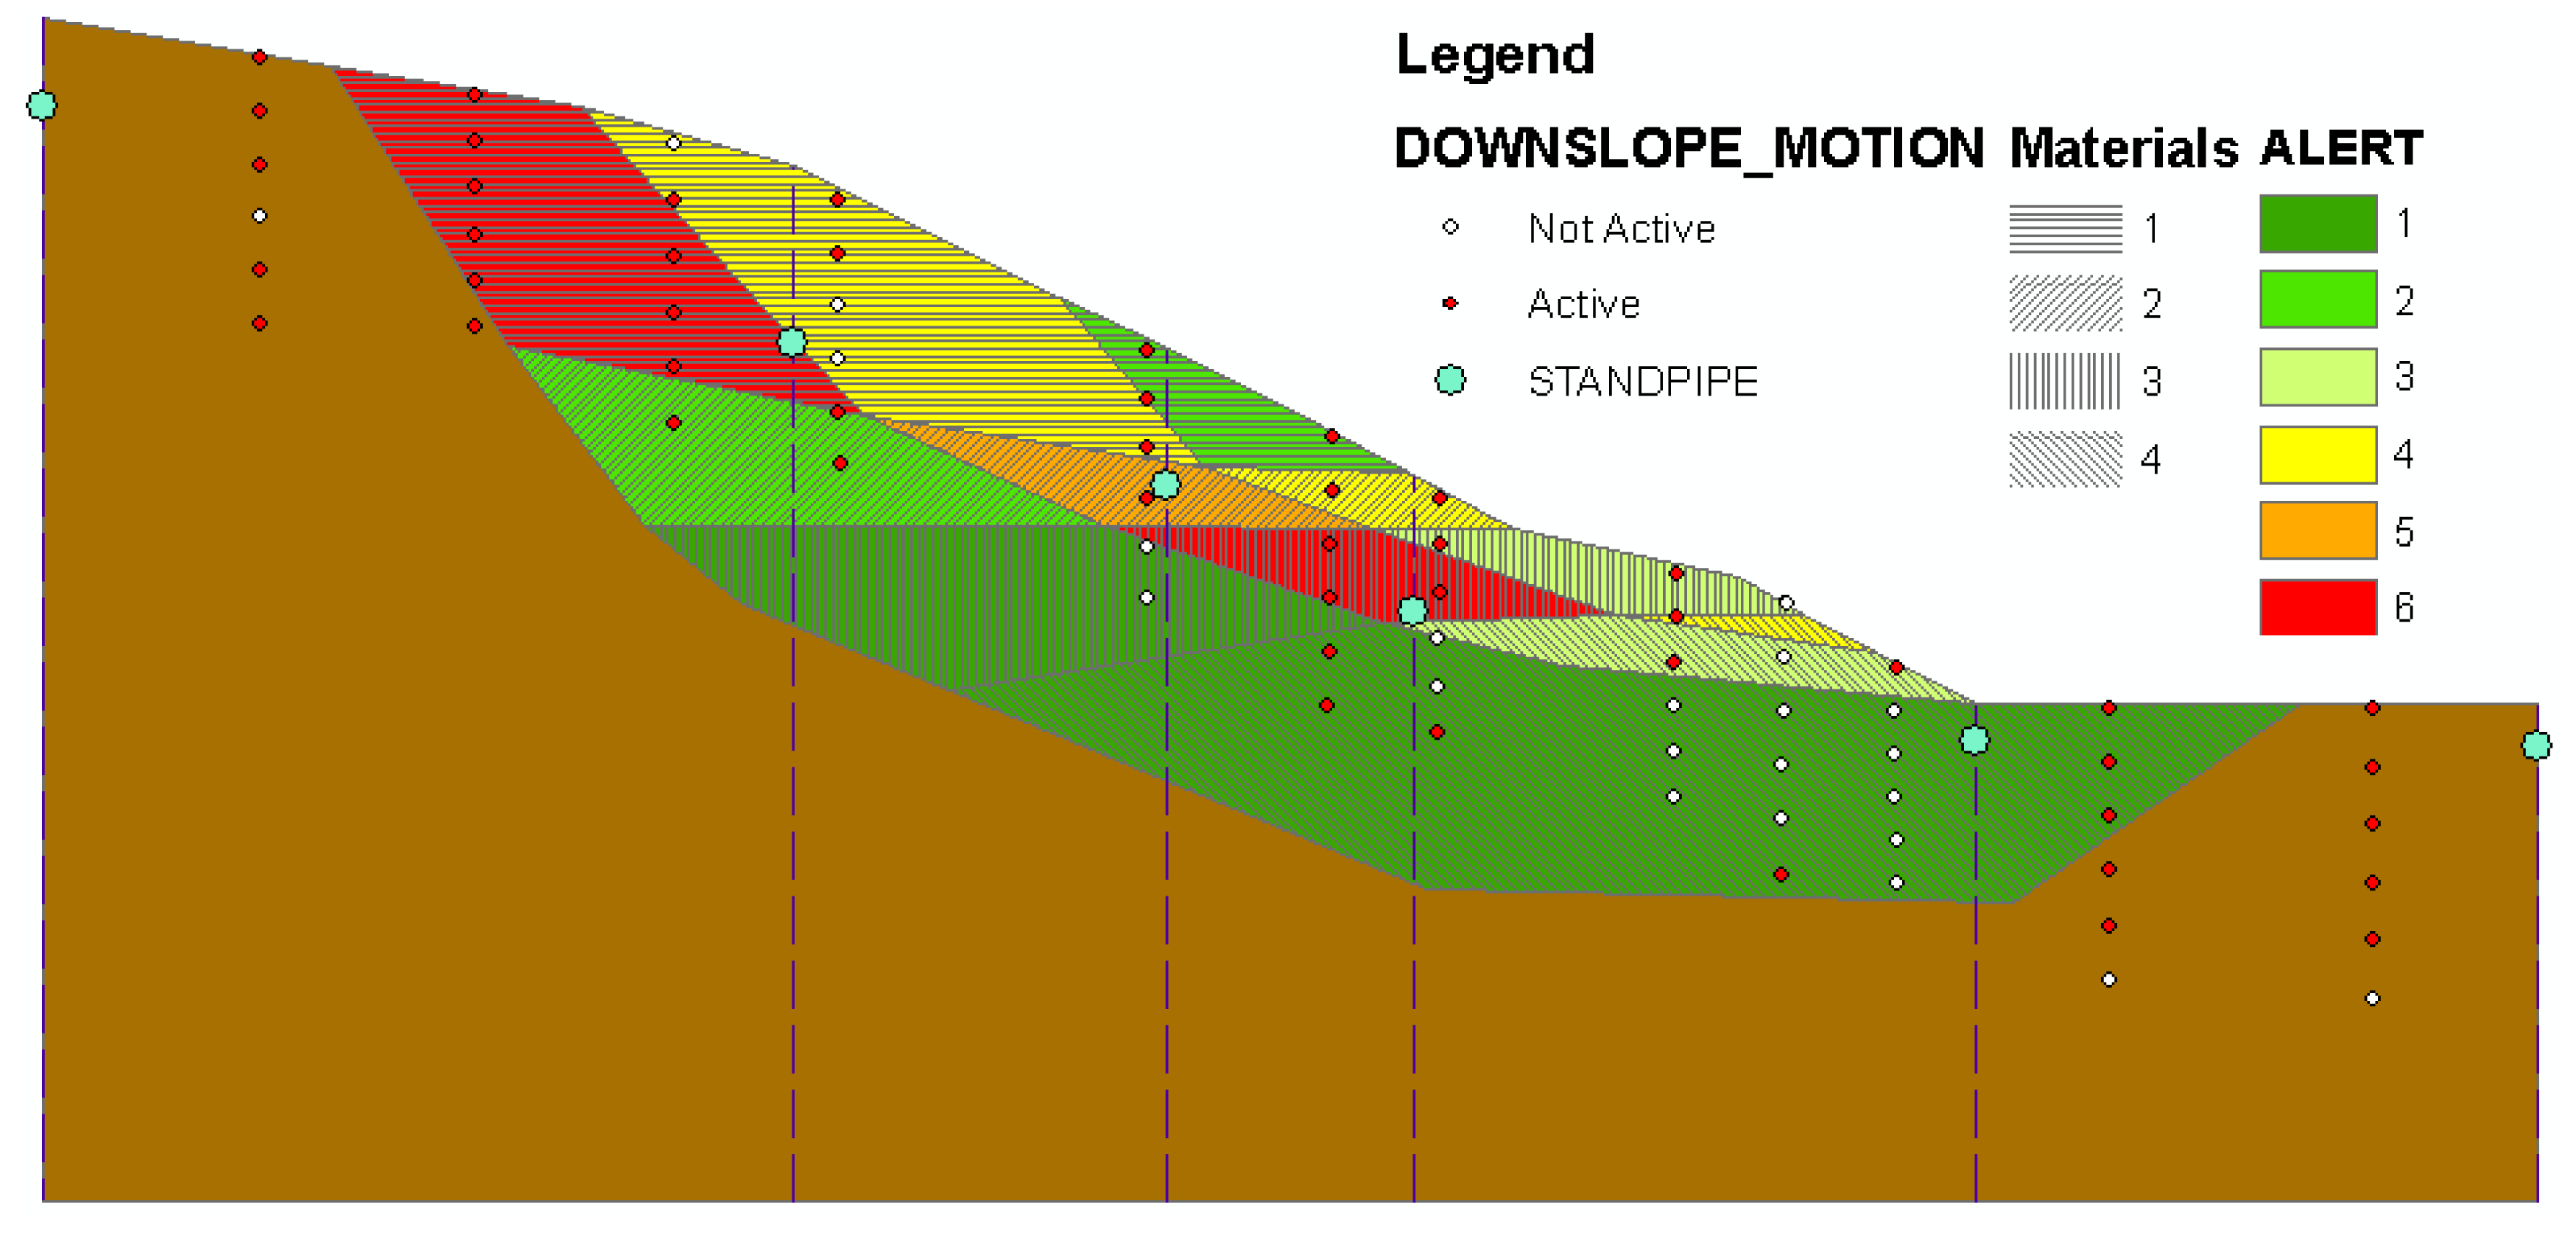
Figure 7 shows the REASON slope monitoring system in action. The small red and white dots represent inclinometer measurement locations: the red dots indicate “Active” sensors and the white dots indicate “Inactive” sensors for a given time step. The blue dots represent water table readings at six standpipe locations. The coloured portions of the slope indicate alert levels for the various regions of the slope as classified by the decision tree in Figure 6. The integration of hydrologic and geotechnical measurements with domain knowledge about how slopes behave under evolving slope conditions is made possible through the use of ontologies. Adding the spatial analysis capabilities of the GIS allows us to relate the position of the water table with the active features within the slope, and since we have previously determined that this relationship is significant then we can build our decision tree in such a way that it can use both data sets even though they were never built specifically to be integrated, and may in fact be operated as separate sensor networks by independent organizations.
There are several ways in which the capabilities of this system could be enhanced. By extending the ontologies which make up the system's knowledge, the overall knowledge level of the system can be improved. Using the methods described in sections 3.2 and 3.3, we are moving towards the use of a generic sensor ontology which can be used to define any sensor in any domain through the use of encodings in common geospatial standards, which can then be converted to the format necessary for REASON. There is also work being done to enhance the domain ontology by using case-based knowledge collected from real life slope failures as well as more complete geotechnical models of slopes and slope failures. By describing the slope's expected behaviour based on geotechnical engineering concepts, we can compare ‘typical’ slope motion with the motion that is actually occurring on the slope. Comparing what the monitoring environment is observing with previously defined case examples would allow the engine to draw conclusions with a higher degree of certainty. Once expressed in the proper form, these models can be used to enhance the domain knowledge and thus the analysis capabilities of the monitoring application since there is more domain experience to draw from. Over time a system such as this can learn from itself and further build on its domain knowledge by drawing on its own experiences. If a conclusion is drawn based on a certain set of criteria, an expert user could verify whether or not the conclusion is correct. These conclusions would then be added to the collection of domain knowledge and would be available in the future when a similar set of conditions arises.
The REASON system can be used as a tool for planning the structure of a sensor network installation before it is ever installed. If we have an accurate model of our slope which can be associated with the GIS, then we can create mock sensors based on the characteristics of the real-life sensors we expect to install and add them to our model. We can also create a database (or some other data source) with mock sensor measurements that will simulate any kind of slope motion we may encounter. By experimenting with the positions, characteristics, and types of sensors we install we can plan the best way to instrument our slope of interest to both minimize cost and maximize the amount of information we expect to draw from it. Since our model of the slope draws on the same domain knowledge that a real-life slope would, we can expect similar results from data derived from both mock sensors and real sensors, provided that our data are accurate and our slope and sensor models closely resemble the real world. This would provide those involved in disaster management and response with the ability to run simulations of various scenarios which may occur, helping them improve response efforts and emergency plans.
5. Conclusions
The combination of sensor technology, wireless technology, GIS software, and rule-based logic techniques for organizing and analyzing hazard-related data provides a powerful approach for monitoring hazards in a near-real-time environment. Having such a broad range of sensors available in the marketplace which can handle automated data collection makes it possible to measure phenomena related to most any domain of interest. This allows an expert user to apply automated data collection methods to their problem of interest. Increased focus on sensor webs and their supporting technology has lead to the creation of standards and encodings for the representation and interchange of their data. By leveraging expert system and knowledge representation techniques we can increase the information content derived from these representations and use that information to drive our analysis methods. We have shown how a framework for building an SDSS can be used to create a monitoring environment capable of performing inference-based analysis on a hypothetical slope model. By increasing the information content associated with our data by transforming the data stream into ontology-compatible facts, we make it possible for software systems to draw more extensive and reliable conclusions. The capabilities of this system can be made more advanced by expanding the rule set associated with this domain and defining the domain of interest in richer detail. The REASON system is not domain-specific, meaning that it could be used for hazard monitoring (or any other kind of monitoring) in any domain of interest which can be adequately described to the reasoning environment. As an example, we built a simulated Tour de France style race monitoring application, using GPS watch beacons, and concepts of leaders, the peloton, and stragglers, as well as rider conditions of off-course, lost, crashed, and cheating using the same engine and base ontologies. By automating the transition from raw data to usable information through the ENGINE mechanism, the information content that is available to the reasoning engine is increased without further input from the domain expert. The descriptions of sensors and measurements add to the domain knowledge which is used to drive analysis methods. This is achieved through the use of ontologies which describe the domain of interest in a way that is understood by the reasoning engine. The ENGINE tool is used to confirm that all information gathered from the sensor network is converted into a form that meshes with the ontology, ensuring that information added to the system can be used effectively. We anticipate that the capabilities of the slope monitoring system will be increased through a more detailed and thorough domain ontology that consists of knowledge aggregated from studying the results of previous slope failures and other slope monitoring applications. Ultimately, the strength of a system built using REASON is limited by the amount of knowledge that it has to reason with. With an ever-increasing supply of this information from sensor webs, advanced computer modelling, and rule-based logic and inference techniques, the decision maker's ability to solve problems in a spatial domain can be greatly enhanced.
Acknowledgments
This project was conducted with the generous financial support of GEOIDE, via the Geotechnical In-Situ Technology (GIST) Network, Project TDMDSD08.
References and Notes
- Russomanno, D.J.; Kothari, C.; Thomas, O. Building a Sensor Ontology. In A Practical Approach Leveraging ISO and OGC Models, Proceedings of the International Conference on Artificial Intelligence, Las Vegas; 2005; pp. 637–643. [Google Scholar]
- Santanche, A.; Nath, S.; Liu, J.; Priyantha, B.; Zhao, F. SenseWeb: Browsing the Physical World in Real Time; Redmond, WA; Microsoft Research Report.
- Avancha, S.; Patel, C.; Joshi, A. Ontology-Driven Adaptive Sensor Networks. MobiQuitous 2004, Proceedings, IEEE Computer Society, Cambridge, MA, USA; 2004; pp. 194–202. [Google Scholar]
- Goodwin, C.; Russomanno, D.J.; Qualls, J. Survey of Semantic Extensions to UDDI. In Implications for Sensor Services, Proceedings of the International Conference on Artificial Intelligence, Las Vegas; 2007; pp. 16–22. [Google Scholar]
- Hutchinson, D.J.; Diederichs, M.S.; Carranza-Torres, C.; Harrap, R.; Rozic, S.; Graniero, P. Four-Dimensional Considerations in Forensic and Predictive Simulation of Hazardous Slope Movement. Proceedings of the 1st Canada-U.S. Rock Mechanics Symposium 2007; 2007; p. 6. [Google Scholar]
- Rozic, S.M. Representing Spatial Domain Knowledge within a Spatial Decision Support Framework. M.Sc. Thesis, University of Windsor, 2006; p. 156. [Google Scholar]
- Na, A.; Priest, M. OpenGIS Sensor Observation Service Implementation Specification. Open Geospatial Consortium Implementation Specification. 2006, 91. [Google Scholar]
- Malczewski, J. GIS and Multi-Criteria Decision Analysis; John Wiley and Sons: New York, NY, USA, 1999. [Google Scholar]
- Shim, K.C.; Fontane, D.G.; Labadie, J.W. Spatial Decision Support System for Integrated River Basin Flood Control. Journal of Water Resources Planning and Management 2002, 128, 190–201. [Google Scholar]
- Yu, F.C.; Chen, C.Y.; Lin, S.C.; Lin, Y.C.; Wu, S.Y.; Cheung, K.W. A Web-Based Decision Support System for Slopeland Hazard Warning. Environmental Monitoring Assessment 2007, 127, 419–428. [Google Scholar]
- Cheng, M.Y.; Chien-Ho, K.; Chang, C.H. Computer-Aided DSS for Safety Monitoring of Geotechnical Construction. Automation in Construction 2002, 11, 375–390. [Google Scholar]
- Harris, C.; Haeberli, W.; Vonder Mühll, D.; King, L. Permafrost Monitoring in the High Mountains of Europe: The PACE Project in its Global Context. Permafrost and Periglacial Processes 2001, 12, 3–11. [Google Scholar]
- Gruber, T.R. A Translation Approach to Portable Ontology Specifications. Knowledge Acquisition 1993, 5, 199–220. [Google Scholar]
- O'Brien, J.; Gahegan, M. A Knowledge Framework for Representing, Manipulating, and Reasoning with Geographic Semantics. In Developments in Spatial Data Handling, Proceedings of the 11th International Symposium on Spatial Data Handling; 2004. [Google Scholar]
- Centintemel, U.; Flinders, A.; Sun, Y. Power-Efficient Data Dissemination in Wireless Sensor Networks. Proceedings of the 3rd ACM International Workshop on Data Engineering for Wireless and Mobile Access, New York; 2003; pp. 1–8. [Google Scholar]
- Kim, K.J.; Yoo, S.J. Power-Efficient Reliable Routing Protocol for Mobile Ad-Hoc Networks. IEICE Transactions on Communications 2005, E88B(12), 4588–4597. [Google Scholar]
- Gross, N. 21 Ideas for the 21st Century: The Earth Will Don an Electronic Skin. In Business Week Online; McGraw-Hill, August 30 1999; pp. 68–70. [Google Scholar]
- Botts, M.; Percivall, G.; Reed, C.; Davidson, J. OGC Sensor Web Enablement: Overview and High Level Architecture. Open Geospatial Consortium Whitepaper. Open Geospatial Consortium 2006. [Google Scholar]
- Botts, M. OpenGIS Sensor Model Language (SensorML). Open Geospatial Consortium Best Practices Document. Open Geospatial Consortium 2005. [Google Scholar]
- Cox, S. Observations and Measurements. Open Geospatial Consortium Best Practices Document. Open Geospatial Consortium 2006. [Google Scholar]
- Gannod, G.C.; Cheng, B.H.C. A Framework for Classifying and Comparing Software Reverse Engineering and Design Recovery Techniques. Proceedings of the Sixth Working Conference on Reverse Engineering, Washington, DC; 1999; pp. 77–88. [Google Scholar]
- Probst, F.; Gordon, A.; Dornelas, I. Ontology-Based Representation of the OGC Observations and Measurements Model. OGC Discussion Paper. Open Geospatial Consortium 2006. [Google Scholar]
- The Protégé Ontology Editor and Knowledge Acquisition System. Stanford Centre for Biomedical Informatics Research. 2008. Available at http://protege.stanford.edu accessed January 4, 2008.
- Lee, E.M.; Jones, D.K. Landslide Risk Assessment; British Nuclear Energy Society, 2004. [Google Scholar]
- Case, P. Reconsidering the Search for Intelligent Machines. AI Applications 1992, 6, 545–567. [Google Scholar]
Figure 1.
Ontology Hierarchy.
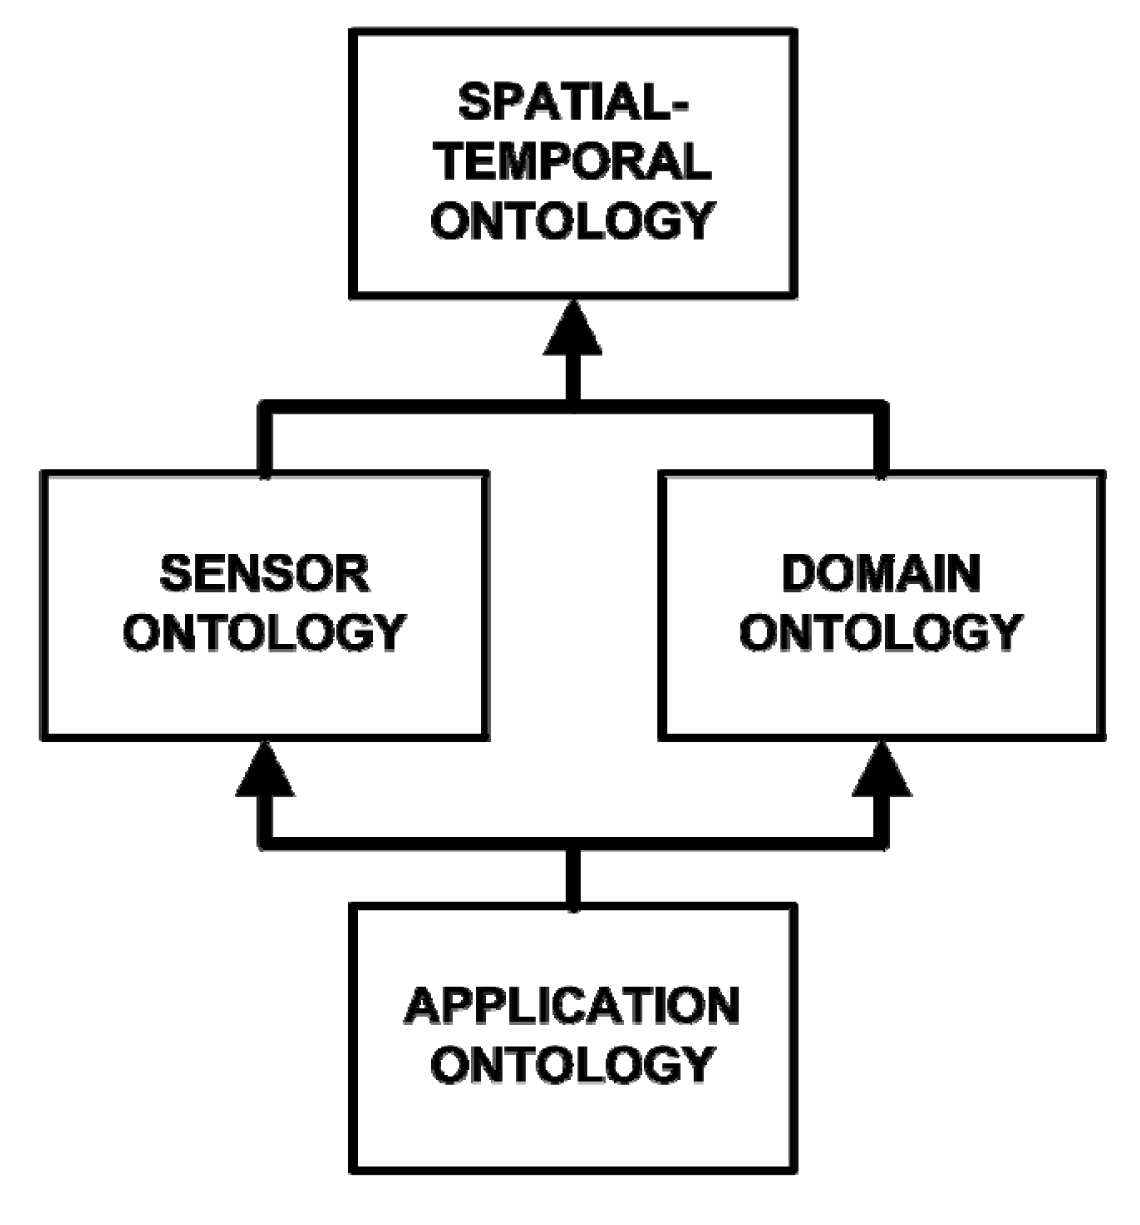
Figure 2.
REASON Evaluation Loop.

Figure 3.
Two perspectives on Sensor Data Representation: a) Data-Centric Perspective; b) Information-Centric Perspective.
Figure 3.
Two perspectives on Sensor Data Representation: a) Data-Centric Perspective; b) Information-Centric Perspective.

Figure 4.
ENGINE Transformation Chain.

Figure 5.
Simulated Slope Model with Embedded Sensors.
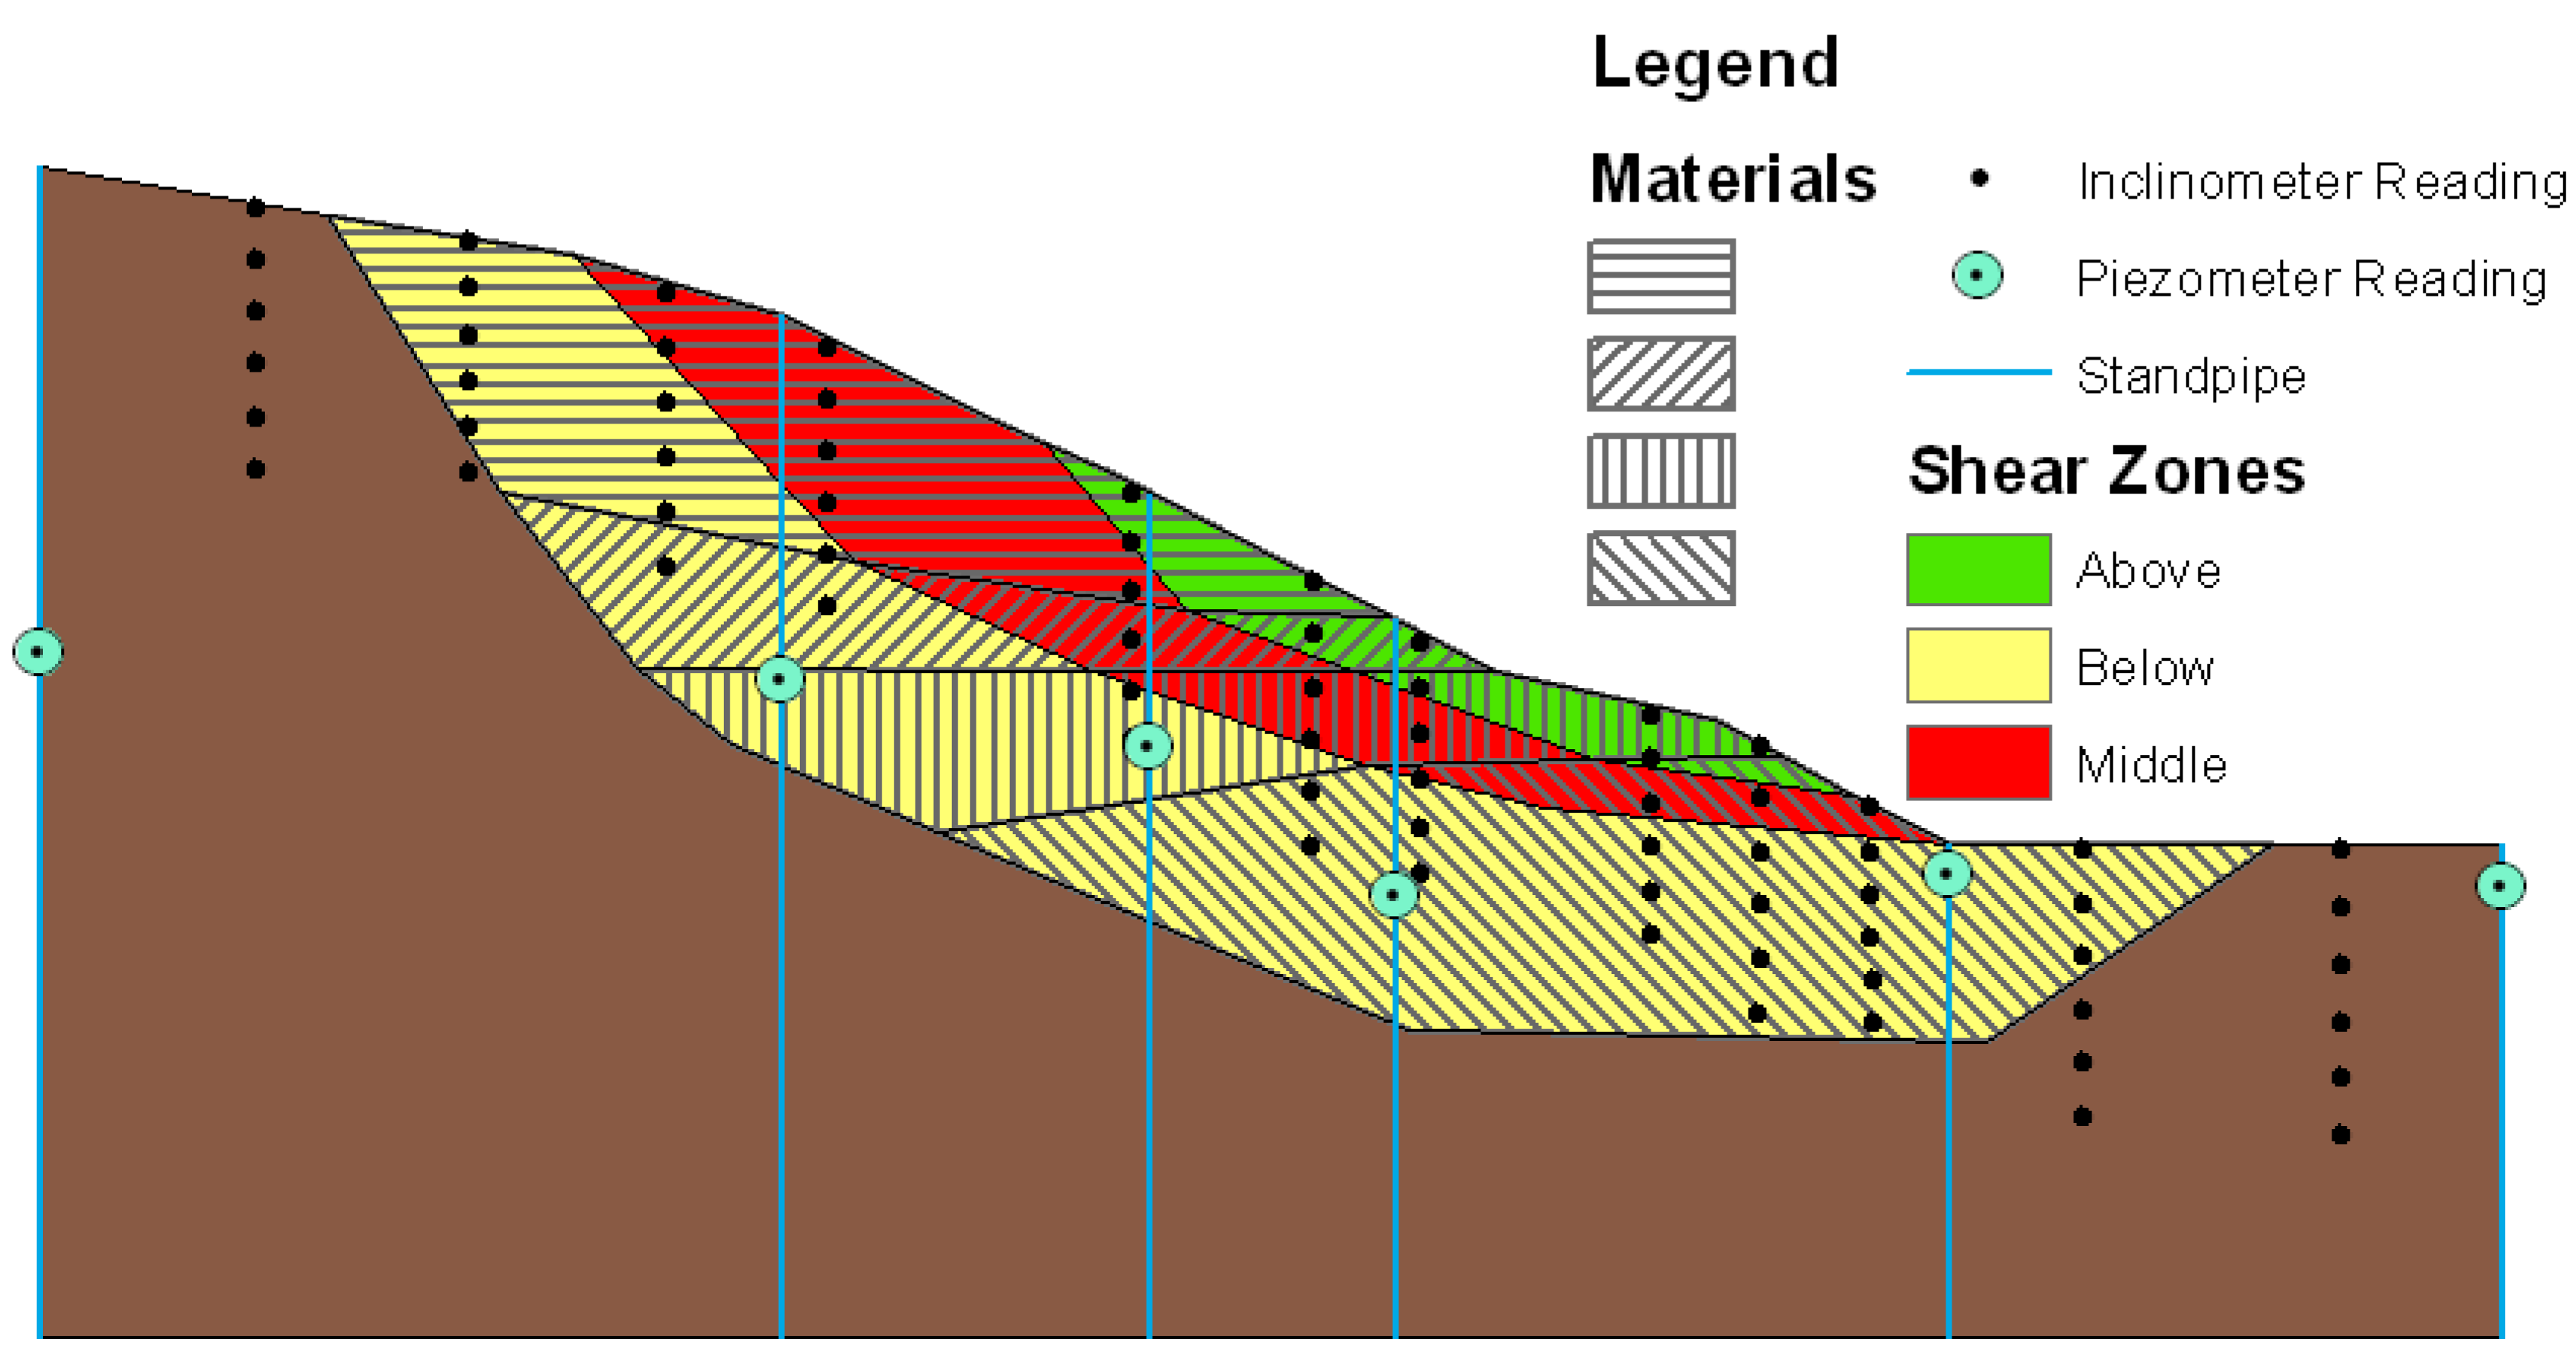
Figure 6.
Slope Monitoring Decision Tree.
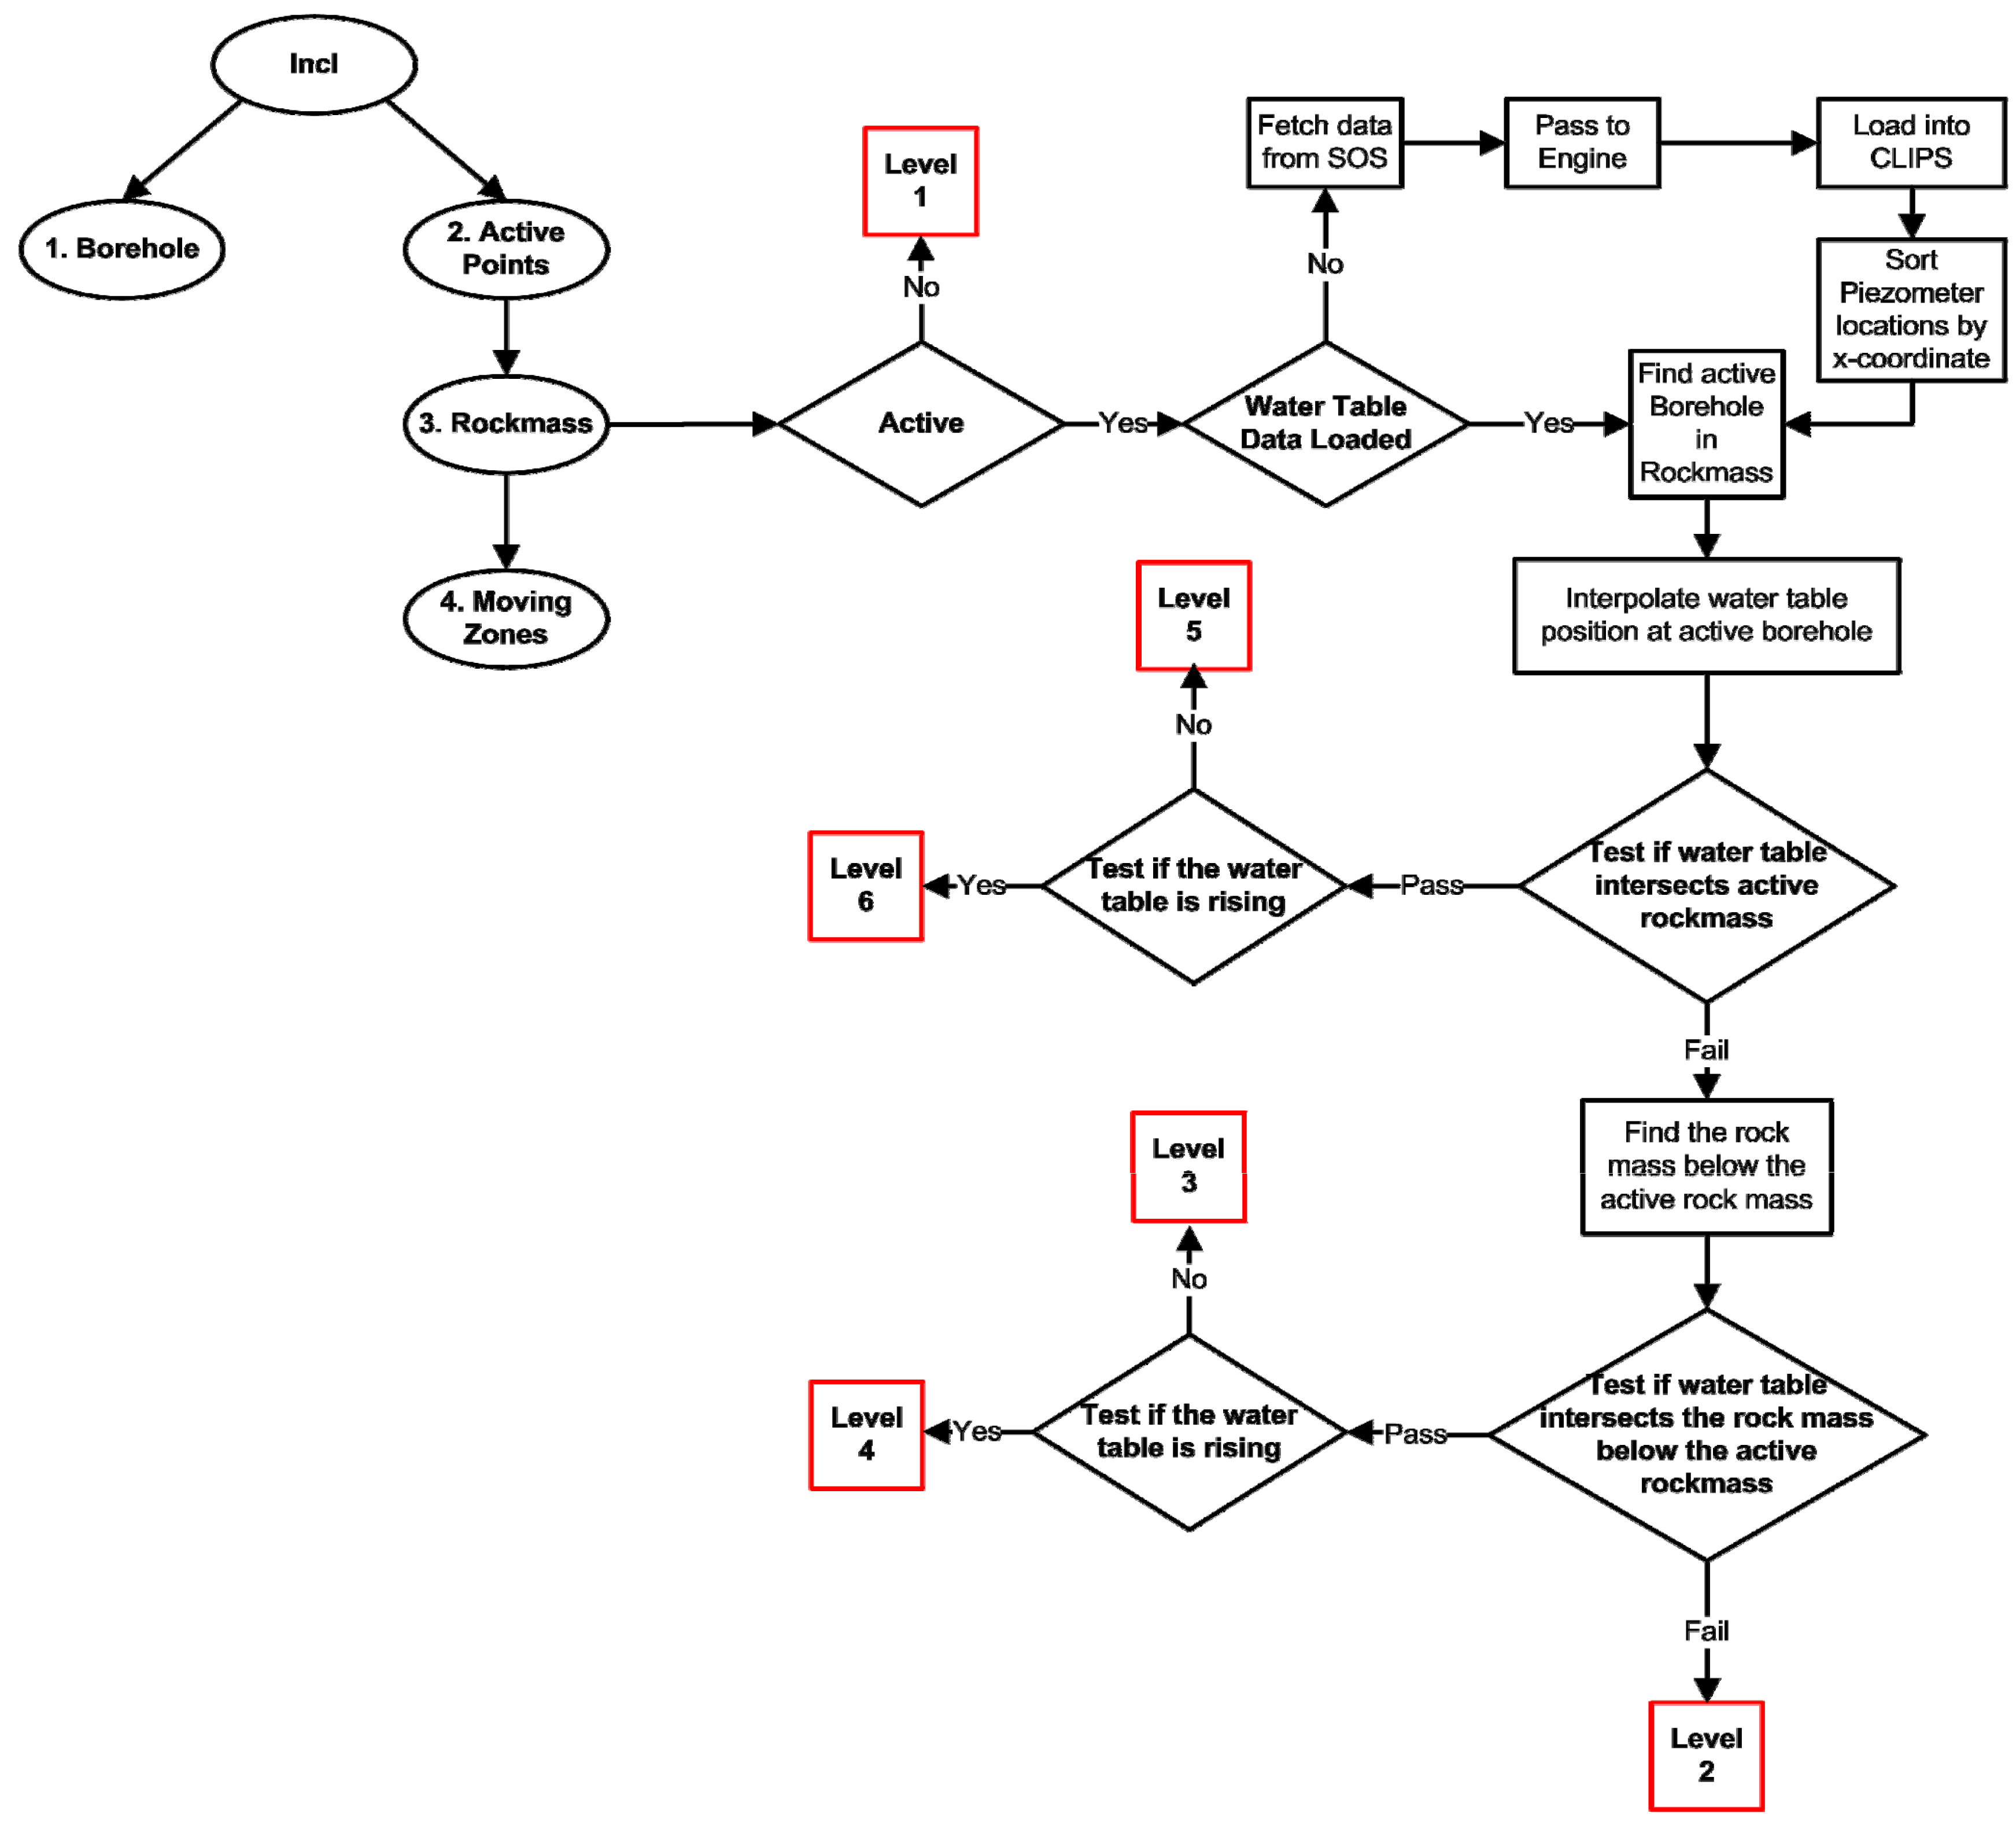
Figure 7.
Simulated slope model showing water levels and their relationship to the motion of the slope.
Figure 7.
Simulated slope model showing water levels and their relationship to the motion of the slope.

© 2008 by MDPI Reproduction is permitted for noncommercial purposes.
Share and Cite
MDPI and ACS Style
McCarthy, J.D.; Graniero, P.A.; Rozic, S.M. An Integrated GIS-Expert System Framework for Live Hazard Monitoring and Detection. Sensors 2008, 8, 830-846. https://doi.org/10.3390/s8020830
AMA Style
McCarthy JD, Graniero PA, Rozic SM. An Integrated GIS-Expert System Framework for Live Hazard Monitoring and Detection. Sensors. 2008; 8(2):830-846. https://doi.org/10.3390/s8020830
Chicago/Turabian StyleMcCarthy, James D., Phil A. Graniero, and Steven M. Rozic. 2008. "An Integrated GIS-Expert System Framework for Live Hazard Monitoring and Detection" Sensors 8, no. 2: 830-846. https://doi.org/10.3390/s8020830