Management of Occupational Exposure to Engineered Nanoparticles Through a Chance-Constrained Nonlinear Programming Approach

Abstract
:1. Introduction
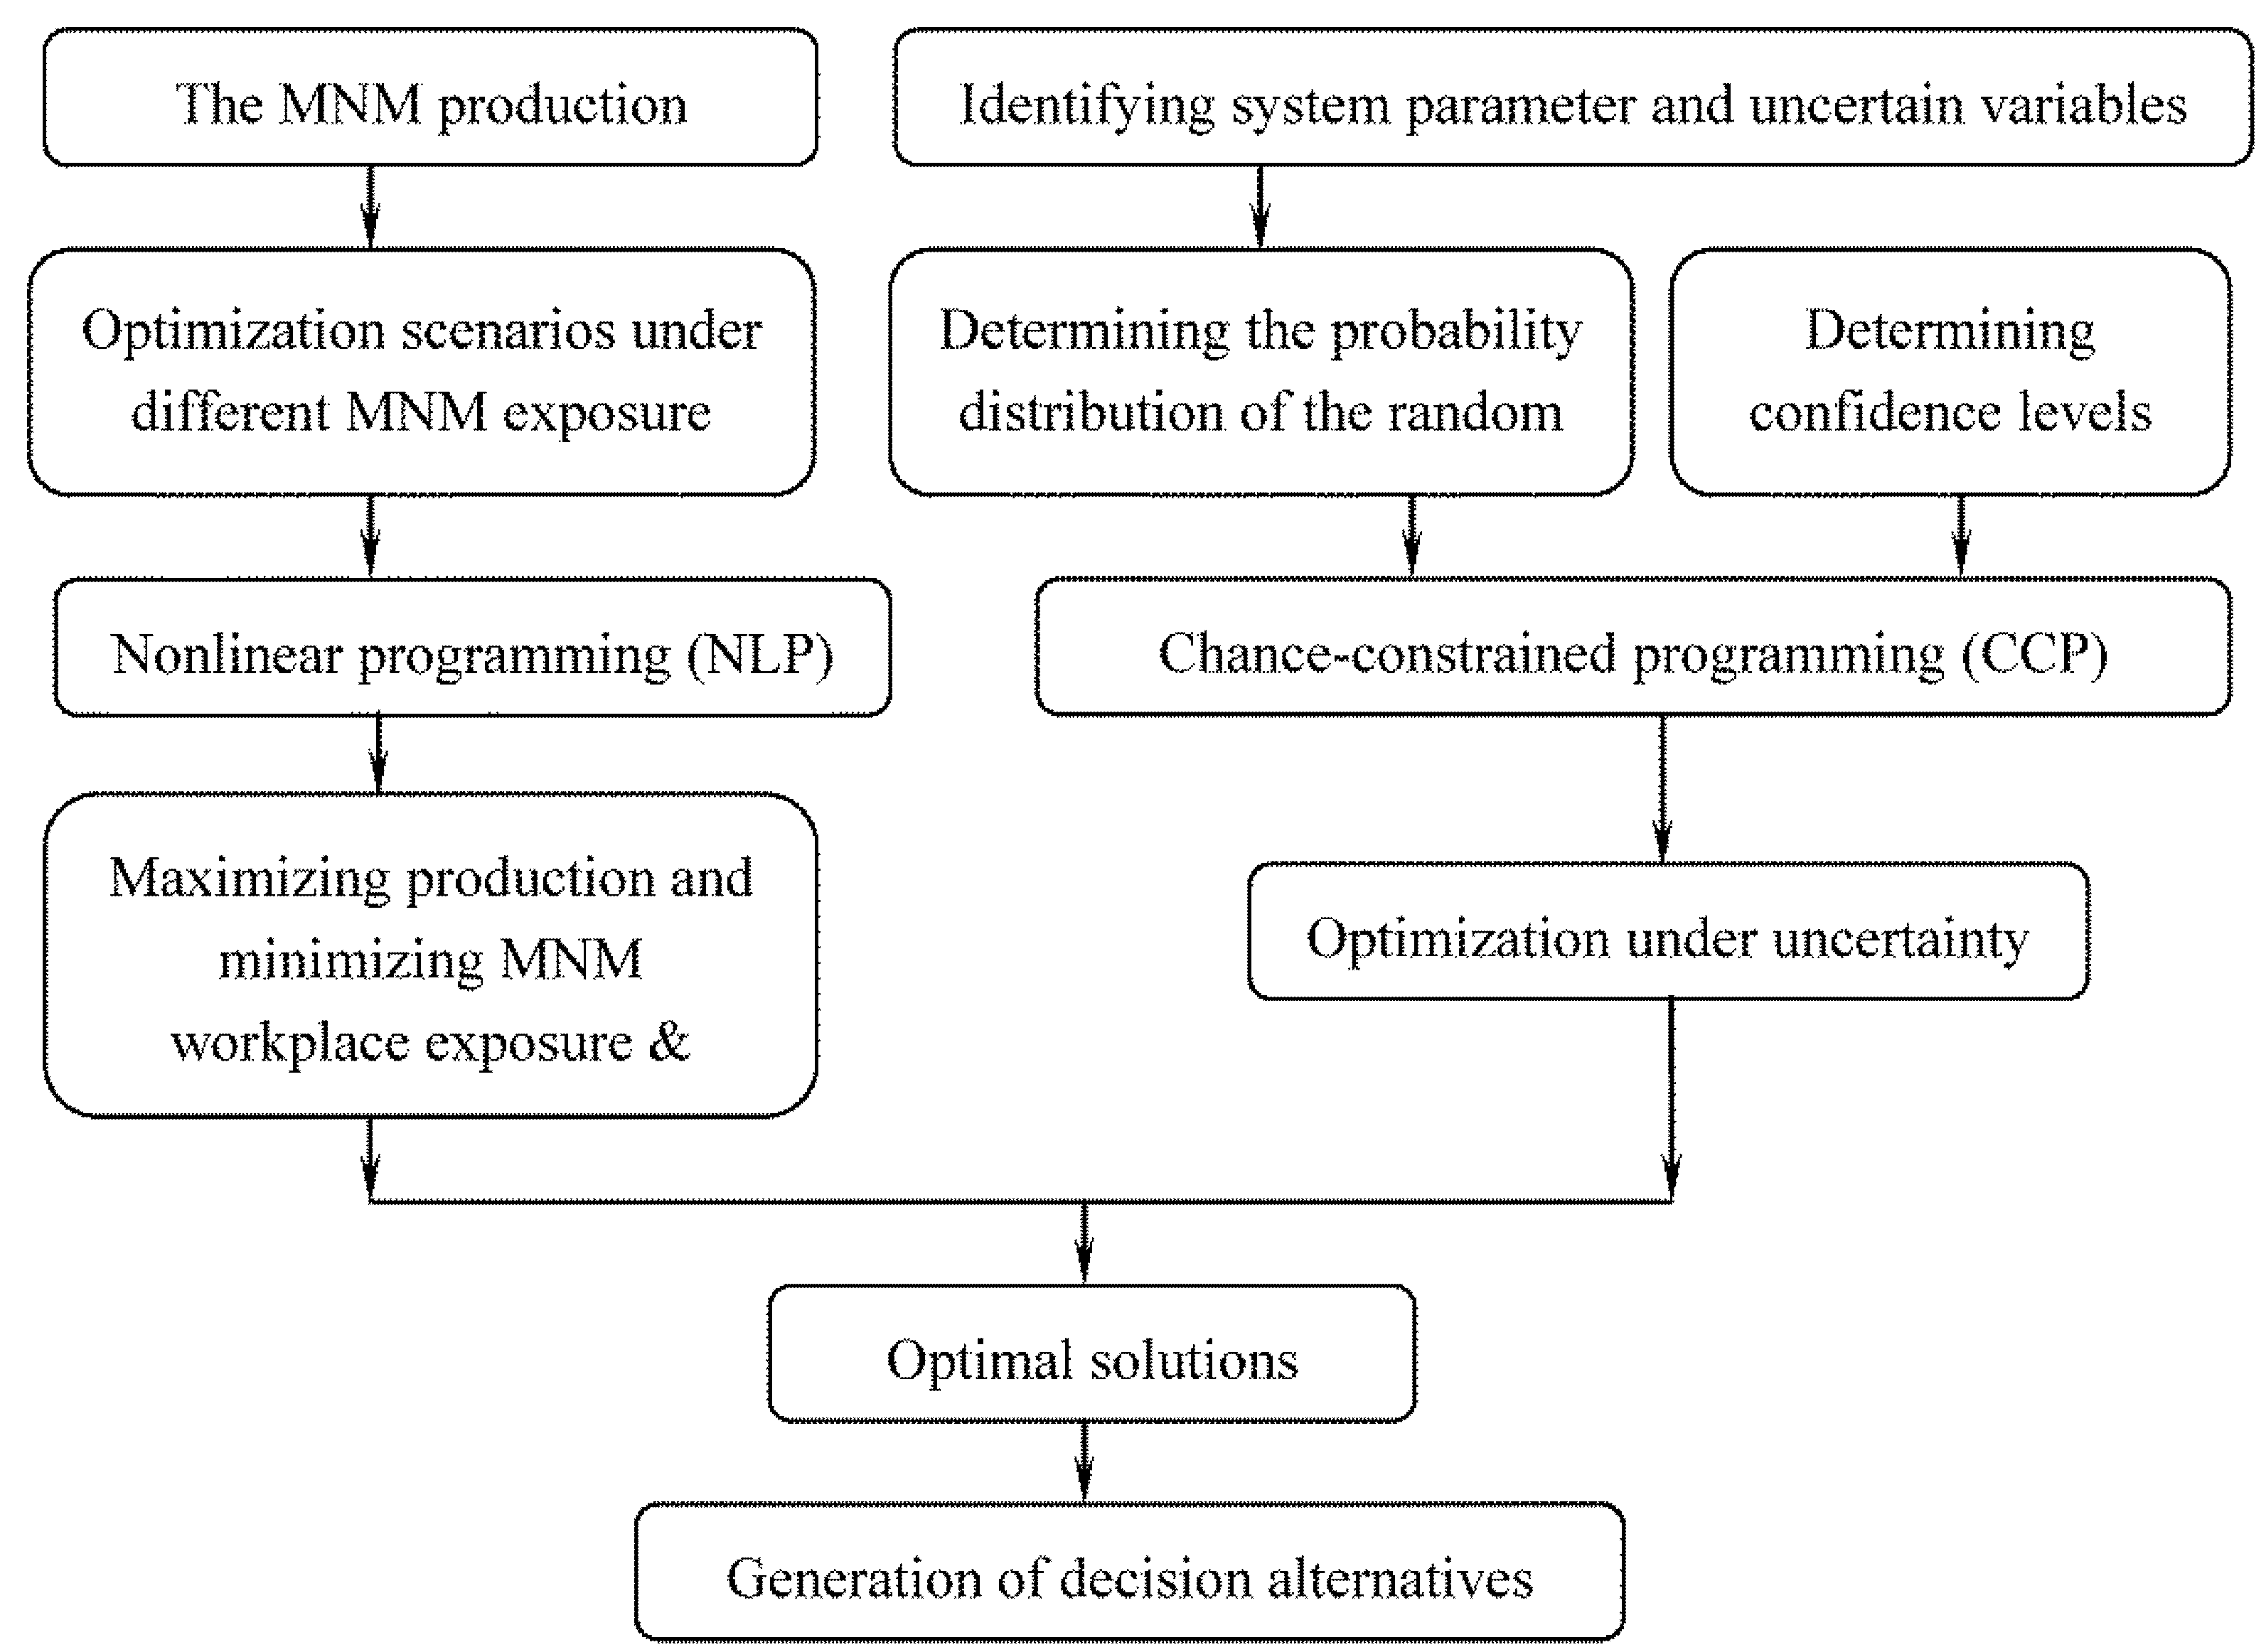
2. Methodology
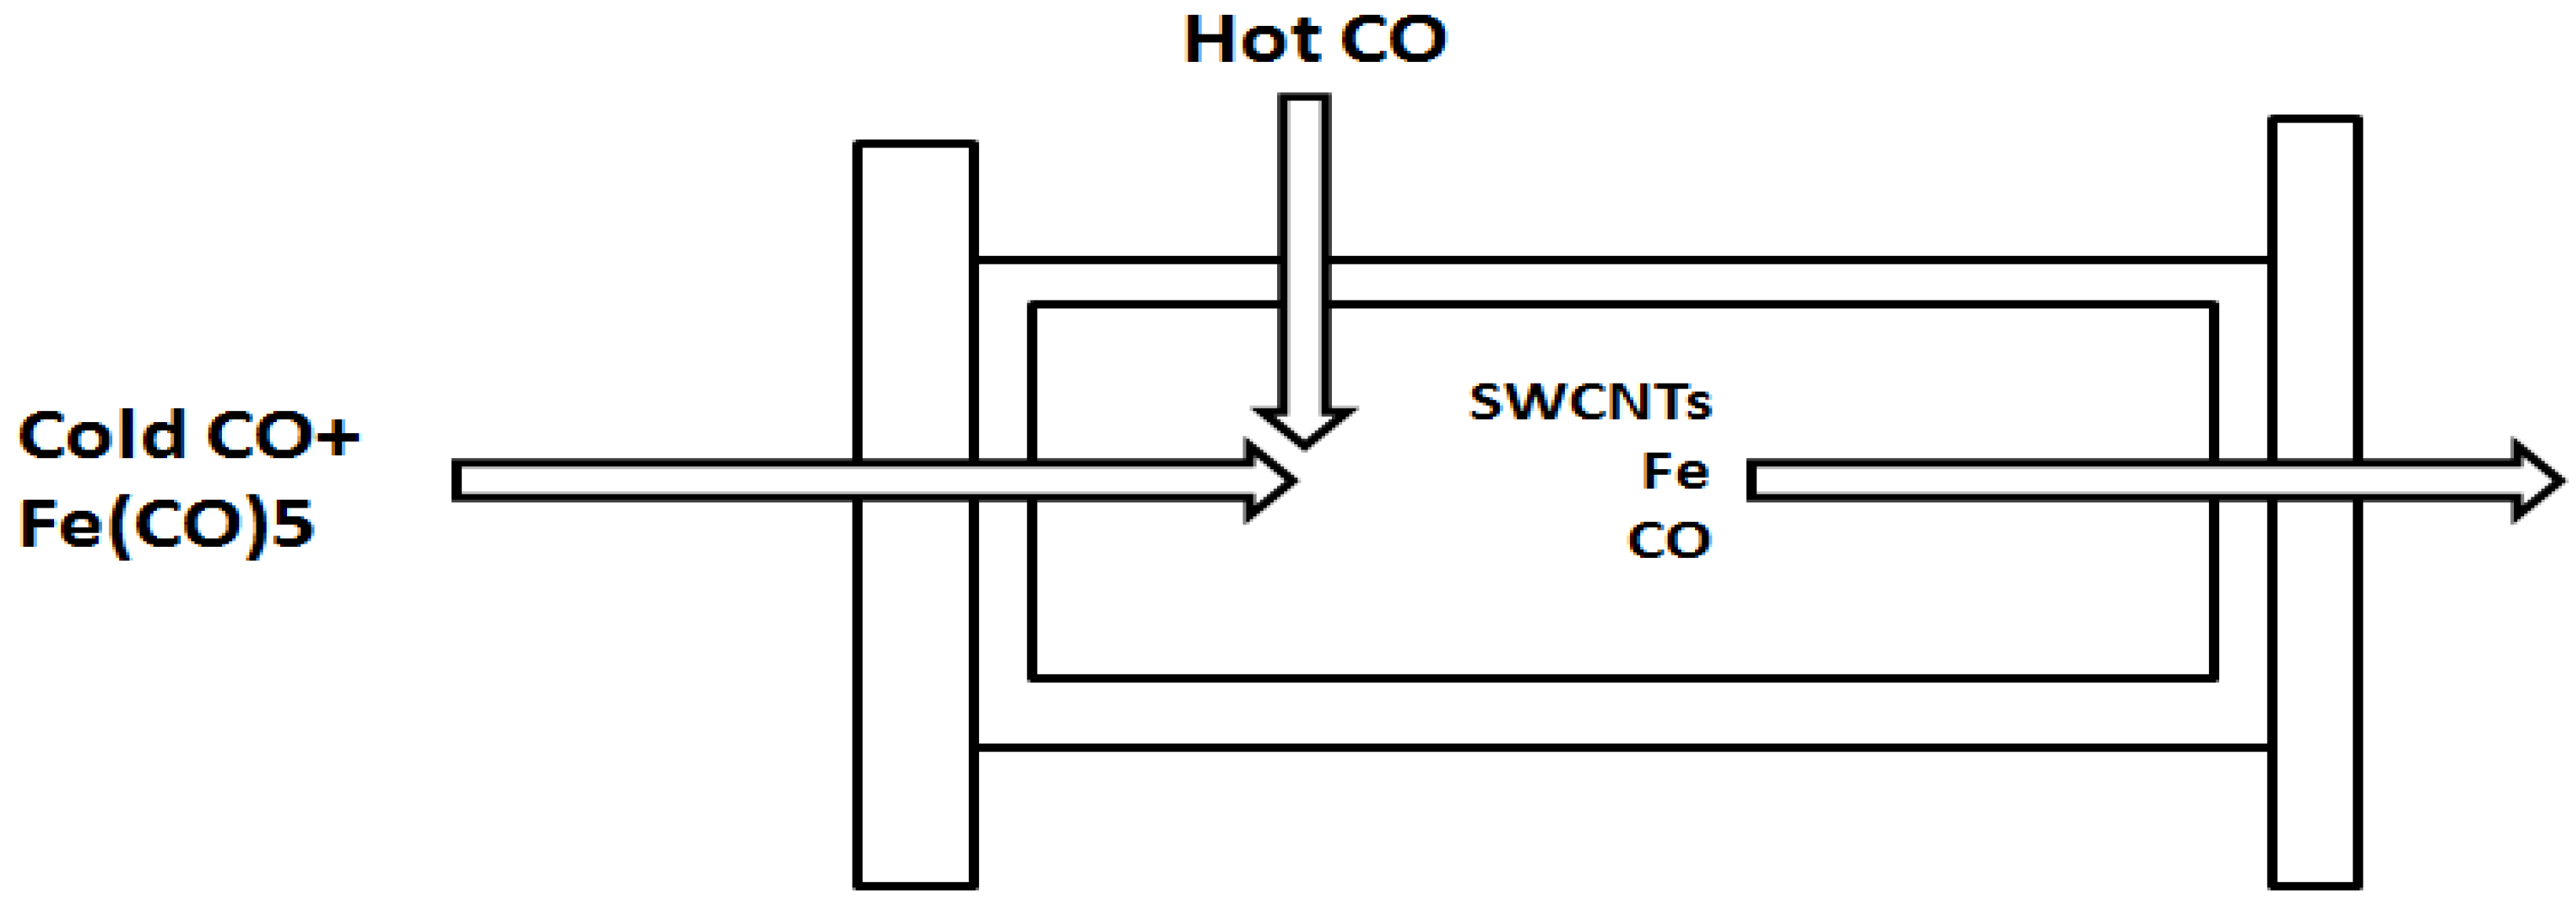
2.1. The Nanotechnology Manufacturing Process
High-Pressure Carbon Monoxide (HiPco) Process for Manufacturing Single-Walled Nanotubes (SWNTs)
2.2. Optimization for Occupational Exposure Risk Management of SWNT Manufacturing
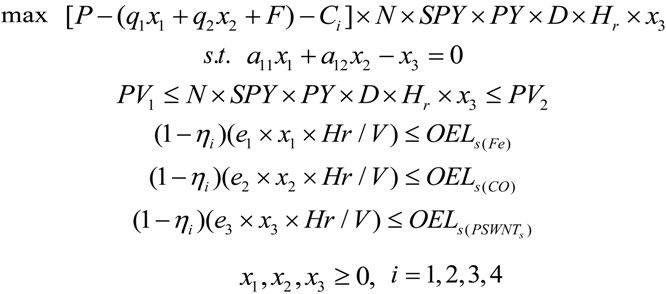
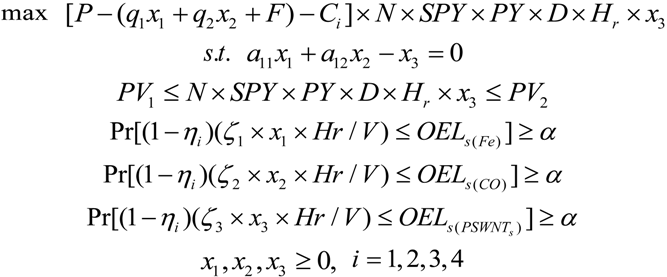
2.2.1. The Nonlinear Programming (NLP) Approach for Occupational Exposure Risks Management of SWNT Manufacturing
- (1) = profits from nanoparticle manufacturing per year;
- (2) = production costs of nanoparticles per year;
- (3) = exposure control costs per year.
- (a)
- mass balance constraints;
- (b)
- production volume constraints;
- (c)
- occupational exposure limit constraints.
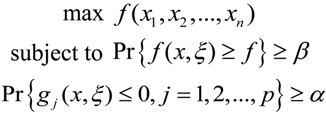
2.2.2. Chance-Constrained Nonlinear Programming (CCNLP) Calculations for Occupational Exposure Risk Management of SWNT Manufacturing
3. Case Study
3.1. Overview of the Case Study


| EHS levels | |||
| Type of EHS Control | Low | Medium | High |
| Engineering Controls | |||
| General exhaust-ventilation | 24 h, 28.31 m2 ventilation rate, $10,000 capital cost, $ 3,000/year operating cost | 24 h, 28.31 m2 ventilation rate, $10,000 capital cost, $ 3,000/year operating cost | 24 h, 28.31 m2 ventilation rate, $10,000 capital cost, $ 3,000/year operating cost |
| Fume hoods | $4,000 capital cost for 0.58 m2 equipment and $9,500 for 2.3 m2 equipment | $4,000 capital cost for 0.58 m2 equipment and $9,500 for 2.3 m2 equipment | |
| Enclosure of processes | 50% decrease in labor productivity, 50% extra equipment cost | ||
| Administrative controls | |||
| Annual worker training | 8 h of training, $560/year instructor cost | 8 h of training, $560/year instructor cost | 8 h of training, $560/year instructor cost |
| Air monitoring | Monthly monitoring, $20,000/equipment capital cost | Weekly monitoring, $20,000/equipment capital cost | Biweekly monitoring, $20,000/equipment capital cost |
| Medical monitoring | $950/worker/year | ||
3.2. The NLP and CCNLP MNM Workplace Model Information and Scenarios
| Control Level | Cost ($/g) | Reduced Efficiency (η) |
|---|---|---|
| No | 0.00 | 0.0 |
| Low | 10.00 | 0.1 |
| Medium | 78.00 | 0.5 |
| High | 210.00 | 0.8 |
| Mean | SD | Reference | |
|---|---|---|---|
| nano-sized Fe (ζ1) | 0.00135 | 0.00070 | (Calculated from [25]) |
| CO (ζ2) | 0.03700 | 0.00040 | (Calculated from [39]) |
| SWCNT (ζ3) | 0.00287 | 0.00227 | (Calculated from [25]) |
| Symbols | Units | Definition | Values | Reference |
|---|---|---|---|---|
| P | $/g | price of SWCNT | 1,000.00 | [36] |
| q1 | $/g | cost of Fe(CO)5 per gram SWCNT produced | 0.2 | [33] |
| q2 | $/g | cost of CO per gram SWCNT produced | 37.0 | [34] |
| F | $/g | total cost of SWCNT other than the raw material | 411.3 | (calculated from [36]) |
| N | \ | number of production lines | 9 | [36] |
| SPY | % | synthesis product yield | 97 | [36] |
| PY | % | purification yield | 90 | [36] |
| D | days/year | working days per year | 365 | [36] |
| Hr | hours/day | working hours per day | 8 | [36] |
| a11 | % | % Fe(CO)5 used to synthesize SWCNT | 15.0 | (calculated from [32]) |
| a12 | % | % CO used to synthesize SWCNT | 21.0 | (calculated from [32]) |
| PV1 | g/yr | minimum production volume of SWCNT per year | 0.0 | [36] |
| PV2 | g/yr | maximum production volume of SWCNTS per year | 20,000 | [36] |
| e1 | \ | emission coefficient of nano-sized Fe | 0.003 | [5] |
| e2 | \ | emission coefficient of CO | 0.037 | (calculated from [40]) |
| e3 | \ | emission coefficient of SWCNT | 0.005 | [5] |
| OEL(Fe) | μg/m3 | occupational exposure (OE) limit for nano-sized Fe and Fe(CO)5 | 7.9 | [41,42] |
| OEL(CO) | mg/m3 | OE limitfor CO | 40.0 | [43] |
| OELs(SWNTs) | μg/m3 | OE limit for SWCNT | 7.0 | [42] |
4. Results and Results Analysis
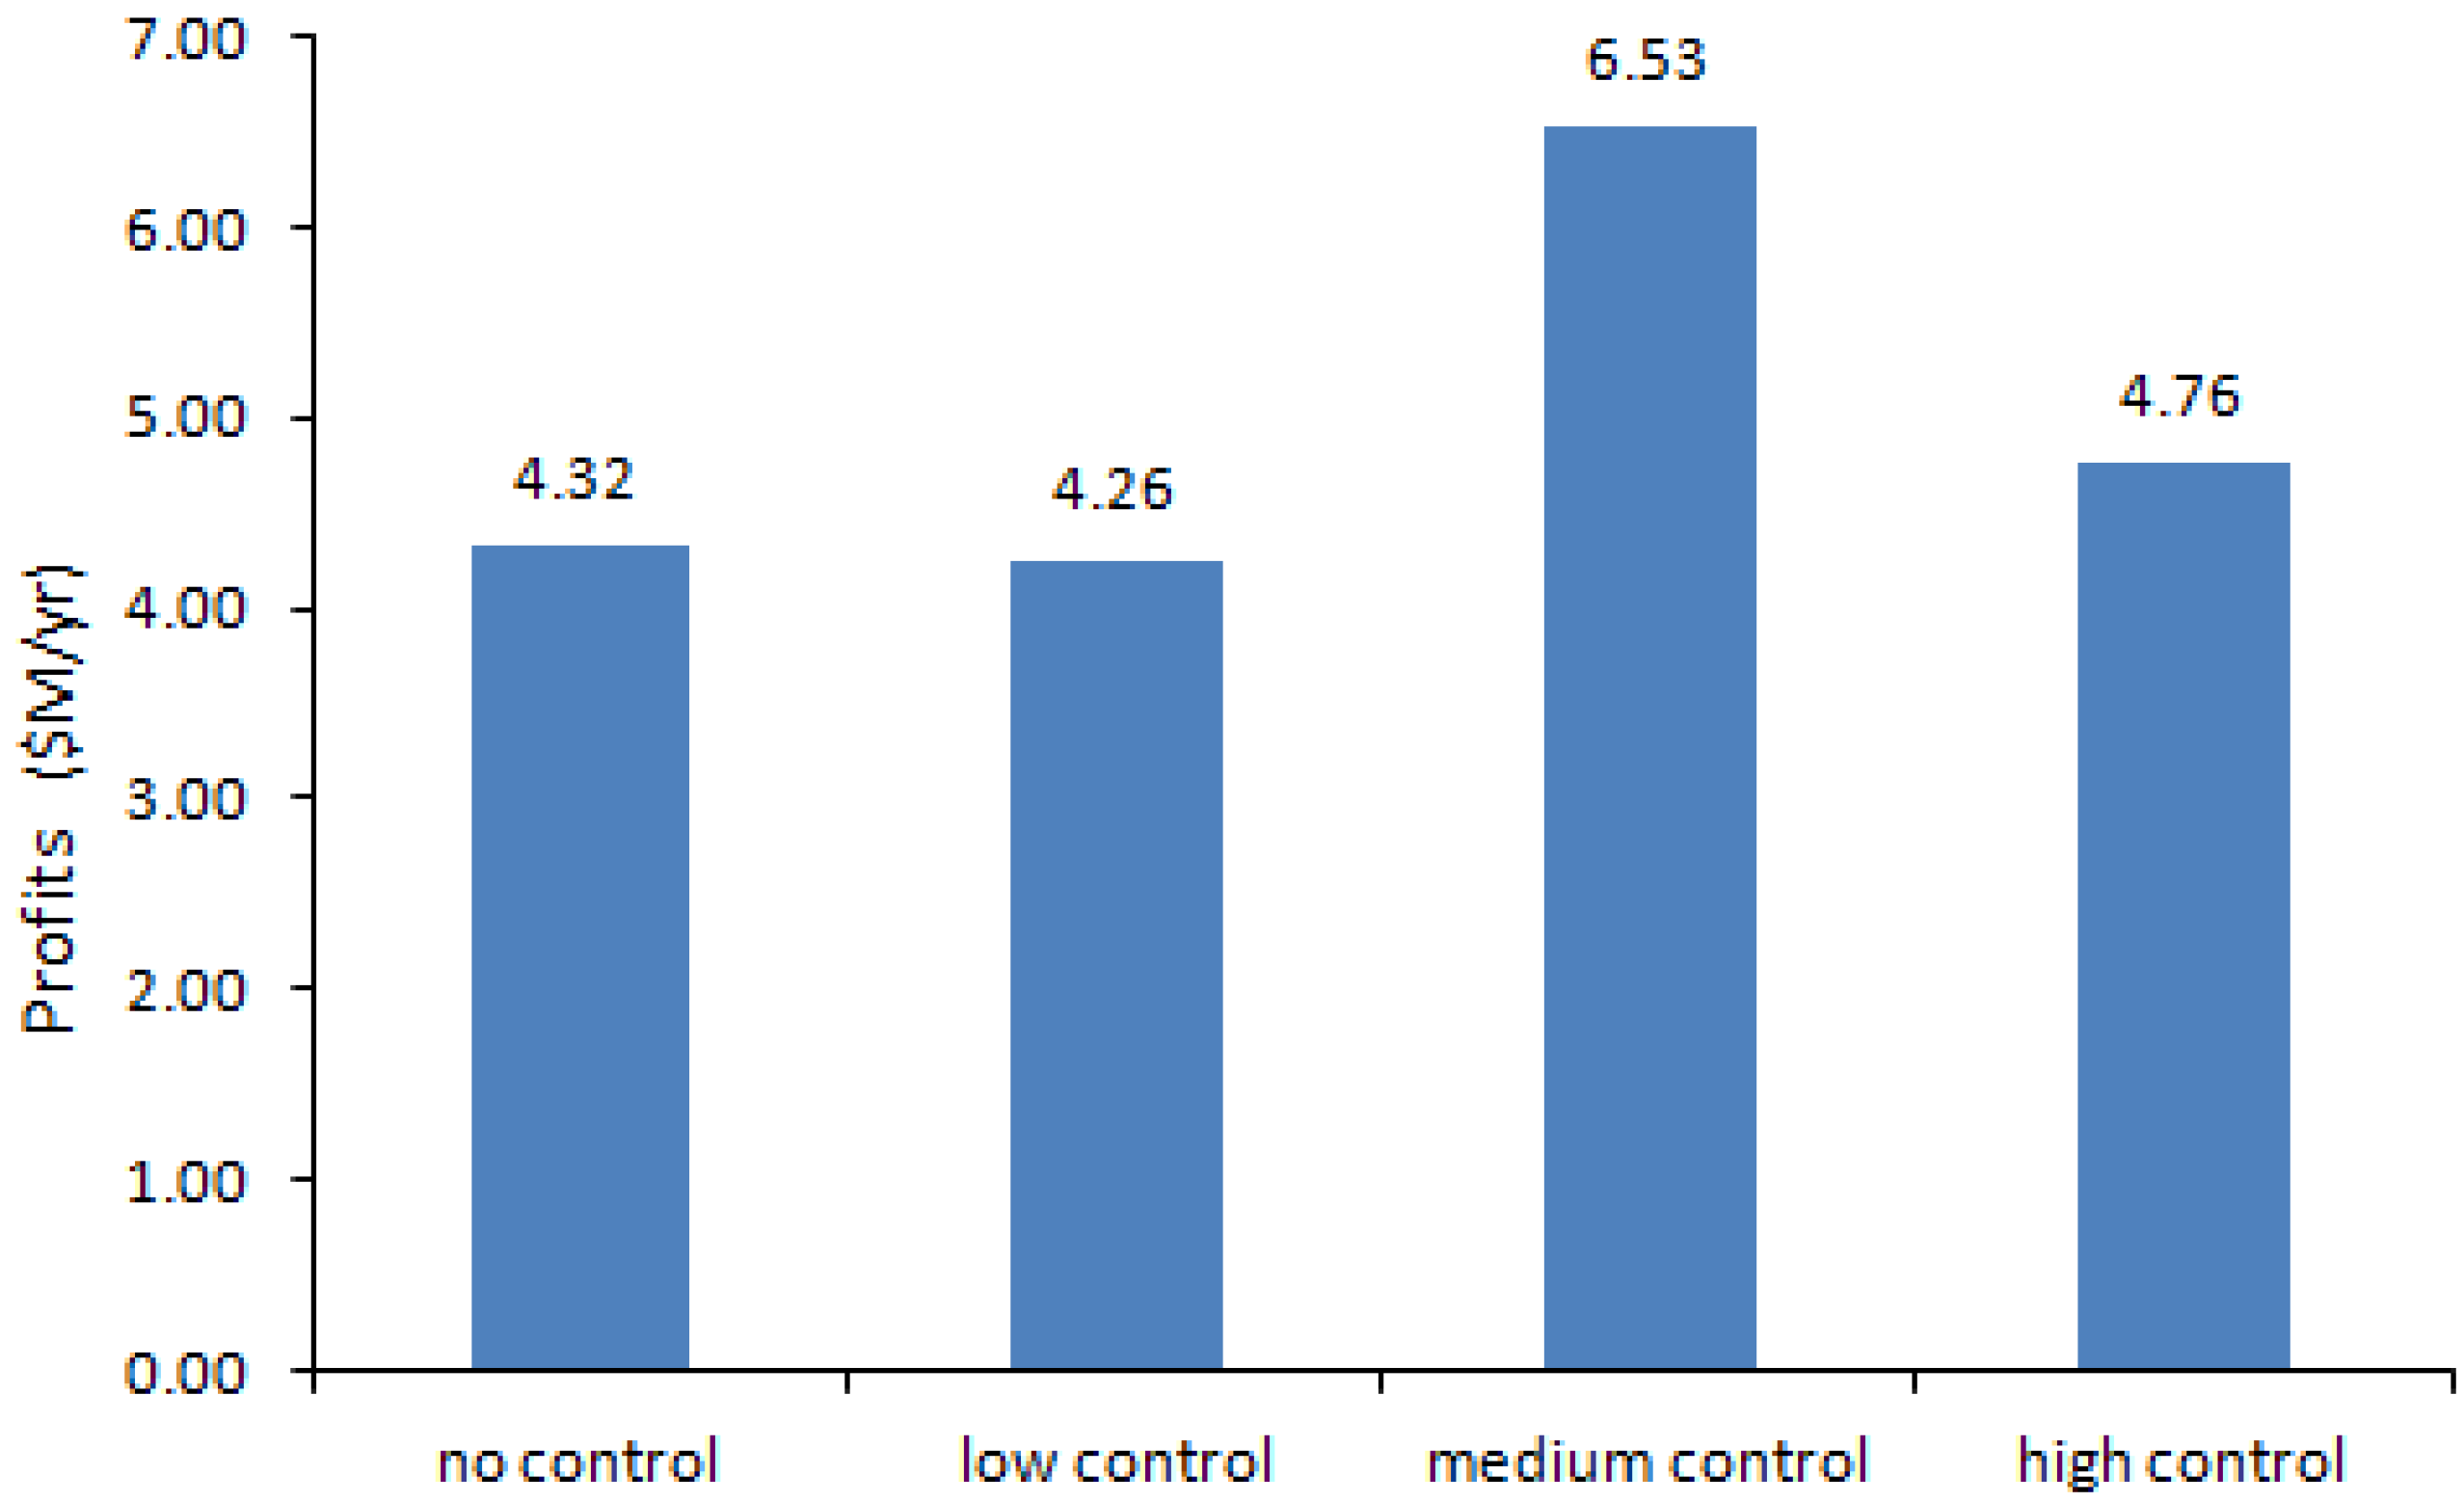
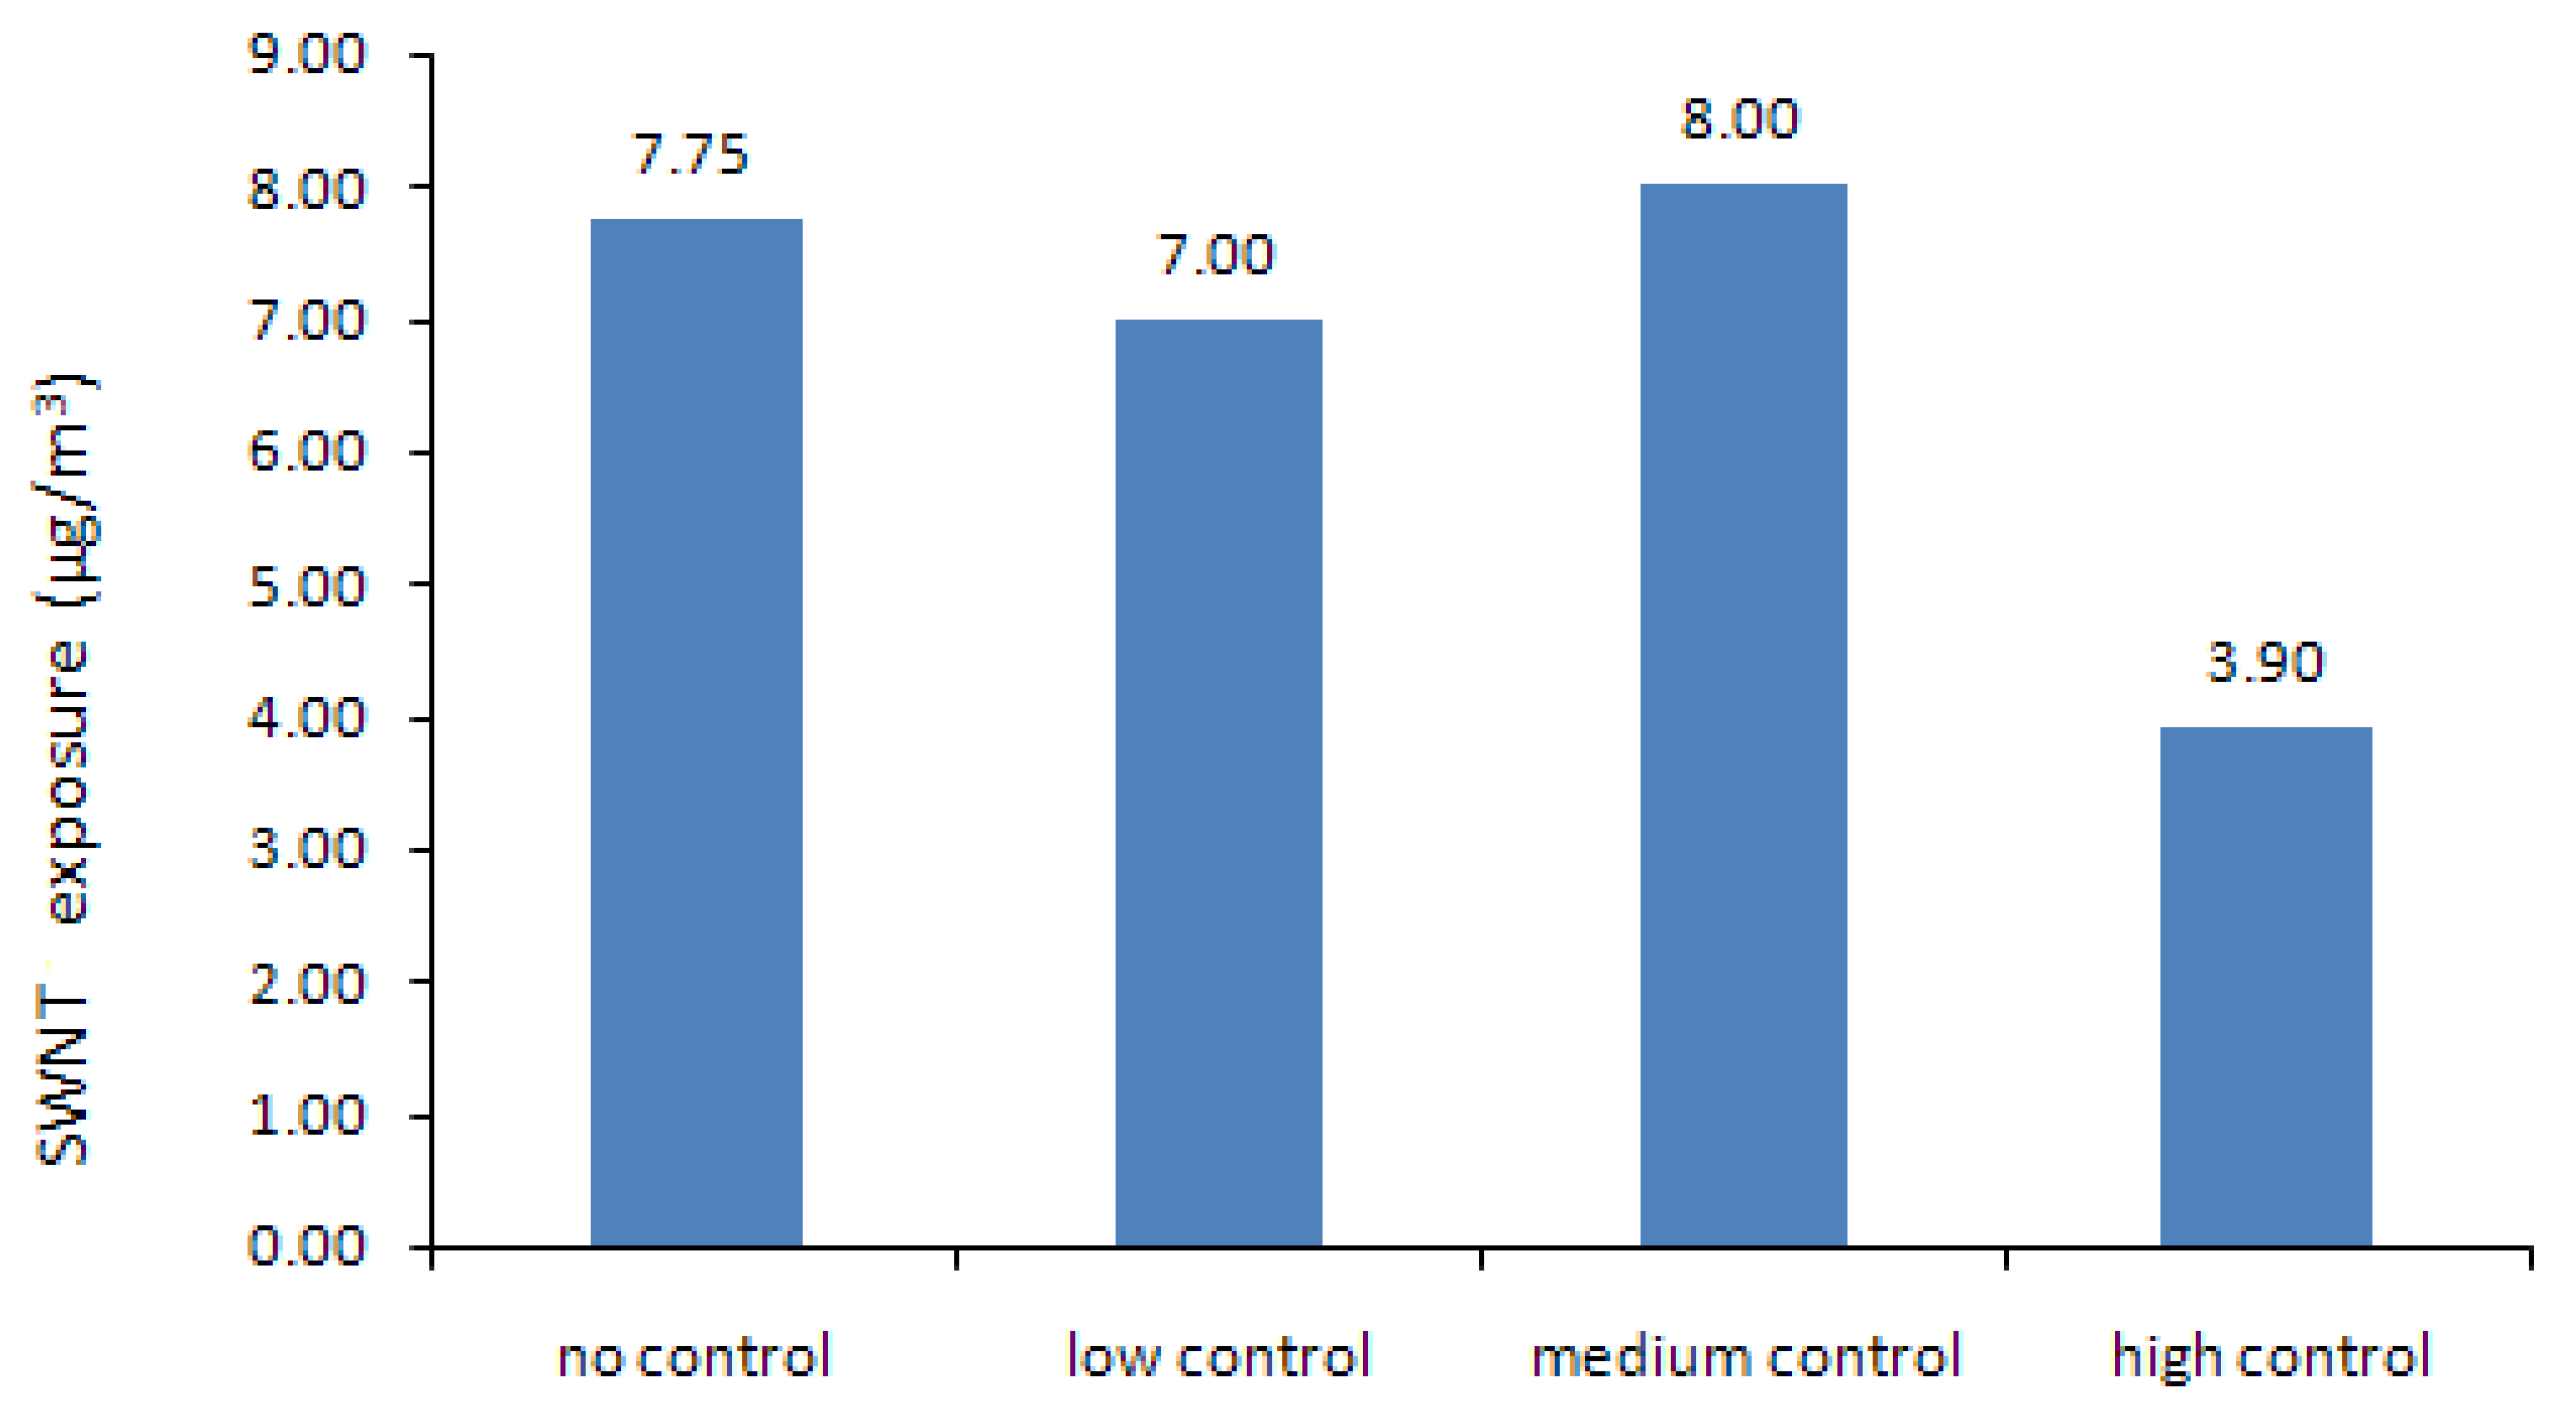
4.1. Results of the Nonlinear Programming (NLP) Calculations


| Control Level | Production Volume (g/yr) | Production Cost ($/g) | Profit ($M/yr) | SWNT Exposure (μg/m3) | CO Exposure (μg/m3) | Fe Exposure (μg/m3) |
|---|---|---|---|---|---|---|
| No | 8,003 | 459.94 | 4.32 | 7.75 | 213.14 | 1.00 |
| Low | 8,049 | 460.30 | 4.26 | 7.02 | 209.46 | 0.90 |
| Medium | 16,452 | 524.83 | 6.53 | 7.97 | 218.21 | 0.50 |
| High | 20,000 | 552.08 | 4.76 | 3.87 | 135.64 | 0.20 |
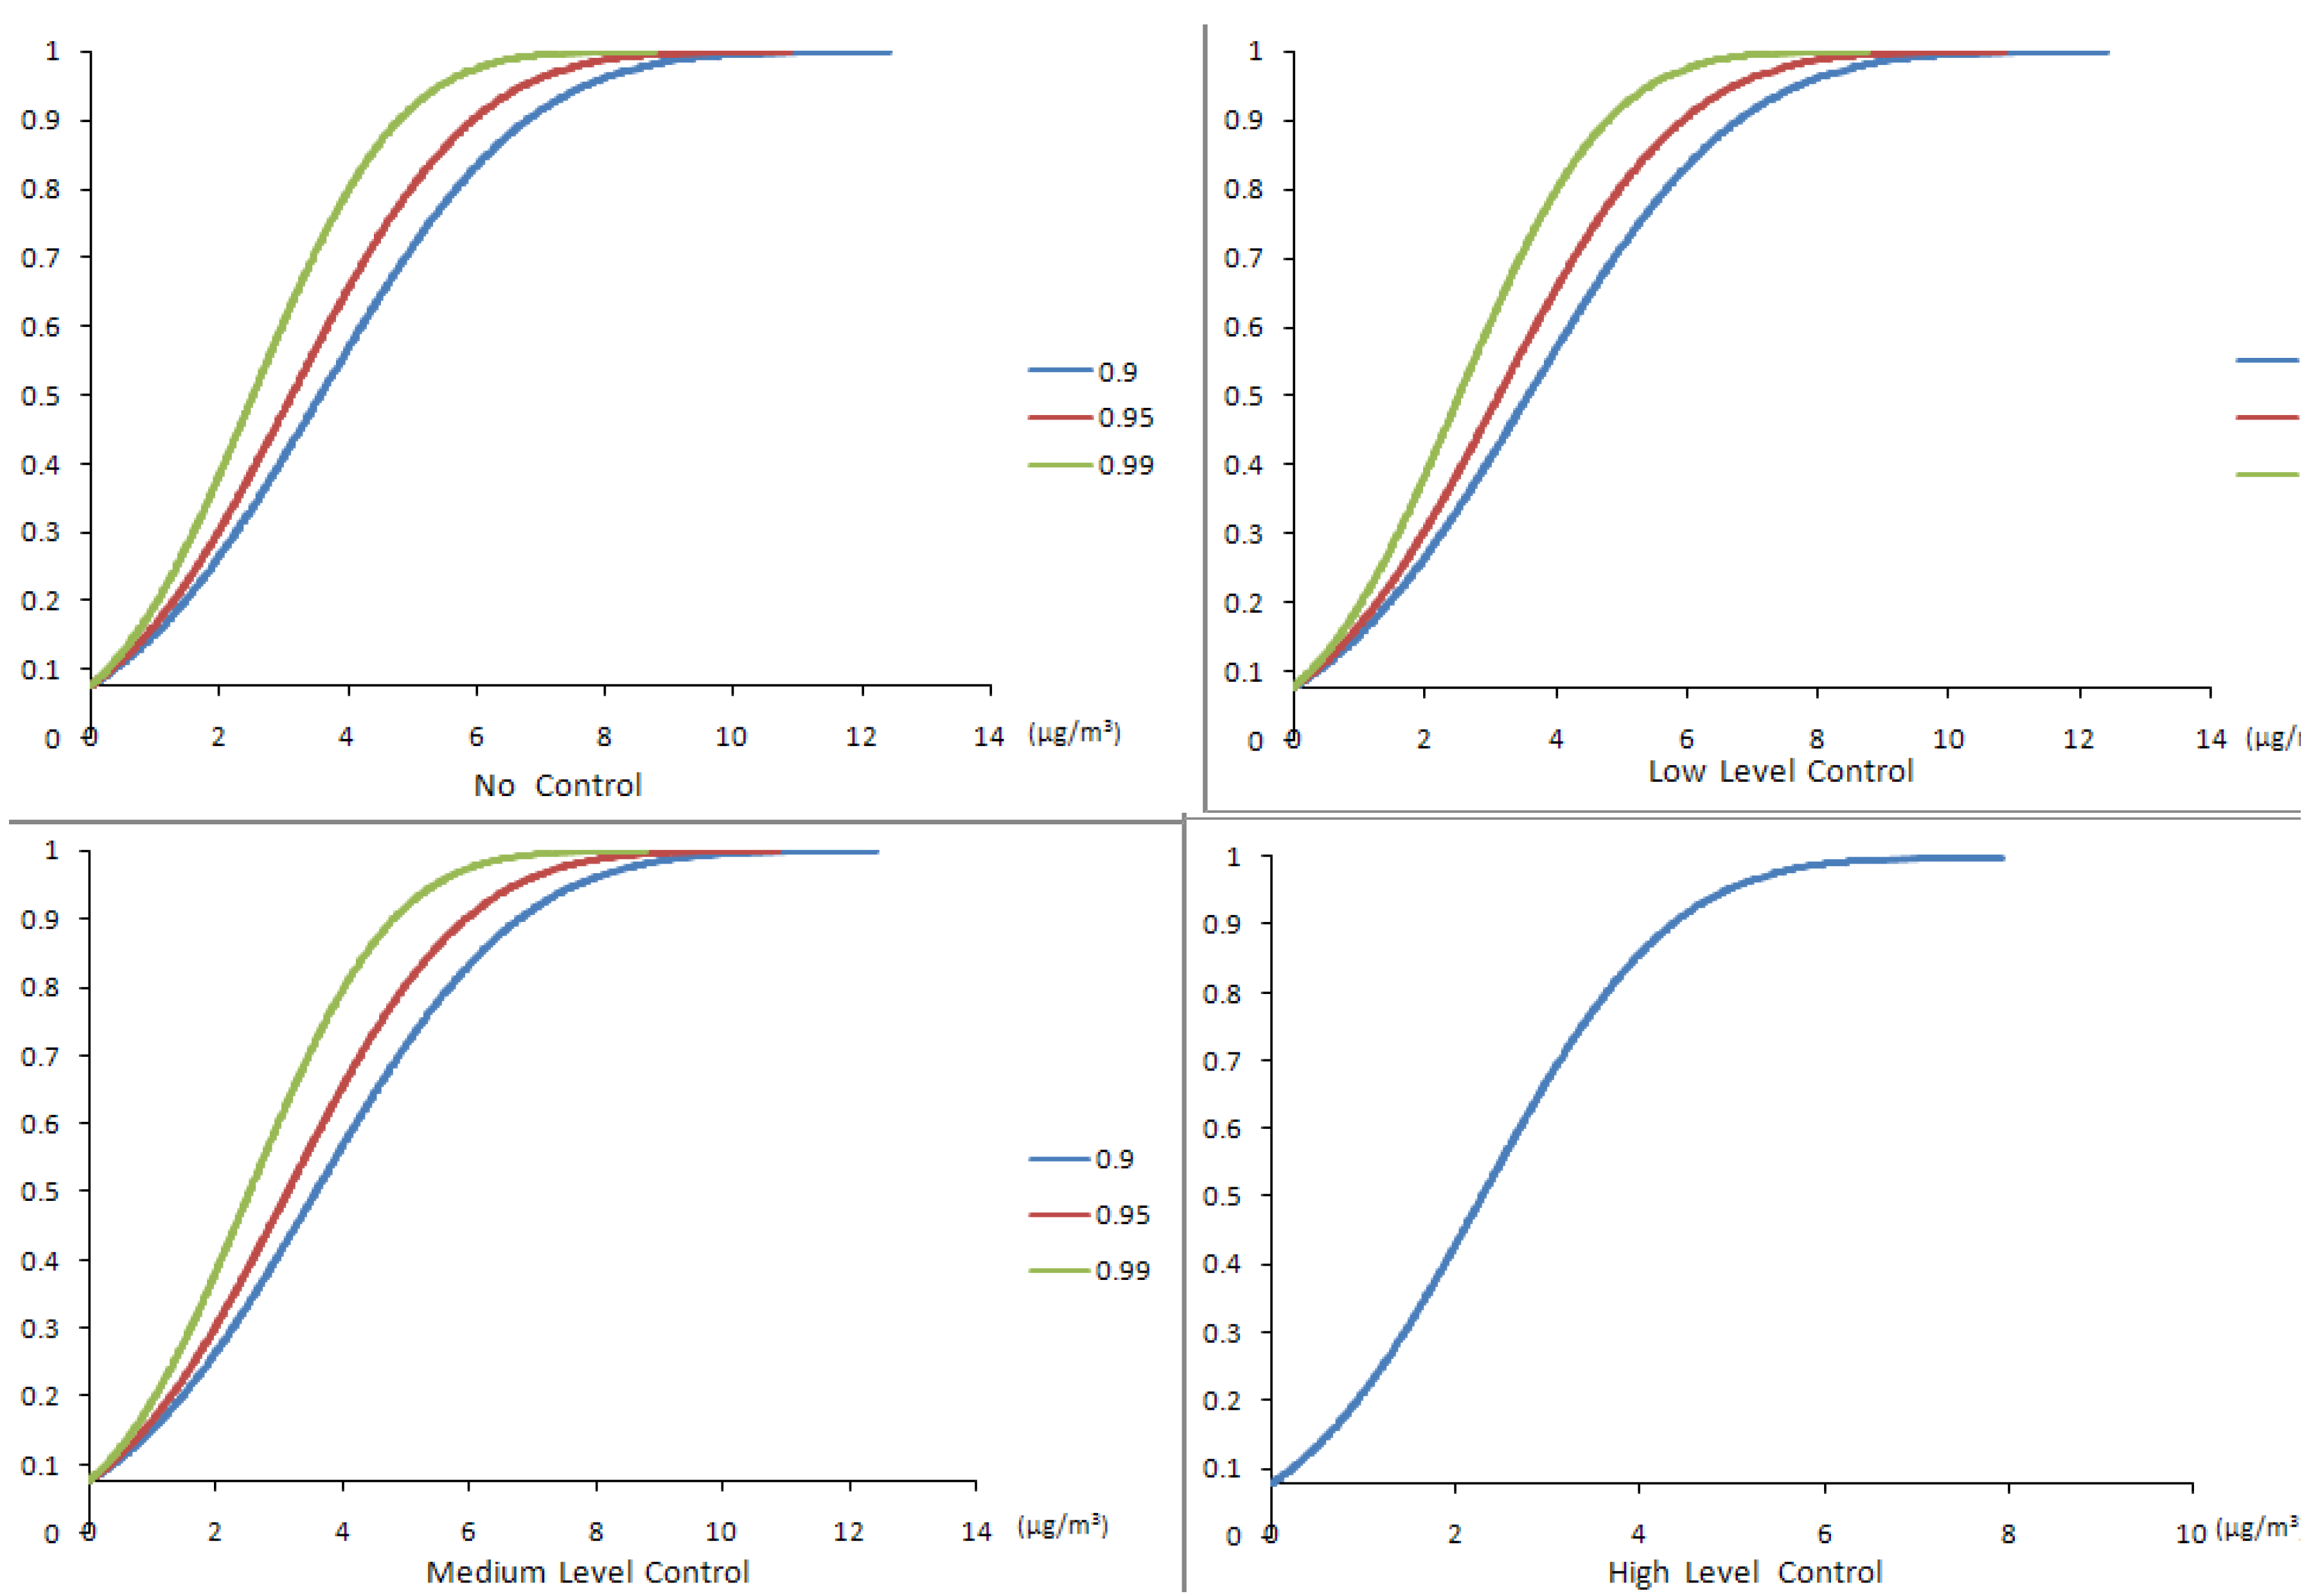
4.2. Results of the Chance-Constrained Nonlinear Programming (CCNLP) Model

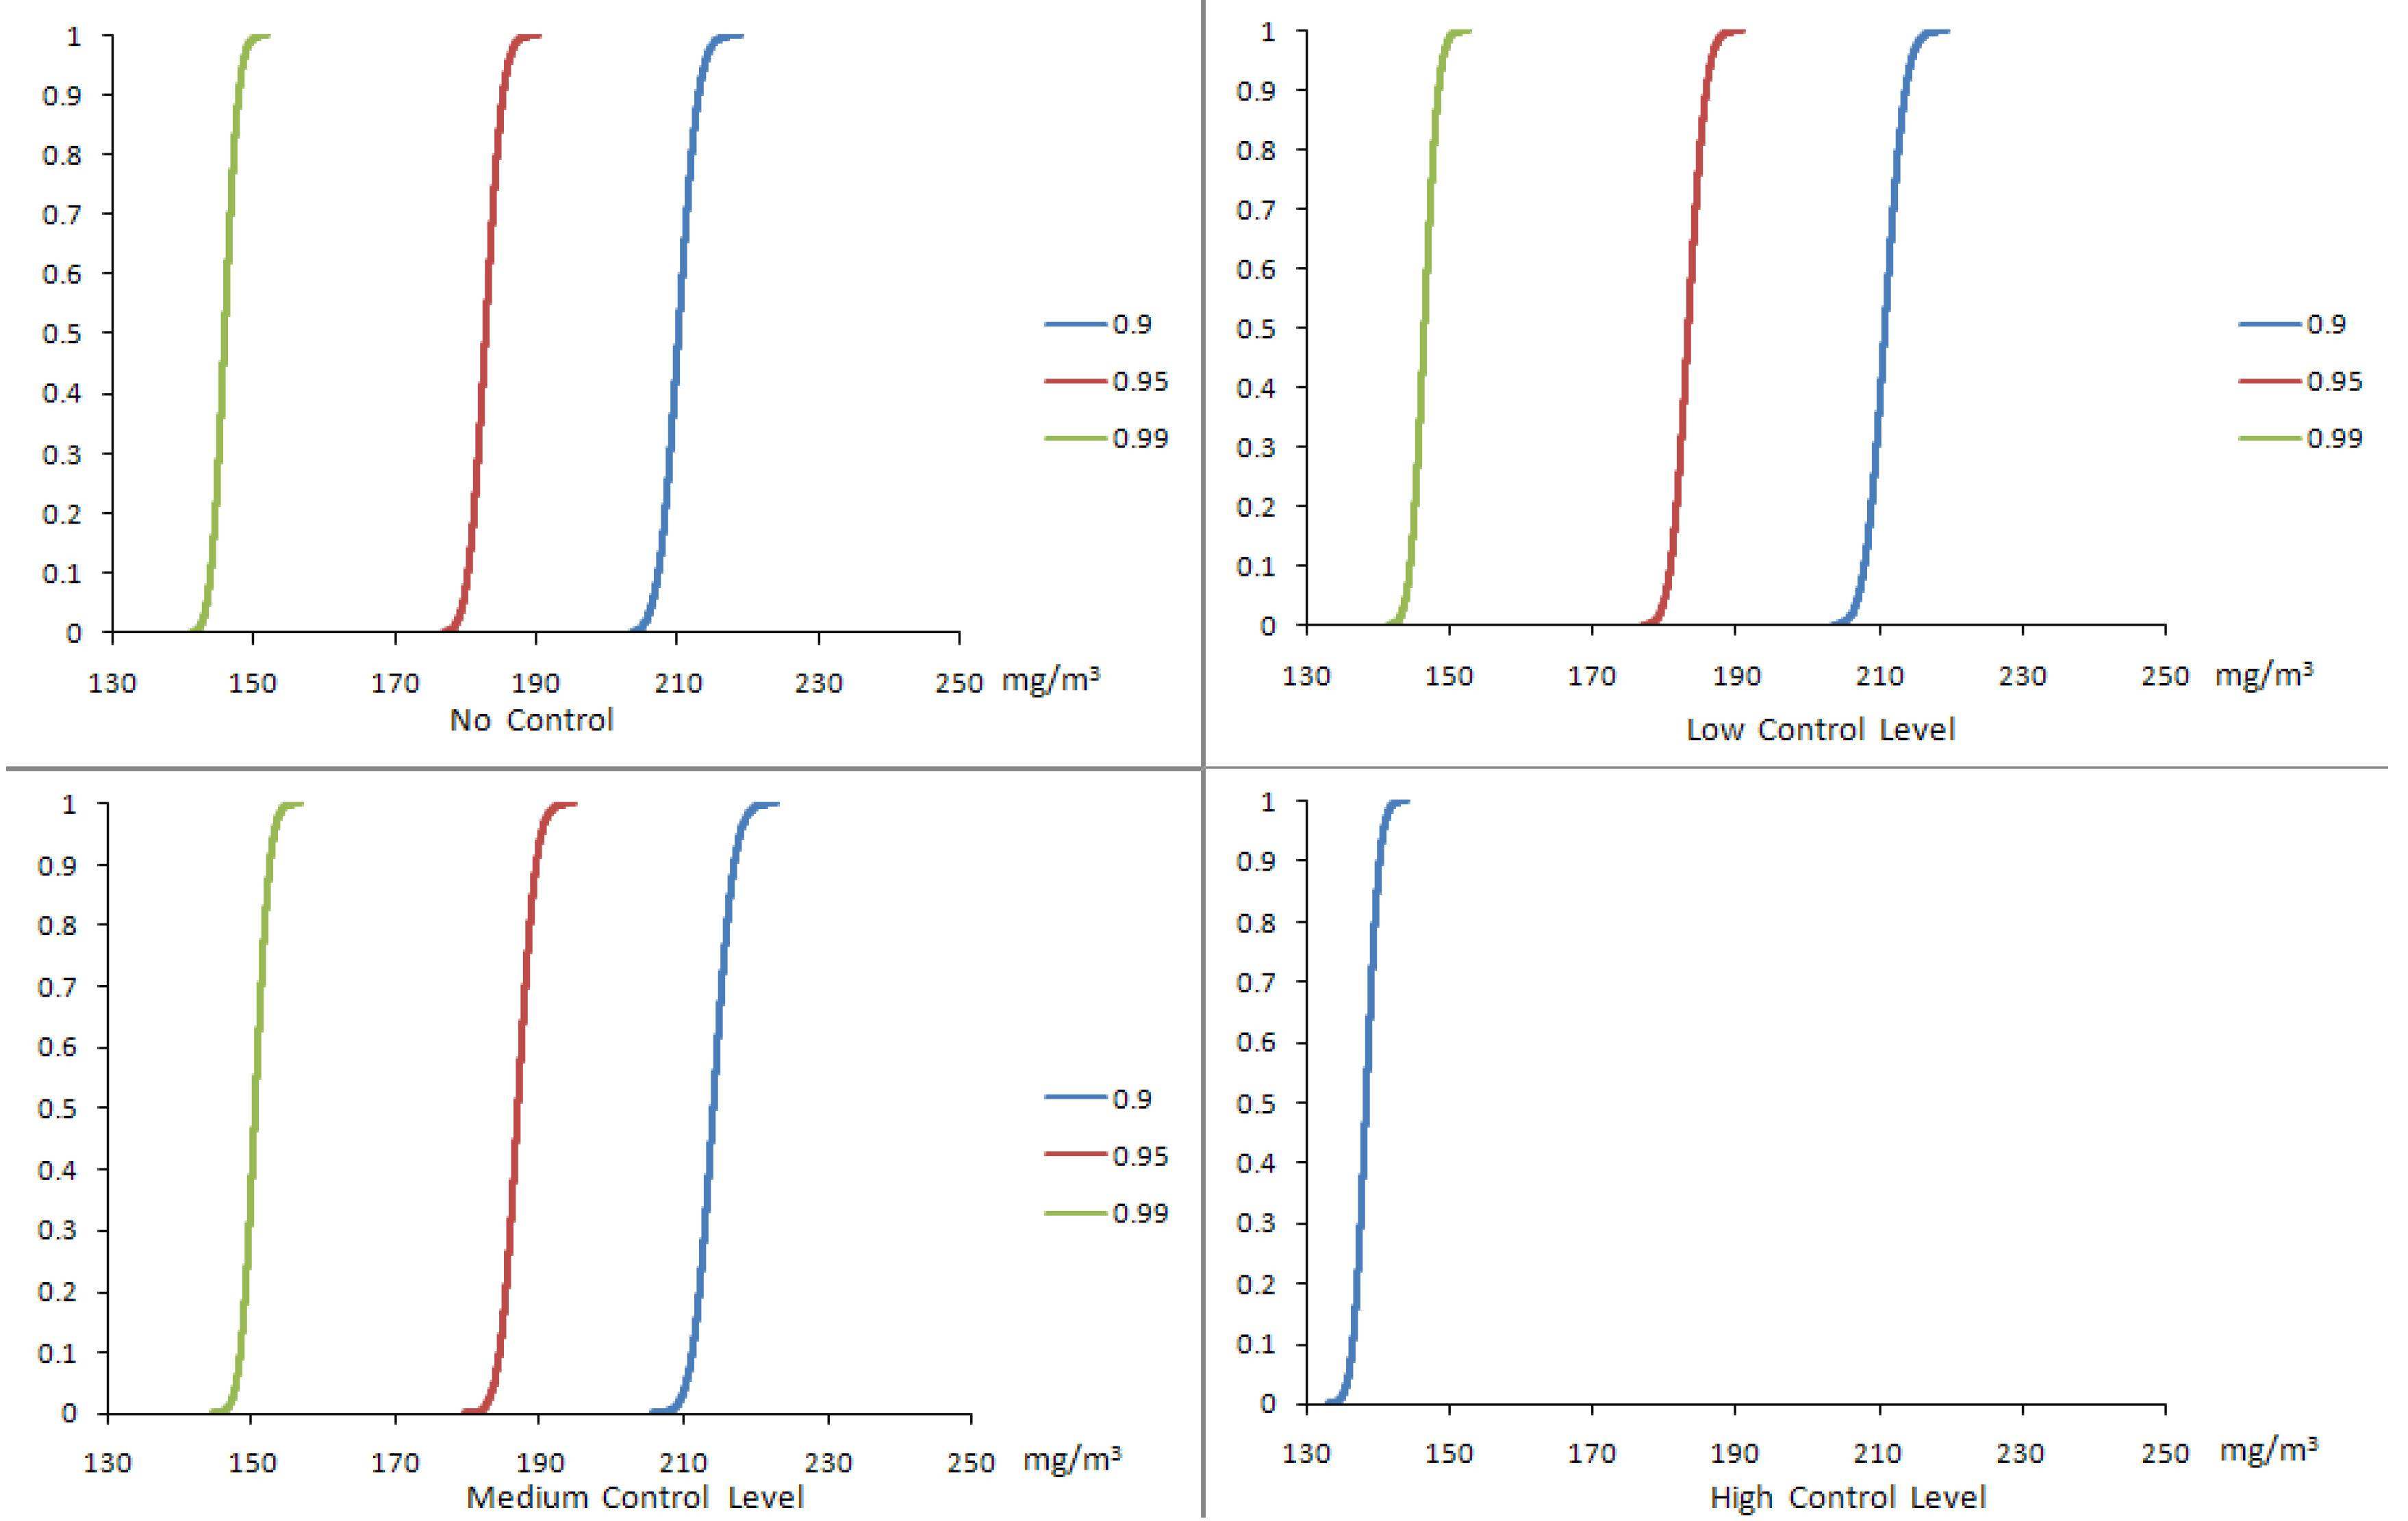
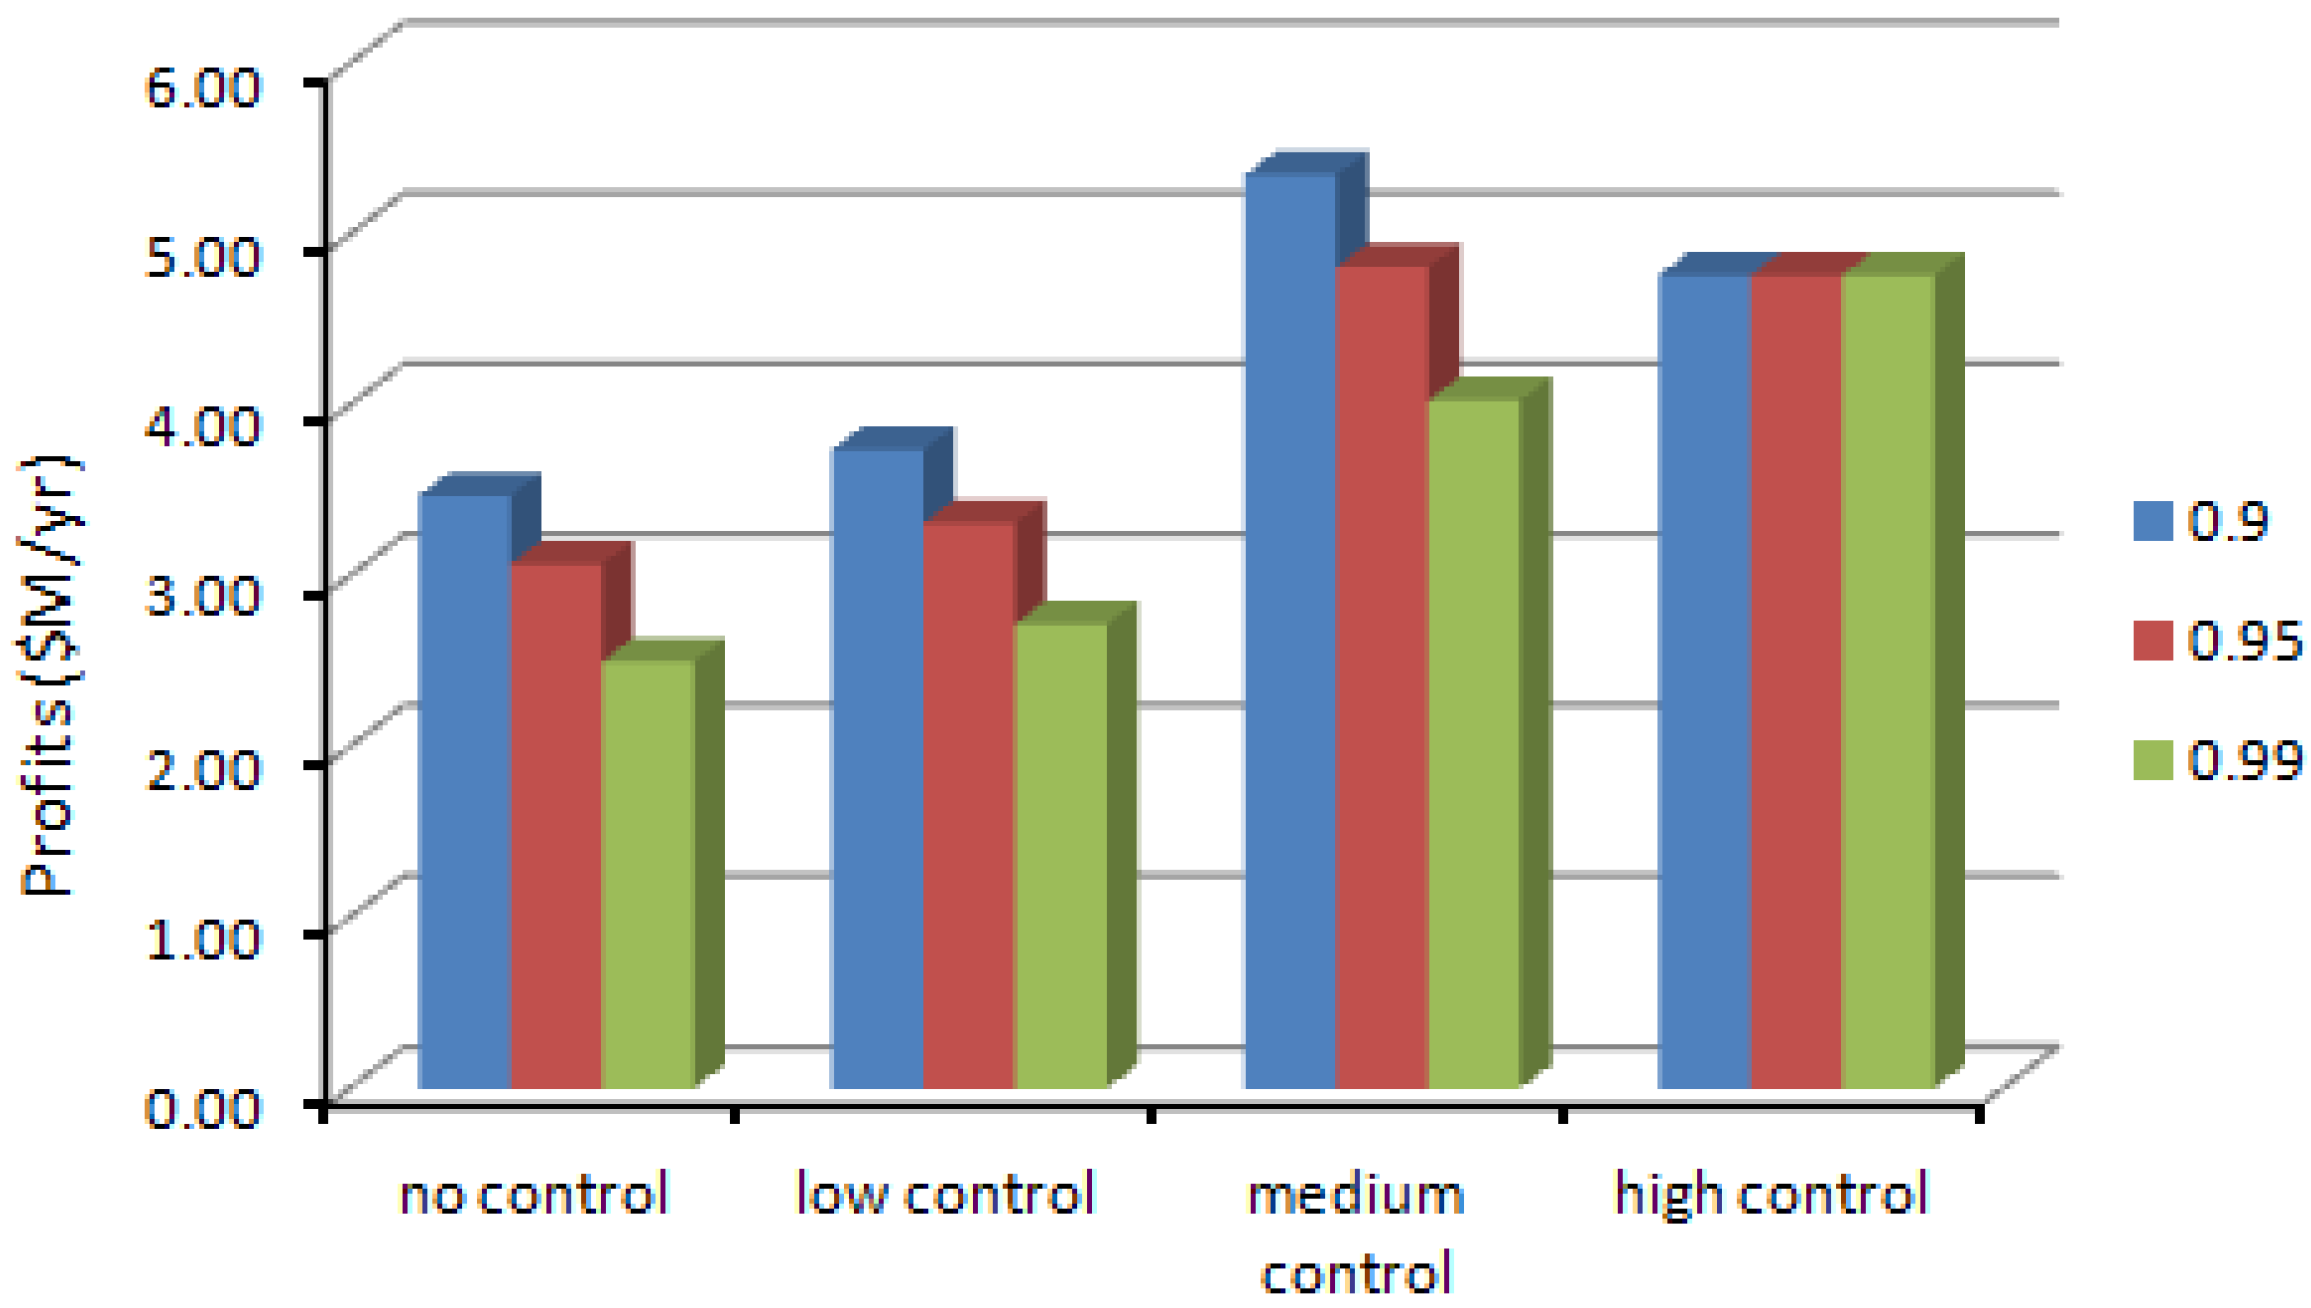
| Confidence Level | Control Level | Production Volume (g/yr) | Production Cost ($/g) | Profit ($M/yr) | SWNT Exposure (μg/m3) | CO Exposure (μg/m3) | Fe Exposure (μg/m3) |
|---|---|---|---|---|---|---|---|
| 0.9 | No | 6,263 | 446.59 | 3.47 | 0.00–12.42 | 201.85–218.72 | 0.00–1.60 |
| Low | 6,952 | 451.87 | 3.74 | 0.00–12.41 | 202.52–219.44 | 0.00–1.60 | |
| Medium | 12,504 | 494.51 | 5.35 | 0.00–12.40 | 205.74–222.93 | 0.00–1.60 | |
| High | 20,000 | 552.08 | 4.76 | 0.00–7.90 | 132.74–143.84 | 0.00–1.02 | |
| 0.95 | No | 5,483 | 440.60 | 3.07 | 0.00–10.88 | 202.52–219.44 | 0.00–1.40 |
| Low | 6,080 | 445.18 | 3.31 | 0.00–10.85 | 176.13–190.85 | 0.00–1.40 | |
| Medium | 10,944 | 482.53 | 4.81 | 0.00–10.85 | 179.66–194.05 | 0.00–1.40 | |
| High | 20,000 | 552.08 | 4.76 | 0.00–7.90 | 132.74–143.84 | 0.00–1.40 | |
| 0.99 | No | 4,428 | 432.49 | 2.51 | 0.00–8.78 | 140.13–151.84 | 0.00–1.13 |
| Low | 4,910 | 436.19 | 2.72 | 0.00–8.76 | 140.70–152.45 | 0.00–1.13 | |
| Medium | 8,856 | 466.49 | 4.03 | 0.00–8.78 | 144.59–156.67 | 0.00–1.13 | |
| High | 20,000 | 552.08 | 4.76 | 0.00–7.90 | 132.74–143.84 | 0.00–1.13 |
5. Discussion
5.1. Comparison between the Modeling Results and Literature Data
5.2. Comparison of the NLP and CCNLP Models
5.3. Uncertainty and Sensitivity
6. Conclusions
Acknowledgements
References
- U.S. Environmental Protection Agency (EPA), Nanotechnology White Paper; U.S. Environmental Protection Agency Report EPA 100/B-07/001; EPA: Washington, DC, USA, 2007.
- Bhatt, I.; Tripathi, B.N. Interaction of engineered nanoparticles with various components of the environment and possible strategies for their risk assessment. Chemosphere 2011, 82, 308–317. [Google Scholar] [CrossRef]
- Biskos, G.; Schmidt-Ott, A. Airborne engineered nanoparticles: Potential risks and monitoring challenges for assessing their impacts on children. Paediatr. Respir. Rev. 2012, 13, 79–83. [Google Scholar] [CrossRef]
- Derk, B. Exposure to manufactured nanoparticles in different workplaces. Toxicology 2010, 269, 120–127. [Google Scholar] [CrossRef]
- Maynard, A.D.; Kuempel, E.D. Airborne nanostructured particles and occupational health. J. Nanopart. Res. 2005, 7, 587–614. [Google Scholar] [CrossRef]
- Aschberger, K.C.; Micheletti, B.; Sokull-Klüttgen, B.; Christensen, F.M. Analysis of currently available data for characterising the risk of engineered nanomaterials to the environment and human health—Lessons learned from four case studies. Environ. Int. 2011, 37, 1143–1156. [Google Scholar] [CrossRef]
- Paur, H.R.; Cassee, F.R.; Teeguarden, J.; Fissan, H.; Diabate, S.; Aufderheide, M.; Kreyling, W.G.; Hänninen, O.; Kasper, G.; Riediker, M.; et al. In vitro cell exposure studies for the assessment of nanoparticle toxicity in the lung—A dialog between aerosol science and biology. J. Aerosol. Sci. 2011, 42, 668–692. [Google Scholar] [CrossRef]
- Kumar, A.; Pandey, A.K.; Singh, S.S.; Shanker, R.; Dhawan, A. Engineered ZnO and TiO2 nanoparticles induce oxidative stress and DNA damage leading to reduced viability of Escherichia coli. Free Radical Bio. Med. 2011, 51, 1872–1881. [Google Scholar] [CrossRef]
- Hackenberg, S.; Scherzed, A.; Technau, A.; Kessler, M.; Froelich, K.; Ginzkey, C.; Koehler, C.; Burghartz, M.; Hagen, R.; Kleinsasser, N. Cytotoxic, genotoxic and pro-inflammatory effects of zinc oxide nanoparticles in human nasal mucosa cells in vitro. Toxicol. In Vitro 2011, 25, 657–663. [Google Scholar] [CrossRef]
- Roller, M. Carcinogenicity of inhaled nanoparticles. Inhal. Toxicol. 2009, 21, 144–157. [Google Scholar] [CrossRef]
- Wilson, M.R.; Foucaud, L.; Barlow, P.G.; Hutchison, G.R.; Sales, J.; Simpson, R.J.; Stone, V. Nanoparticle interactions with zinc and iron: Implications for toxicology and inflammation. Toxicol. Appl. Pharmacol. 2007, 225, 80–89. [Google Scholar] [CrossRef]
- Shvedova, A.A.; Pietroiusti, A.; Fadeel, B.; Kagan, V.E. Mechanisms of carbon nanotube-induced toxicity: Focus on oxidative stress. Toxicol. Appl. Pharmacol. 2012, 261, 121–133. [Google Scholar] [CrossRef] [Green Version]
- Zhu, X.; Chang, Y.; Chen, Y. Toxicity and bioaccumulation of TiO2 nanoparticle aggregates in daphnia magna. Chemosphere 2010, 78, 209–215. [Google Scholar] [CrossRef]
- Lapresta-Fernández, A.; Fernández, A.; Blasco, J. Nanoecotoxicity effects of engineered silver and gold nanoparticles in aquatic organisms. Trac. Trends Anal. Chem. 2012, 32, 40–59. [Google Scholar] [CrossRef]
- Ok, Z.D.; Benneyan, J.C.; Isaacs, J.A. Risk analysis modeling of production costs and occupational health exposure of single-wall carbon nanotube manufacturing. J. Ind. Ecol. 2008, 12, 411–434. [Google Scholar] [CrossRef]
- Kalampoukas, G.; Dervakos, G.A. Process optimization for clean manufacturing: Supercritical fluid extraction for B-carotene production. Comput. Chem. Eng. 1996, 20, S1383–S1388. [Google Scholar] [CrossRef]
- Zuperl, U.; Cus, F.; Mursec, B.; Ploj, T. A hybrid analytical-neural network approach to the determination of optimal cutting conditions. J. Mater. Process. Tech. 2004, 157–158, 82–90. [Google Scholar] [CrossRef]
- Slotine, J.J.; Li, W. Applied Nonlinear Control; Prentice-Hall: Englewood Cliffs, NJ, USA, 1991; Chapter 1; p. 2. [Google Scholar]
- Chen, T.; Wang, Y. A fuzzy set approach for evaluating and enhancing the mid-term competitiveness of a semiconductor factory. Fuzzy Set. Syst. 2009, 160, 569–585. [Google Scholar] [CrossRef]
- Liu, C.; Fu, J.; Xu, Q. Simultaneous mixed-integer dynamic optimization for environmentally benign electroplating. Comput. Chem. Eng. 2011, 35, 2411–2425. [Google Scholar] [CrossRef]
- Kravanja, S.; Šilih, S. Optimization based comparison between composite I beams and composite trusses. J. Constr. Steel. Res. 2003, 59, 609–625. [Google Scholar] [CrossRef]
- Luhandjula, M.K. Fuzzy stochastic linear programming: Survey and future research directions. Eur. J. Oper. Res. 2006, 174, 1353–1367. [Google Scholar] [CrossRef]
- Liu, B. Uncertain Programming; John Wiley & Sons, Inc.: New York, NY, USA, 1999. [Google Scholar]
- Maynard, A.D.; Baron, P.A.; Foley, M.; Shvedova, A.A.; Kisin, E.R.; Castranova, V. Exposure to carbon nanotube material: Aerosol release during the handling of unrefined single walled carbon nanotube material. J. Toxicol. Environ. Health 2004, 67, 87–107. [Google Scholar] [CrossRef]
- Van Broekhuizen, P.; van Broekhuizen, F.; Cornelissen, R.; Reijnders, L. Workplace exposure to nanoparticles and the application of provisional nanoreference values in times of uncertain risks. J. Nanopart. Res. 2012, 14, 770. [Google Scholar] [CrossRef]
- Xie, Y.L.; Li, Y.P.; Huang, G.H.; Li, Y.F.; Chen, L.R. An inexact chance-constrained programming model for water quality management in Ninhai New Area of Tianjin, China. Sci. Total Environ. 2011, 409, 1757–1773. [Google Scholar] [CrossRef]
- Huang, Y.L.; Huang, G.H.; Liu, D.F.; Zhu, H.; Sun, W. Simulation-based inexact chance-constrained nonlinear programming for eutrophication management in the xiangxi bay of three gorges reservoir. J. Environ. Manag. 2012, 108, 54–65. [Google Scholar]
- Sengul, H.; Theis, T.L.; Fhosh, S. Toward sustainable nanoproducts: An overview of nanomanufacturing methods. J. Ind. Ecol. 2008, 12, 329–359. [Google Scholar] [CrossRef]
- Mintmire, J.W.; Dunlap, B.I.; White, C.T. Are fullerene tubules metallic? Phys. Rev. Lett. 1992, 68, 631–634. [Google Scholar] [CrossRef]
- Kociak, M.; Kasumov, A.; Gueron, S.; Reulet, B.; Bouchiat, H. Intrinsic Superconductivity in Ropes of Carbon Nanotubes. In AIP Conference Proceedings, Tirol, Austria, 2–9 March 2002; Volume 633, pp. 237–241.
- Donaldson, K.; Murphy, F.A.; Duffin, R.; Poland, C.A. Asbestos, carbon nanotubes and the pleural mesothelium: A review of the hypothesis regarding the role of long fibre retention in the parietal pleura, inflammation and mesothelioma. Part Fibre Toxicol. 2010, 7. [Google Scholar] [CrossRef]
- Nikolaev, P.; Michael, J.; Bronikowski, R.; Kelley, B.; Frank, R.; Daniel, T.C.; Smith, K.A.; Smalley, R.E. Gas-phase catalytic growth of single-walled carbon nanotubes from carbon monoxide. Chem. Phys. Lett. 1999, 313, 91–97. [Google Scholar] [CrossRef]
- Healy, M.L. Environmental and Economic Comparison of Single-wall Carbon Nanotube Production Alternatives. M.Sc. Thesis, Northeastern University, Boston, MA, USA, 2006. [Google Scholar]
- Healy, M.L.; Dahlben, L.J.; Isaacs, J.A. Environmental assessment of single-walled carbon nanotube processes. J. Ind. Ecol. 2008, 12, 376–393. [Google Scholar] [CrossRef]
- Ouellette, J. Building the nanofuture with carbon tubes. Ind. Phys. 2003, 8, 18–21. [Google Scholar]
- Isaacs, J.A.; Tanwani, A.; Healy, M.L.; Dahlben, L.J. Economic assessment of single-walled carbon nanotube processes. J. Nanopart. Res. 2010, 12, 551–562. [Google Scholar] [CrossRef]
- Naga, B.; Parikhb, J.K. Carbon emission coefficient of power consumption in India: Baseline determination from the demand side. Energ. Pol. 2005, 33, 777–786. [Google Scholar] [CrossRef]
- National Institute for Occupational Safety and Health (NIOSH), Safety and Health Topic: Control Banding. Available online: www.cdc.gov/niosh/topics/ctrlbanding (accessed on 17 January 2010).
- Institut für Arbeitsschutz der Deutschen Gesetzlichen Unfallversicherung (IFA). Criteria for Assessment of the Effectiveness of Protective Measures. Available online: http://www.dguv.de/ ifa/en/fac/nanopartikel/beurteilungsmassstaebe/index.jsp (accessed on 10 January 2012).
- Lai, H.K.; Kendall, M.; Ferrier, H.; Lindup, I.; Alm, S.; Hanninen, O.; Jantunen, M.; Mathys, P.; Colvile, R.; Ashmore, M.R.; et al. Personal exposures and microenvironment concentrations of PM2.5, VOC, NO2 and CO in Oxford, UK. Atmos. Environ. 2004, 38, 6399–6410. [Google Scholar] [CrossRef]
- Occupational Safety and Health Administration (OSHA), Occupational Safety and Health Administration. Available online: http://www.osha.gov/pls/oshaweb/owadisp.show_document?p_table=standards&p_id=9992 (accessed on 17 January 2010).
- Schulte, P.A.; Murashov, V.; Zumwalde, R.; Kuempel, E.D.; Geraci, C.L. Occupational exposure limits for nanomaterials: State of the art. J. Nanopart. Res. 2010, 12, 1971–1987. [Google Scholar] [CrossRef]
- National Institute for Occupational Safety and Health (NIOSH). Recommendations for Occupational Safety and Health: Compendium of Policy Documents and Statements; Department of Health and Human Services, Public Health Service, Centers for Disease Control, National Institute for Occupational Safety and Health: Cincinnati, OH, USA, 1992.
- National Institute for Occupational Safety and Health (NIOSH), Occupational Exposure to Carbon Nanotubes and Nanofibers. Available online: http://www.cdc.gov/niosh/docket/archive/pdfs/ NIOSH-161-A/0161-A-110110- DraftDocument.pdf (accessed on 21 February 2013).
- Kamp, D.W. Asbestos-induced lung diseases: An update. Trans. Res. 2009, 153, 143–152. [Google Scholar] [CrossRef]
- Zhao, L.; Chen, Z.; Lee, K. Dynamically coupled 3D pollutant dispersion model for assessing produced water discharges in the Canadian offshore area. Environ. Sci. Technol. 2013, 47, 1434–1442. [Google Scholar]
© 2013 by the authors; licensee MDPI, Basel, Switzerland. This article is an open access article distributed under the terms and conditions of the Creative Commons Attribution license (http://creativecommons.org/licenses/by/3.0/).
Share and Cite
Chen, Z.; Yuan, Y.; Zhang, S.-S.; Chen, Y.; Yang, F.-L. Management of Occupational Exposure to Engineered Nanoparticles Through a Chance-Constrained Nonlinear Programming Approach. Int. J. Environ. Res. Public Health 2013, 10, 1231-1249. https://doi.org/10.3390/ijerph10041231
Chen Z, Yuan Y, Zhang S-S, Chen Y, Yang F-L. Management of Occupational Exposure to Engineered Nanoparticles Through a Chance-Constrained Nonlinear Programming Approach. International Journal of Environmental Research and Public Health. 2013; 10(4):1231-1249. https://doi.org/10.3390/ijerph10041231
Chicago/Turabian StyleChen, Zhi, Yuan Yuan, Shu-Shen Zhang, Yu Chen, and Feng-Lin Yang. 2013. "Management of Occupational Exposure to Engineered Nanoparticles Through a Chance-Constrained Nonlinear Programming Approach" International Journal of Environmental Research and Public Health 10, no. 4: 1231-1249. https://doi.org/10.3390/ijerph10041231