Estimating Cyanobacteria Community Dynamics and its Relationship with Environmental Factors


Abstract
:1. Introduction
2. Experimental Section
2.1. Sample Collection and Determination of Water Quality
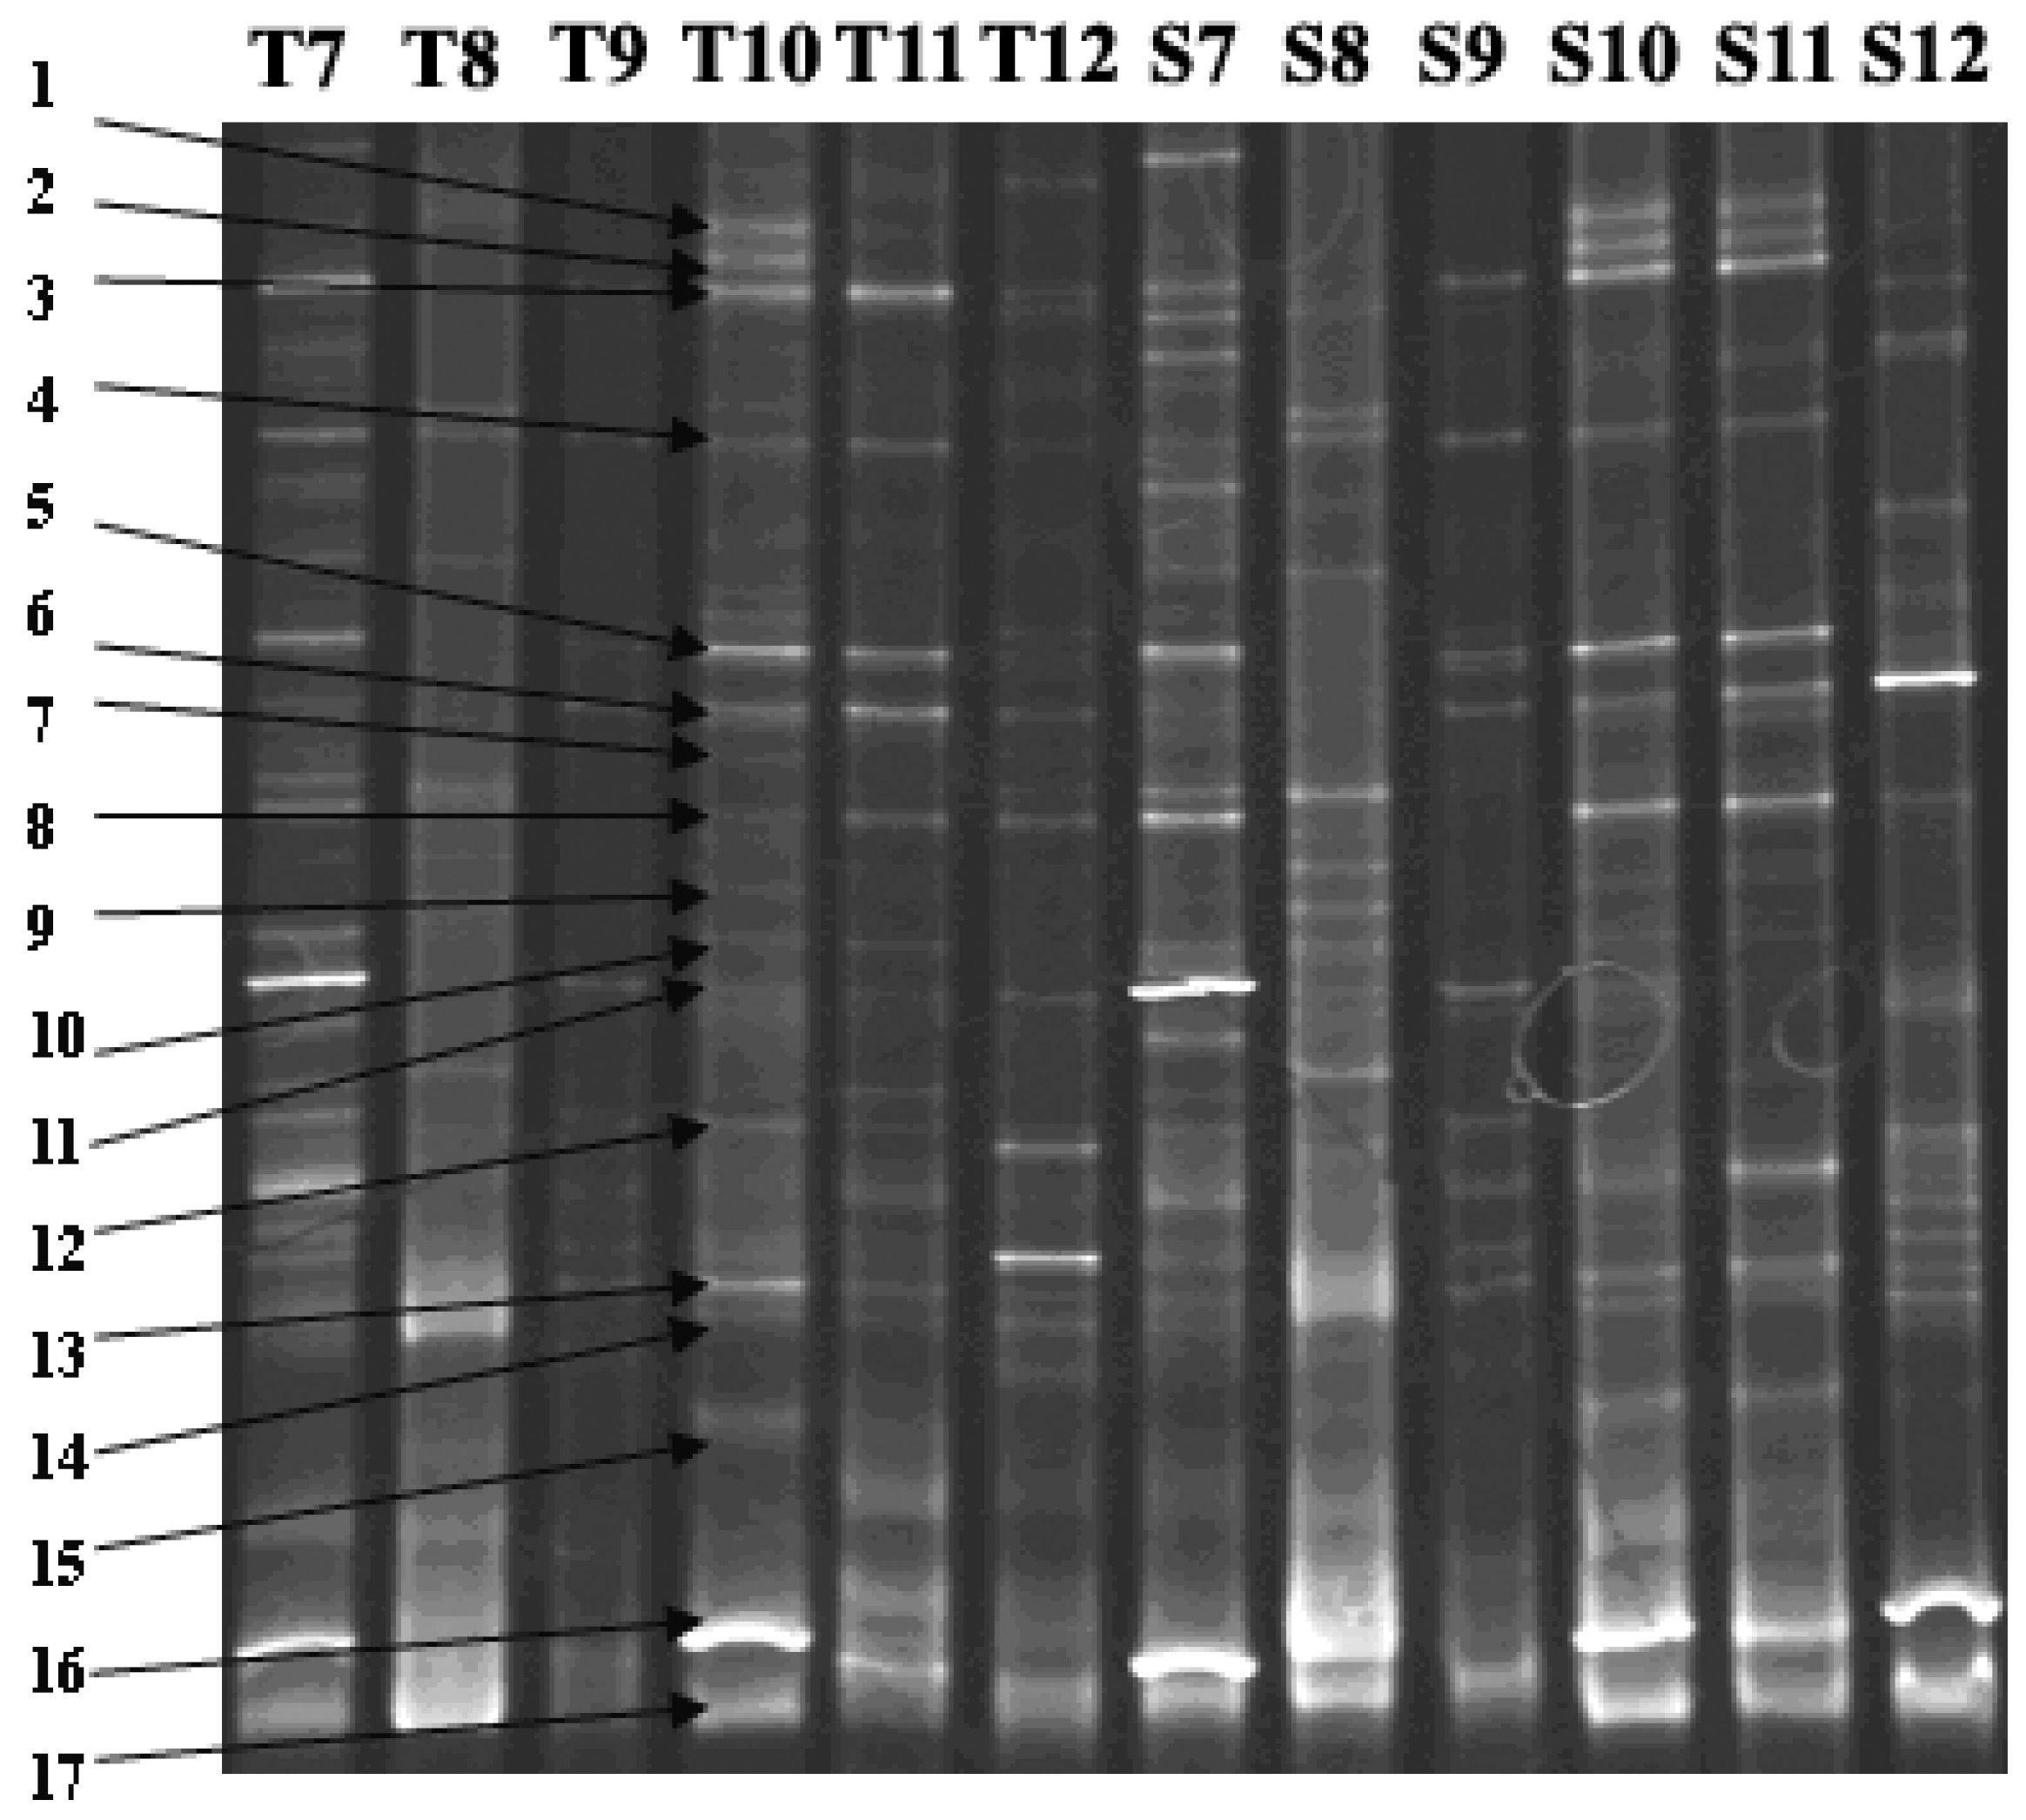
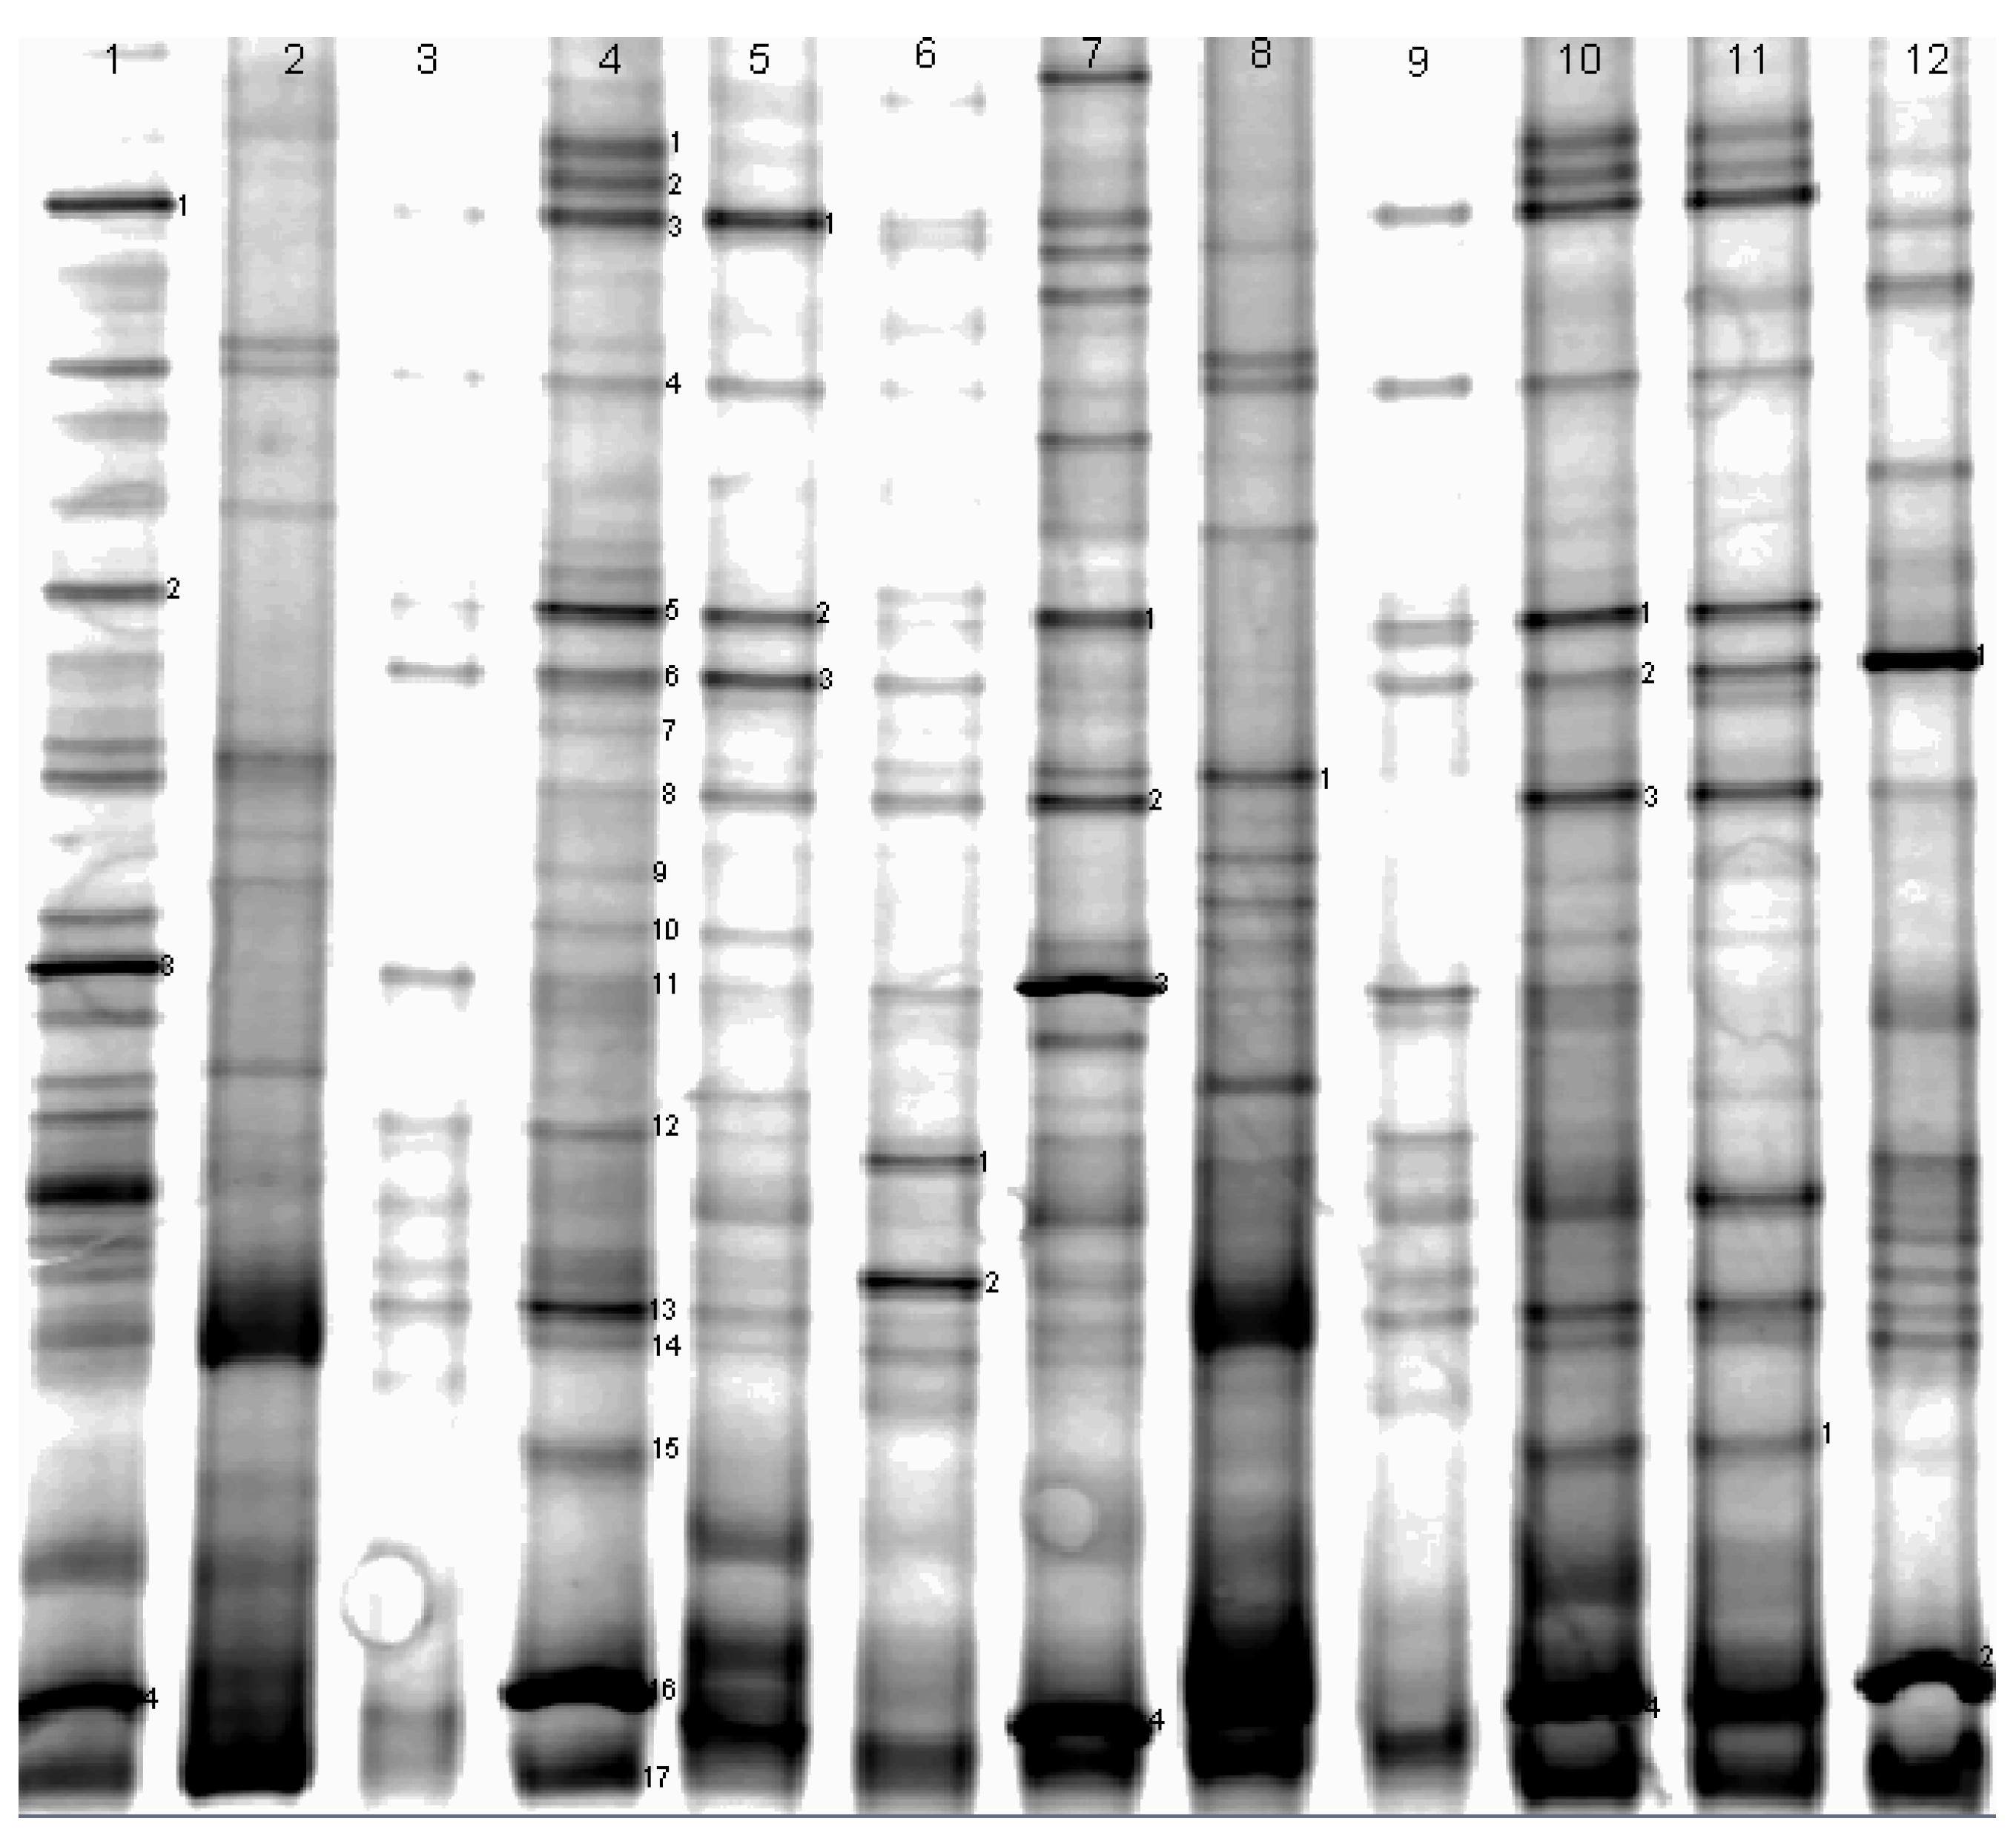
2.2. DNA Extraction and PCR-DGGE Analysis
3. Results and Discussion
3.1. Eutrophication Levels of Two Reservoirs

| Water Quality Parameters | Tiegang Reservoir | Shiyan Reservoir |
|---|---|---|
| Water temperature (°C) | 25.4 (5.56) | 24.9 (5.52) |
| DO (mg L-1) | 8.38 (1.26) | 8.16 (1.42) |
| Chlorophyll a (μg L-1) | 45.3 (31.2) | 53.0 (26.9) |
| CODMn (mg L-1) | 2.75 (0.745) | 3.04 (0.674) |
| Ammonia (mg L-1) | 0.147 (0.087) | 0.566 (0.359) |
| Total nitrogen (mg L-1) | 0.934 (0.242) | 1.508 (0.387) |
| Total phosphorus (mg L-1) | 0.034 (0.009) | 0.043 (0.004) |
| pH | 8.237 (0.566) | 7.871 (0.657) |
| Transparency (cm) | 64.8 (5.59) | 58.3 (6.68) |
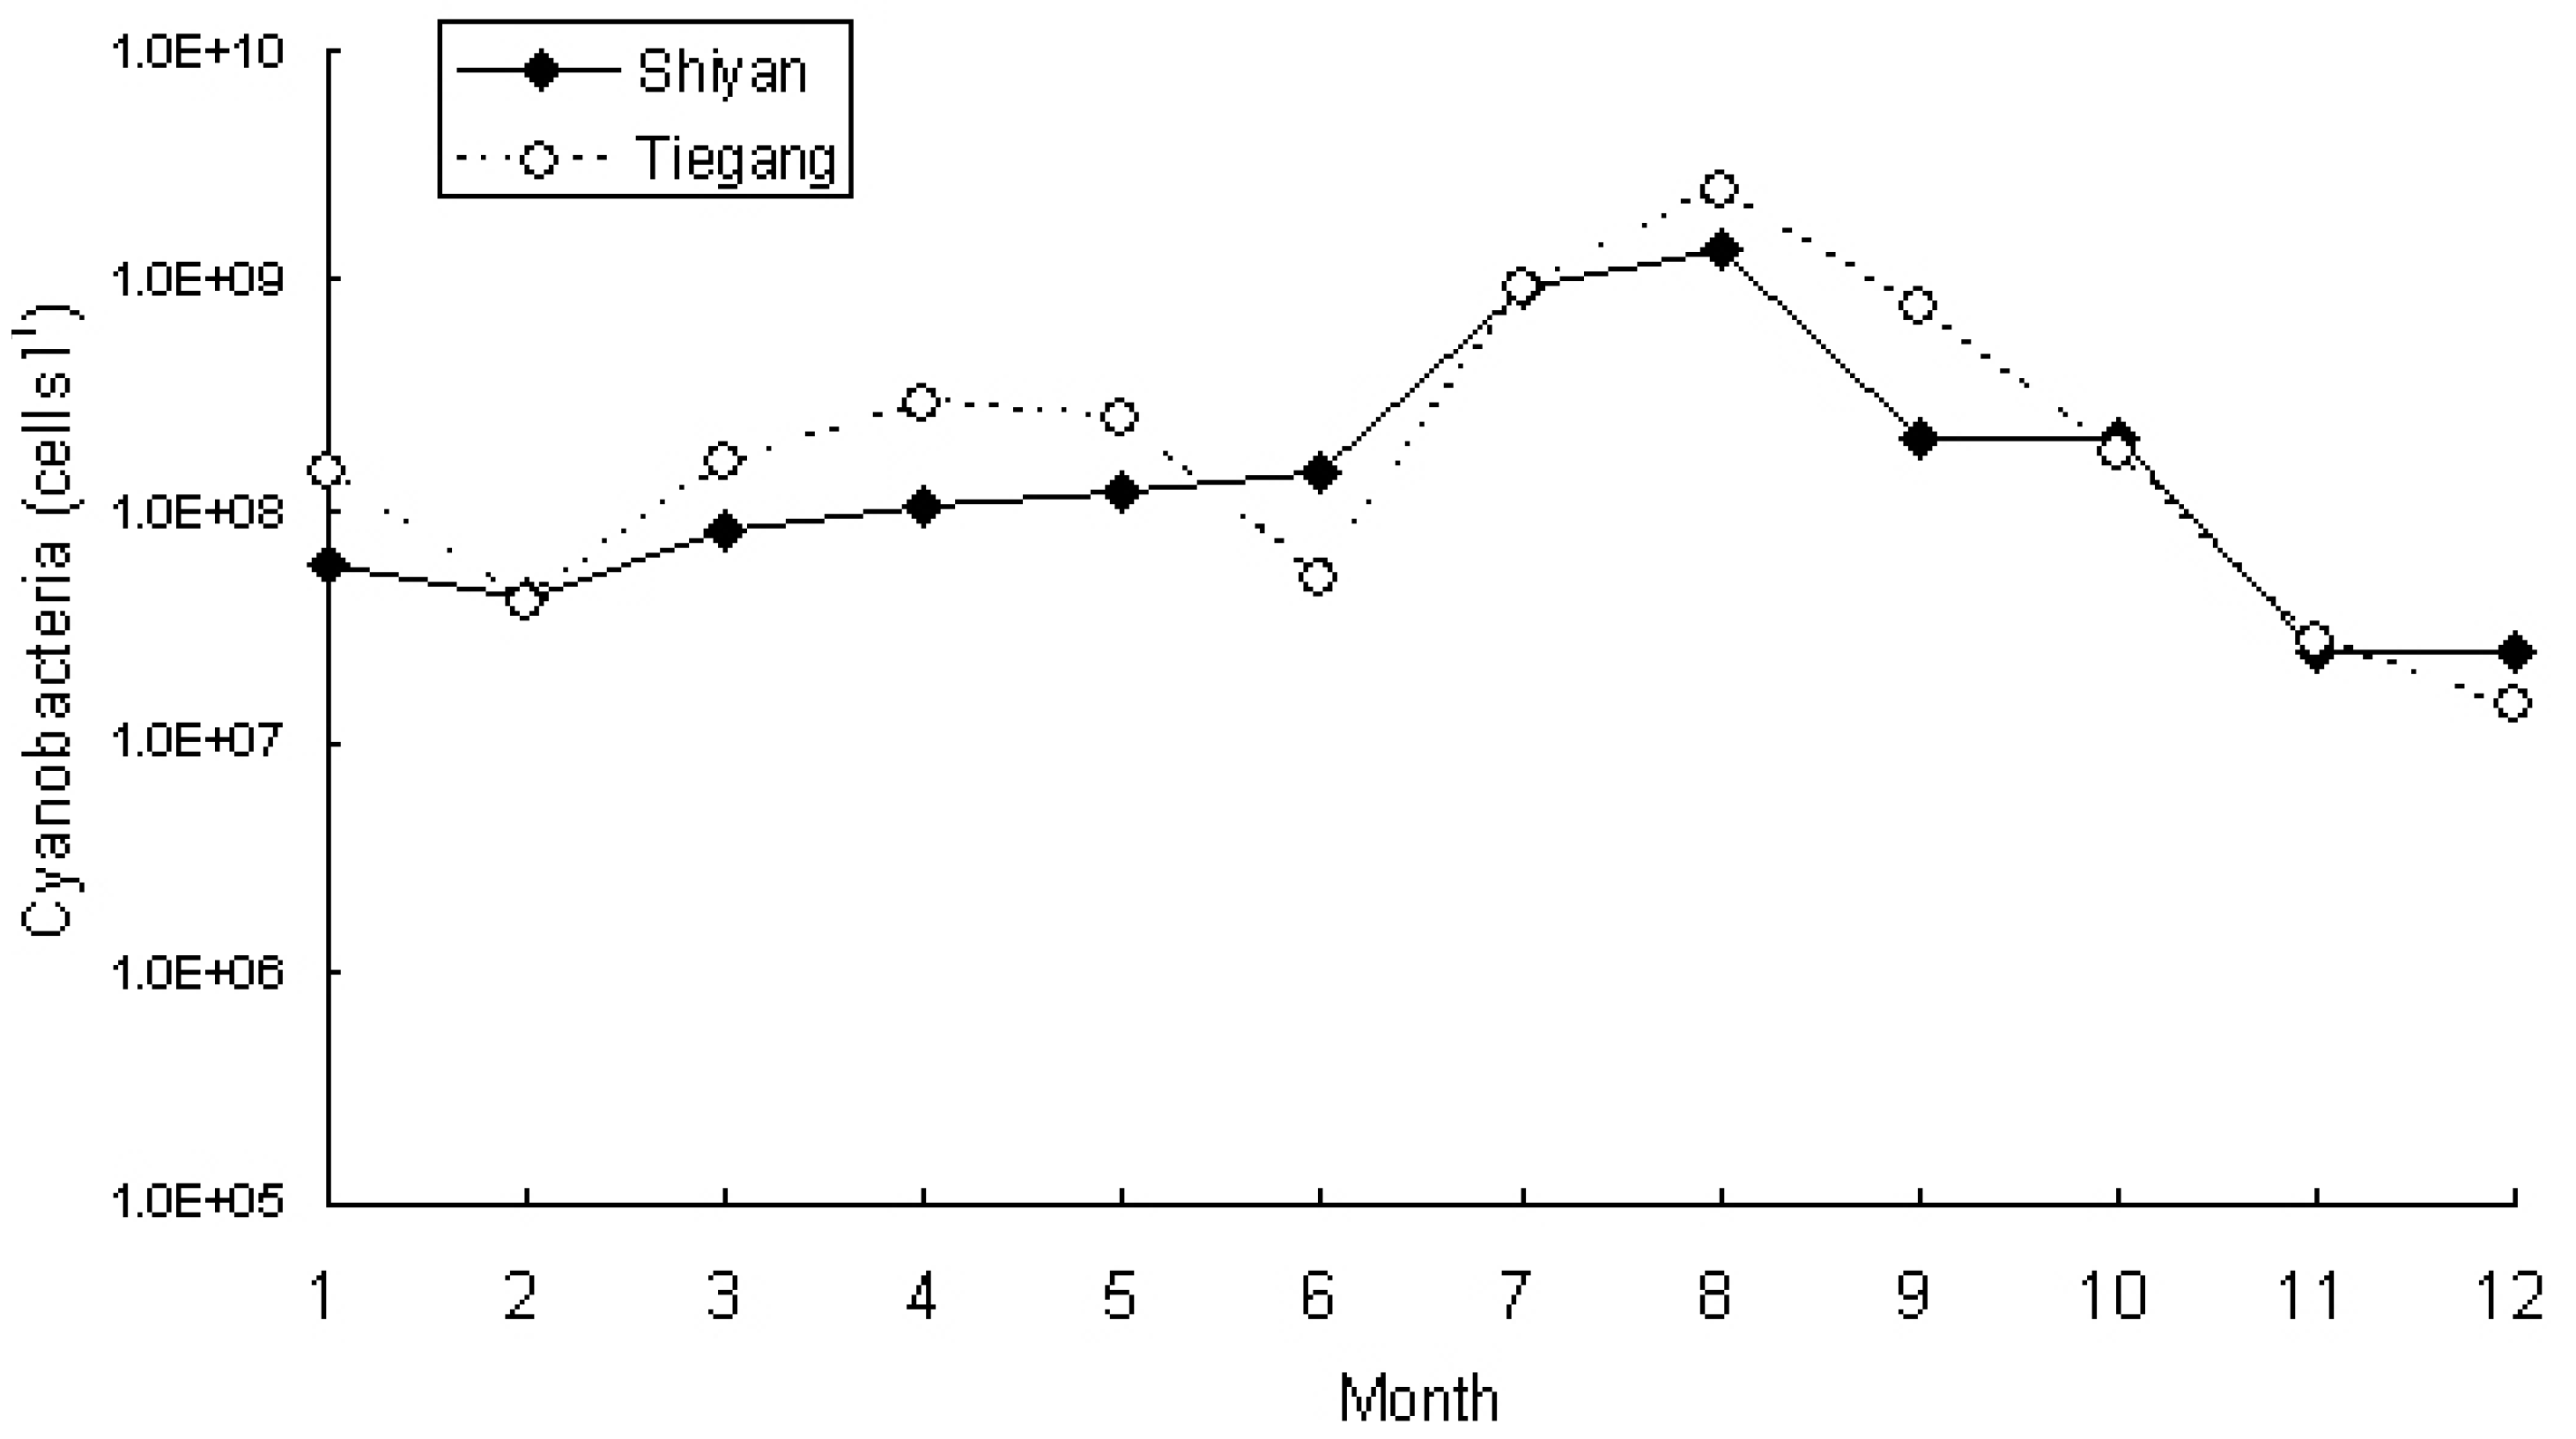
3.2. Phytoplankton and Cyanobacteria Community Structure and Dynamics in Two Reservoirs
| Cyanobacteria species | T7 | T8 | T9 | T10 | T11 | T12 | S7 | S8 | S9 | S10 | S11 | S12 |
|---|---|---|---|---|---|---|---|---|---|---|---|---|
| Phormidium tenue | 1.2 × 10⁸ | 4.8 × 10⁸ | 2.1 × 10⁸ | 5.4× 10⁷ | 1.2 × 10⁷ | 9.0 × 10⁶ | 3.0 × 10⁷ | 1.2 × 10⁸ | 2.7 × 10⁷ | 8.4 × 10⁷ | 6.0 × 10⁶ | 3.0 × 10⁶ |
| Raphidiopsis sinensia | 7.5 × 10⁷ | 5.3 × 10⁸ | 4.4 × 10⁸ | 8.3 × 10⁷ | N | 5.0 × 10⁶ | 2.0 × 10⁸ | 2.8 × 10⁸ | 1.1 × 10⁸ | 5.0 × 10⁷ | 2.5 × 10⁶ | 1.0 × 10⁷ |
| Microcystis aeruginosa | N | N | 3.8 × 10⁷ | N | N | 2.5 × 10⁷ | N | 2.0 × 10⁷ | 5.0 × 10⁶ | N | N | |
| Chroococcus giganteus | N | N | 2.5 × 10⁷ | N | N | N | N | N | 3.8 × 10⁷ | N | N | N |
| Chroococcus westii | N | 1.3 × 10⁸ | N | N | N | N | N | 6.5 × 10⁷ | N | N | N | 8.0 × 10⁶ |
| Chroococcus limneticus | N | N | N | 1.6 × 10⁷ | N | N | N | N | N | 3.8 × 10⁷ | N | N |
| Cylindrospermum sp. | 4.3 × 10⁸ | 1.3 × 10⁹ | N | N | N | N | 4.5 × 10⁸ | 6.8 × 10⁸ | N | N | N | N |
| Spirunila major | N | N | N | N | N | N | N | N | N | N | N | N |

| DGGE Band No. | Similarity Number | Closest Matching Organism | Base Pairs Compared | Similarity (%) |
|---|---|---|---|---|
| 1 | AF363949.1 | Microcoleus steenstrupii | 171 | 81 |
| 2 | EF583859.1 | Anabaena sp. | 139 | 97 |
| 3 | X75045.1 | Spirulina sp. | 130 | 92 |
| 4 | AM398947.1 | Phormidium sp. | 222 | 97 |
| 5 | EF583859.1 | Anabaena sp. | 150 | 98 |
| 6 | AJ605201.1 | Microcystis sp. | 244 | 98 |
| 7 | EF150986.1 | Microcystis sp. | 214 | 97 |
| 8 | EU183353.1 | Arthrospira sp. | 204 | 94 |
| 9 | DQ351315.1 | Synechococcus sp. UW140 | 209 | 91 |
| 10 | AM398973.1 | Phormidium sp | 211 | 96 |
| 11 | AM502073.1 | Cylindrospermopsis raciborskii | 346 | 98 |
| 12 | DQ786166.1 | Leptolyngbya sp. LLi18 | 145 | 94 |
| 13 | AJ582284.1 | Cylindrospermopsis raciborskii | 379 | 94 |
| 14 | BA000022.2 | Synechocystis sp | 158 | 89 |
| 15 | X75045.1 | Spirulina sp | 130 | 92 |
| 16 | AM398960.1 | Phormidium persicinum SAG 80.79 | 135 | 98 |
| 17 | DQ351315.1 | Synechococcus sp. UW140 16S | 209 | 91 |
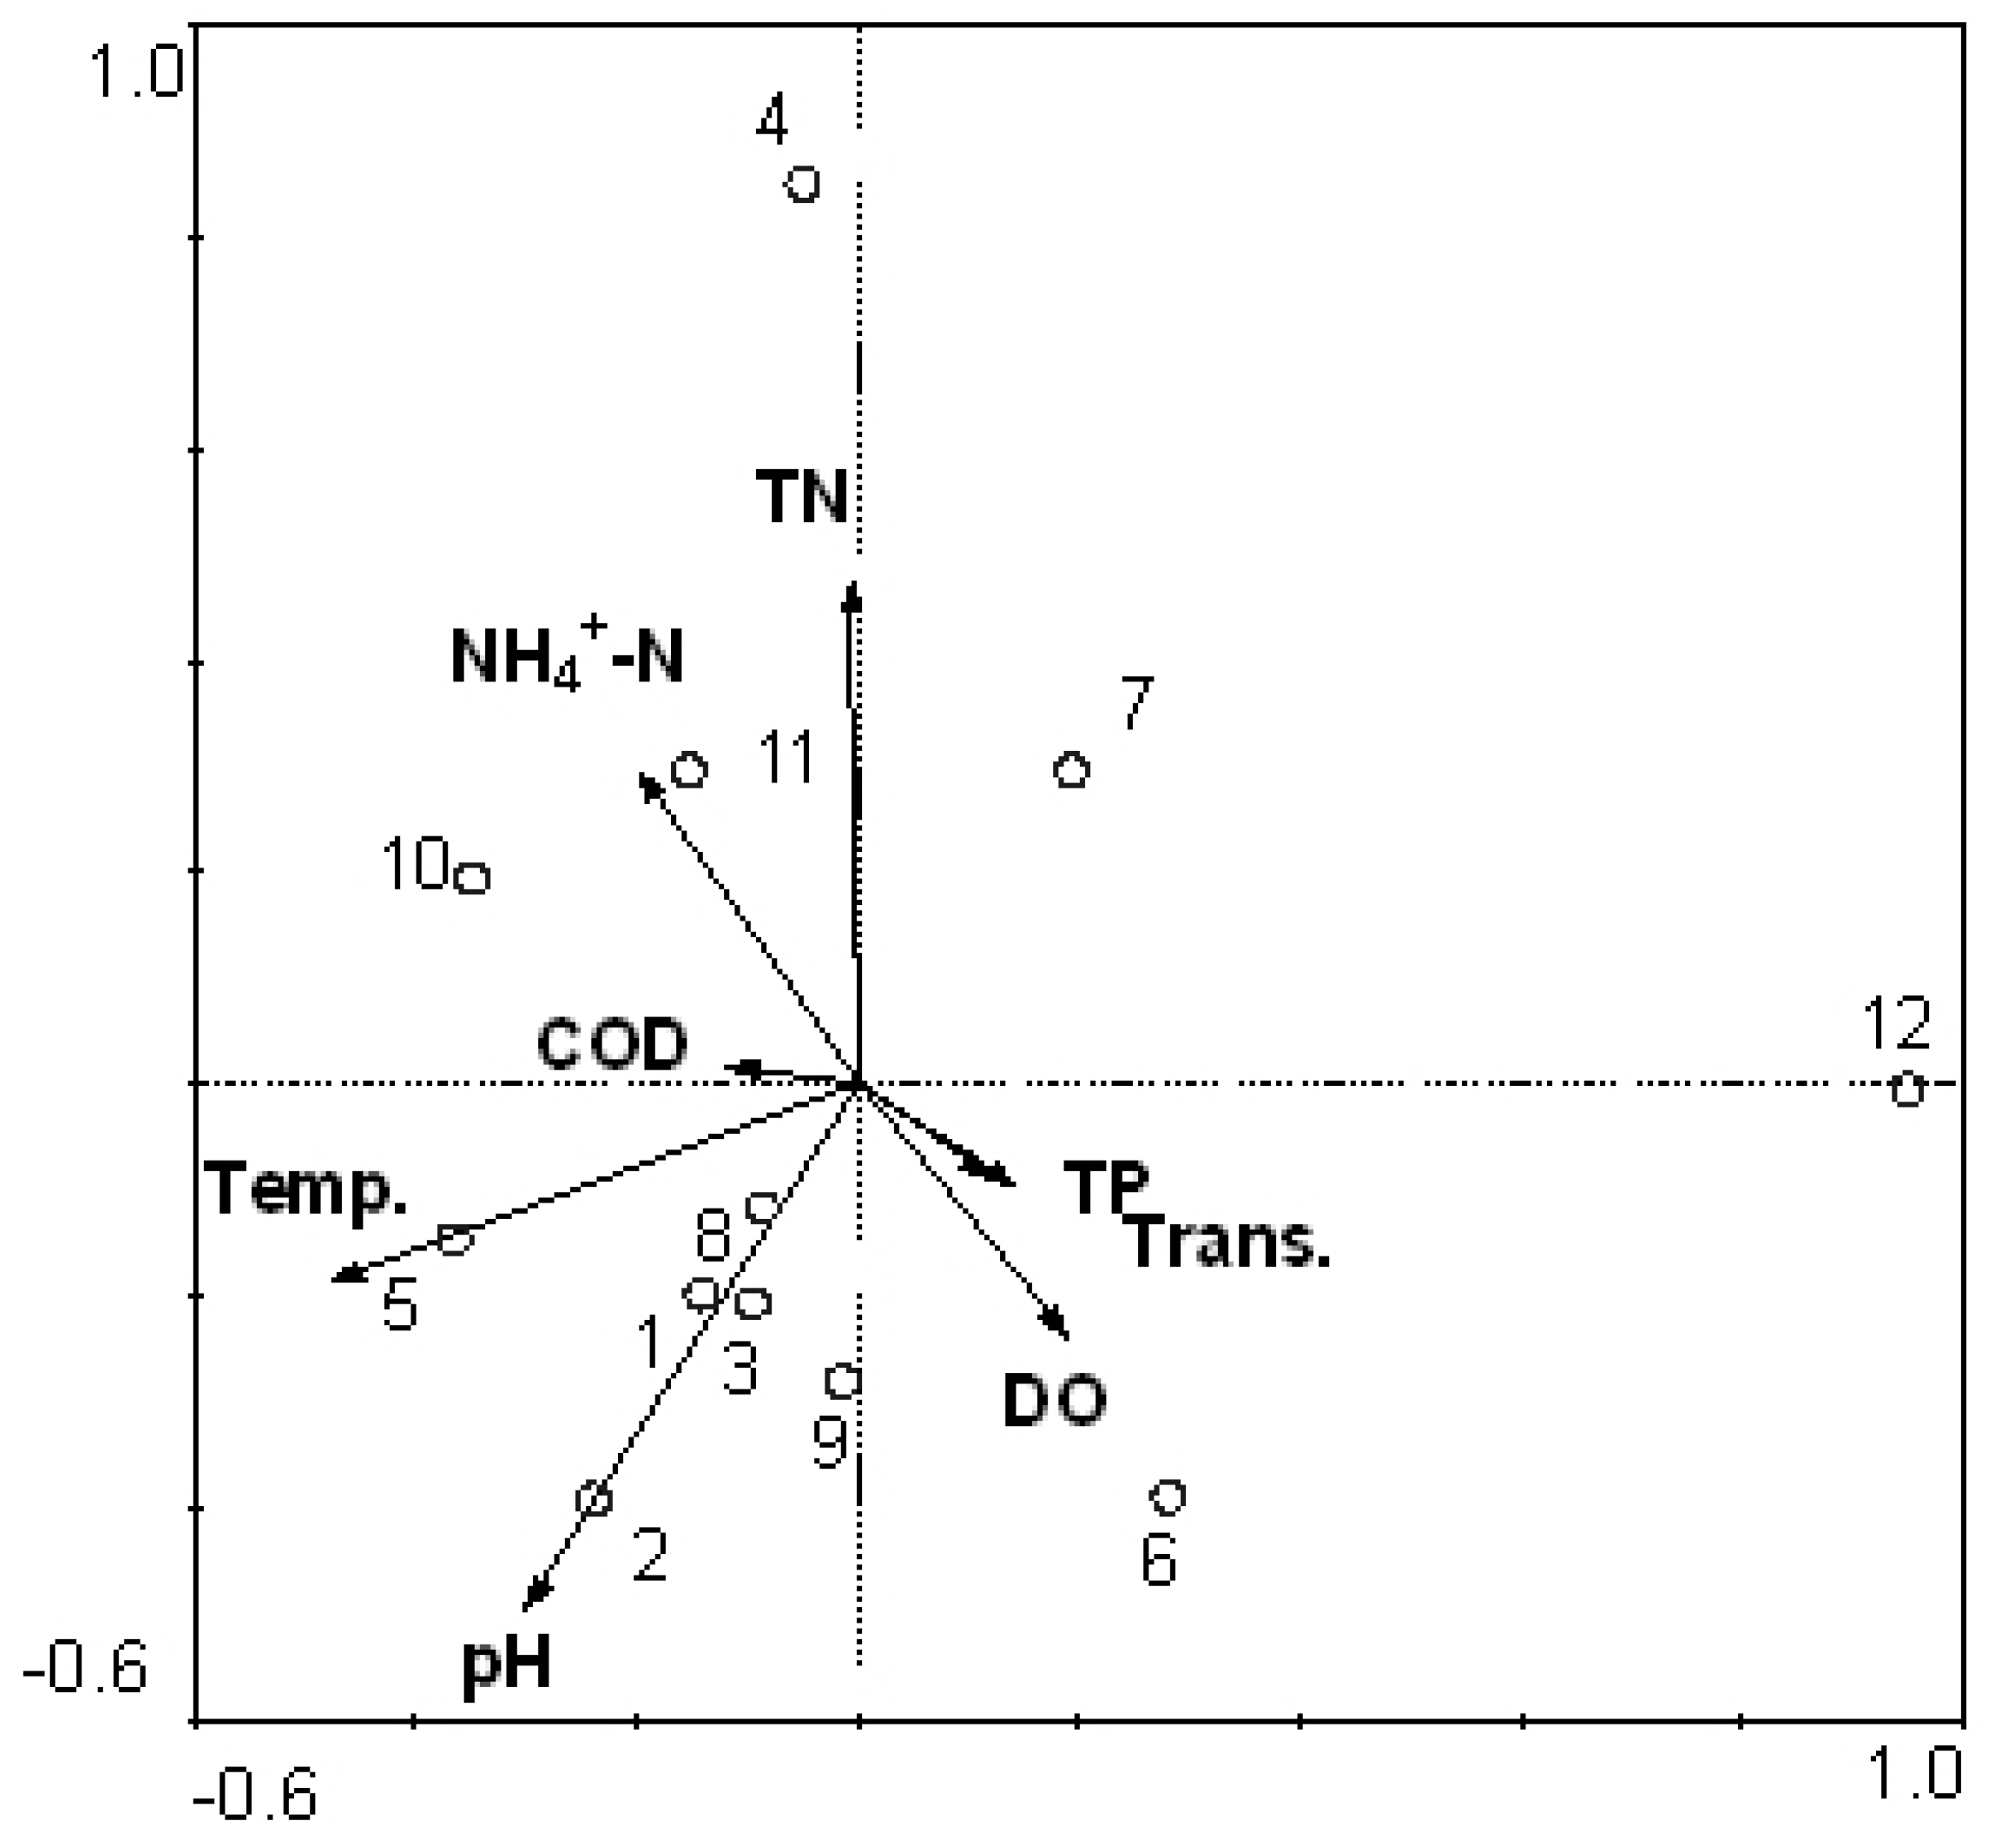
3.3. Relationship between Cyanobacteria Community Dynamics and Environment Factors


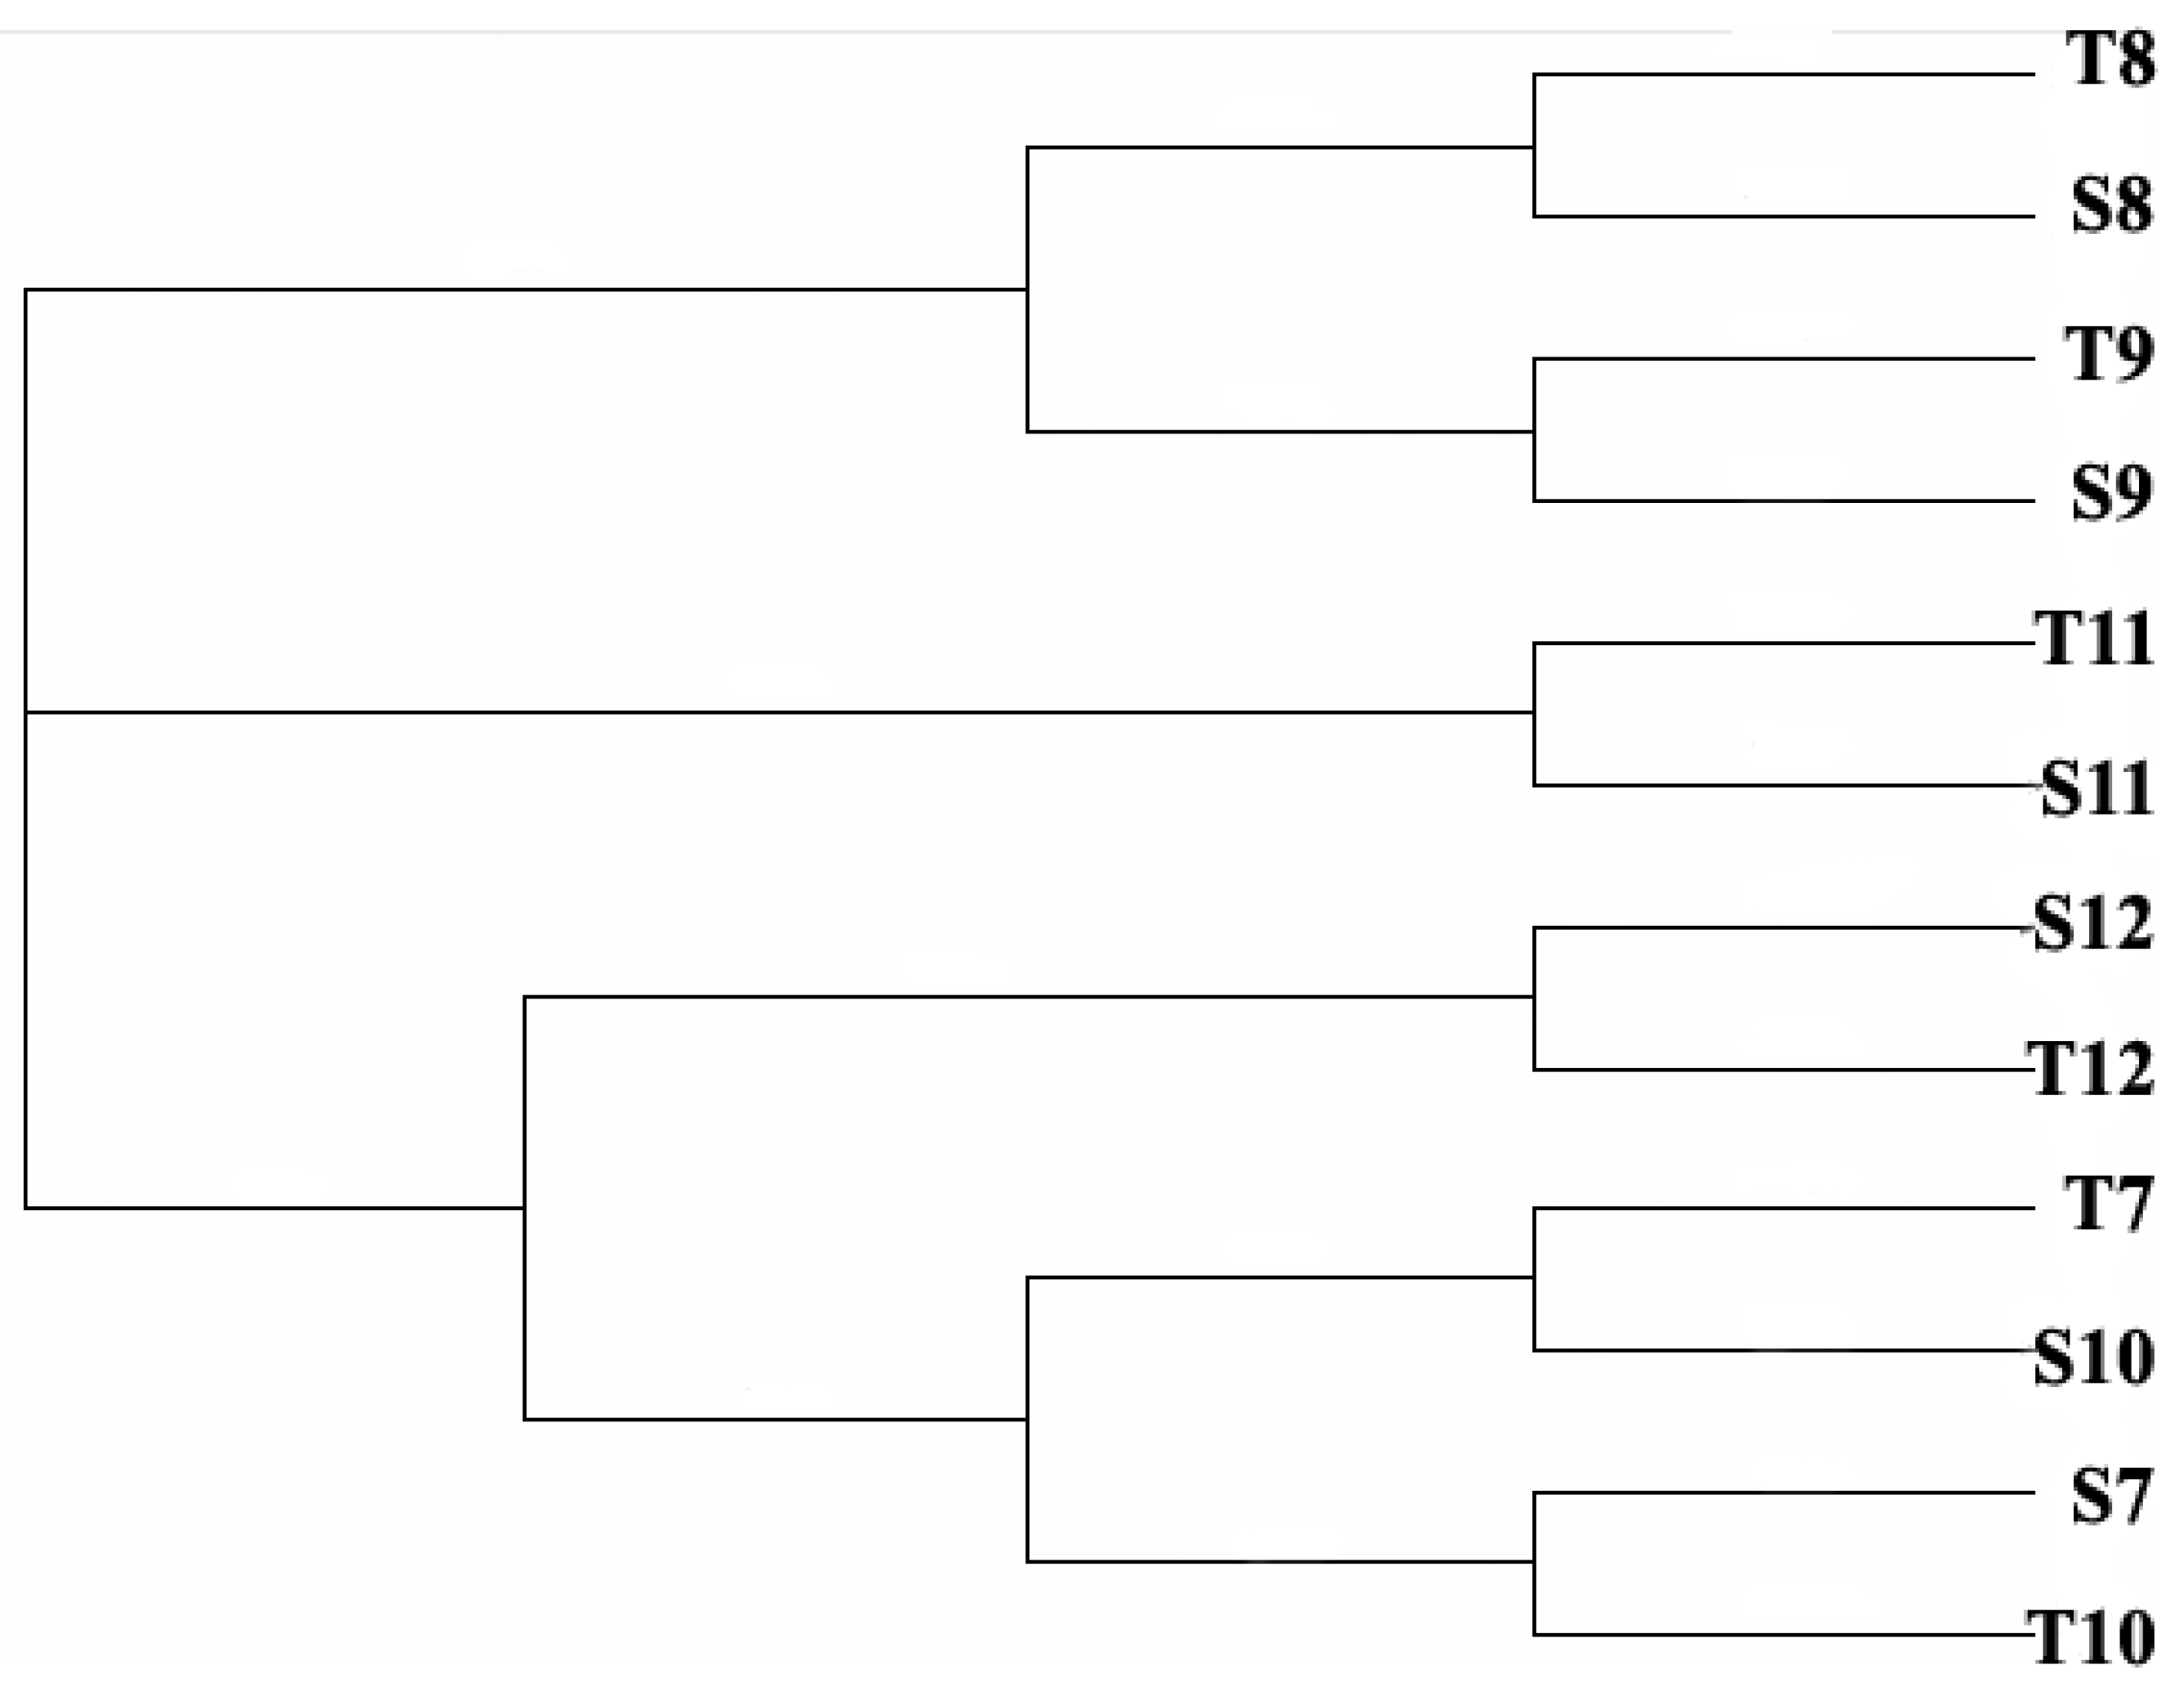
3.4. Comparison between Morphological Identification and PCR-Dgge Identification to Determine Cyanobacteria Community of Two Reservoirs
3.5. Reliability of CCA Based on PCR-DGGE Data
4. Conclusions
Acknowledgments
Conflicts of Interest
References
- Fogg, G.E. Harmful algae—A perspective. Harmful Algae 2002, 1, 1–4. [Google Scholar] [CrossRef]
- Zhou, H.; Peng, W. Water Pollution and Aquatic Environment Restoration; Chemical Industry Press: Beijing, China, 2005. [Google Scholar]
- Tao, J.; Liu, Z.; Chen, X.; Wang, Z.; Shi, L.; Zhang, L. Assessment of reservoir eutrophication in Guangdong Province. J. Lake Sci. 2005, 17, 378–382. [Google Scholar]
- Wen, M.; Fang, G.; Chen, C.; Li, X. Pollution and prevention measures of Shiyan Reservoir in Shenzhen city. Trop. Geogr. 2009, 1, 5–10. [Google Scholar]
- Xu, N.; Duan, S.; Lin, Q.; Hu, R.; Han, B. Analysis on nitrogen pollution and eutrophication of the large and medium reservoirs for water supply in Guangdong Province. Chin. J. Ecol. 2004, 3, 63–67. [Google Scholar]
- Li, Y.; Yuan, B. Investigation of microcystin-LR and identification of toxic algae strains in a reservoir. J. Fujian Norm. Univ. 2005, 21, 52–55. [Google Scholar]
- Fischer, S.G.; Lerman, L.S. DNA fragments differing by single base-pair substitutions are separated in denaturing gradient gels: correspondence with melting theory. Proc. Natl. Acad. Sci. 1983, 80, 1579–1583. [Google Scholar] [CrossRef]
- Muyzer, G.; de Waal, E.C.; Uittrlinden, A.G. Profiling of complex microbial populations by denaturing gradient gel electrophoresis analysis of polymerase chain reaction amplified genes coding for 16S rRNA. Appl. Environ. Microbiol. 1993, 59, 695–701. [Google Scholar]
- Wawer, C.; Jetten, M.S.; Muyzer, G. Genetic diversity and expression of the [NiFe] hydrogenase large-subunit gene of Desulfovibrio spp. in environmental samples. Appl. Environ. Microbiol. 1997, 63, 4360–4369. [Google Scholar]
- Santegoeds, C.M.; Nold, S.C.; Ward, D.M. Denaturing gradient gel electrophoresis used to monitor the enrichment culture of aerobic chemoorganotrophic bacteria from a hot spring cyanobacterial mat. Appl. Environ. Microbiol. 1996, 62, 3922–3928. [Google Scholar]
- Komatsoulis, G.A.; Waterman, M.S. A new computational method for detection of chimeric 16S rRNA artifacts generated by PCR amplification from mixed bacterial populations. Appl. Environ. Microbiol. 1997, 63, 2338–2346. [Google Scholar]
- Head, I.M.; Saunders, J.R. Microbial evolution, diversity and ecology: A decade of ribosomal RNA analysis of uncultivated microorganisms. Microb. Ecol. 1998, 35, 1–21. [Google Scholar] [CrossRef]
- Boutte, C.; Grubisic, S.; Balthasart, P.; Wilmotte, A. Testing of primers for the study of cyanobacterial molecular diversity by DGGE. J. Microbiol. Meth. 2006, 65, 542–550. [Google Scholar] [CrossRef]
- Zwart, G.; Kamst-van Agterveld, M.P.; van der Werff-Staverman, I.; Hagen, F.; Hoogyeld, H.L.; Gons, H.J. Molecular characterization of cyanobacterial diversity in a shallow eutrophic lake. Environ. Microbiol. 2005, 7, 365–377. [Google Scholar] [CrossRef]
- Jing, H.; Aitchison, J.C.; Lacap, D.C.; Peerapornpisal, Y.; Sompong, U.; Pointing, S.B. Community phylogenetic analysis of moderately thermophilic cyanobacterial mats from China, the Philippines and Thailand. Extremophiles 2005, 9, 325–332. [Google Scholar] [CrossRef]
- Nübel, U.; Garcia-Pichel, F.; Muyzer, G. PCR primers to amplify 16S rRNA genes from cyanobacteria. Appl. Environ. Microbiol. 1997, 63, 3327–3332. [Google Scholar]
- Lu, W.; Evans, E.H.; McColl, S.M.; Saunders, V.A. Identification of cyanobacteria by polymorphisms of PCR-amplified ribosomal DNA spacer region. FEMS Microbiol. Lett. 1997, 153, 141–149. [Google Scholar] [CrossRef]
- Otsuka, S.; Suda, S.; Li, R.; Watanabe, M.; Oyaizu, H.; Matsumoto, S.; Watanabe, M.M. Phylogenetic relationships between toxic and non-toxic strains of the genus Microcystis based on 16S to 23S internal transcribed spacer sequence. FEMS Microbiol. Lett. 1999, 172, 15–21. [Google Scholar] [CrossRef]
- State Environmental Protection Administration of China. Environmental Quality Standard for Surface Water GB3838-2002; China Environmental Science Press: Beijing, China, 2002. [Google Scholar]
- Determination of Chlorophylls and Pheo-Pigments: Spectrophotometric Equations. Available online: http://aslo.org/lo/toc/vol_12/issue_2/0343.pdf (accessed on 9 January 2014).
- Hu, H.; Li, Y.; Wei, Y.; Zhu, H.; Chen, J.; Shi, Z. Freshwater Algae in China; Shanghai Science and Technology Press: Shanghai, China, 1980. [Google Scholar]
- Janse, I.; Meima, M.; Kardinaal, W.E.A.; Zwart, G. High-resolution differentiation of cyanobacteria by using rRNA-internal transcribed spacer denaturing gradient gel electrophoresis. Appl. Environ. Microbiol. 2003, 69, 6634–6643. [Google Scholar] [CrossRef]
- Ter Braak, C.J.F. The Analysis of Vegetation-Environment Relationships by Canonical Correspondence Analysis. In Theory and Models in Vegetation Science; Prentice, I.C., van der Maarel, E., Eds.; Springer Netherlands: Dordrecht, The Netherlands, 1987; pp. 69–77. [Google Scholar]
- Yan, Q.; Yu, Y.; Feng, W.; Yu, Z.; Chen, H. Plankton community composition in the Three Gorges Reservoir Region revealed by PCR-DGGE and its relationships with environmental factors. J. Environ. Sci. 2008, 20, 732–738. [Google Scholar] [CrossRef]
- Shapiro, J. The role of carbon dioxide in the initiation and maintenance of blue-green dominance in lakes. Freshw. Biol. 1997, 37, 307–323. [Google Scholar]
- Huisman, J.; Hulot, F.D. Population Dynamics of Harmful Cyanobacteria. In Harmful Cyanobacteria; Cyanobacteria; Huisman, J., Mattehijs, H.C.P., Visser, P.M., Eds.; Springer Verlag: Berlin, Germany, 2005; pp. 143–176. [Google Scholar]
- Lin, Q.; Lei, L.; Han, B. Cyanophyta in south subtropical reservoirs with different trophic levels. Chin. J. Ecol. 2007, 7, 1027–1033. [Google Scholar]
- Reynolds, C.S.; Huszar, V.; Kruk, C.; Naselli-Flores, L.; Melo, S. Towards a functional classification of the freshwater phytoplankton. J. Plankton Res. 2002, 24, 417–428. [Google Scholar] [CrossRef]
- Schauer, M.; Massana, R.; Pedros-Allo, C. Spatial differences in bacterioplankton composition along the Catalan coast (NW Mediterranean) assessed by molecular fingerprinting. FEMS Microbiol. Ecol. 2000, 33, 51–59. [Google Scholar] [CrossRef]
- Jackson, C.R.; Churchill, P.F.; Roden, E.E. Successional changes in bacterial assemblage structure during epilithic biofilm development. Ecology 2001, 82, 555–566. [Google Scholar] [CrossRef]
Appendix
| DGGE band no. | similarity number | closest matching organism | base pairs compared | similarity(%) |
|---|---|---|---|---|
| 1-1 | X75045.1 | Spirulina sp. | 130 | 92 |
| 1-2 | AM398960.1 | Phormidium persicinum SAG 80.79 | 135 | 98 |
| 2-1 | BA000022.2 | Synechocystis sp. | 158 | 89 |
| 4-1 | AF363949.1 | Microcoleus steenstrupii | 171 | 81 |
| 4-2 | EF583859.1 | Anabaena sp. | 139 | 97 |
| 4-3 | X75045.1 | Spirulina sp. | 130 | 92 |
| 4-4 | AM398947.1 | Phormidium sp. | 222 | 97 |
| 4-5 | EF583859.1 | Anabaena sp. | 150 | 98 |
| 4-6 | AJ605201.1 | Microcystis sp. | 244 | 98 |
| 4-7 | EF150986.1 | Microcystis sp. | 214 | 97 |
| 4-8 | EU183353.1 | Arthrospira sp. | 204 | 94 |
| 4-9 | DQ351315.1 | Synechococcus sp. UW140 | 209 | 91 |
| 4-10 | AM398973.1 | Phormidium sp. | 211 | 96 |
| 4-11 | AM502073.1 | Cylindrospermopsis raciborskii | 346 | 98 |
| 4-12 | DQ786166.1 | Leptolyngbya sp. LLi18 | 145 | 94 |
| 4-13 | AJ582284.1 | Cylindrospermopsis raciborskii | 379 | 94 |
| 4-14 | BA000022.2 | Synechocystis sp. | 158 | 89 |
| 4-15 | X75045.1 | Spirulina sp. | 130 | 92 |
| 4-16 | AM398960.1 | Phormidium persicinum SAG 80.79 | 135 | 98 |
| 4-17 | DQ351315.1 | Synechococcus sp. UW140 16S | 209 | 91 |
| 5-1 | EU183353.1 | Arthrospira sp. | 204 | 94 |
| 5-2 | EF583859.1 | Anabaena sp. | 150 | 98 |
| 5-3 | EF150986.1 | Microcystis sp. | 214 | 97 |
| 6-1 | AY672727.1 | Microcystis sp. | 394 | 98 |
| 6-2 | AJ582275.1 | Raphidiopsis sp. | 368 | 96 |
| 7-1 | EF583859.1 | Anabaena sp. | 150 | 98 |
| 7-2 | EU183353.1 | Arthrospira sp. | 204 | 94 |
| 7-3 | AM502073.1 | Cylindrospermopsis raciborskii | 220 | 98 |
| 7-4 | AM398960.1 | Phormidium persicinum | 135 | 98 |
| 8-1 | EF442201.1 | Synechococcus sp. | 89.8 | 92 |
| 10-1 | EF583859.1 | Anabaena sp. | 150 | 98 |
| 10-2 | EF150986.1 | Microcystis sp. | 214 | 97 |
| 10-3 | EU183353.1 | Arthrospira sp. | 204 | 94 |
| 10-4 | AM398960.1 | Phormidium persicinum | 135 | 98 |
| 11-1 | EF429298.1 | Leptolyngbya badia | 130 | 98 |
| 12-1 | EF150986.1 | Microcystis sp. | 214 | 97 |
| 12-2 | AM398960.1 | Phormidium persicinum SAG | 135 | 98 |
| DGGE Band No. | Similarity Number | Closest Matching Organism | Base Pairs Compared | Similarity (%) |
|---|---|---|---|---|
| 1-1 | X75045.1 | Spirulina sp. | 130 | 92 |
| CCCGTTACGCTGCGACGAATGCGTGGCTAGATGACAGGGGTGAGTCGTAACAAGGTAGCCGTACCGGAAGGTGTGGCTGGATCACCTCCTTTAAGGGAGACCGATGACAGATAGTGTACGAATGAATGTAAGCTATCAGTTGGTCATCTCAAGGTCGAGGGTTTCGAGTATGGTATTCTTCAGGCTAGGGTCTAGGGGCTATTAGCTCAGGTGGTTAGA | ||||
| 1-2 | AM398960.1 | Phormidium persicinum SAG 80.79 | 135 | 98 |
| TTCCCTCAGGGGGGGGTGCGACGCAGGTCTGATGACTGGGGTGAAGTCGTAACAAGGTAGCCGTACCGGAAGGTGTGGCTGGATCACCTCCTTTAAGGGAGACCGATGACGGATAGTTTACGAATAGATGTAAGGTATCAGTTGGTCATCTCGAGGTCGAGGGTTGGGAGTATGGTATTCTTCAGGCTAGGGTCTAGGGGCTATTAGCTAGGTGGTTAGA | ||||
| 2-1 | BA000022.2 | Synechocystis sp. | 158 | 89 |
| CGGATAGGAAGGAAGAGCTAACGTAGGACTGATGACTGGGGTGAGTCGTAACAAGGTAGCCGTACCGGAAGGTGTGGCTGGATCACCTCCTTTTAGGGAGACCTAATCCACTTAGAAATGTTAAGGAAACTACCATAACAACCTAAATTGGTCTAACCTAGGTCGGTCGCAGACTTGAAGTAAGTCTTTCAAACTATGATTTGGTTCGATAAGGGCTATTAACTCAGGTGGTTAGA | ||||
| 4-2 | EF583859.1 | Anabaena sp. | 139 | 97 |
| TTTTTGGGGGAGGCGCGACGCACGCTGATGACTGGGGTGAGTCGTAACAAGGTAGCCGTACCGGAAGGTGTGGCTGGATCACCTCCTTTTAGGGAGACCCAATCCGTAGAAGTTATGAGTTATGAGTTTTGAATGTTGAGTTTAAGACTTGTGACCTAAATCTAAACATTACAACTTCTATGAGATTCAATCCCGAGGTCGTACCGAGGTTGTGAACTTTCAAGCTAAGTCAGGTTTGTAAATGGGCTATTAGCTCAGGTGGTTAGA | ||||
| 4-3 | X75045.1 | Spirulina sp. | 130 | 92 |
| CCCGTTACGCTGCGACGAATGCGTGGCTAGATGACAGGGGTGAGTCGTAACAAGGTAGCCGTACCGGAAGGTGTGGCTGGATCACCTCCTTTAAGGGAGACCGATGACAGATAGTGTACGAATGAATGTAAGCTATCAGTTGGTCATCTCAAGGTCGAGGGTTTCGAGTATGGTATTCTTCAGGCTAGGGTCTAGGGGCTATTAGCTCAGGTGGTTAGA | ||||
| 4-4 | AM398947.1 | Phormidium sp. | 222 | 97 |
| TTCCCTCAGGGGGGGGTGCGACGCAGGTCTGATGACTGGGGTGAAGTCGTAACAAGGTAGCCGTACCGGAAGGTGTGGCTGGATCACCTCCTTTAAGGGAGACCGATGACGGATAGTTTACGAATAGATGTAAGGTATCAGTTGGTCATCTCGAGGTCGAGGGTTGGGAGTATGGTATTCTTCAGGCTAGGGTCTAGGGGCTATTAGCTAGGTGGTTAGA | ||||
| 4-5 | EF583859.1 | Anabaena sp. | 150 | 98 |
| TTTTTGGGGGAGGCGCGACGCACGCTGATGACTGGGGTGAGTCGTAACAAGGTAGCCGTACCGGAAGGTGTGGCTGGATCACCTCCTTTTAGGGAGACCCAATCCGTAGAAGTTATGAGTTATGAGTTTTGAATGTTGAGTTTAAGACTTGTGACCTAAATCTAAACATTACAACTTCTATGAGATTCAATCCCGAGGTCGTACCGAGGTTGTGAACTTTCAAGCTAAGTCAGGTTTGTAAATGGGCTATTAGCTCAGGTGGTTAGA | ||||
| 4-6 | AJ605201.1 | Microcystis sp. | 244 | 98 |
| CCAGTAGGGAGGGGGAGCTAGTAGGACTGGTGACTGGGGTGAGTCGTACAAGGTAGCCGTACCGGAAGGTGTGGCTGGATCACCTCCTTTTAGGGAGACCTACCCATTGAAGAATCGAAAGCCGAAGGCGAATAGAGAATCAAATGGTCTACTCTAGGTCGATGACGTGAGATTGTGAAGTCTTTCAAACTAATATTTGGTTCGCGGGCTATTAGCTATGTGGTTAGA | ||||
| 4-7 | EF150986.1 | Microcystis sp. | 214 | 97 |
| CCGTAGCCAAGGGAGAGCTAGCATGACTGATGACTGGGGTGAAGTCGTAACAAGGTAGCCGTACCGGAAGGTGTGGCTGGATCACCTCCTTTCAGGGAGACCTTACCCACCTCAACTCCAAAGCACAAAGCGAATAGAGAGAGGATTGGTCAACCTAAGTCGGTCGAGGAATTGTGTGGCTCTCAAACTTGTCTGGGTTTACTTCTAAGAAGAAGGGAAACGAGGGCTATTAGCTAAGGTGGTTAGAGACATTACCTCAGGTGGTTAGA | ||||
| 4-8 | EU183353.1 | Arthrospira sp. | 204 | 94 |
| AGGATCCGAATCAGGTCTTTTATGACCCCAGAACCTAGTTTGAAAGCCACATACCTCGTTCCGACCTTTTGGGATTGATTCTTGGTTTCGACTACTATTTTTTCGTCTTATACCCGAATTAGGTCTCCCTTTAAGGAGGTGATCCAGCCACACCTTCCGGTACGGCTACCTTGTTACGACTTCACCCCAGTCACTAGCCCTGCCTTAGGCATCCCCCTCCTTGCGGTTGAGGTAACGACTTCGGGCGTGACA | ||||
| 4-9 | DQ351315.1 | Synechococcus sp. UW140 | 209 | 91 |
| CAATGAAGAGAGAGCGTATGTGGGGCTGATGACTGGGGTGAGTCGTAACAAGGTAGCCGTACCGGAAGGTGCGGCTGGATCACCTCCTAACAGGGAGACACAACTGATTTTGATGTTTGGTTCATTTTGAAATCAAGCCGAAATCCTGTCACCTTAGGTCGATCGGTACCTCAGATGGTTGAATGCAATGGGAGCGGAAACGCGACCAAAGCATCTGCCACCTCAGTTCCTAAACTTCTGTCTAGGTCACCCCTCCGAGCCCATCTGGGCCATTAGCTCAGGTGGTTAGA | ||||
| 4-10 | AM398973.1 | Phormidium sp. | 211 | 96 |
| ACATTAAAGGGTAGAGCGACGCACGCTGATGACTGGGGTGAGTCGTAACAAGGTAGCCGTACCGGAAGGTGTGGCTGGATCACCTCCTTTAAGGGAGACCGATGACAGATAGTGTACGAATGAATGTAAGCTATCAGTTGGTCATCTCAAGGTCGAGGGTTTCGAGTATGGTATTCTTCAGGCTAGGGTCTAGGGGCTATTAGCTAGGTGGTTAGA | ||||
| 4-11 | AM502073.1 | Cylindrospermopsis raciborskii | 346 | 98 |
| CGTAAGGTAGCAGCCGATAGCGCGAGTAGAGACTAGACGTGAGTCGTAACAAGGTAGCCGTACCGGAAGGTGTGGCTGGATCACCTCCTTTTAGGGAGACCTACCCATTGAAGAATCCAAAGCCGCAGGCGAATAGAGAATCAAATGGTCTACTCTAGGTCGATGACGTGAGATTGTGAAGTCTTTCAAACTAATATTTGGTTCGCGGGCTATTAGCTCAGGTGGTTAGAACACACCATGGGACCAGACCTTGTCCAAGACCCCTTTTGCTTTACTTAATGACAAAAAACAAAGATCTACCAAACTTTTTACCCAATAAAAATATCCCGGGTCCCCAGCACCCCTTGTTCCCTCAAAAATTTCCCCAAAAAAACCCGACCCCCCTATTATCTCAAAGCGCTTCCTTTTGTTGGGGATGGGGGACAAAAATTGGGGGGGCCACACAAAGTGATCTTATAGTGCCCTCTGGCTTTTATCTGGGGCATCGGAAAACTCTTAATTCTGTATCGGACCTCCACGCTCGTGTCTTTGGGGGGGGCTACCATATCGAGAGAACTCTCCGCATGCGGAGCTCTCTCTACAGTGCGCGGGGGTT | ||||
| 4-12 | DQ786166.1 | Leptolyngbya sp. LLi18 | 145 | 94 |
| CCGTAGCCAAGGGAGAGCTAGCATGACTGATGACTGGGGTGAAGTCGTAACAAGGTAGCCGTACCGGAAGGTGTGGCTGGATCACCTCCTTTCAGGGAGACCTTACCCACCTCAACTCCAAAGCACAAAGCGAATAGAGAGAGGATTGGTCAACCTAAGTCGGTCGAGGAATTGTGTGGCTCTCAAACTTGTCTGGGTTTACTTCTAAGAAGAAGGGAAACGAGGGCTATTAGCTAAGGTGGTTAGAGACATTACCTCAGGTGGTTAGA | ||||
| 4-13 | AJ582284.1 | Cylindrospermopsis raciborskii | 379 | 94 |
| CCCATCAGTGAGCTATGTAGGACTGGTGACTGGGGTGAGTCGTAACAAGGTAGCCGTACCGGAAGGTGTGGCTGGATCACCTCCTTTTAGGGAGACCTACCCATTGAGGAATCGAAAGCGGAGAGCGAATAGAGAATCAAATGGTCTACTCTAGGTCGGTGACGTGAGATTGTGAAGTCTTTCAAACTAATATTTGGTTCGCGAGAGGGCTATTAGCTAGGGTGGTTAGAAGCACCCCCGGGGGATAGCCAACCACTGCGGGCTTAAACCCTGGGGAAAAAACCAAAGTGGTAAGAACAGCTGGGGGCAAAAAAATAATCAAGACTCCGAATTTCCTGTGTTCCCTCAAAAATTTCTTTGAGAACCACCGACCCCCCTGTATATCTGACTGCCGCTCTTTGCCGATCTTTTTTTTAAAATGGTGGCCGGCCCCCCAAATGATGTGTTGTTGGCGCCCCCCCCCTCTTACTTGGCGTTCGAGAGAATTACTAATACGACATTCATCCACCACGGTTTTATTTAGTGGGGGGCGCGAACGGAGAGATGGCT | ||||
| 4-14 | BA000022.2 | Synechocystis sp. | 158 | 89 |
| CGGATAGGAAGGAAGAGCTAACGTAGGACTGATGACTGGGGTGAGTCGTAACAAGGTAGCCGTACCGGAAGGTGTGGCTGGATCACCTCCTTTTAGGGAGACCTAATCCACTTAGAAATGTTAAGGAAACTACCATAACAACCTAAATTGGTCTAACCTAGGTCGGTCGCAGACTTGAAGTAAGTCTTTCAAACTATGATTTGGTTCGATAAGGGCTATTAACTCAGGTGGTTAGA | ||||
| 4-15 | X75045.1 | Spirulina sp. | 130 | 92 |
| CCCGTTACGCTGCGACGAATGCGTGGCTAGATGACAGGGGTGAGTCGTAACAAGGTAGCCGTACCGGAAGGTGTGGCTGGATCACCTCCTTTAAGGGAGACCGATGACAGATAGTGTACGAATGAATGTAAGCTATCAGTTGGTCATCTCAAGGTCGAGGGTTTCGAGTATGGTATTCTTCAGGCTAGGGTCTAGGGGCTATTAGCTCAGGTGGTTAGA | ||||
| 4-16 | AM398960.1 | Phormidium persicinum SAG 80.79 | 135 | 98 |
| TTCCCTCAGGGGGGGGTGCGACGCAGGTCTGATGACTGGGGTGAAGTCGTAACAAGGTAGCCGTACCGGAAGGTGTGGCTGGATCACCTCCTTTAAGGGAGACCGATGACGGATAGTTTACGAATAGATGTAAGGTATCAGTTGGTCATCTCGAGGTCGAGGGTTGGGAGTATGGTATTCTTCAGGCTAGGGTCTAGGGGCTATTAGCTAGGTGGTTAGA | ||||
| 4-17 | DQ351315.1 | Synechococcus sp. UW140 16S | 209 | 91 |
| CAATGAAGAGAGAGCGTATGTGGGGCTGATGACTGGGGTGAGTCGTAACAAGGTAGCCGTACCGGAAGGTGCGGCTGGATCACCTCCTAACAGGGAGACACAACTGATTTTGATGTTTGGTTCATTTTGAAATCAAGCCGAAATCCTGTCACCTTAGGTCGATCGGTACCTCAGATGGTTGAATGCAATGGGAGCGGAAACGCGACCAAAGCATCTGCCACCTCAGTTCCTAAACTTCTGTCTAGGTCACCCCTCCGAGCCCATCTGGGCCATTAGCTCAGGTGGTTAGA | ||||
| 5-1 | EU183353.1 | Arthrospira sp. | 204 | 94 |
| AGGATCCGAATCAGGTCTTTTATGACCCCAGAACCTAGTTTGAAAGCCACATACCTCGTTCCGACCTTTTGGGATTGATTCTTGGTTTCGACTACTATTTTTTCGTCTTATACCCGAATTAGGTCTCCCTTTAAGGAGGTGATCCAGCCACACCTTCCGGTACGGCTACCTTGTTACGACTTCACCCCAGTCACTAGCCCTGCCTTAGGCATCCCCCTCCTTGCGGTTGAGGTAACGACTTCGGGCGTGACA | ||||
| 5-2 | EF583859.1 | Anabaena sp. | 150 | 98 |
| TTTTTGGGGGAGGCGCGACGCACGCTGATGACTGGGGTGAGTCGTAACAAGGTAGCCGTACCGGAAGGTGTGGCTGGATCACCTCCTTTTAGGGAGACCCAATCCGTAGAAGTTATGAGTTATGAGTTTTGAATGTTGAGTTTAAGACTTGTGACCTAAATCTAAACATTACAACTTCTATGAGATTCAATCCCGAGGTCGTACCGAGGTTGTGAACTTTCAAGCTAAGTCAGGTTTGTAAATGGGCTATTAGCTCAGGTGGTTAGA | ||||
| 5-3 | EF150986.1 | Microcystis sp. | 214 | 97 |
| CCGTAGCCAAGGGAGAGCTAGCATGACTGATGACTGGGGTGAAGTCGTAACAAGGTAGCCGTACCGGAAGGTGTGGCTGGATCACCTCCTTTCAGGGAGACCTTACCCACCTCAACTCCAAAGCACAAAGCGAATAGAGAGAGGATTGGTCAACCTAAGTCGGTCGAGGAATTGTGTGGCTCTCAAACTTGTCTGGGTTTACTTCTAAGAAGAAGGGAAACGAGGGCTATTAGCTAAGGTGGTTAGAGACATTACCTCAGGTGGTTAGA | ||||
| 6-1 | AY672727.1 | Microcystis sp. | 394 | 98 |
| TCGCCAGTCGAGGTATCCATGCGCGTACTAGTGATGGGGTGCAGTCGTAACAAGGTAGCCGTACCGGAAGGTGTGGCTGGATCACCTCCTTAAAGGGAGACCTAATTCAGGTAGGATACGAAAAAAAGTAGTCCCTACCAAGAATCAATCCCAAAAGGTCGGAGCGAGGCAAAATTGGCTTTCAAACTAGGTTCTGGGTTCACATAAGACCTGAATCAGGAACAAGGGCTATTAGCTCAGGTGGTTAGAATTAACTCCTGGGGTAGTTGGATCCAAGGTGGTTAGATTACCGCGGGTGTATGGGTTTCTAAAGATTCATTAACGAAGTTCAGGTTCAGCTTCTGTGCCCAAAGACTGAATGTAATTACTTGCAGACTCTGACGATATTTTCCCCAGAACTTTACCTTTGGGGTTTTTTTTTTGTCCTAAAACGAGCTCCATATGATCAGGGGGGGGGGGGACCCCCCCCCACCTCGTTCTCCCGGTCCACTCTCATCCATGATGAACCCCACGGACCAATCATACTCAGTCTGGATATAATGCATCAAAATACTCATGATTCTCTGGTTTCTCGGTACCACCTGGTACCTCTCGCACCCC | ||||
| 6-2 | AJ582275.1 | Raphidiopsis sp. | 368 | 96 |
| CCCATCAGTGAGCTATGTAGGACTGGTGACTGGGGTGAGTCGTAACAAGGTAGCCGTACCGGAAGGTGTGGCTGGATCACCTCCTTTTAGGGAGACCTACCCATTGAGGAATCGAAAGCGGAGAGCGAATAGAGAATCAAATGGTCTACTCTAGGTCGGTGACGTGAGATTGTGAAGTCTTTCAAACTAATATTTGGTTCGCGAGAGGGCTATTAGCTAGGGTGGTTAGAAGCACCCCCGGGGGATAGCCAACCACTGCGGGCTTAAACCCTGGGGAAAAAACCAAAGTGGTAAGAACAGCTGGGGGCAAAAAAATAATCAAGACTCCGAATTTCCTGTGTTCCCTCAAAAATTTCTTTGAGAACCACCGACCCCCCTGTATATCTGACTGCCGCTCTTTGCCGATCTTTTTTTTAAAATGGTGGCCGGCCCCCCAAATGATGTGTTGTTGGCGCCCCCCCCCTCTTACTTGGCGTTCGAGAGAATTACTAATACGACATTCATCCACCACGGTTTTATTTAGTGGGGGGCGCGAACGGAGAGATGGCT | ||||
| 7-1 | EF583859.1 | Anabaena sp. | 150 | 98 |
| TTTTTGGGGGAGGCGCGACGCACGCTGATGACTGGGGTGAGTCGTAACAAGGTAGCCGTACCGGAAGGTGTGGCTGGATCACCTCCTTTTAGGGAGACCCAATCCGTAGAAGTTATGAGTTATGAGTTTTGAATGTTGAGTTTAAGACTTGTGACCTAAATCTAAACATTACAACTTCTATGAGATTCAATCCCGAGGTCGTACCGAGGTTGTGAACTTTCAAGCTAAGTCAGGTTTGTAAATGGGCTATTAGCTCAGGTGGTTAGA | ||||
| 7-2 | EU183353.1 | Arthrospira sp. | 204 | 94 |
| AGGATCCGAATCAGGTCTTTTATGACCCCAGAACCTAGTTTGAAAGCCACATACCTCGTTCCGACCTTTTGGGATTGATTCTTGGTTTCGACTACTATTTTTTCGTCTTATACCCGAATTAGGTCTCCCTTTAAGGAGGTGATCCAGCCACACCTTCCGGTACGGCTACCTTGTTACGACTTCACCCCAGTCACTAGCCCTGCCTTAGGCATCCCCCTCCTTGCGGTTGAGGTAACGACTTCGGGCGTGACA | ||||
| 7-3 | AM502073.1 | Cylindrospermopsis raciborskii | 220 | 98 |
| CGTAAGGTAGCAGCCGATAGCGCGAGTAGAGACTAGACGTGAGTCGTAACAAGGTAGCCGTACCGGAAGGTGTGGCTGGATCACCTCCTTTTAGGGAGACCTACCCATTGAAGAATCCAAAGCCGCAGGCGAATAGAGAATCAAATGGTCTACTCTAGGTCGATGACGTGAGATTGTGAAGTCTTTCAAACTAATATTTGGTTCGCGGGCTATTAGCTCAGGTGGTTAGAACACACCATGGGACCAGACCTTGTCCAAGACCCCTTTTGCTTTACTTAATGACAAAAAACAAAGATCTACCAAACTTTTTACCCAATAAAAATATCCCGGGTCCCCAGCACCCCTTGTTCCCTCAAAAATTTCCCCAAAAAAACCCGACCCCCCTATTATCTCAAAGCGCTTCCTTTTGTTGGGGATGGGGGACAAAAATTGGGGGGGCCACACAAAGTGATCTTATAGTGCCCTCTGGCTTTTATCTGGGGCATCGGAAAACTCTTAATTCTGTATCGGACCTCCACGCTCGTGTCTTTGGGGGGGGCTACCATATCGAGAGAACTCTCCGCATGCGGAGCTCTCTCTACAGTGCGCGGGGGTT | ||||
| 7-4 | AM398960.1 | Phormidium persicinum | 135 | 98 |
| TTCCCTCAGGGGGGGGTGCGACGCAGGTCTGATGACTGGGGTGAAGTCGTAACAAGGTAGCCGTACCGGAAGGTGTGGCTGGATCACCTCCTTTAAGGGAGACCGATGACGGATAGTTTACGAATAGATGTAAGGTATCAGTTGGTCATCTCGAGGTCGAGGGTTGGGAGTATGGTATTCTTCAGGCTAGGGTCTAGGGGCTATTAGCTAGGTGGTTAGA | ||||
| 8-1 | EF442201.1 | Synechococcus sp. | 89.8 | 92 |
| CAATGAAGAGAGAGCGTATGTGGGGCTGATGACTGGGGTGAGTCGTAACAAGGTAGCCGTACCGGAAGGTGCGGCTGGATCACCTCCTAACAGGGAGACACAACTGATTTTGATGTTTGGTTCATTTTGAAATCAAGCCGAAATCCTGTCACCTTAGGTCGATCGGTACCTCAGATGGTTGAATGCAATGGGAGCGGAAACGCGACCAAAGCATCTGCCACCTCAGTTCCTAAACTTCTGTCTAGGTCACCCCTCCGAGCCCATCTGGGCCATTAGCTCAGGTGGTTAGA | ||||
| 10-1 | EF583859.1 | Anabaena sp. | 150 | 98 |
| TTTTTGGGGGAGGCGCGACGCACGCTGATGACTGGGGTGAGTCGTAACAAGGTAGCCGTACCGGAAGGTGTGGCTGGATCACCTCCTTTTAGGGAGACCCAATCCGTAGAAGTTATGAGTTATGAGTTTTGAATGTTGAGTTTAAGACTTGTGACCTAAATCTAAACATTACAACTTCTATGAGATTCAATCCCGAGGTCGTACCGAGGTTGTGAACTTTCAAGCTAAGTCAGGTTTGTAAATGGGCTATTAGCTCAGGTGGTTAGA | ||||
| 10-2 | EF150986.1 | Microcystis sp. | 214 | 97 |
| CCGTAGCCAAGGGAGAGCTAGCATGACTGATGACTGGGGTGAAGTCGTAACAAGGTAGCCGTACCGGAAGGTGTGGCTGGATCACCTCCTTTCAGGGAGACCTTACCCACCTCAACTCCAAAGCACAAAGCGAATAGAGAGAGGATTGGTCAACCTAAGTCGGTCGAGGAATTGTGTGGCTCTCAAACTTGTCTGGGTTTACTTCTAAGAAGAAGGGAAACGAGGGCTATTAGCTAAGGTGGTTAGAGACATTACCTCAGGTGGTTAGA | ||||
| 10-3 | EU183353.1 | Arthrospira sp. | 204 | 94 |
| AGGATCCGAATCAGGTCTTTTATGACCCCAGAACCTAGTTTGAAAGCCACATACCTCGTTCCGACCTTTTGGGATTGATTCTTGGTTTCGACTACTATTTTTTCGTCTTATACCCGAATTAGGTCTCCCTTTAAGGAGGTGATCCAGCCACACCTTCCGGTACGGCTACCTTGTTACGACTTCACCCCAGTCACTAGCCCTGCCTTAGGCATCCCCCTCCTTGCGGTTGAGGTAACGACTTCGGGCGTGACA | ||||
| 10-4 | AM398960.1 | Phormidium persicinum | 135 | |
| TTCCCTCAGGGGGGGGTGCGACGCAGGTCTGATGACTGGGGTGAAGTCGTAACAAGGTAGCCGTACCGGAAGGTGTGGCTGGATCACCTCCTTTAAGGGAGACCGATGACGGATAGTTTACGAATAGATGTAAGGTATCAGTTGGTCATCTCGAGGTCGAGGGTTGGGAGTATGGTATTCTTCAGGCTAGGGTCTAGGGGCTATTAGCTAGGTGGTTAGA | ||||
| 11-1 | EF429298.1 | Leptolyngbya badia | 130 | 98 |
| GACTTTACGGCAGAGCGTCGCATGCTGATGACTGGGGTGAGTCGTAACAAGGTAGCCGTACCGGAAGGTGTGGCTGGATCACCTCCTTTAAGGGAGACCGATGACGGATAGTTTACGAATAGATGTAAGGTATCAGTTGGTCATCTCGAGGTCGAGGGTTGGGAGTATGGTATTCTTCAGGCTAGGGTCTAGGGGCTATTAGCTAGGTGGTTAGA | ||||
| 12-1 | EF150986.1 | Microcystis sp. | 214 | |
| CCGTAGCCAAGGGAGAGCTAGCATGACTGATGACTGGGGTGAAGTCGTAACAAGGTAGCCGTACCGGAAGGTGTGGCTGGATCACCTCCTTTCAGGGAGACCTTACCCACCTCAACTCCAAAGCACAAAGCGAATAGAGAGAGGATTGGTCAACCTAAGTCGGTCGAGGAATTGTGTGGCTCTCAAACTTGTCTGGGTTTACTTCTAAGAAGAAGGGAAACGAGGGCTATTAGCTAAGGTGGTTAGAGACATTACCTCAGGTGGTTAGA | ||||
| 12-2 | AM398960.1 | Phormidium persicinum SAG | 135 | |
| TTCCCTCAGGGGGGGGTGCGACGCAGGTCTGATGACTGGGGTGAAGTCGTAACAAGGTAGCCGTACCGGAAGGTGTGGCTGGATCACCTCCTTTAAGGGAGACCGATGACGGATAGTTTACGAATAGATGTAAGGTATCAGTTGGTCATCTCGAGGTCGAGGGTTGGGAGTATGGTATTCTTCAGGCTAGGGTCTAGGGGCTATTAGCTAGGTGGTTAGA | ||||
© 2014 by the authors; licensee MDPI, Basel, Switzerland. This article is an open access article distributed under the terms and conditions of the Creative Commons Attribution license (http://creativecommons.org/licenses/by/3.0/).
Share and Cite
Luo, W.; Chen, H.; Lei, A.; Lu, J.; Hu, Z. Estimating Cyanobacteria Community Dynamics and its Relationship with Environmental Factors. Int. J. Environ. Res. Public Health 2014, 11, 1141-1160. https://doi.org/10.3390/ijerph110101141
Luo W, Chen H, Lei A, Lu J, Hu Z. Estimating Cyanobacteria Community Dynamics and its Relationship with Environmental Factors. International Journal of Environmental Research and Public Health. 2014; 11(1):1141-1160. https://doi.org/10.3390/ijerph110101141
Chicago/Turabian StyleLuo, Wenhuai, Huirong Chen, Anping Lei, Jun Lu, and Zhangli Hu. 2014. "Estimating Cyanobacteria Community Dynamics and its Relationship with Environmental Factors" International Journal of Environmental Research and Public Health 11, no. 1: 1141-1160. https://doi.org/10.3390/ijerph110101141