Using Small-Area Analysis to Estimate County-Level Racial Disparities in Obesity Demonstrating the Necessity of Targeted Interventions

Abstract
:1. Introduction
2. Methods
2.1. Data Analysis
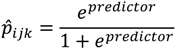
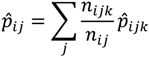
 ij is the estimated prevalence of obesity in county i of race j; nijk is the number of people in county i that are of race j and belong to age and sex demographic group k; nij = ∑ j nijk is the total population in county i of race j; ijk is the estimated prevalence of obesity in county i for race j in demographic group k.
 3. Results and Discussion

| N | Mean | Median | SD | Minimum | Maximum | |
|---|---|---|---|---|---|---|
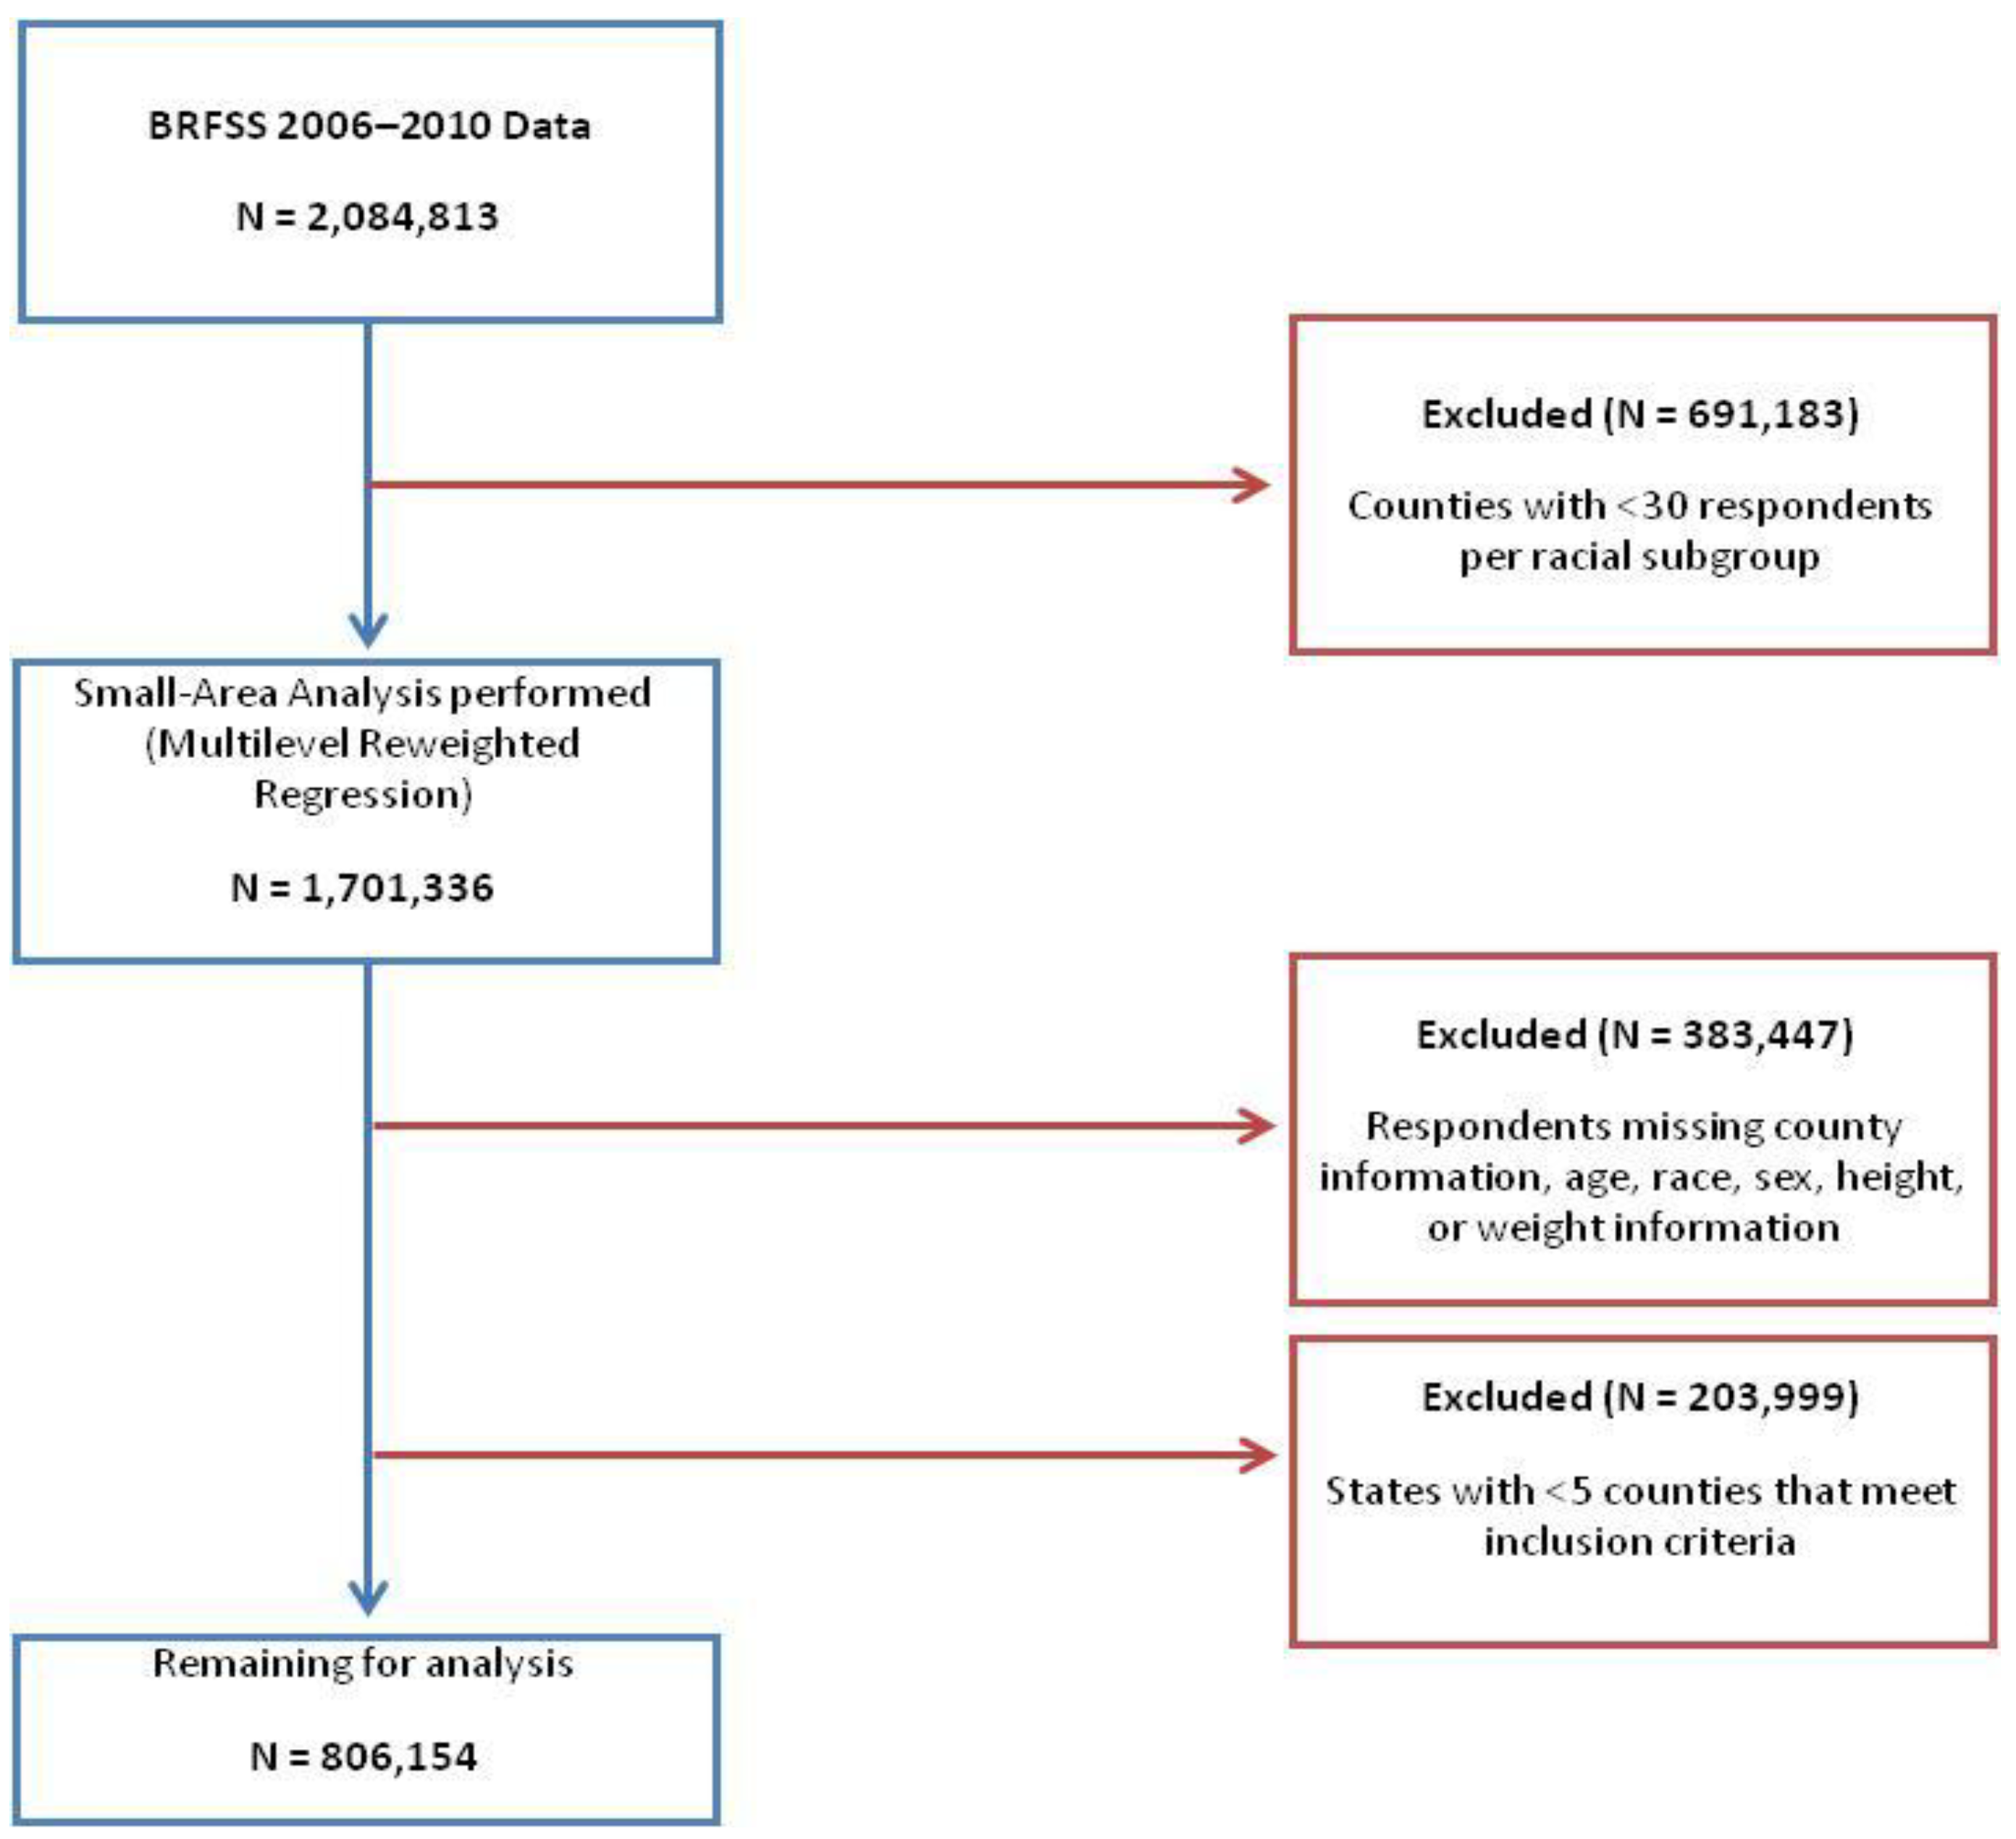
| Observations | 806,154 | |||||
| Observations per county | 1,512.5 | 922.0 | 1,904.4 | 83.0 | 16,463.0 | |
| Counties | 533 | |||||
| Counties per state | 20.5 | 12.0 | 17.0 | 5.0 | 57.0 |
| White Prevalence of Obesity (%) | Black Prevalence of Obesity (%) | T-Test | |||||
|---|---|---|---|---|---|---|---|
| State | N | Mean | SD | Mean | SD | T Statistic | p-value |
| Alabama | 34 | 24.46 | 4.62 | 31.60 | 4.83 | 6.23 | <0.0001 |
| Arkansas | 12 | 23.17 | 3.90 | 29.22 | 3.72 | 3.89 | 0.0008 |
| California | 14 | 18.71 | 3.77 | 25.14 | 4.16 | 4.28 | 0.0002 |
| Colorado | 5 | 15.69 | 1.98 | 22.07 | 2.25 | 7.50 * | 0.0625 |
| Florida | 57 | 21.22 | 3.87 | 27.58 | 4.73 | 7.86 | <0.0001 |
| Georgia | 28 | 18.58 | 3.08 | 25.53 | 3.53 | 7.85 | <0.0001 |
| Illinois | 8 | 18.17 | 1.38 | 24.61 | 2.37 | 6.63 | <0.0001 |
| Indiana | 5 | 20.49 | 1.89 | 28.17 | 1.78 | 6.63 | 0.0002 |
| Kansas | 6 | 19.61 | 3.47 | 26.93 | 3.81 | 3.48 | 0.0059 |
| Kentucky | 7 | 22.00 | 2.89 | 29.73 | 2.38 | 14.00 * | 0.0156 |
| Louisiana | 43 | 22.40 | 3.74 | 28.94 | 4.29 | 473.00 * | <0.0001 |
| Maryland | 21 | 21.46 | 4.33 | 28.09 | 4.63 | 115.50 * | <.0001 |
| Massachusetts | 8 | 17.43 | 2.46 | 24.42 | 2.68 | 5.42 | <.0001 |
| Michigan | 11 | 21.56 | 3.33 | 29.35 | 3.46 | 5.38 | <0.0001 |
| Mississippi | 56 | 23.57 | 3.13 | 29.77 | 3.38 | 10.06 | <0.0001 |
| New Jersey | 20 | 18.57 | 2.97 | 25.60 | 2.72 | 7.82 | <0.0001 |
| New York | 12 | 17.07 | 3.55 | 23.97 | 2.88 | 5.23 | <0.0001 |
| North Carolina | 55 | 22.62 | 3.85 | 30.13 | 4.04 | 9.99 | <0.0001 |
| Ohio | 10 | 21.54 | 2.16 | 29.61 | 2.26 | 8.17 | <0.0001 |
| Oklahoma | 7 | 22.25 | 2.10 | 30.45 | 2.46 | 6.72 | <0.0001 |
| Pennsylvania | 8 | 20.43 | 3.21 | 27.23 | 3.35 | 4.15 | 0.0010 |
| South Carolina | 43 | 22.95 | 3.75 | 30.37 | 3.94 | 8.94 | <0.0001 |
| Tennessee | 12 | 21.45 | 2.43 | 28.23 | 1.84 | 7.70 | <0.0001 |
| Texas | 20 | 20.25 | 3.68 | 27.48 | 4.06 | 5.90 | <0.0001 |
| Virginia | 24 | 18.30 | 4.56 | 25.97 | 5.80 | 5.09 | <0.0001 |
| Washington | 7 | 20.50 | 1.89 | 27.54 | 2.38 | 14.00 * | 0.0156 |


4. Conclusions
Acknowledgments
Conflicts of Interest
References
- Clinical Guidelines on the Identification, Evaluation, and Treatment of Overweight and Obesity in Adults; Report No. 98-4083; National Heart, Lung, and Blood Institute: Bethesda, MD, USA, 1998.
- Levi, J.; Segal, L.M.; Laurent, R.S.; Kohn, D.; Thomas, K.; Wenk, E.; Goodman, E.; Zimmerman, A.; Graff, H.; Rayburn, J.; et al. How Obesity Threatens America’s Future 2011; Trust for America’s Health: Washington, DC, USA, 2011. [Google Scholar]
- Organisation for Economic Co-Operation and Development. Obesity and the Economics of Prevention: Fit not Fat—United States Key Facts. Available online: http://www.oecd.org/health/health-systems/obesityandtheeconomicsofpreventionfitnotfat-unitedstateskeyfacts.htm#Other_Countries (accessed on 15 September 2013).
- Ogden, C.L.; Carroll, M.D.; Kit, B.K.; Flegal, K.M. Prevalence of obesity in the United States, 2009–2010. NCHS Data Brief 2012, 82, 1–8. [Google Scholar]
- Wang, Y.; Beydoun, M. The obesity epidemic in the United States—Gender, age, socioeconomic, racial/ethnic, and geographic characteristics: A systematic review and meta-regression analysis. Epidemiol. Rev. 2007, 29, 6–28. [Google Scholar] [CrossRef]
- Kim, I.; Keppel, K.G. Priority data needs: Sources of national, state, and local-level data and data collection systems. Healthy People 2000 Stat. Notes 1997, 15, 1–11. [Google Scholar]
- Goodman, M.S. Comparison of small-area analysis techniques for estimating prevalence by race. Prev. Chronic Dis. 2010, p. A33. Available online: http://www.ncbi.nlm.nih.gov/pmc/articles/PMC2831787/ (accessed on 15 February 2010).
- Jia, H.; Muennig, P.; Borawski, E. Comparison of small-area analysis techniques for estimating county-level outcomes. Am. J. Prev. Med. 2004, 26, 453–460. [Google Scholar] [CrossRef]
- Zhang, Z.; Zhang, L.; Penman, A.; May, W. Using small-area estimation method to calculate county-level prevalence of obesity in Mississippi, 2007–2009. Prev. Chronic Dis. 2011, 8, p. A85. Available online: http://www.ncbi.nlm.nih.gov/pmc/articles/PMC3136983/ (accessed on 15 June 2010).
- Behavioral Risk Factor Surveillance System. Annual Survey Data. Centers for Disease Control and Prevention: Atlanta, GA, USA, 2013. Available online: http://www.cdc.gov/brfss/annual_data/annual_data.htm#2001 (accessed on 10 August 2013).
- Remington, P.L.; Smith, M.Y.; Williamson, D.F.; Anda, R.F.; Gentry, E.M.; Hogelin, G.C. Design, characteristics, and usefulness of state-based behavioral risk factor surveillance: 1981–87. Public Health Rep. 1988, 103, 366–375. [Google Scholar]
- Schiller, J.S.; Lucas, J.W.; Ward, B.W.; Peregoy, J.A. Summary health statistics for U.S. adults: National Health Interview Survey, 2010. Vital Health Stat. 2012, 252, 1–207. [Google Scholar]
- D’Agostino, L.; Goodman, M.S. Multilevel Reweighted Regression Models to Estimate County-Level Racial Health Disparities Using PROC GLIMMIX. Available online: http://support.sas.com/resources/papers/proceedings13/442-2013.pdf (accessed on 12 November 2013).
- Colditz, G.A.; D’Agostino McGowan, L.; James, A.S.; Bohlke, K; Goodman, M.S. Screening for colorectal cancer: Using data to set prevention priorities. Cancer Causes Control 2013. [Google Scholar] [CrossRef]
- Clinical Guidelines on the Identification, Evaluation, and Treatment of Overweight and Obesity in Adults; Report No. 984083; National Institutes of Health: Bethesda, MD, USA, 2000. Available online: http://www.nhlbi.nih.gov/guidelines/obesity/ob_gdlns.htm (accessed on 10 December 1998).
- D’Agostino McGowan, L.; Goodman, M.S. Using PROC GLIMMIX and PROC SGPLOT to Demonstrate County-Level Racial Disparities in Obesity in North Carolina. In Proceedings of North East SAS Users Group 2013, Burlington, VT, Canada, 17 September 2013; pp. 1–9.
- Le, A.; Judd, S.E.; Allison, D.B.; Oza-Frank, R.; Affuso, O.; Safford, M.M.; Howard, V.J.; Howard, G. The geographic distribution of obesity in the US and the potential regional differences in misreporting of obesity: Regional differences in obesity. Obesity 2013. [Google Scholar] [CrossRef]
- Centers for Disease Control and Prevention (CDC). Behavioral Risk Factor Surveillance System; CDC: Atlanta, GA, USA, 2013. Available online: http://www.cdc.gov/brfss/smart/smart_faq.htm (accessed on 17 December 2013).
- Colditz, G. Economic costs of obesity and inactivity. Med. Sci. Sports Exerc. 1999, 31, S663–S667. [Google Scholar] [CrossRef]
- Finkelstein, E.A.; Trogdon, J.G.; Cohen, J.W.; Dietz, W. Annual medical spending attributable to obesity: Payer-and service-specific estimates. Health Aff. 2009, 28, w822–w831. [Google Scholar] [CrossRef]
© 2013 by the authors; licensee MDPI, Basel, Switzerland. This article is an open access article distributed under the terms and conditions of the Creative Commons Attribution license (http://creativecommons.org/licenses/by/3.0/).
Share and Cite
D'Agostino-McGowan, L.; Gennarelli, R.L.; Lyons, S.A.; Goodman, M.S. Using Small-Area Analysis to Estimate County-Level Racial Disparities in Obesity Demonstrating the Necessity of Targeted Interventions. Int. J. Environ. Res. Public Health 2014, 11, 418-428. https://doi.org/10.3390/ijerph110100418
D'Agostino-McGowan L, Gennarelli RL, Lyons SA, Goodman MS. Using Small-Area Analysis to Estimate County-Level Racial Disparities in Obesity Demonstrating the Necessity of Targeted Interventions. International Journal of Environmental Research and Public Health. 2014; 11(1):418-428. https://doi.org/10.3390/ijerph110100418
Chicago/Turabian StyleD'Agostino-McGowan, Lucy, Renee L. Gennarelli, Sarah A. Lyons, and Melody S. Goodman. 2014. "Using Small-Area Analysis to Estimate County-Level Racial Disparities in Obesity Demonstrating the Necessity of Targeted Interventions" International Journal of Environmental Research and Public Health 11, no. 1: 418-428. https://doi.org/10.3390/ijerph110100418