Article

Estimation of Populations Exposed to Road Traffic Noise in Districts of Seoul Metropolitan Area of Korea

1
Environmental Infrastructure Research Department, National Institute of Environmental Research (NIER), 42 Hwankyeong-Ro, Seo-gu, Incheon 404-708, Korea
2
Climate and Air Quality Research Department, National Institute of Environmental Research (NIER), 42 Hwankyeong-Ro, Seo-gu, Incheon 404-708, Korea
*
Author to whom correspondence should be addressed.
Int. J. Environ. Res. Public Health 2014, 11(3), 2729-2740; https://doi.org/10.3390/ijerph110302729
Submission received: 21 January 2014 / Revised: 13 February 2014 / Accepted: 13 February 2014 / Published: 5 March 2014

Abstract

:
This study aims to model road traffic noise levels and estimate the human exposure at the 25 districts in the metropolitan Seoul, Republic of Korea. The SoundPLAN® Version 7.1 software package was used to model noise levels and simulated road traffic noise maps were created. The people exposed to daytime/nighttime road traffic noise were also estimated. The proportions of the population exposed to road traffic noise in major cities in the EU were also estimated and compared. Eight (8) districts show the exceeded rate (percentage of the exposed population exceeding the daytime standard) of 20% or more, and eleven (11) districts show 10%-20% and six (6) districts show less than 10%, which indicates considerable variation among districts. Two districts (Nowon-gu and Yangcheon-gu) show the highest exposure rate during the daytime (35.2%). For nighttime noise levels, fourteen (14) districts show the exceeded rate (percentage of exposed population exceeding the nighttime standard) over 30%. The average percentages of the exposed population exceeding the daytime/nighttime standards in Seoul and the EU were 16.6%/34.8% and 13.0%/16.1%, respectively. The results show that road traffic noise reduction measures should urgently be taken for the nighttime traffic noise in Seoul. When the grid noise map and the 3-D façade noise map were compared, the 3-D façade noise map was more accurate in estimating exposed population in citywide noise mapping.

1. Introduction

Road traffic is one of the major sources of community noise in metropolitan cities. By the estimation of World Health organization (WHO), the population exposed to road traffic noise above the acceptable levels of the WHO in EU is more than 30%. The WHO has also recognized the environmental noise as harmful pollution that causes adverse effects on human health. Many papers indicate that “annoyance and sleep disturbance” are most common symptoms of environmental noise [1,2,3,4]. It is reported that cardiovascular risk among young healthy individuals has an association with road traffic noise annoyance [5]. Numerous studies on the correlation between environmental noise and human health have been conducted: road traffic noise and the effect on hypertension and heart disease [6], how noise creates annoyance and disturbs sleep [1], the relationship between traffic noise annoyance and the indoor sound level [7], a questionnaire-based study on the effect of road traffic noise levels and health-related symptoms for women residents of Tokyo [8], relations between stress hormones associated with noise and the risk of cardiovascular diseases [9,10], a study on the quiet side effect in dwellings [11,12], etc.
Kurra et al. performed a simulated-environment study to determine the effects of noise levels and source type on annoyance responses to different transportation noises and elucidated the significance of the source-type effect on annoyance by analyzing a special questionnaire prepared for the experiments [13]. Ali et al. measured the equivalent noise levels before and after a ban on horns and found that they were reduced considerably by the ban [14]. Recently, Chang et al. developed a prediction model to evaluate the road traffic noise levels in urban area of Taiwan and also it was validated with the measured values at 42 sampling sites. He also investigated the relation between the exposure to road traffic noise and the prevalence of hypertension among 820 residents in Taichung, Taiwan [15,16].
In 2002, the EU adopted the Environmental Noise Directive 2002/49/EC to assess and manage the environmental noise. This directive mandates assessment and management of environmental noise exposure by creating strategic noise maps for all major roads, railways, and airports [17]. The standard of road traffic noise in EU countries is currently Lden 65 dB(A), Lnight 55 dB(A).
Recently, Ko et al. explored the transportation noise levels using noise prediction models and estimated the population exposed to traffic noise levels for an urbanized district of Seoul metropolitan city of Korea [18]. Seong et al. modeled the road traffic noise levels using a model implemented in the SoundPLAN® and also estimated the human exposure to high noise levels in Fulton County, GA, USA [19]. Lam et al. examined the population exposed to road traffic noise in Hong Kong [20,21] and Banerjee et al. evaluated factors affecting the level of road traffic noise in an industrial town (Asansol) of India [22]. In developing traffic noise maps, two different methods are generally used. Mehdi made a direct measurement and created various maps using inverse-distance weighted interpolation method [23]. The other method is to use GIS datasets and the traffic information. Currently the latter method is used more frequently due to the accuracy levels [24].
Noise monitoring has been performed in Korea for a long time in order to understand the status of road traffic noise. However, there were some difficulties in capturing the status and exposure levels of road traffic noise at the actual places of residence since the monitoring sites are located near the sources of the road traffic noise and are limited in number. The city of Seoul is vulnerable to the exposure of road traffic noise since many public apartments are neighboring with major roads. The national environmental standards of road traffic noise in Korea are set to [Leq, day(18h) 65 dB(A), Leq, night(6h) 55 dB(A)]. The management standards are [Leq, day(18h) 68 dB(A), Leq, night(6h) 58 dB(A)]. In estimating the exposed population, the exposed noise levels are divided at 5 dB(A) intervals and calculated by the percentage of noise level that exceeds the national daytime and nighttime environmental noise standards [18].
This study predicted the ambient levels of road traffic noise for the Seoul metropolitan area and estimated the population exposed to the road traffic noise by districts. The results were then compared with the results from the cities of Europe. The GIS datasets (3-D) were collected to estimate the population exposed to traffic noise and 3-D traffic noise maps were developed using a modeling method. The exposure levels of road traffic noise were estimated by the actual residential area basis. The population exposed to the road traffic noise in the city of Seoul was finally estimated by combining the above noise data for districts, mean residential areas, and mean residential population.

2. Methods

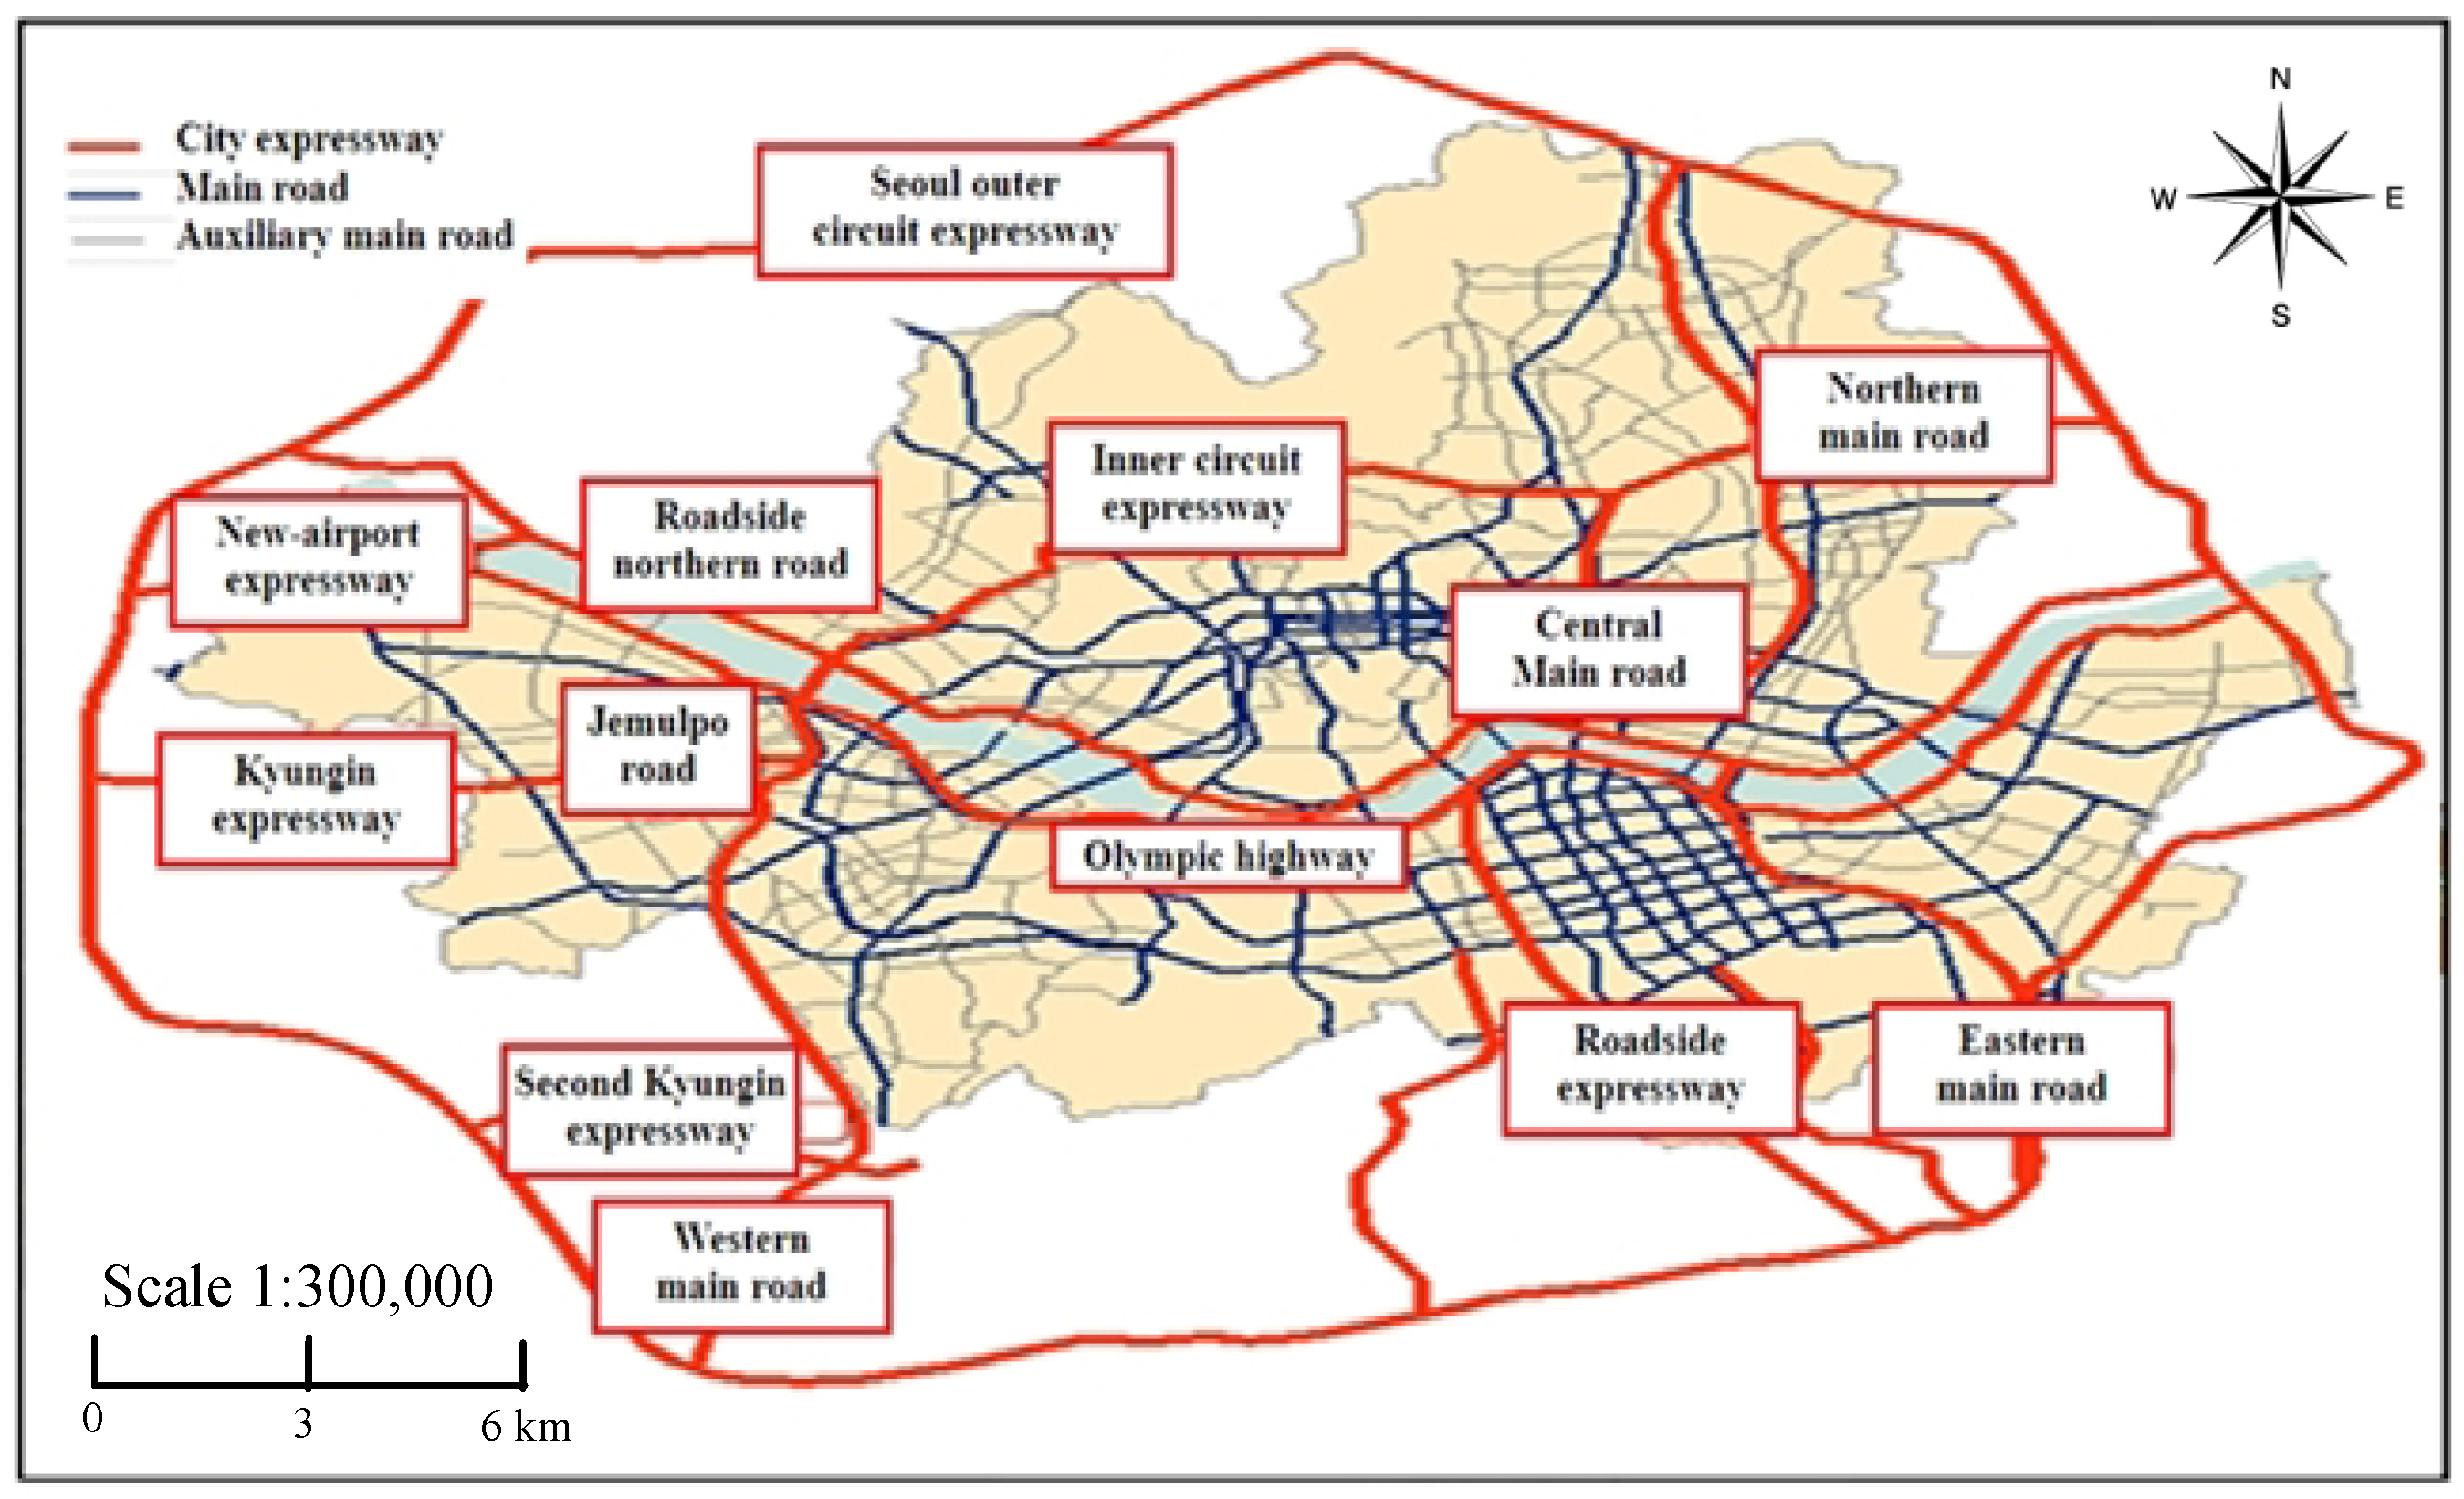
2.1. Study Area and Construction of 3-D Modeling Data

Seoul, the capital city of South Korea, has an area of 605.25 km2 with a population of more than 10 million people and a population density of 16,200/km2. It consists of 25 regional administrative districts called “gu”. High-rise apartments are very popular in Seoul. Since they were constructed near the roadside, they are vulnerable to the exposure of road traffic noise. 3-D GIS datasets were prepared with contour, terrain, building height, building types, road width and gradient.
The SoundPLAN® Version 7.1 software package was used to model noise levels. Roads that have a traffic volume of more than 2,000 vehicles per hour were selected as noise sources. There are many noise prediction models. In this study, we chose a NMPB model developed in France. The factors affecting noise transfer to residence such as topography, building shape, absorptions, and radiations from noise barriers were modeled according to the ISO 9613 method. Road traffic data such as road segments, traffic volumes, vehicle speed and the ratio of large/small vehicles for the surveyed roads were acquired from the Department of Transportation and the Police Agency of City of Seoul.

2.2. Estimation of Noise Levels and the Population Exposed to Noise at Actual Residences Using a 3-D Noise Map

When developing traffic noise maps, two approaches are generally used. One is to make direct measurements for selected sites and create a map by the interpolation method. The other is to model traffic noise levels using GIS datasets and traffic information. The noise levels are accurate in direct measurement, but there are difficulties in selecting various measurement sites to estimate the exposed population in citywide noise mapping. The population exposed to noise can be estimated using the grid noise map or the 3-D façade noise map.

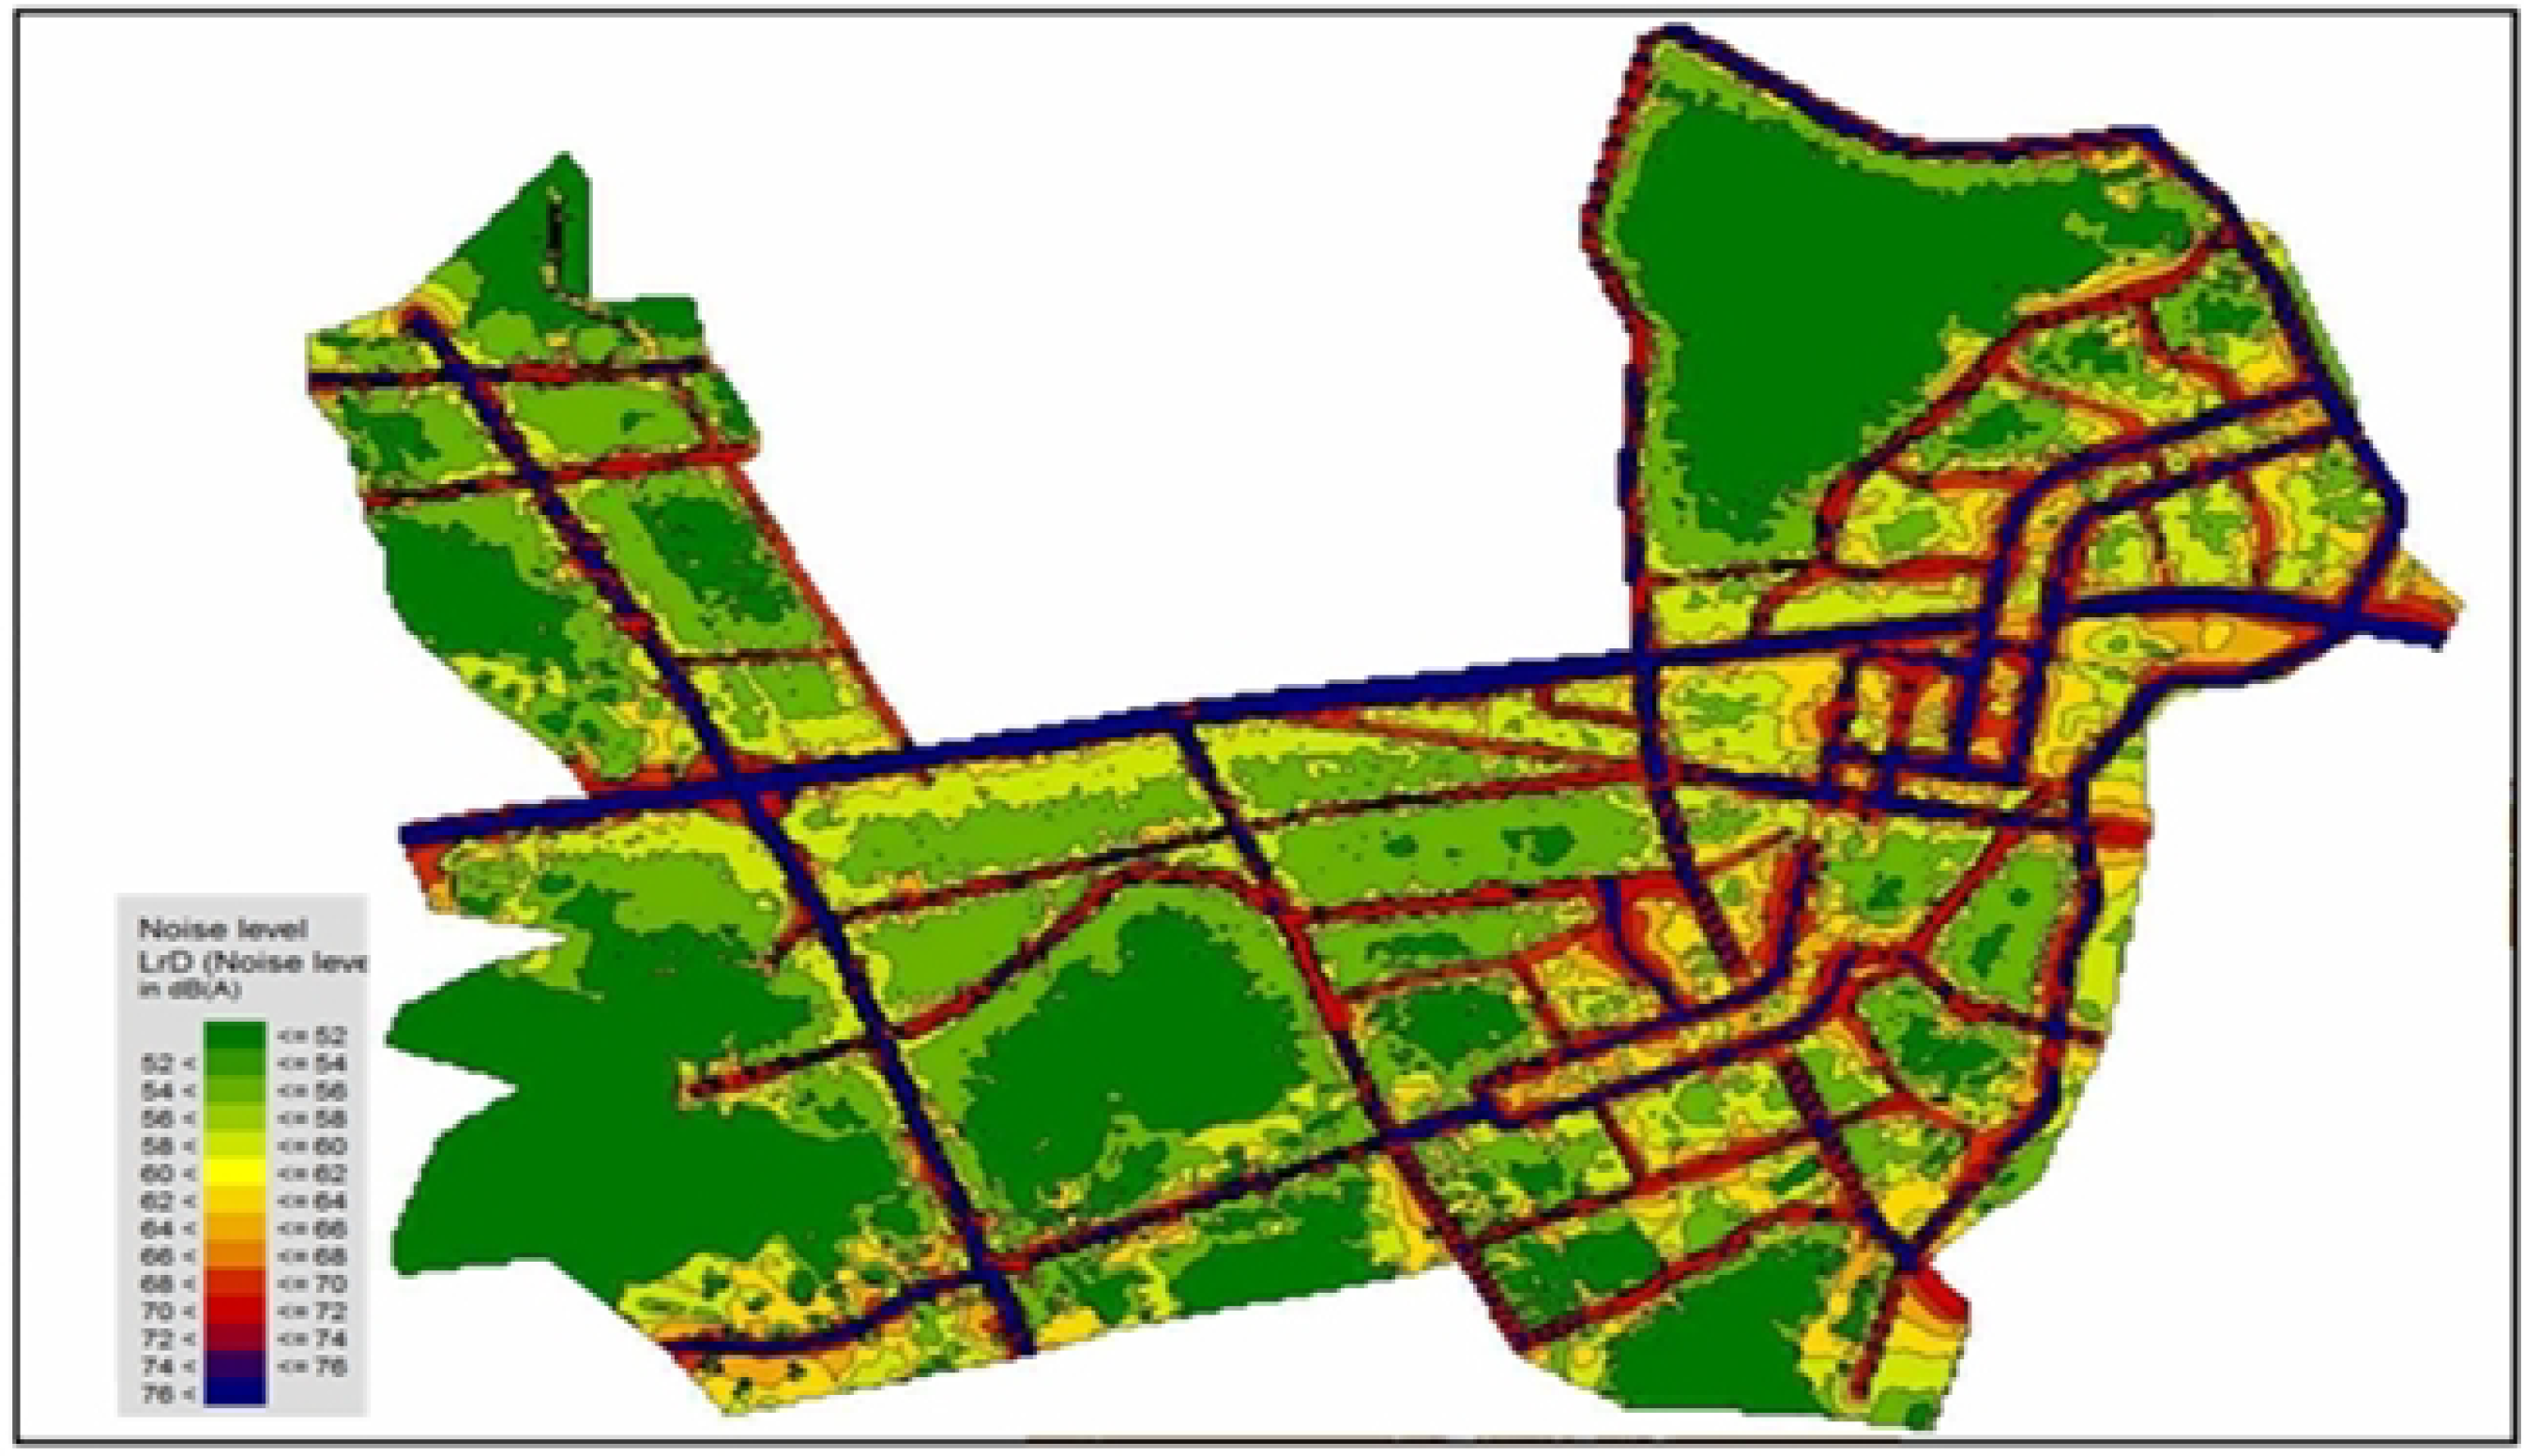
2.2.1. Method Using Grid Noise Map

This method indicates the grid distribution type of road traffic noise as the noise map as shown in Figure 1. It then determines each area by noise levels. Assuming the population is evenly distributed in the area, noise exposed population can be estimated according to area by noise levels divided by population distribution. However, this method has some shortcomings. It does not count different land use types and uneven population density.
Figure 1. Grid distribution type noise map in whole Yangcheon-gu.
Ijerph 11 02729 g001

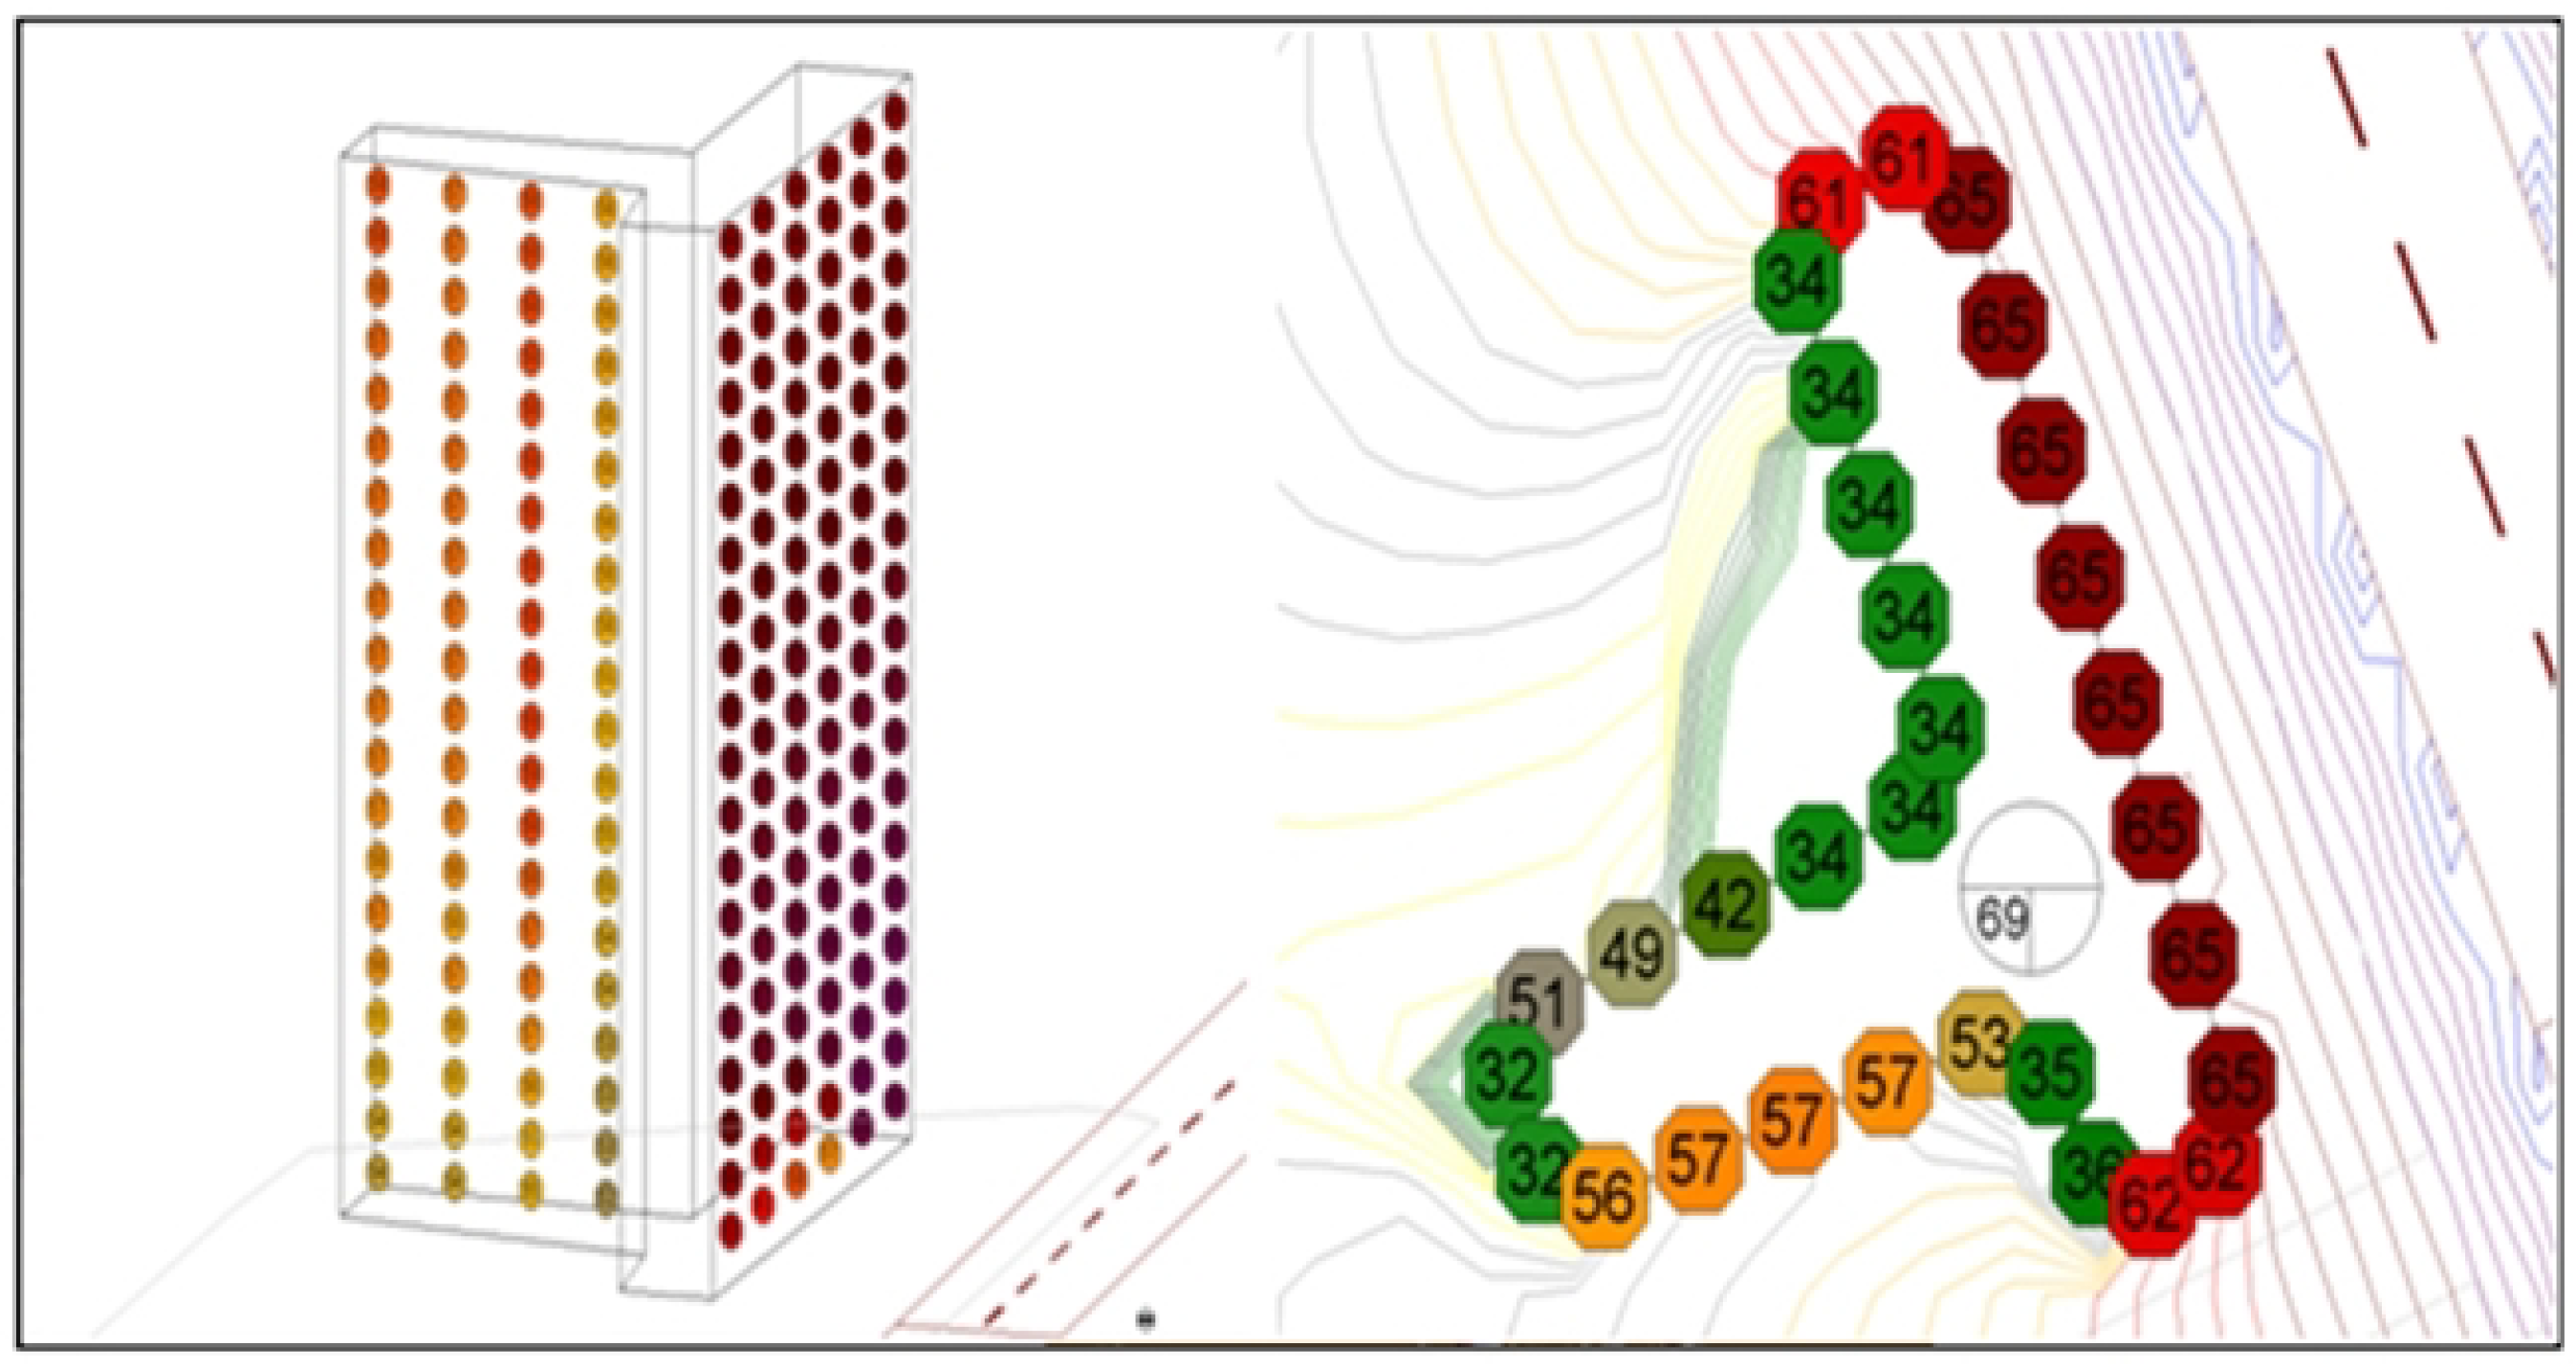
2.2.2. Method Using 3-D Façade Noise Map

This method calculates the amount of exposure by noise levels on each floor of an apartment as shown in Figure 2. It then estimates the exposed population using average residential area per person. This method is adequate for Korean residential types due to the roadside location. The number of occupants in a residential building is calculated by multiplying the building ground area (BGAi,j) and number of floors (NFi,j) and then dividing by area per person (i: specific ID of the building, j: building type) as shown in the following equation. The population exposed to noise is estimated by multiplying the number of floors exposed to noise at regular intervals (5 dB) and the number of people per floor.
No. of the Occupants = (BGAi,j × NFi,j) / (Area per 1 person)
The noise levels are different on each side of the apartment, as shown in Figure 2. Buildings facing the roads generally had higher noise levels. In this study, for the estimation of the exposed population, the following assumptions were made: (i) target buildings are only residential houses in the electronic map (commercial buildings, schools, hospitals etc. were excluded) (ii) all residents are at home (did not consider commuting) (iii) the residential area per person is uniform. The exposed population was estimated by selecting the highest noise value of each floor and the amount of exposure was estimated by predicting the noise level at the site 1.0 meter apart from the building wall.
Figure 2. Three-dimensional façade noise map of dwelling house.
Ijerph 11 02729 g002

3. Results and Discussion

3.1. Road Transportation Information and GIS for the City of Seoul

In order to evaluate the traffic noise level and the population exposure, the roads with annual traffic volume of more than 6 million vehicles as well as the major roads of over 4-lanes were selected. These were chosen as noise sources according to the EU Directive 2002/49/EC. Road networks and sources of road noise in Seoul are shown in Figure 3.
Figure 3. Road networks and sources of road noise in Seoul.
Ijerph 11 02729 g003
The traffic data such as average traffic volumes and light/heavy vehicles ratio for 25 districts of Seoul are represented in Table 1. These data were acquired from the Department of Transportation and Police Agency of the City of Seoul. For the selected road noise sources, average traffic volumes per hour and light/heavy vehicles ratio by each district were used as input data.
Exposed noise levels were estimated by putting terrain information such as contour line, and building information (e.g., building height), and population information into the noise-receiving point of the façade map, which was created at 1.0 meter apart from the residential front.
Table 1. Summary of traffic data for 25 districts of Seoul.
Average Traffic Vol. (vehicle/h)Day-TimeNight-TimeLight VehicleHeavy VehicleL/H RatioAverage Traffic Vol. (vehicle/h)Day-TimeNight-TimeLight VehicleHeavy VehicleL/H Ratio
Seocho3,6721,3884,88018027.1Gwanak2,1981,4643,44621616.0
Gangnam1,4651,3032,63213619.4Guro2,7751,1103,69419119.4
Nowon1,6241,3442,82314519.5Dongdaemun2,1291,0683,01618116.7
Dobong1,3871,2202,44915715.6GangSeo2,0941,2463,13520515.3
Gangdong1,4182251,5865927.1SongPa1,5581,1352,52916415.4
Gwangjin1,9781,4283,13626911.7Yeongdeungpo1,3346261,84111915.5
Seongbuk2,5431,9014,14030413.6Jungnang2,4229443,22414222.7
Gangbuk2,3991,6863,89918621.0Mapo2,8181,8774,50019423.2
Eunpyeong1,9291,2732,95724612.0Jongno3,3241,8734,97821922.8
Yangcheon1.771.0622.60722511.6Yongsan3,3241,8734,97821922.8
Seongdong2,9222,1154,68735113.4Jung1,5551,0632,47914017.8
Dongjak2,1021,2253,17615121.0Seodaemun2,7612,1644,62330115.3
Geumcheon5,3092,5237,54728626.4

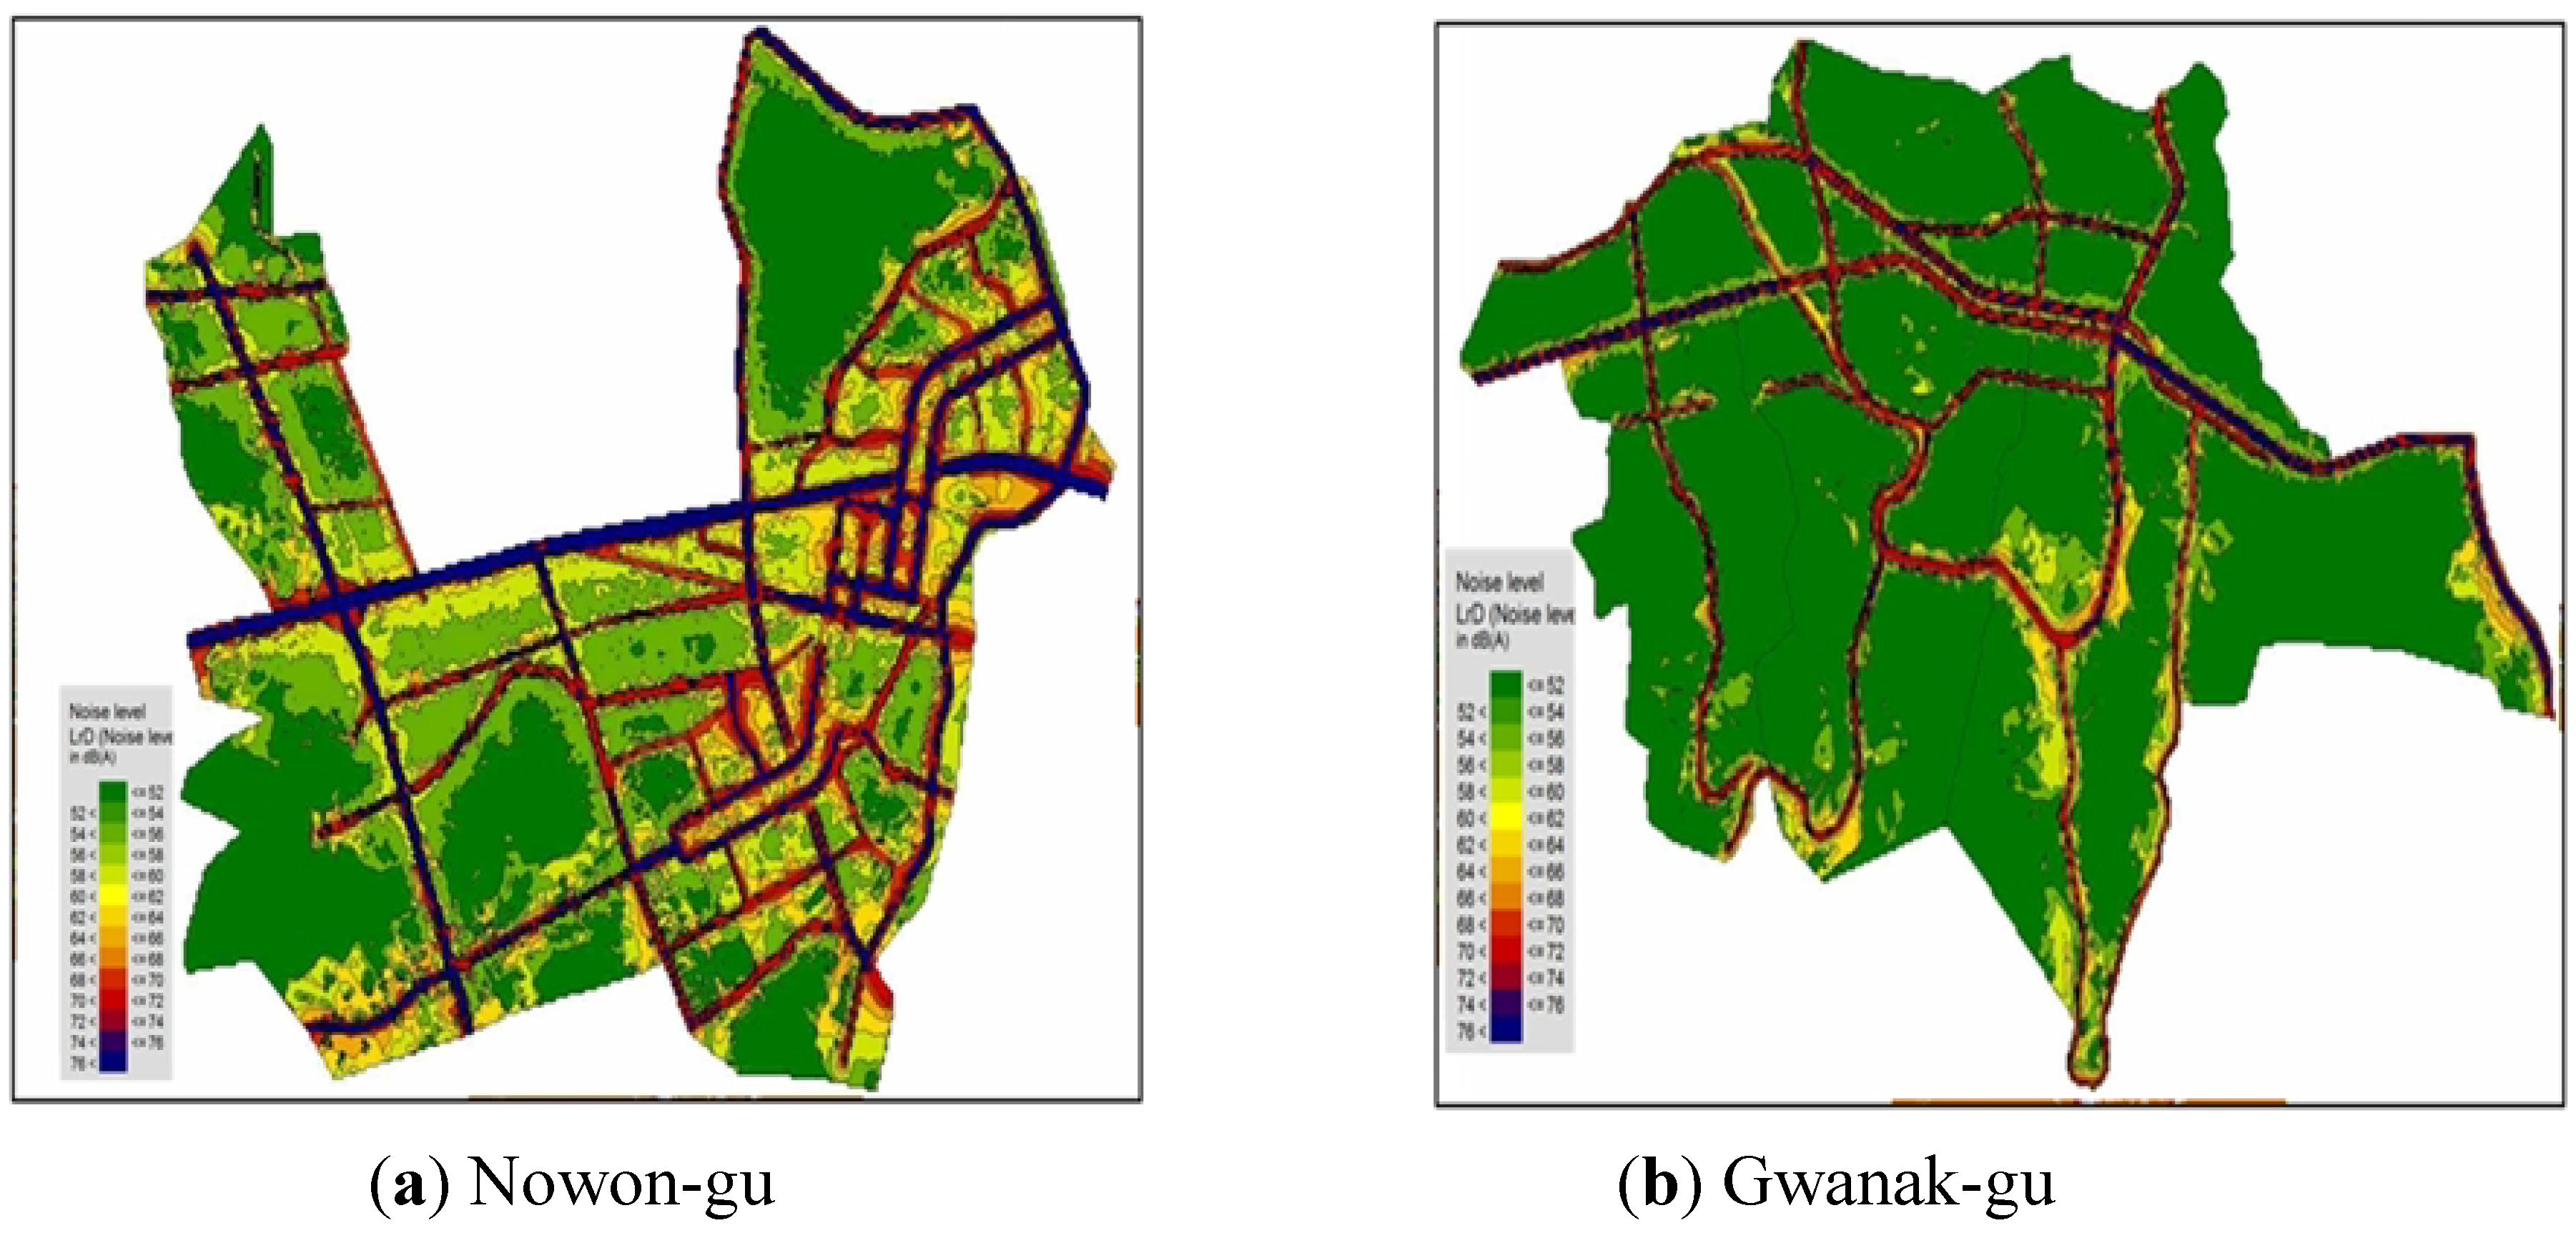
3.2. Evaluation of Exposed Noise Levels at the Residential front by District in Seoul

The noise levels by district at the residential front were estimated through modeling, using the terrain and noise sources information. Figure 4a is the 3-D façade map of Nowon-gu where the exposed population over the daytime standard [65 dB(A)] is largest in the Seoul metropolitan area. The colored buildings (except grey-colored) in Figure 4 are residential places, and the grey-colored buildings are commercial places. As shown in the figure, most residential places (dwelling houses) are concentrated near the roads. It shows a direct influence of road traffic noise at most residences. Figure 4b is a 3-D façade noise map of Gwanak-gu where the exposed population over the daytime standard [65 dB(A)] is smallest in the Seoul metropolitan area.
Figure 5 and Figure 6 are the 3-D façade maps which are the modeling results of noise levels. As shown in Table 1, the average traffic volume of Gwanak-gu was higher than that of Nowon-gu. However, we found that the exposed population was much higher in Nowon-gu than in Gwanak-gu. The percentage of the exposed population exceeding the daytime standard in Nowon-gu was 35.2%, but only 4.1% in Gwanak-gu. In this case, the distance from the road traffic noise sources was an important factor i.e., roadside residences were found to be the most vulnerable areas to traffic noise. Figure 5 is the grid noise maps of Nowon-gu and Gwanak-gu. A grid noise map method can only verify the influential distances and areas by noise levels on the pictures and has a limitation not to reflect the actual residential types. As shown in Figure 4, the commercial buildings depicted in grey, have been built around the main roads. These buildings play a role in cutting off the road traffic noises contrary to Nowon-gu, where the residences are directly affected by road traffic noise. We also know that the concentration density of apartments at roadsides is much smaller compared to Nowon-gu.
Figure 4. Façade noise maps of two districts (“whole” gu).
Ijerph 11 02729 g004
Figure 5. Grid noise maps of two districts (“whole” gu).
Ijerph 11 02729 g005
Figure 6. Percentage of exposed population exceeding the standard by district.
Ijerph 11 02729 g006

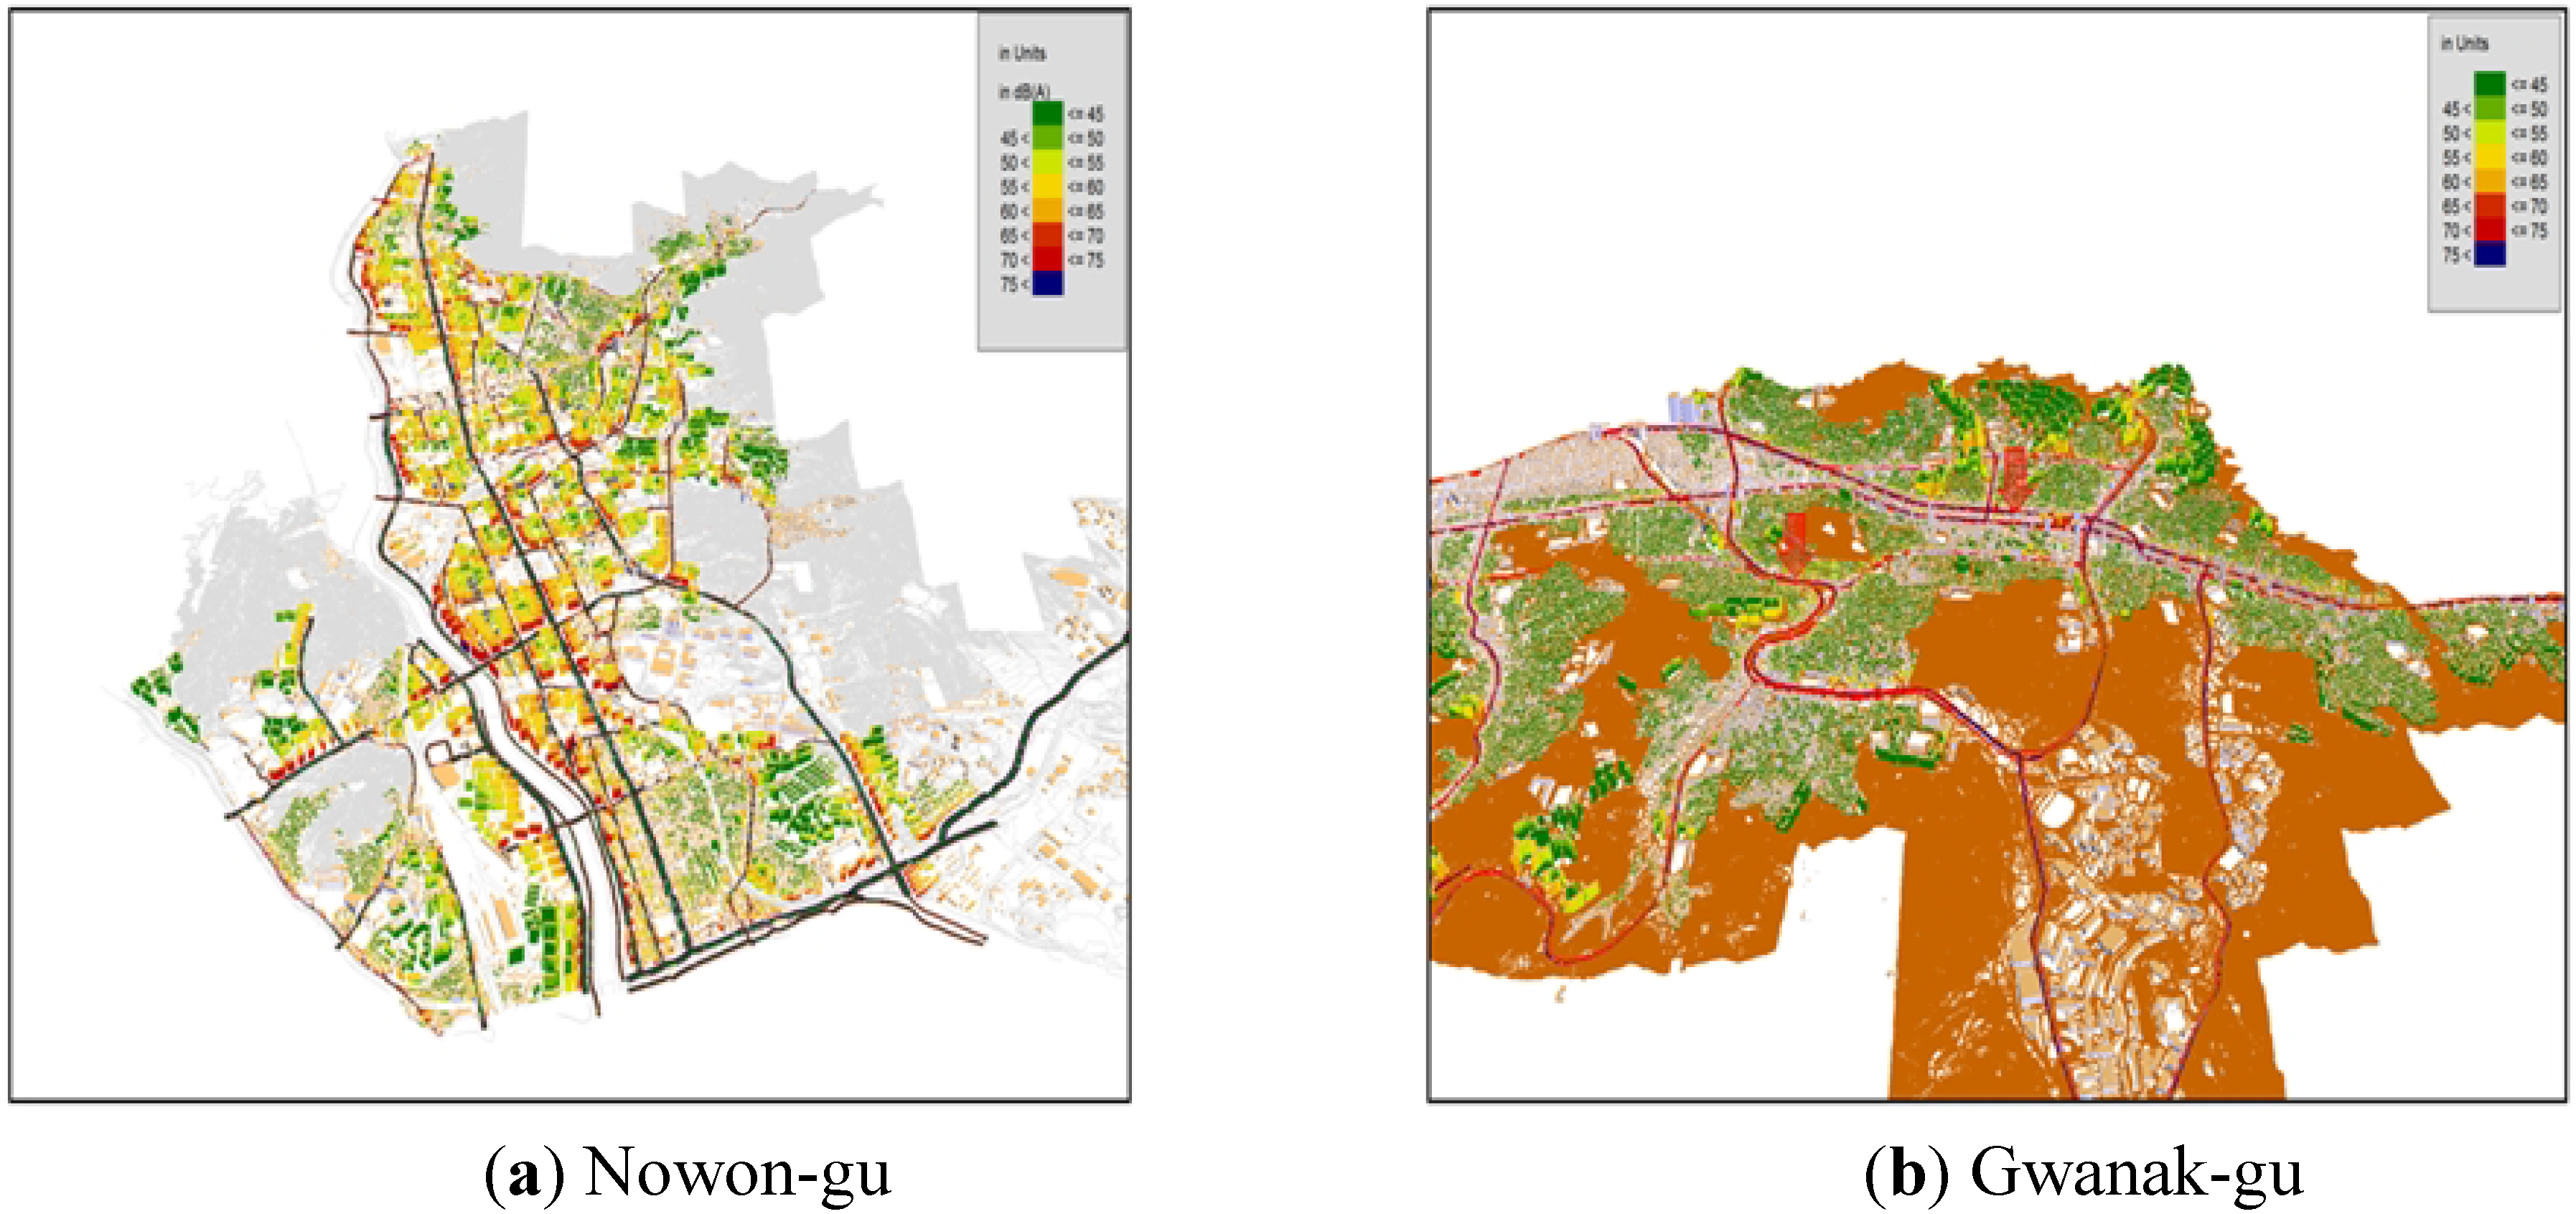
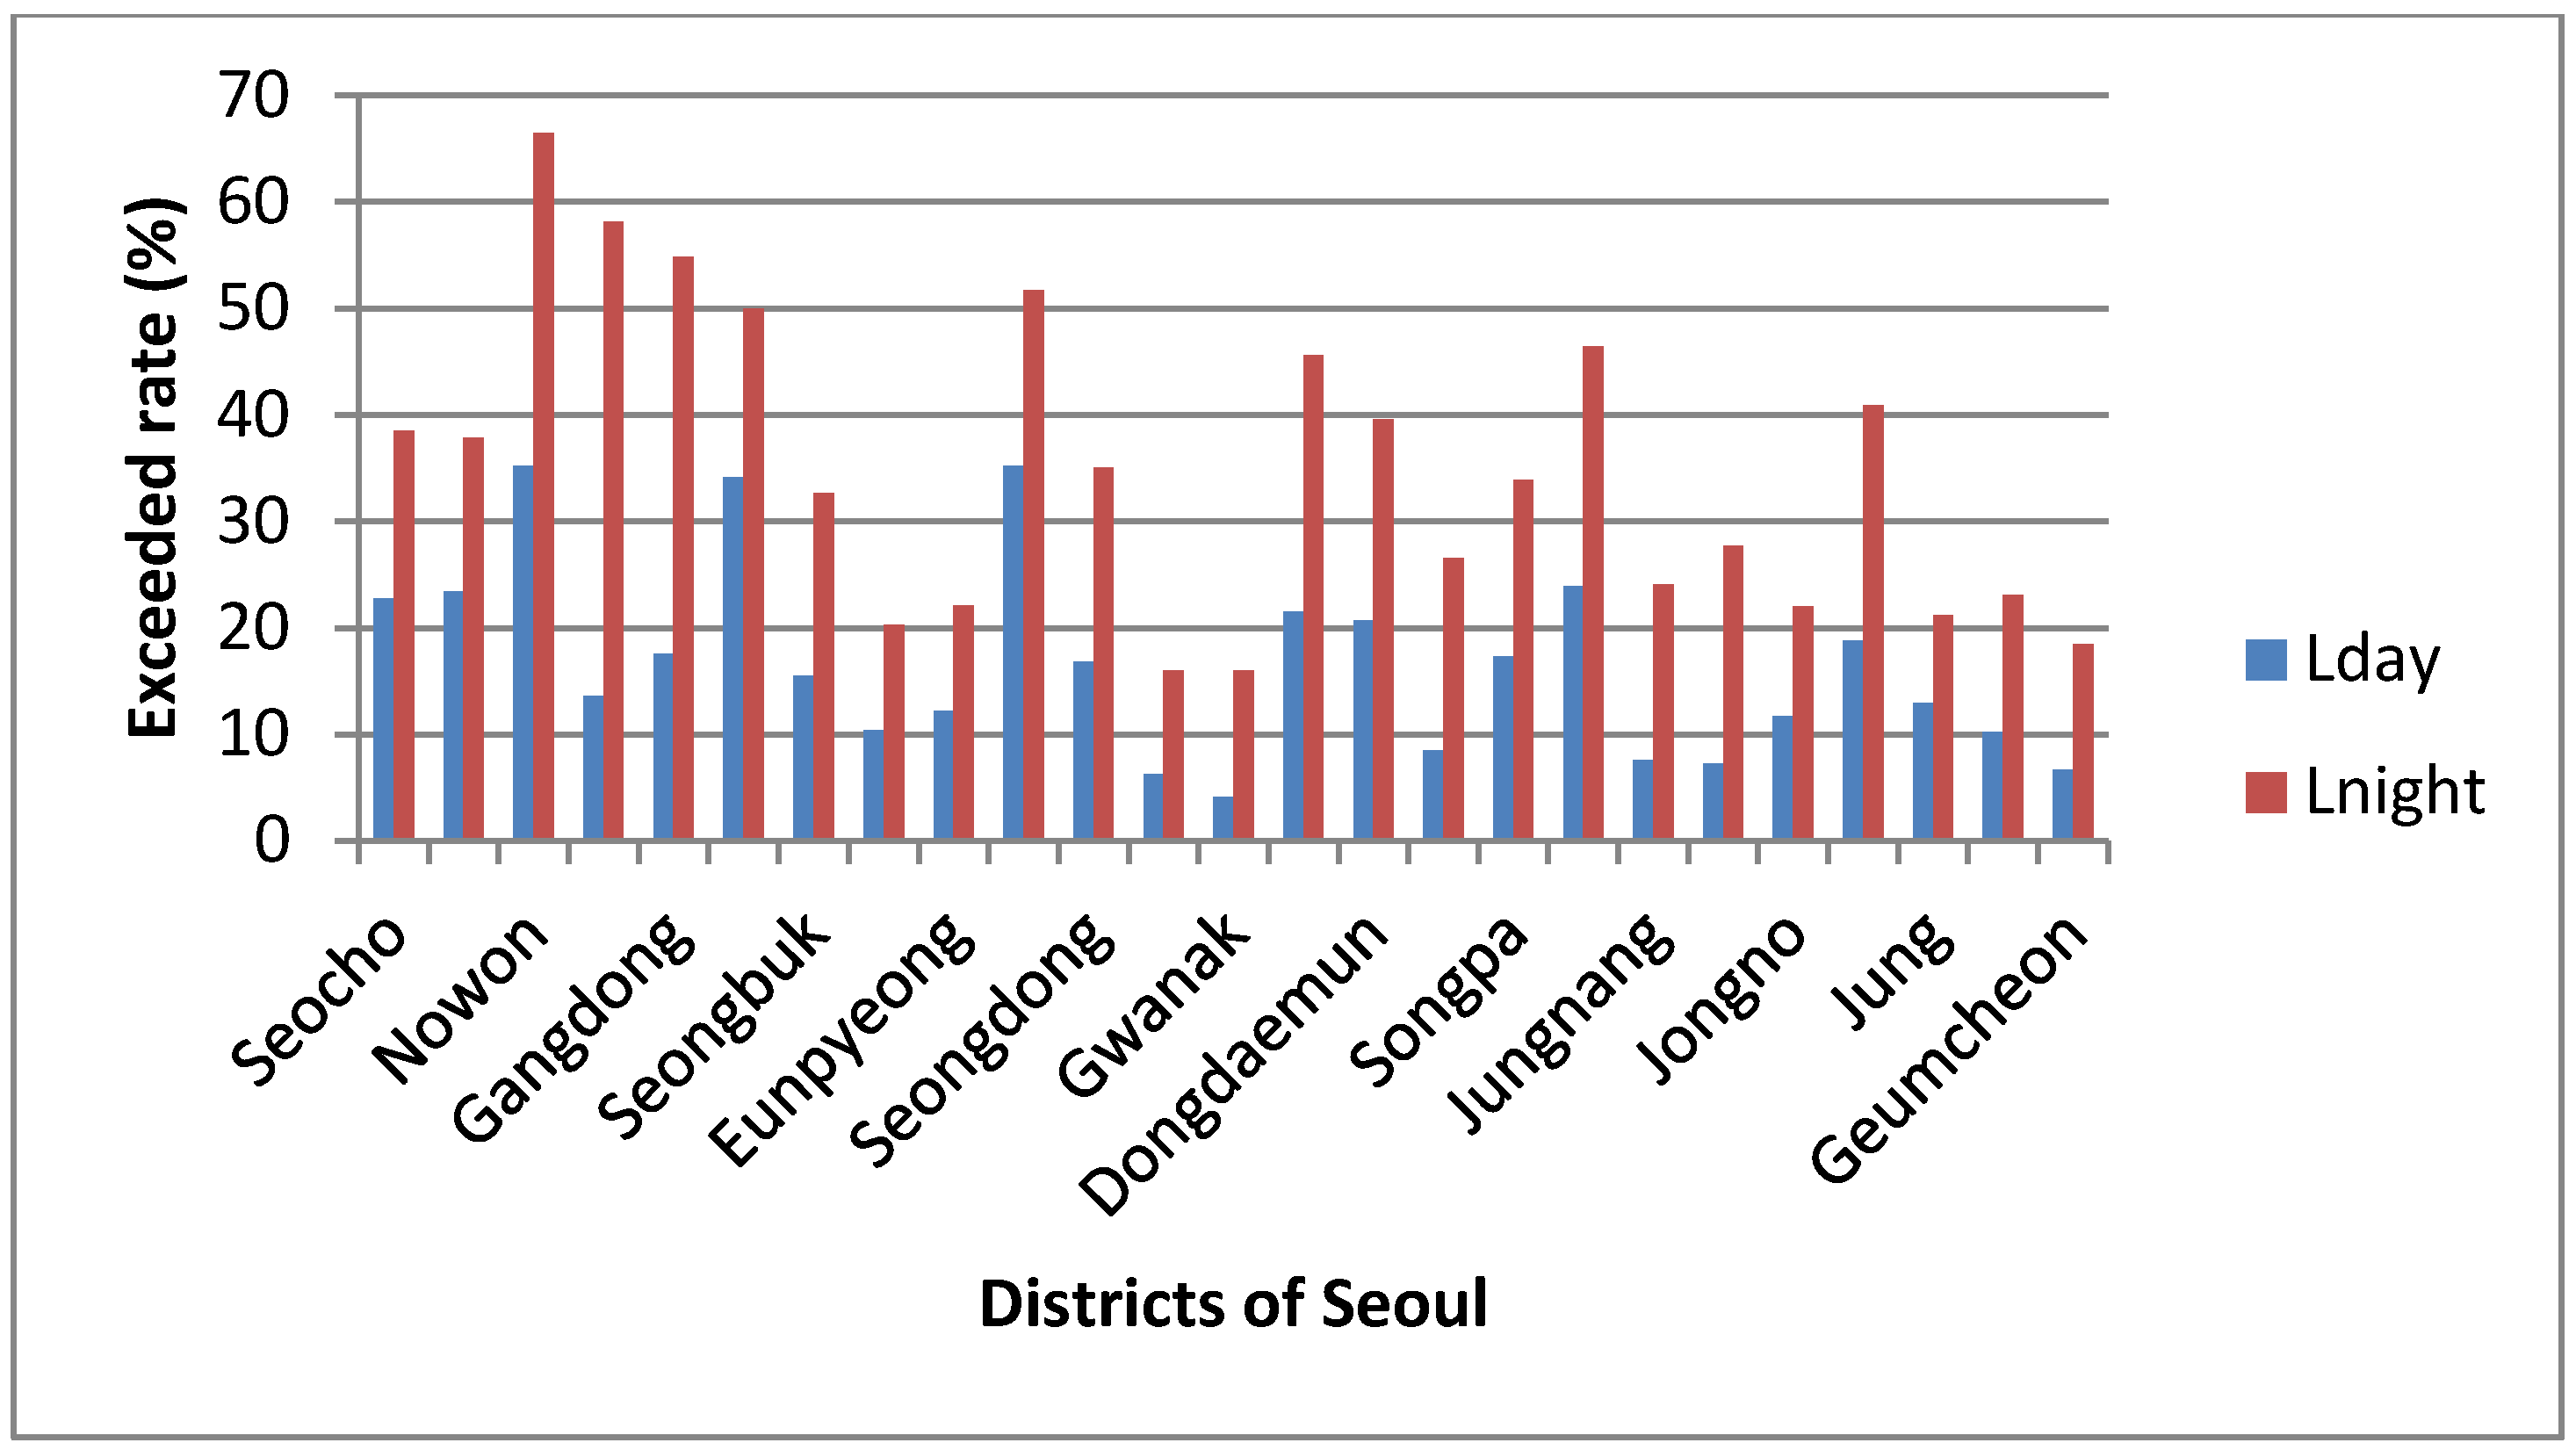
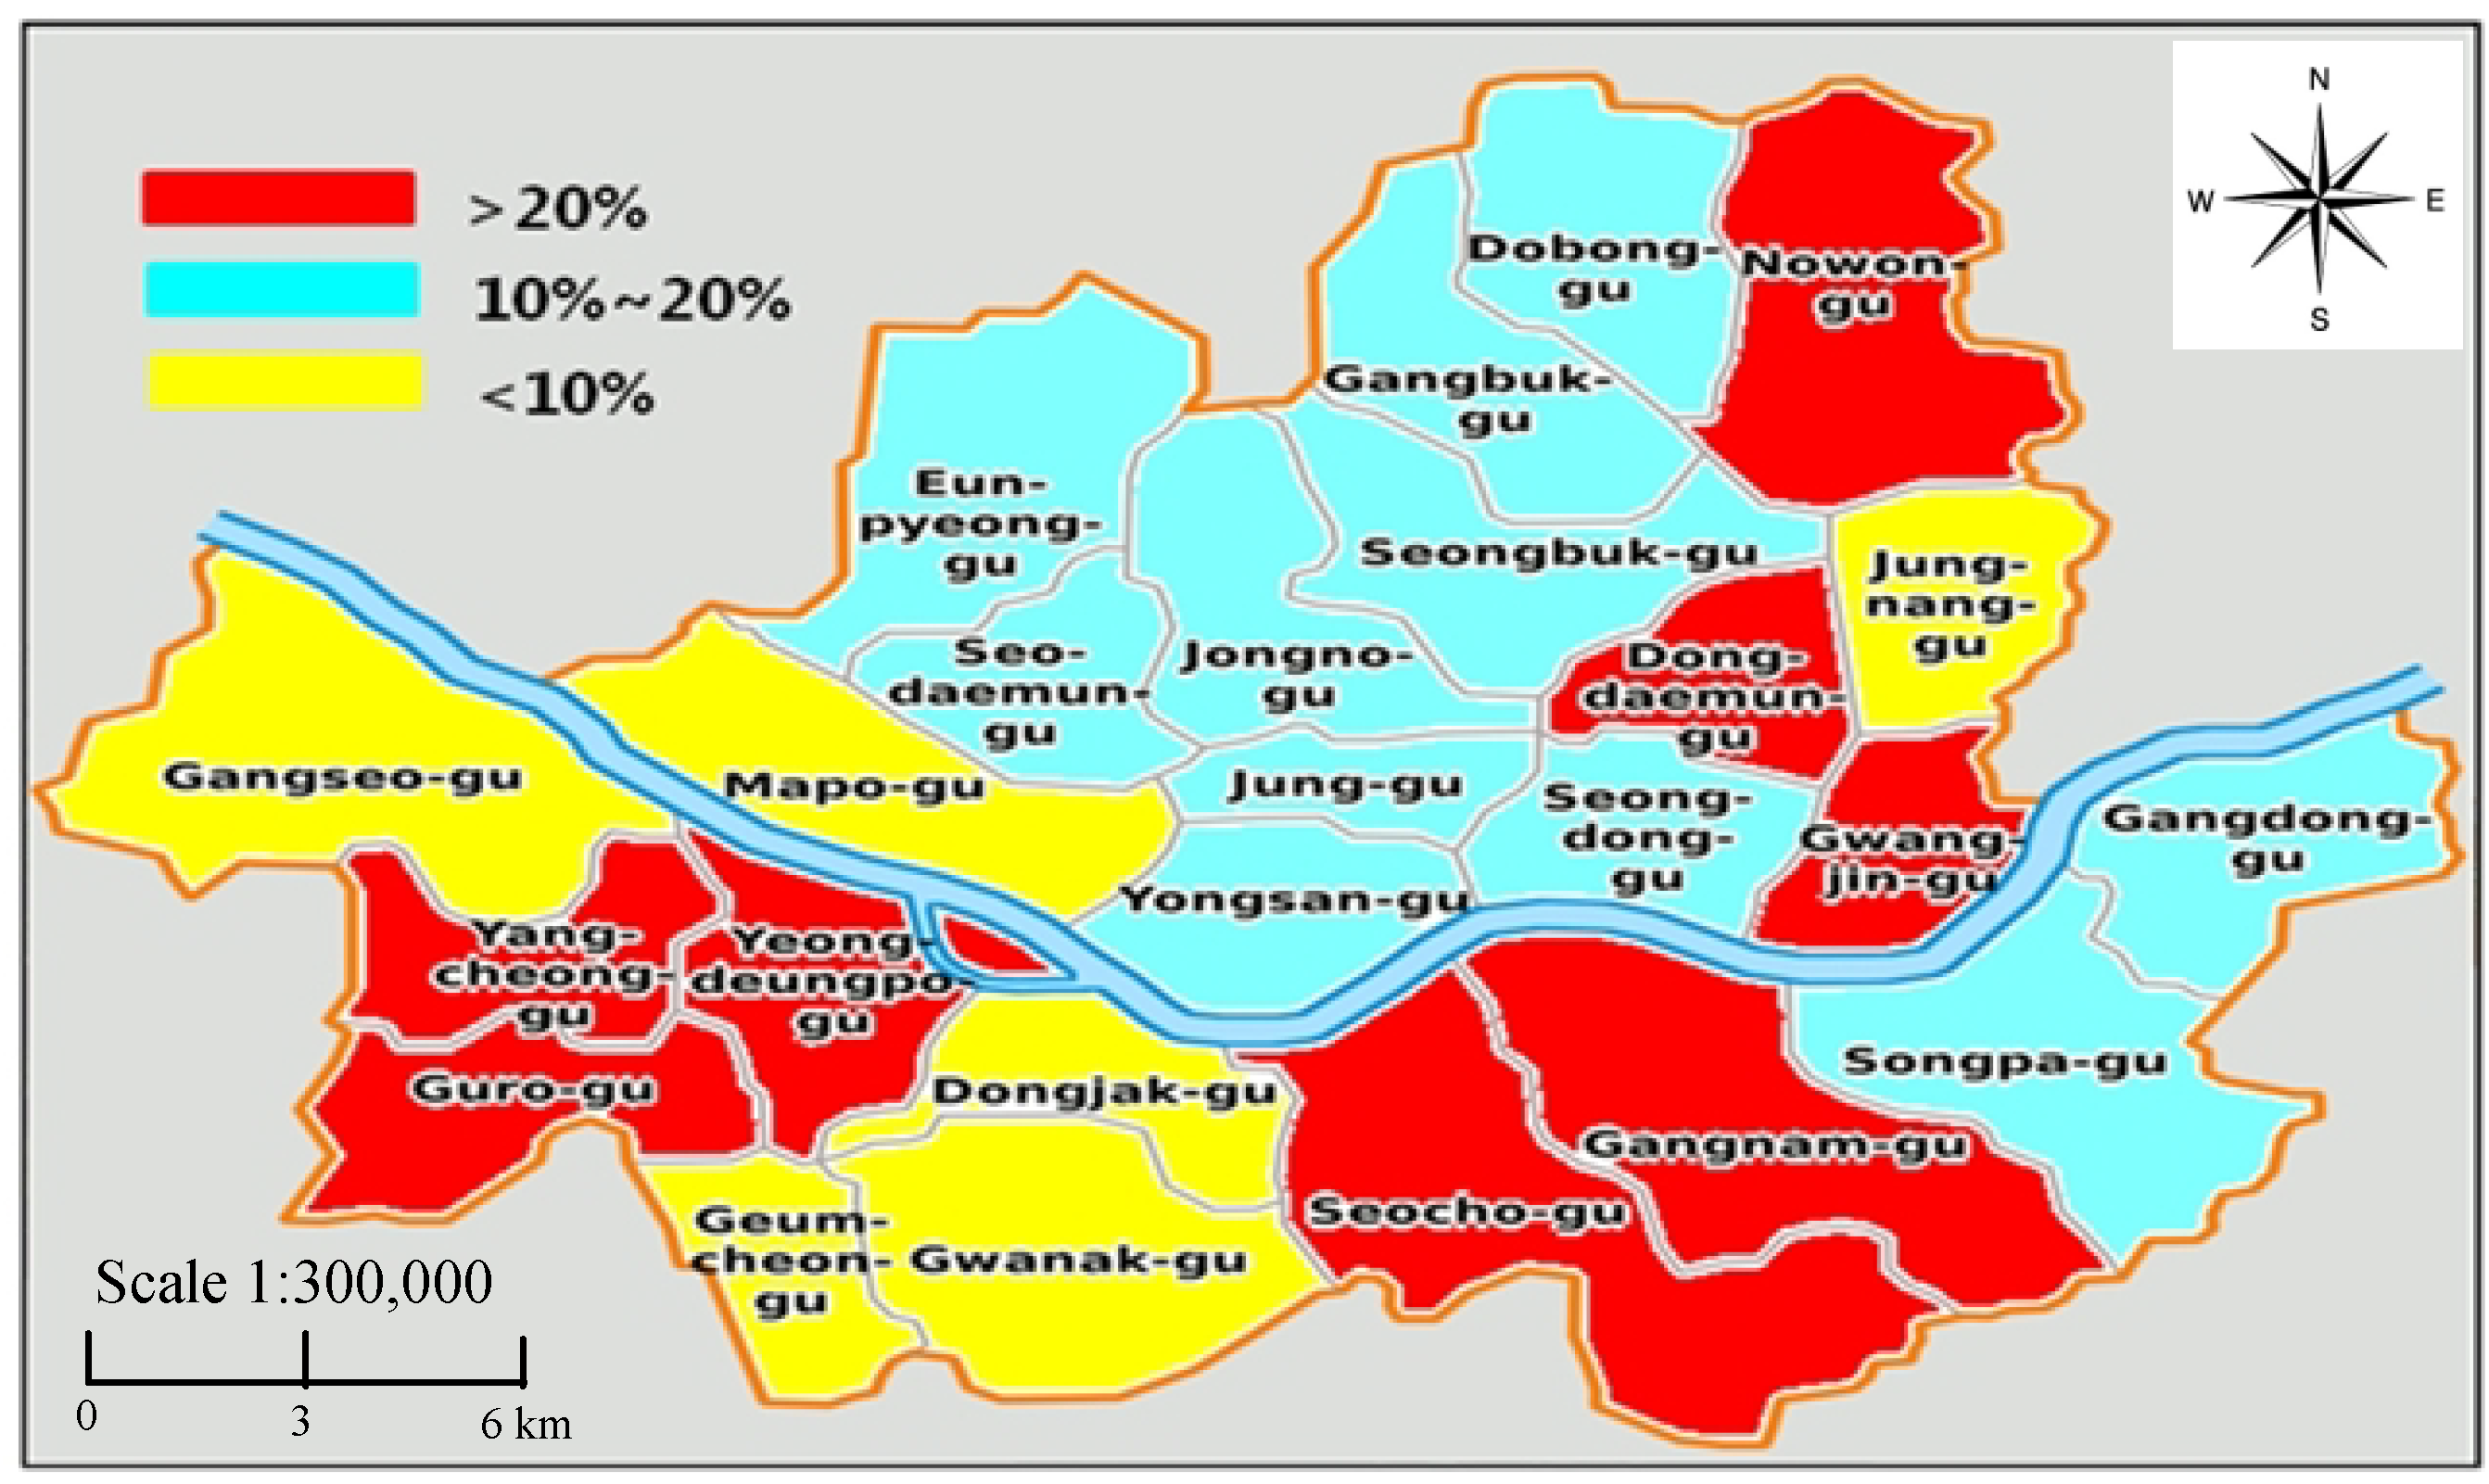
3.3. Estimation of Exposed Population of Road Traffic Noise by District in Seoul

Exposed population by noise levels in Seoul was estimated using a 3-D noise map. The percentage of the exposed population exceeding the standards [daytime: 65 dB(A), nighttime: 55 dB(A)] is shown in Figure 6.
As shown in Figure 6, it was revealed that eight districts (Seocho, Nowon, etc.) were found to have exceeded rate (percentage of exposed population exceeding the daytime standard) by more than 20%, and 11 districts (Dobong, Gangdong, etc.) had 10–20% and six districts (Gwanak, Geumcheon, etc.) had less than 10%, which shows considerable differences by districts. Particularly, the exceeded rate was highest (35.2%) at Nowon-gu and Yangcheon-gu since large-scale dwelling houses were constructed near the major roads in these two districts. There is an urgent need to manage the traffic noise to protect the residents of these two districts against the potential ill health effects. Moreover, for the nighttime noise levels, we found that five districts (Nowon, Dobong, etc.) had exceeded rate (percentage of exposed population exceeding the nighttime standard) by more than 50% and nine districts had 30–50%. Nowon-gu was highest in the exceeded rate of the nighttime standard (66.5%) as well as the daytime standard (35.2%). Additionally, the exceeded rates of the nighttime standard were higher than those of the daytime standard in all districts of Seoul, which means that a reduction measure should be primarily set for nighttime traffic noise.
The distribution map for the population exposed to traffic noise by whole districts of Seoul is represented in Figure 7. Districts that exceeded the rate by more than 20% and less than 10% were mostly on the southern part of the Han-river. This map can be favorably used as a road traffic noise indicator to establish the reduction goal and determine the priority of a reduction policy.
Figure 7. The distribution map for population exposed to traffic noise in Seoul.
Ijerph 11 02729 g007
In Figure 8, proportions of the noise exposed population exceeding the daytime [65 dB(A)] and nighttime [55 dB(A)] standards in Seoul were compared with those of major cities in the EU. As shown in Figure 8, the average exceeded rate of the daytime standard in Seoul was approximately 16.6% which is almost 3.6% higher than that of the EU (13.0%). The average exceeded rates of the nighttime standard in Seoul and the EU were 34.8% and 16.1%, respectively. The differences in the average exceeded rates of daytime and nighttime standards between Seoul and EU were 3.6% and 18.7%, respectively. These data reveal that the Seoul metropolitan area is vulnerable, especially to nighttime road traffic noise and has the potential to cause serious annoyance and sleep disturbance. A proper reduction policy should urgently be taken for nighttime traffic noise.
Figure 8. Comparison of exceeded rate in Seoul and major cities of the EU.
Ijerph 11 02729 g008

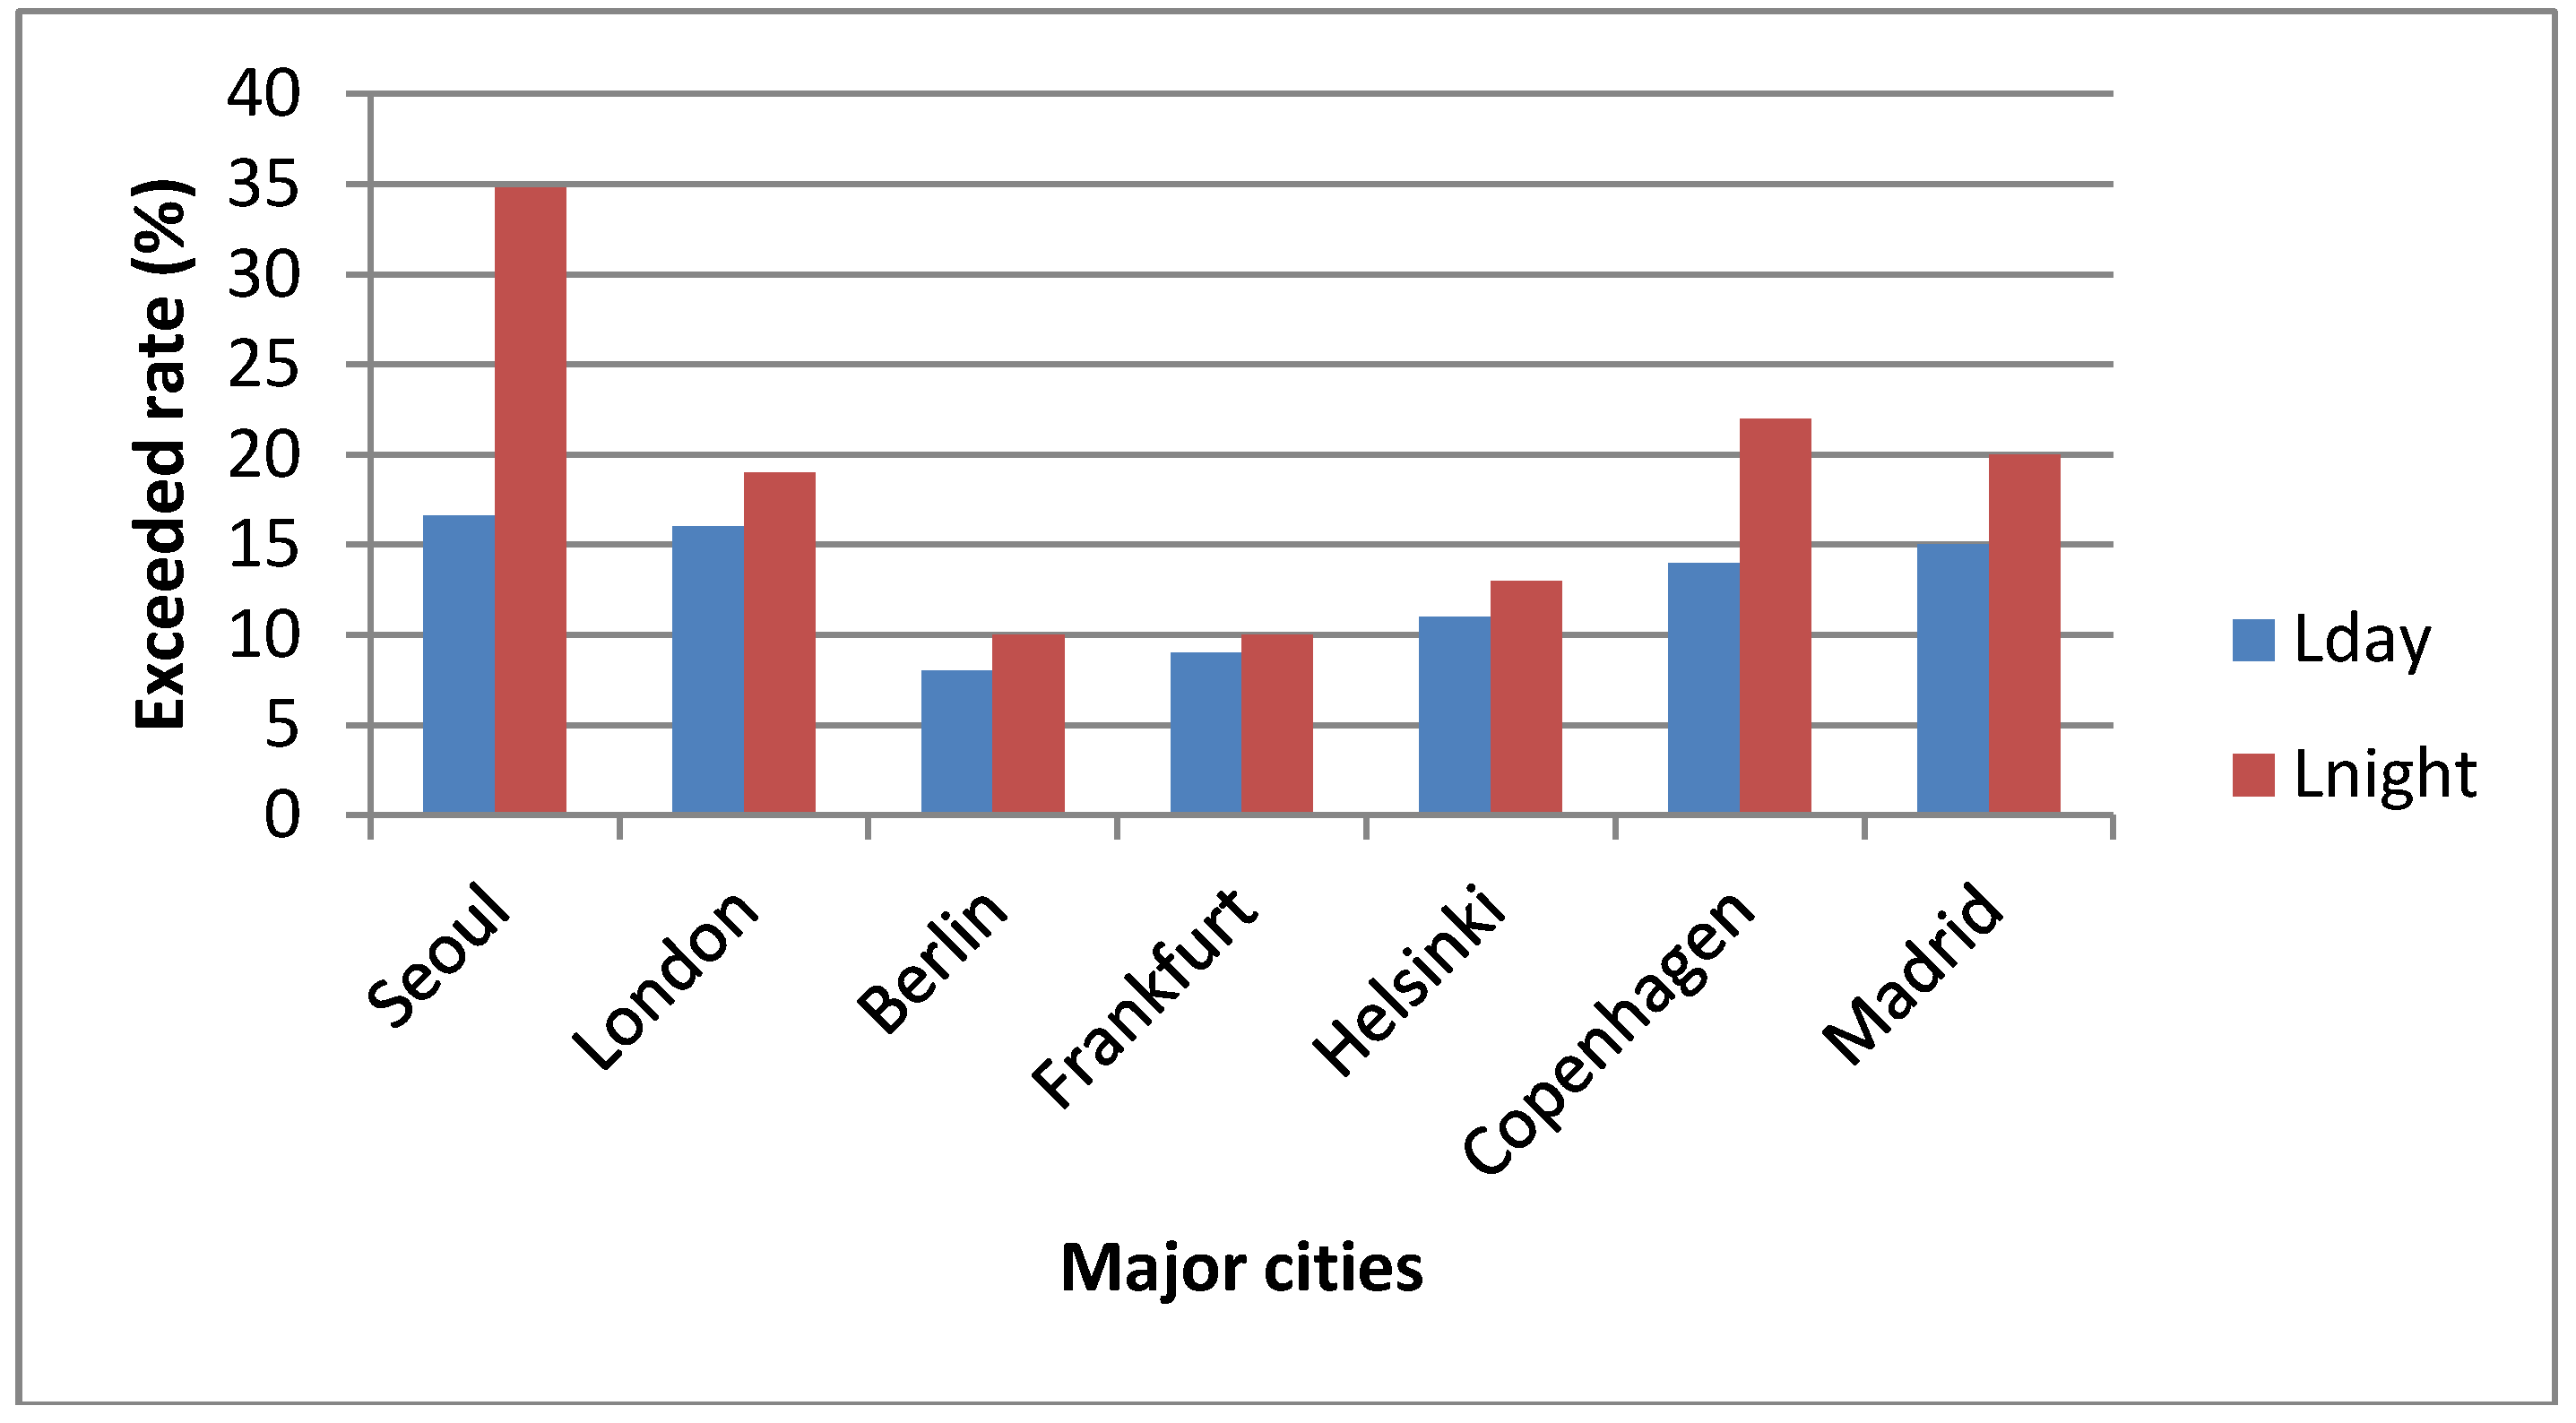
3.4. Comparison of Population Exposed to Road Traffic Noise by Estimation Methods

Previously, we mentioned that the population exposed to noise can be estimated using the grid noise map or the 3-D façade noise map. We compared the estimation results for Nowon-gu/Yangcheon-gu (having high exceeded rates) and Gwanak-gu/Geumcheon-gu (having low exceeded rates) using the above 2 different methods. Table 2 describes the percentage of the exposed population by noise levels using the above 2 methods.
Table 2. Percentage of exposed population by noise levels using two different methods.
Noise Level
Ld, dB(A)
Percentage of Population Exposed to Noise (%)
NowonYangcheonGwanakGeumcheon
Using Grid MapUsing Façade MapUsing Grid MapUsing Façade MapUsing Grid MapUsing Façade MapUsing Grid MapUsing Façade Map
<4977.319.595.131.395.072.083.762.9
50–545.011.41.210.00.79.63.59.8
55–593.314.80.811.00.68.13.411.5
60–643.019.10.612.50.66.13.09.1
65–693.923.50.618.90.93.52.46.1
>707.511.71.716.32.20.64.00.6
The exposed population, in grid noise map method, is calculated by (area by noise level/population density). In this case, the areas of high noise levels are relatively smaller than low noise levels since they are limited to the roadside. Therefore, as shown in Table 2, the population exposed to lower noise levels is normally over-estimated. In the case of Yangcheon-gu, the population exposed to noise level below 49 dB(A) was 95.1%, which means the population exposed to higher noise levels is much more under-estimated in the grid noise map method. This method is not adequate to estimate the exposed population accurately for the Seoul metropolitan area where the houses are mostly concentrated near the road. However, since the 3-D façade noise map method considers the residential area per population as well as the noise level of the building, the results reflect the concentration density of population by districts and status of residential types. For this reason, the 3-D façade map method is far more accurate in estimating the population exposed to noise and can be effectively utilized in preparing the noise reduction plan.

4. Conclusions

We developed a 3-D noise map to estimate the road traffic noise levels and estimated the populations exposed to road traffic noise for 25 districts of the Seoul metropolitan area. The average traffic volumes and light/heavy vehicles ratios for selected road noise sources were acquired from the Department of Transportation and the Police Agency of City of Seoul. The average exceeded rates of the exposed population to road traffic noise of daytime [65 dB(A)] and nighttime [55 dB(A)] standards in whole districts of Seoul were estimated to be 16.6% and 34.8%, respectively. Two districts (Nowon-gu and Yangcheon-gu) were found to be the highest in noise exposure percentage (35.2%) over the daytime standard. For nighttime noise levels, five districts had exceeded rates (percentage of exposed population exceeding the nighttime standard) by over 50%. Nowon-gu took the 1st place in the exceeded rate of the nighttime standard (66.5%) as well as the daytime standard (35.2%). The exceeded rates of the nighttime standard were higher than those of the daytime standard in all districts of Seoul, which means reduction measures should be primarily taken for nighttime traffic noise. The differences in average exceeded rates of daytime and nighttime standards between Seoul and the EU were 3.6% and 18.7%, respectively. The percentage of the exposed population by different noise levels was compared using two different methods and we confirmed that the 3-D façade noise map method was far more accurate than grid noise map method.

Acknowledgements

This research was supported by the Environmental R and D program (No: 2011-1354) of the National Institute of Environmental Research funded by the Ministry of Environment of Korea.

Author Contributions

Hyunggyu Park, Samsoo Kim and Heekyung Yun investigated the input data required to modeling work and also carried out the preparation of noise map. Jaewon Lee and Jinhoi Gu were responsible for actual modeling work and Jinseok Han, Wooseok Lee and Jun-Seok Cha were involved in the verification of the modeling work. Jaewon Lee drafted the manuscript, which was revised by all authors. All of the authors read and approved the final manuscript.

Conflicts of Interest

The authors declare that there is no conflict of interest.

References

  1. Kim, M.H.; Chang, S.I.; Seong, J.C.; Holt, J.B.; Park, T.H.; Ko, J.H.; Croft, J.B. Road traffic noise—Annoyance, sleep disturbance and public health implications. Am. J. Prev. Med. 2012, 43, 353–360. [Google Scholar] [CrossRef]
  2. Van, K.E.; Kruize, A.; Boshuizen, H.C.; Ameling, C.B.; Staatsen, B.A.M.; de Hollander, A.E.M. The association between noise exposure and blood pressure and ischemic heart disease: A meta-analysis. Environ. Health Perspect. 2002, 110, 307–317. [Google Scholar] [CrossRef]
  3. Babisch, W. Noise and health. Environ. Health Perspect. 2005, 113, 14–15. [Google Scholar] [CrossRef]
  4. Murphy, E.; King, E.A.; Rice, H.J. Estimating human exposure to transport noise in central Dublin, Ireland. Environ. Int. 2009, 35, 298–302. [Google Scholar] [CrossRef]
  5. Sobotova, L.; Jurkovicova, J.; Stefanikova, Z.; Sevcikova, L.; Aghova, L. Community response to environmental noise and the impact on cardiovascular risk score. Sci. Tot. Environ. 2010, 408, 1264–1270. [Google Scholar] [CrossRef]
  6. Fyhri, A.; Klaboe, R. Road traffic noise, sensitivity, annoyance and self-reported health—A structural equation model exercise. Environ. Int. 2009, 35, 91–97. [Google Scholar] [CrossRef]
  7. Torija, A.J.; Ruiz, D.P.; Coensel, B.D.; Botteldooren, D.; Berglund, B.; Ramos-Ridao, A. Relationship between road and railway noise annoyance and overall indoor sound exposure. Trans. Res. Part D 2011, 16, 15–22. [Google Scholar] [CrossRef]
  8. Yoshida, T.; Osada, Y.; Kawaguchi, T.; Hoshiyama, Y.; Yoshida, K.; Yamamoto, K. Effects of road traffic noise on inhabitants of Tokyo. J. Sound Vib. 1997, 205, 517–522. [Google Scholar] [CrossRef]
  9. Ising, H.; Babisch, W.; Kruppa, B. Noise-induced endocrine effects and cardiovascular risk. Noise Health 1999, 4, 37–48. [Google Scholar]
  10. Rylander, R. Physiological aspects of noise-induced stress and annoyance. J. Sound Vib. 2004, 277, 471–478. [Google Scholar] [CrossRef]
  11. Timothy, V.R.; Dick, B. Focused study on the quiet side effect in dwellings highly exposed to road traffic noise. Int. J. Environ. Res. Public Health 2012, 9, 4292–4310. [Google Scholar] [CrossRef] [Green Version]
  12. Yvonne, K.; Sabine, A.J.; Henk, V.; Erik, M.S.; Han, Z.; Frits, B. Road traffic noise and annoyance: A quantification of the effect of quiet side exposure at dwellings. Int. J. Environ. Res. Public Health 2013, 10, 2258–2270. [Google Scholar] [CrossRef]
  13. Kurra, S.; Morimoto, M.; Maekawa, Z.I. Transportation noise annoyance-A simulated environment study for road, railway and aircraft noises, Part 1: Overall annoyance. J. Sound Vib. 1999, 220, 251–278. [Google Scholar] [CrossRef]
  14. Ali, S.A.; Tamura, A. Road traffic noise levels, restrictions and annoyance in Greater Cairo, Egypt. Appl. Acoust. 2003, 64, 815–823. [Google Scholar] [CrossRef]
  15. Chang, T.Y.; Lin, H.C.; Yang, W.T.; Bao, B.Y.; Chan, C.C. A modified Nordic prediction model of road traffic noise in a Taiwanese city with significant motorcycle traffic. Sci. Tot. Environ. 2012, 432, 375–382. [Google Scholar] [CrossRef]
  16. Chang, T.Y.; Liu, C.S.; Bao, B.Y.; Li, S.F.; Chen, T.I.; Lin, Y.J. Characterization of road traffic noise exposure and prevalence of hypertension in central Taiwan. Sci. Tot. Environ. 2011, 409, 1053–1057. [Google Scholar] [CrossRef]
  17. Directive, E.U. Directive 2002/49/EC of the European Parliament and of the Council of 25 June 2002 relating to the assessment and management of environmental noise. Off. J. Eur. Communities 2002, 18, 12–25. [Google Scholar]
  18. Ko, J.H.; Chang, S.I.; Kim, M.H.; Holt, J.B.; Seong, J.C. Transportation noise and exposed population of an urban area in the Republic of Korea. Environ. Int. 2011, 37, 328–334. [Google Scholar] [CrossRef]
  19. Seong, J.C.; Park, T.H.; Ko, J.H.; Chang, S.I.; Kim, M.H.; Holt, J.B.; Mehdi, M.R. Modeling of road traffic noise and estimated human exposure in Fulton County, Georgia, USA. Environ. Int. 2011, 37, 1336–1341. [Google Scholar] [CrossRef]
  20. Lam, K.C.; Chung, Y.T. Exposure of urban populations to road traffic noise in Hong Kong. Trans. Res. Part D 2012, 17, 466–472. [Google Scholar] [CrossRef]
  21. Lam, K.C.; Ma, W.C. Road traffic noise exposure in residential complexes built at different times between 1950 and 2000 in Hong Kong. Appl. Acoust. 2012, 73, 1112–1120. [Google Scholar] [CrossRef]
  22. Banerjee, D.; Chakraborty, S.K.; Bhattacharyya, S.; Gangopadhyay, A. Modeling of road traffic noise in the industrial town of Asansol, India. Trans. Res. Part D 2008, 13, 539–541. [Google Scholar] [CrossRef]
  23. Mehdi, M.R.; Kim, M.; Seong, J.C.; Arsalan, M.H. Spatio-temporal patterns of road traffic noise in Karachi, Pakistan. Environ. Int. 2011, 37, 97–104. [Google Scholar] [CrossRef]
  24. Chang, S.I. Noise Map, Annoyance Study and Health Study; U.S. Centers for Disease Control and Prevention: Atlanta, GA, USA, 2009.

