Water Quality Assessment in the Harbin Reach of the Songhuajiang River (China) Based on a Fuzzy Rough Set and an Attribute Recognition Theoretical Model

Abstract
:
1. Introduction
2. Materials and Methods
2.1. Water Quality Samples
2.2. Fuzzy Rough Set Attribute Reduction
 is the value set of attribute a, f: U × A → V is an information function, given by the expression (∀(x,a) ∈ U × A, f (x,a) ∈ Va). The FRS attribute reduction steps can be expressed as follows [26,27]:


2.3. Entropy Method

 , k = 1/ln m. When fij = 0, assume that fij ln fij = 0.
2.4. Attribute Recognition Theoretical Model


3. Results and Discussion
3.1. Statistical Analysis

| Parameters | I | II | III | IV | V |
|---|---|---|---|---|---|
| pH | 6–9 | ||||
| DO (mg/L) | ≥7.5 | ≥6 | ≥5 | ≥3 | ≥2 |
| CODMn (mg/L) | ≤2 | ≤4 | ≤6 | ≤10 | ≤15 |
| COD (mg/L) | ≤15 | ≤15 | ≤20 | ≤30 | ≤40 |
| BOD5 (mg/L) | ≤3 | ≤3 | ≤4 | ≤6 | ≤10 |
| NH3-N (mg/L) | ≤0.15 | ≤0.5 | ≤1.0 | ≤1.5 | ≤2.0 |
| TP (mg/L) | ≤0.02 | ≤0.1 | ≤0.2 | ≤0.3 | ≤0.4 |
| TN (mg/L) | ≤0.2 | ≤0.5 | ≤1.0 | ≤1.5 | ≤2.0 |
| F (mg/L) | ≤1.0 | ≤1.0 | ≤1.0 | ≤1.5 | ≤1.5 |
| F. coli (cfu/L) | ≤200 | ≤2,000 | ≤10,000 | ≤20,000 | ≤40,000 |
| Parameters | Min–Max | Median | Mean | SD | CV | Permissible Limits | MNEPL a |
|---|---|---|---|---|---|---|---|
| pH (a1) | 7.16–8.55 | 7.52 | 7.61 | 0.401 | 0.0527 | 6–9 | 0 |
| DO (a2) | 4.8–13 | 7.7 | 8.44 | 2.6073 | 0.3089 | ≥5 | 1 |
| CODMn (a3) | 3.12–6.48 | 5.04 | 5.209 | 0.9733 | 0.1868 | ≤6 | 2 |
| COD (a4) | 12–23 | 16.5 | 16.8 | 3.49 | 0.2077 | ≤20 | 1 |
| BOD5 (a5) | 1–4.6 | 2.4 | 2.69 | 1.4255 | 0.5299 | ≤4 | 3 |
| NH3-N (a6) | 0.12–1.07 | 0.44 | 0.535 | 0.3868 | 0.7229 | ≤1.0 | 2 |
| TP (a7) | 0.04–0.69 | 0.07 | 0.144 | 0.1978 | 1.3738 | ≤0.2 | 1 |
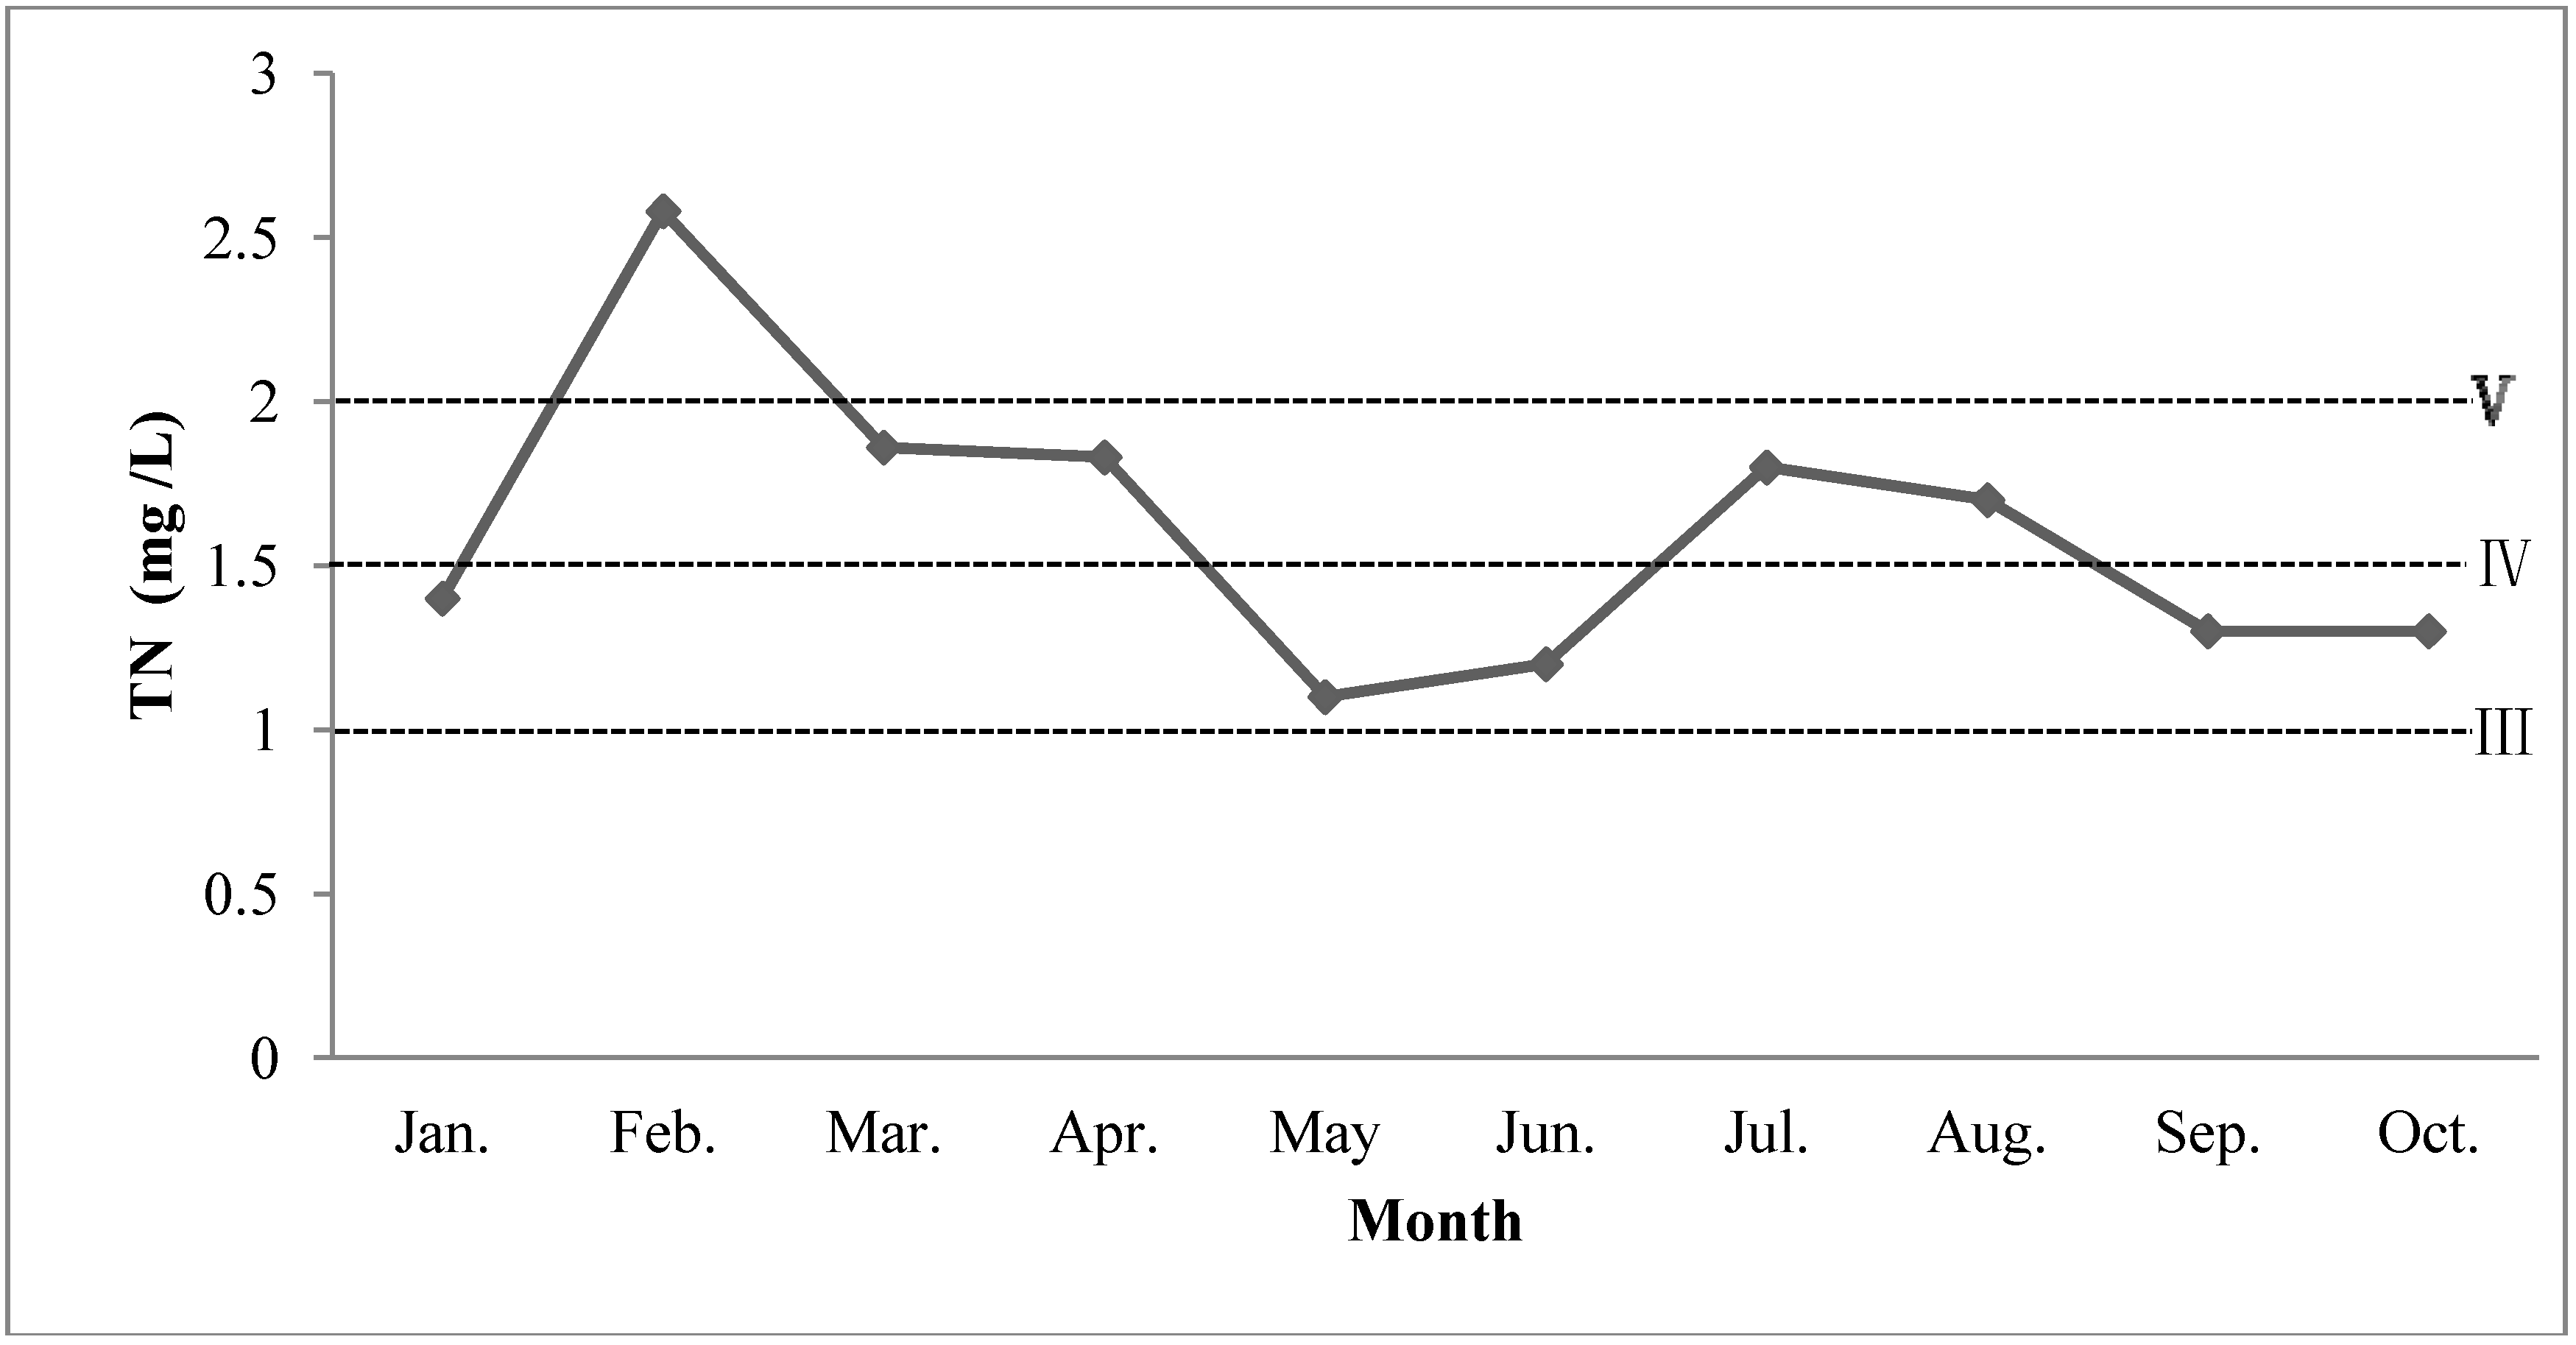
| TN (a8) | 1.1–2.58 | 1.55 | 1.607 | 0.4423 | 0.2752 | ≤1.0 | 10 |
| F (a9) | 0.24–0.38 | 0.3 | 0.298 | 0.0419 | 0.1404 | ≤1.0 | 0 |
| F. coli (a10) | 20–24,196 | 1,514 | 3,793.4 | 7,227.91 | 1.9054 | ≤10,000 | 1 |
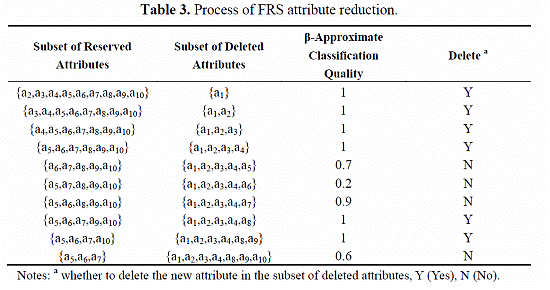
3.2. Parameters Attribute Reduction

| Subset of Reserved Attributes | Subset of Deleted Attributes | β-Approximate Classification Quality | Delete a |
|---|---|---|---|
| {a2,a3,a4,a5,a6,a7,a8,a9,a10} | {a1} | 1 | Y |
| {a3,a4,a5,a6,a7,a8,a9,a10} | {a1,a2} | 1 | Y |
| {a4,a5,a6,a7,a8,a9,a10} | {a1,a2,a3} | 1 | Y |
| {a5,a6,a7,a8,a9,a10} | {a1,a2,a3,a4} | 1 | Y |
| {a6,a7,a8,a9,a10} | {a1,a2,a3,a4,a5} | 0.7 | N |
| {a5,a7,a8,a9,a10} | {a1,a2,a3,a4,a6} | 0.2 | N |
| {a5,a6,a8,a9,a10} | {a1,a2,a3,a4,a7} | 0.9 | N |
| {a5,a6,a7,a9,a10} | {a1,a2,a3,a4,a8} | 1 | Y |
| {a5,a6,a7,a10} | {a1,a2,a3,a4,a8,a9} | 1 | Y |
| {a5,a6,a7} | {a1,a2,a3,a4,a8,a9,a10} | 0.6 | N |
3.3. Weights of Parameters
| Parameters | Information Entropy | Weight |
|---|---|---|
| BOD5 | 0.8617 | 0.3701 |
| NH3-N | 0.8579 | 0.3802 |
| TP | 0.9528 | 0.1263 |
| F. coli | 0.9539 | 0.1234 |
3.4. Water Quality Assessment
| Methods | Reducts | Jan. | Feb. | Mar. | Apr. | May | Jun. | Jul. | Aug. | Sep. | Oct. |
|---|---|---|---|---|---|---|---|---|---|---|---|
| With attribute reduction | Reduct A | Ⅲ | Ⅲ | Ⅲ | Ⅲ | Ⅲ | Ⅱ | Ⅱ | Ⅱ | Ⅳ | Ⅱ |
| Reduct B | Ⅲ | Ⅲ | Ⅲ | Ⅲ | Ⅲ | Ⅱ | Ⅱ | Ⅱ | Ⅳ | Ⅱ | |
| Reduct C | Ⅲ | Ⅲ | Ⅲ | Ⅲ | Ⅱ | Ⅱ | Ⅲ | Ⅲ | Ⅳ | Ⅱ | |
| Reduct D | Ⅲ | Ⅲ | Ⅲ | Ⅲ | Ⅱ | Ⅲ | Ⅲ | Ⅲ | Ⅲ | Ⅲ | |
| Reduct E | Ⅲ | Ⅲ | Ⅲ | Ⅲ | Ⅲ | Ⅱ | Ⅱ | Ⅱ | Ⅲ | Ⅱ | |
| Reduct F | Ⅲ | Ⅱ | Ⅲ | Ⅲ | Ⅲ | Ⅱ | Ⅱ | Ⅱ | Ⅳ | Ⅱ | |
| Without attribute reduction | Ⅲ | Ⅲ | Ⅲ | Ⅲ | Ⅲ | Ⅱ | Ⅲ | Ⅲ | Ⅲ | Ⅱ |
4. Conclusions
Acknowledgments
Author Contributions
Conflicts of Interest
References
- Li, Z.; Huang, G.; Zhang, Y.M.; Li, Y.P. Inexact two-stage stochastic credibility constrained programming for water quality management. Resour. Conserv. Recycl. 2013, 73, 122–132. [Google Scholar]
- Huang, Y.L.; Huang, G.H.; Liu, D.F.; Zhu, H.; Sun, W. Simulation-based inexact chance-constrained nonlinear programming for eutrophication management in the Xiangxi Bay of Three Gorges Reservoir. J. Environ. Manage. 2012, 108, 54–65. [Google Scholar] [CrossRef]
- Wang, F.; Wang, X.; Znao, Y.; Yang, Z.F. Long-term water quality variations and chlorophyll a simulation with an emphasis on different hydrological periods in Lake Baiyangdian, northern China. J. Environ. Inform. 2012, 20, 90–102. [Google Scholar] [CrossRef]
- Deviney, F.A., Jr.; Brown, D.E.; Rice, K.C. Evaluation of bayesian estimation of a hidden continuous-time markov chain model with application to threshold violation in water-quality indicators. J. Environ. Inform. 2012, 19, 70–78. [Google Scholar]
- Liu, D.J.; Zou, Z.H. Water quality evaluation based on improved fuzzy matter-element method. J. Environ. Sci. 2012, 24, 1210–1216. [Google Scholar] [CrossRef]
- Wang, X.J.; Zou, Z.H.; Zou, H. Using discriminant analysis to assess Polycyclic aromatic hydrocarbons contamination in Yongding New River. Environ. Monit. Assess. 2013, 185, 8547–8555. [Google Scholar] [CrossRef]
- Shrestha, S.; Kazama, F.; Nakamura, T. Use of principal component analysis, factor analysis and discriminant analysis to evaluate spatial and temporal variations in water quality of the Mekong River. J. Hydroinform. 2008, 10, 43–56. [Google Scholar] [CrossRef]
- Ni, S.H.; Bai, Y.H. Application of BP neural network model in groundwater quality evaluation. Syst. Eng.-Theory Pract. 2000, 20, 124–127. [Google Scholar]
- Hou, D.B.; He, H.M.; Huang, P.J.; Zhang, G.X.; Loaiciga, H. Detection of water-quality contamination events based on multi-sensor fusion using an extended Dempster-Shafer method. Meas. Sci. Technol. 2013, 24. [Google Scholar] [CrossRef]
- Sun, J.N.; Zou, Z.H.; Ren, G.P. Study on the fuzzy synthetic evaluation for natural water quality. Technol. Equip. Environ. Pollut. Control 2005, 6, 45–48. [Google Scholar]
- Zou, Z.H.; Sun, J.N.; Ren, G.P. Study and application on the entropy method for determination of weight of evaluating indicators in fuzzy synthetic evaluation for water quality assessment. Acta Sci. Circumstantiae 2005, 25, 552–556. [Google Scholar]
- Li, P.Y.; Qian, H.; Wu, J.H. Groundwater quality assessment based on improved water quality index in Pengyang County, Ningxia, Northwest China. E-J. Chem. 2010, 7, S209–S216. [Google Scholar] [CrossRef]
- Li, P.Y.; Qian, H.; Wu, J.H. Hydrochemical formation mechanisms and quality assessment of groundwater with improved TOPSIS method in Pengyang County Northwest China. E-J. Chem. 2011, 8, 1164–1173. [Google Scholar]
- Li, P.Y.; Wu, J.H.; Qian, H. Groundwater quality assessment based on rough sets attribute reduction and TOPSIS method in a semi-arid area, China. Environ. Monit. Assess. 2012, 184, 4841–4854. [Google Scholar] [CrossRef]
- Cheng, Q.S. Attribute recognition theoretical model with application. Acta Sci. Nat. Univ. Pekin. 1997, 33, 12–20. [Google Scholar]
- Li, P.Y.; Wu, J.H.; Qian, H. Groundwater quality assessment based on entropy weighted osculating value method. Int. J. Environ. Sci. 2010, 1, 621–630. [Google Scholar]
- Li, Z.W.; Fang, Y.; Zeng, G.M.; Li, J.B.; Zhang, Q.; Yuan, Q.S.; Wang, Y.M.; Ye, F.Y. Temporal and spatial characteristics of surface water quality by an improved universal pollution index in red soil hilly region of South China: A case study in Liuyanghe River watershed. Environ. Geol. 2009, 58, 101–107. [Google Scholar] [CrossRef]
- Li, P.Y.; Qian, H.; Wu, J.H. Application of set pair analysis method based on entropy weight in groundwater quality assessment—A case study in Dongsheng City, Northwest China. E-J. Chem. 2011, 8, 851–858. [Google Scholar] [CrossRef]
- Gamble, A.; Babbar-Sebens, M. On the use of multivariate statistical methods for combining in-stream monitoring data and spatial analysis to characterize water quality conditions in the White River Basin, Indiana, USA. Environ. Monit. Assess. 2012, 184, 845–875. [Google Scholar] [CrossRef]
- Zhang, X.; Wang, Q.; Liu, Y.F.; Wu, J.; Yu, M. Application of multivariate statistical techniques in the assessment of water quality in the Southwest New Territories and Kowloon, Hong Kong. Environ. Monit. Assess. 2011, 173, 17–27. [Google Scholar] [CrossRef]
- Pawlak, Z. Rough set. Int. J. Comput. Inform. Sci. 1982, 11, 341–356. [Google Scholar] [CrossRef]
- Ziarko, W. Variable precision rough set model. J. Comput. Syst. Sci. 1993, 46, 39–59. [Google Scholar] [CrossRef]
- Pawlak, Z.; Skowron, A. Rudiments of rough sets. Inform. Sci. 2007, 177, 3–27. [Google Scholar] [CrossRef]
- Yanto, I.T.R.; Vitasari, P.; Herawan, T.; Deris, M.M. Applying variable precision rough set model for clustering student suffering study’s anxiety. Expert Syst. Appl. 2012, 39, 452–459. [Google Scholar] [CrossRef]
- He, Q.; Wu, C.X.; Chen, D.G.; Zhao, S.Y. Fuzzy rough set based attribute reduction for information systems with fuzzy decisions. Knowl.-Based Syst. 2011, 24, 689–696. [Google Scholar] [CrossRef]
- Guo, M.; Zhu, J.F. The performance evaluation in logistics service supply chain based on fuzzy-rough sets. Syst. Eng. 2007, 25, 48–52. [Google Scholar]
- Zhang, K.; Chi, G.T. Establishment of ecological evaluation indicators system based on correlation analysis-rough set theory. J. Syst. Eng. 2012, 27, 119–128. [Google Scholar]
- Zhou, S.M.; Wen, L.; Ye, Z.X.; Xu, W. Study on nuclear accident emergency decision based on attribute reduction algorithm. Radiat. Prot. 2011, 31, 100–104. [Google Scholar]
- Li, W.W. Water quality evaluation model for Three Gorges Reservoir area based on rough set and roughness element neural network. Comput. Appl. Softw. 2011, 28, 193–196. [Google Scholar]
- Wang, G.S. Study on water quality assessment of Songhuajiang River based on PSO-PPE model. Water Conserv. Sci. Technol. Econ. 2013, 19, 27–29. [Google Scholar]
- Chen, S.Z.; Wang, X.J.; Zhao, X.J. An attribute recognition model based on entropy weight for evaluating the quality of groundwater sources. J. China Univ. Min. Technol. 2008, 18, 72–75. [Google Scholar] [CrossRef]
- Wang, L.J.; Zou, Z.H. Application of improved attributes recognition method in water quality assessment. Chin. J. Environ. Eng. 2008, 2, 553–556. [Google Scholar]
- Men, B.H.; Liang, C. Attribute recognition model-based variation coefficient weight for evaluating water quality. J. Harbin Inst. Technol. 2005, 37, 1373–1375. [Google Scholar]
- Zhang, X.Q.; Liang, C.; Liu, H.Q. Application of attribute recognition model based on coefficient of entropy to comprehensive evaluation of groundwater quality. J. Sichuan Univ.: Eng. Sci. Ed. 2005, 37, 28–31. [Google Scholar]
- Lessels, J.S.; Bishop, T.F.A. Estimating water quality using linear mixed models with stream discharge and turbidity. J. Hydrol. 2013, 498, 13–22. [Google Scholar] [CrossRef]
© 2014 by the authors; licensee MDPI, Basel, Switzerland. This article is an open access article distributed under the terms and conditions of the Creative Commons Attribution license (http://creativecommons.org/licenses/by/3.0/).
Share and Cite
An, Y.; Zou, Z.; Li, R. Water Quality Assessment in the Harbin Reach of the Songhuajiang River (China) Based on a Fuzzy Rough Set and an Attribute Recognition Theoretical Model. Int. J. Environ. Res. Public Health 2014, 11, 3507-3520. https://doi.org/10.3390/ijerph110403507
An Y, Zou Z, Li R. Water Quality Assessment in the Harbin Reach of the Songhuajiang River (China) Based on a Fuzzy Rough Set and an Attribute Recognition Theoretical Model. International Journal of Environmental Research and Public Health. 2014; 11(4):3507-3520. https://doi.org/10.3390/ijerph110403507
Chicago/Turabian StyleAn, Yan, Zhihong Zou, and Ranran Li. 2014. "Water Quality Assessment in the Harbin Reach of the Songhuajiang River (China) Based on a Fuzzy Rough Set and an Attribute Recognition Theoretical Model" International Journal of Environmental Research and Public Health 11, no. 4: 3507-3520. https://doi.org/10.3390/ijerph110403507