Article

Particulate Matter Pollution and Population Exposure Assessment over Mainland China in 2010 with Remote Sensing

State Key Laboratory of Resources and Environmental Information System, Institute of Geographic Sciences and Natural Resources Research, Chinese Academy of Sciences, Beijing 100101, China
*
Author to whom correspondence should be addressed.
Int. J. Environ. Res. Public Health 2014, 11(5), 5241-5250; https://doi.org/10.3390/ijerph110505241
Submission received: 13 March 2014 / Revised: 7 May 2014 / Accepted: 8 May 2014 / Published: 14 May 2014

Abstract

:
The public is increasingly concerned about particulate matter pollution caused by respirable suspended particles (PM10) and fine particles (PM2.5). In this paper, PM10 and PM2.5 concentration are estimated with remote sensing and individual air quality indexes of PM10 and PM2.5 (IPM10 and IPM2.5) over mainland China in 2010 are calculated. We find that China suffered more serious PM2.5 than PM10 pollution in 2010, and they presented a spatial differentiation. Consequently, a particulate-based air quality index (PAQI) based on a weighting method is proposed to provide a more objective assessment of the particulate pollution. The study demonstrates that, in 2010, most of mainland China faced a lightly polluted situation in PAQI case; there were three areas obviously under moderate pollution (Hubei, Sichuan-Chongqing border region and Ningxia-Inner Mongolia border region). Simultaneously, two indicators are calculated with the combination of population density gridded data to reveal Chinese population exposure to PM2.5. Comparing per capita PM2.5 concentration with population-weighted PM2.5 concentration, the former shows that the high-level regions are distributed in Guangdong, Shanghai, and Tianjin, while the latter are in Hebei, Chongqing, and Shandong. By comparison, the results demonstrate that population-weighted PM2.5 concentration is more in line with the actual situation.

1. Introduction

In recent years, inhalable particulate matter has become the primary air pollutant in China [1]. Many studies have shown that fine particulate matter concentration has a certain association with pollution-related disease mortality [2,3,4,5]. Public opinion now pays more and more attention to PM2.5 because of its connection to health risks [6], but an often neglected factor is coarser particles (PM2.5 to PM10) formed by dust suspensions (from road dust and dust storms) which could also have a great influence on human health.
Nowadays, air quality index (AQI), a numerical model of air quality evaluation based on the pollution standards index (PSI) proposed by the United States Environmental Protection Agency (EPA) in the 1970s, is widely used to inform the public how polluted the air is. Many countries and regions around the world employ different classification methods according to their characteristics. An individual air quality index (IAQI) is assigned to the level of each pollutant and the current AQI depends on the primary pollutant level (the highest IAQI of the 6 scores); although convenient it cannot accurately reflect the particulate pollution state. Many studies based on revised models of AQI or fuzzy set theory also face the same situation [7,8].
Furthermore, launching a particulate matter concentration monitoring network to determine the distribution situation faces phenomenally high costs [7]. The density of the particulate matter concentration ground observation network in China is relatively low, and the distribution of observation stations is uneven. Remote sensing techniques, which provide consistent measurements at broad-scale and frequent time intervals, have been increasingly used to assess surface level of particulate matter concentration at high spatial and temporal resolutions [9]. Hence, remote sensing retrieval data is introduced in this paper.
As to population exposure to particulate matters in China, some relevant research has been done in specific cities, such as Beijing [7,10,11], Shanghai [12], Wuhan [13], Lanzhou [14], and Hong Kong [15], but the spatial differentiation of population exposure to PM2.5 is rarely reported.
In this paper, we focus on the evaluation of atmospheric particulate matter pollution and propose a new particulate air pollution index (PAQI) which only takes PM10 and PM2.5 into account. Specifically, we use the retrieved PM2.5 and PM10 concentration over mainland China in 2010 to calculate the individual indexes of PM2.5 (IPM2.5) and PM10 (IPM10). Furthermore, the spatial distribution of PAQI over mainland China in 2010 is discussed. Meanwhile, two indicators of population exposure to PM2.5 are calculated and discussed.
The rest of this paper is organized as follows: in Section 2, we give a brief description of the study area, data sources, and methodologies. Then in Section 3.1 we discuss and compare the spatial distributions of IPM2.5, IPM10, and PAQI over mainland China in 2010. Section 3.2 discusses Chinese population exposure to PM2.5 in 2010. Finally, we summarize our work and draw some conclusions.

2. Materials and Methods

2.1. Study Area and Data Sources

In this paper, our spatial domain includes mainland China (excluding Hainan Province, which is not included in the study area due to the influence of clouds and aerosol type). Three data sources are used in the study:
(1)
MODIS atmosphere aerosol product (MOD04_L2) is derived from National Aeronautics and Space Administration (NASA) at a spatial resolution of 0.1 degree, details on this data can be found elsewhere [16,17].
(2)
Meteorological data (ERA-Interim), the latest global atmospheric reanalysis data produced by the European Centre for Medium-Range Weather Forecasts (ECMWF). Dee et al. [18] have covered the details of the ERA-Interim product.
(3)
Population density gridded data derived from the Center for International Earth Science Information Network (CIESIN) contains the human population distribution. It is a gridded data product that renders global population data at the scale and extent required to demonstrate the spatial relationship of human population and the environment across the globe.

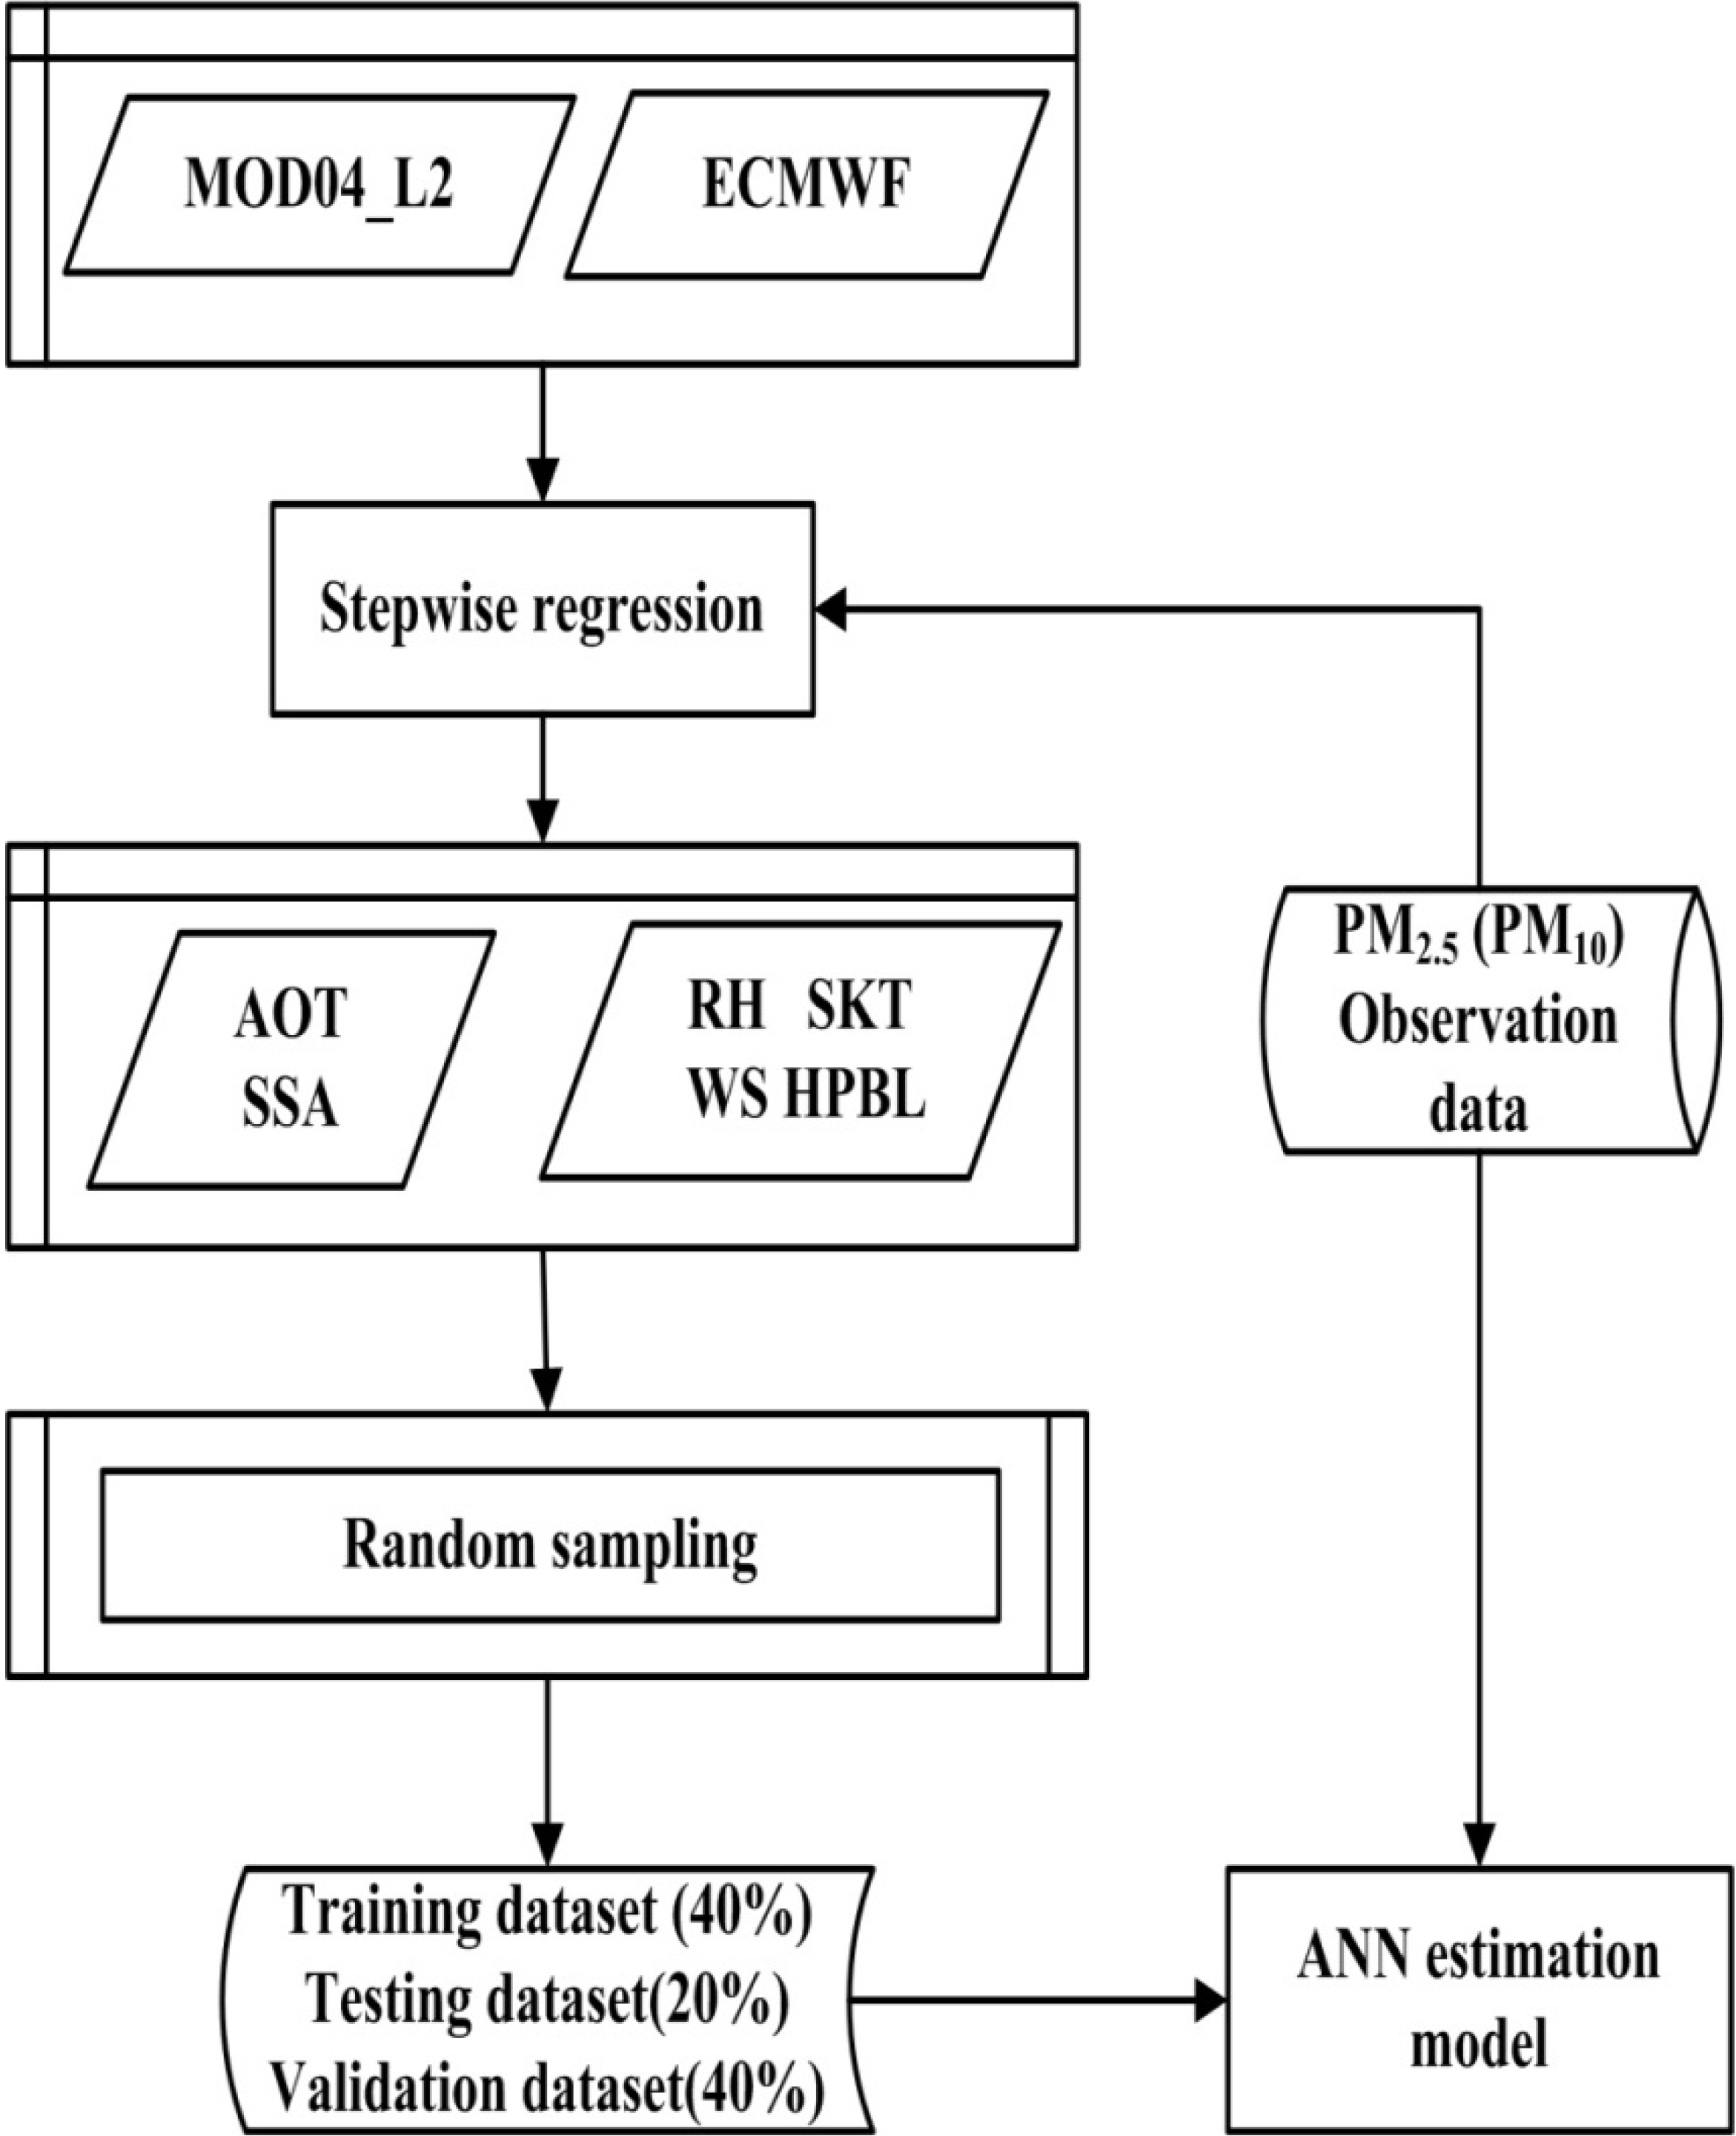
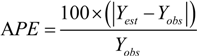
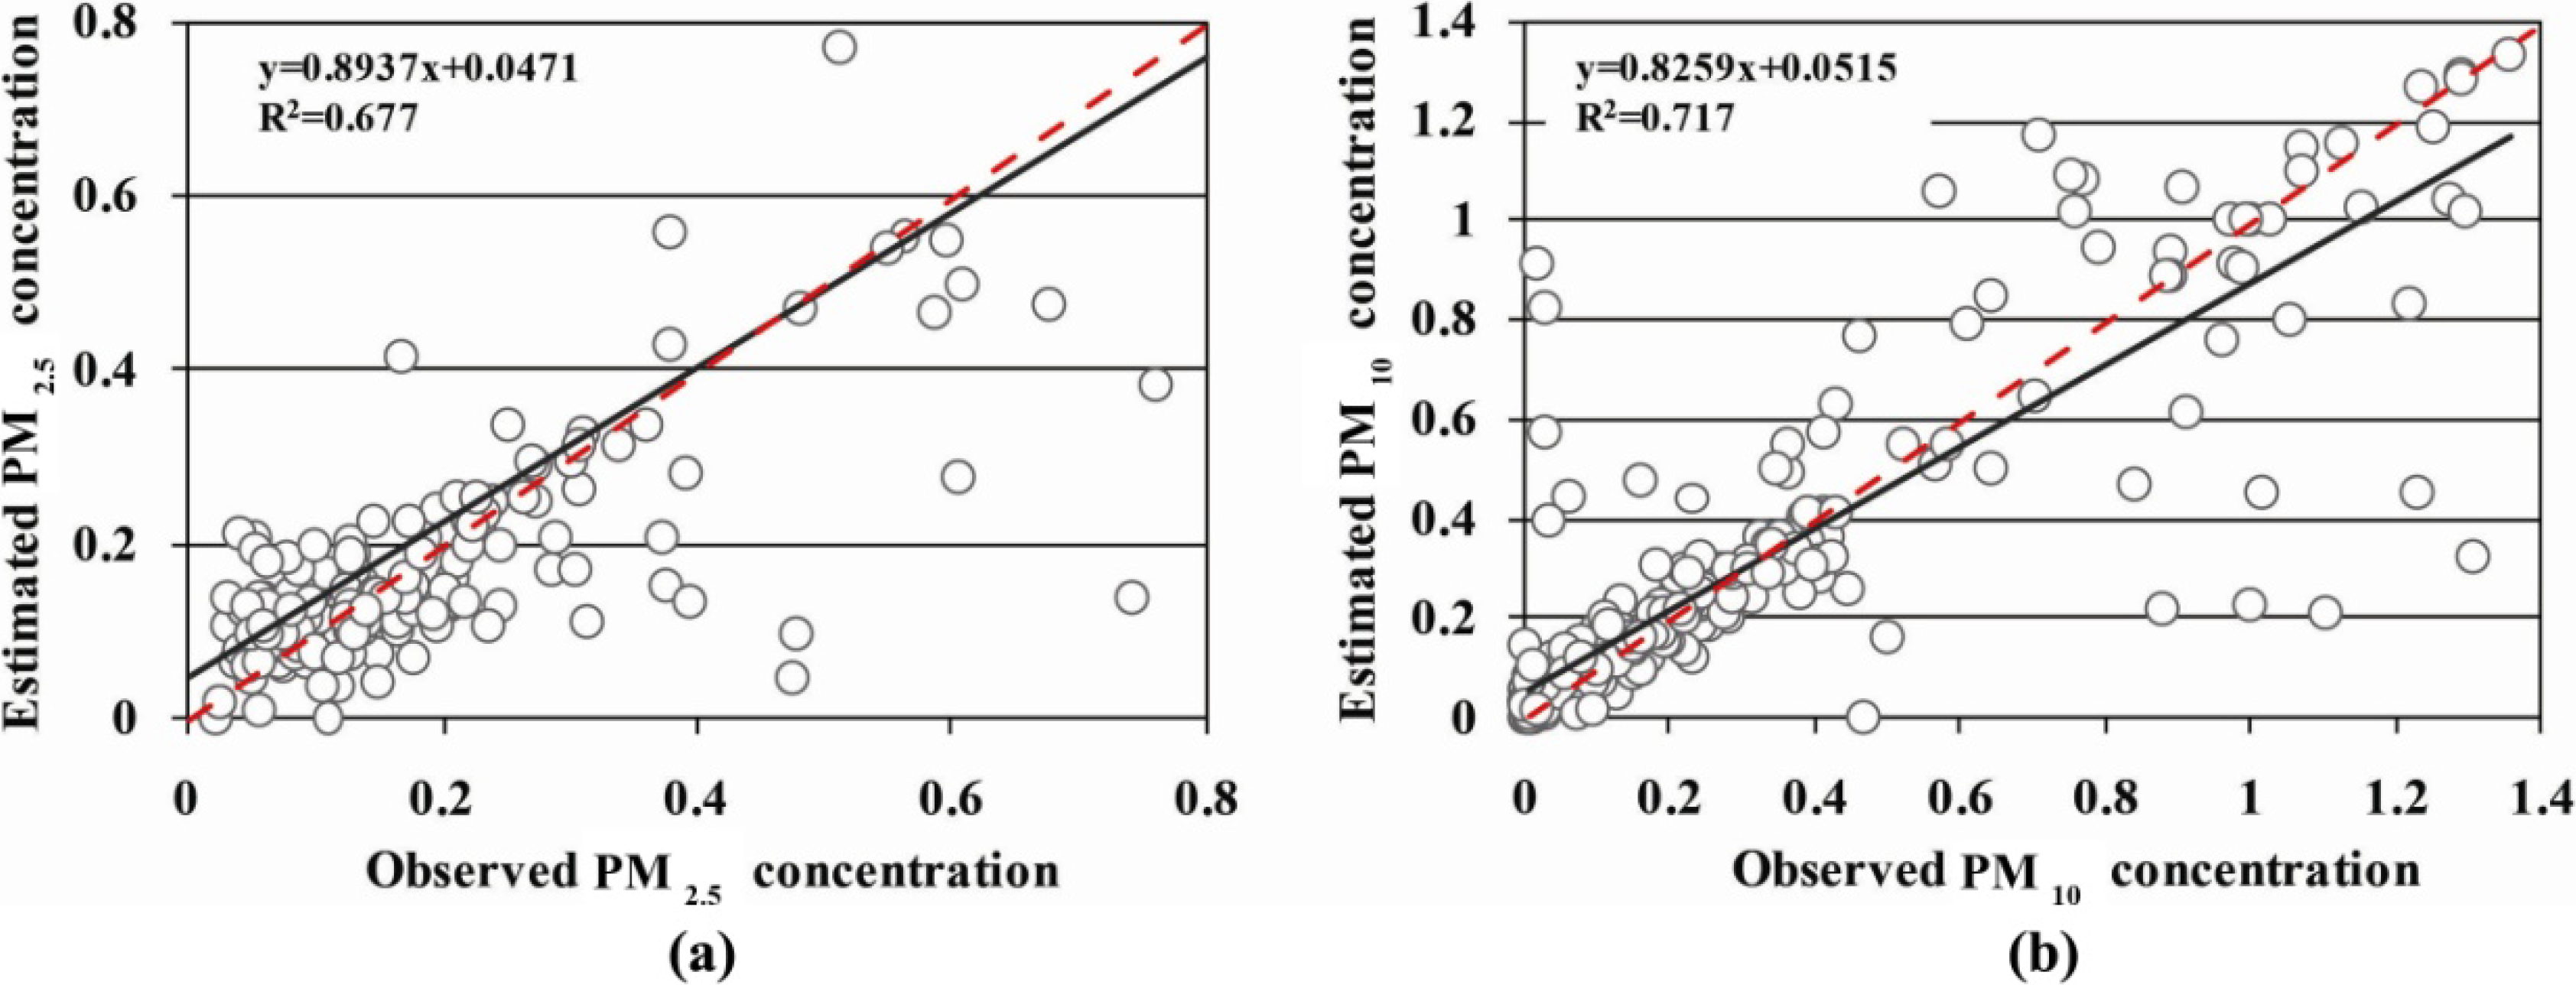
2.2. PM10 and PM2.5 Concentration Estimation

Gupta et al. have determined that the artificial neural network (ANN) algorithm can solve the PM estimation problem and there are some relevant studies about this topic [9,19,20]. In this paper, we make the following improvements to these models: the Levenberg-Marquardt (L-M) back-propagation ANN is introduced to build the particulate matter concentration estimation model in this research. First, we use stepwise regression to determine the input variables: latitude, longitude, wind speed (WS), relative humidity (RH), skin temperature (SKT), boundary layer height (HPBL), aerosol optical thickness (AOT), and single scattering albedo (SSA). Among these elements, AOT and SSA are obtained from MOD04_L2, and the other four are derived from ERA-Interim. This step can make the neural network waste less resources in extracting and fitting irrelevant features.
The estimation modeling process is described in Figure 1. We use data of year 2008 to build the estimation model and then estimate the PM concentration in 2010. As to the ANN parameters, it has been proven that neural networks with a single hidden layer are universal approximators capable of representing any real-valued continuous function to arbitrary precision over a finite domain if enough hidden nodes are used [21]. However, networks with multiple hidden layers can sometimes perform better than single-hidden-layer networks, with fewer total nodes. In this paper, the experiment shows that over 16 hidden nodes and 9,000 runs with random sampling provided sufficient data samples for the used training data, because the satellite retrieval accuracy of PM concentration almost remained the same as the number of hidden nodes and runs increased subsequently. Consequently, the ANN estimation model is constructed with eight nodes and 16 hidden layers. The accuracy of estimation model will be discussed in Section 3.1.
Figure 1. The PM concentration estimation modeling process with ANN.
Ijerph 11 05241 g001

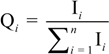
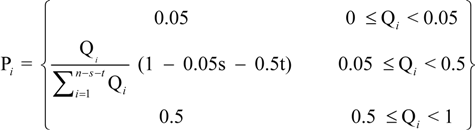
2.3. PAQI Calculation

Though AQI is calculated on the basis of ground monitoring data, it only reports the air quality around each monitoring stations. However, satellite retrievals can exhaustively get the air quality spatial distribution, even if it’s not accurate enough. Before the PAQI calculation, IPM2.5, IPM10 are calculated with the estimation data according to the Chinese AQI standard [22]. PAQI calculation is based on a weighting method; weight values are given to IPM2.5 and IPM10, respectively, according to a certain condition [23,24], that is, individual indexes and its weight value equal PAQI. In this paper, we only consider PM10 and PM2.5 (that is, i = 2), however, it’s scalable if we have other PM data (PM1, PM0.5, etc.) in the future. First, we calculate the weighting of the ith individual index (Qi). Suppose:
Ijerph 11 05241 i001
where, 0 ≤ Qi ≤ 1 (i = 0,1,2,…), Ii is the ith individual air quality index. However, if we calculate PAQI with Qi, it would be not relate well with the facts under certain circumstances, for example, the dust-stormy weather, IPM10 is extremely high while IPM2.5 is relatively low. Hence, we propose the weight assignment equation (Equation 2) is:
Ijerph 11 05241 i002
where, s is the number that 0≤ Qi < 0.05; t is the number that 0.5 < Qi ≤ 1. Pi stands for the modified weighting of the ith individual index. With this step we deal with the extreme values and modify the weighting of each individual particulate matter pollutant. Accordingly, PAQI is calculated with Equation 3:
Ijerph 11 05241 i003

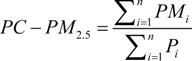
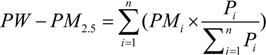
2.4. Per Capita and Population-Weighted PM2.5 Concentration Calculation

In this paper, per capita PM2.5 concentration (PC-PM2.5) and population-weighted PM2.5 concentration (PW-PM2.5) are calculated with Equations 4 and 5 based on grid computing to indicate population exposure to PM2.5. Both PC-PM2.5 and PW-PM2.5 are obtained from provincial statistics:
Ijerph 11 05241 i004
Ijerph 11 05241 i005
where, PMi is defined as the ith pixel value of PM2.5 concentration, Pi is the ith pixel value of population density, n is the total pixel number of the certain province. PC-PM2.5 indicates the average exposure level of particulate matter of specific province, while PW-PM2.5 places emphasis on the actual effect of particulate matter to residents, taking population distribution into account. The weightiness of PM2.5 concentration in a dense population area is larger than in a suburb or sparse population area. The PW-PM2.5 method can indicate the PM2.5 exposure level of each resident every day.

3. Results and Discussion

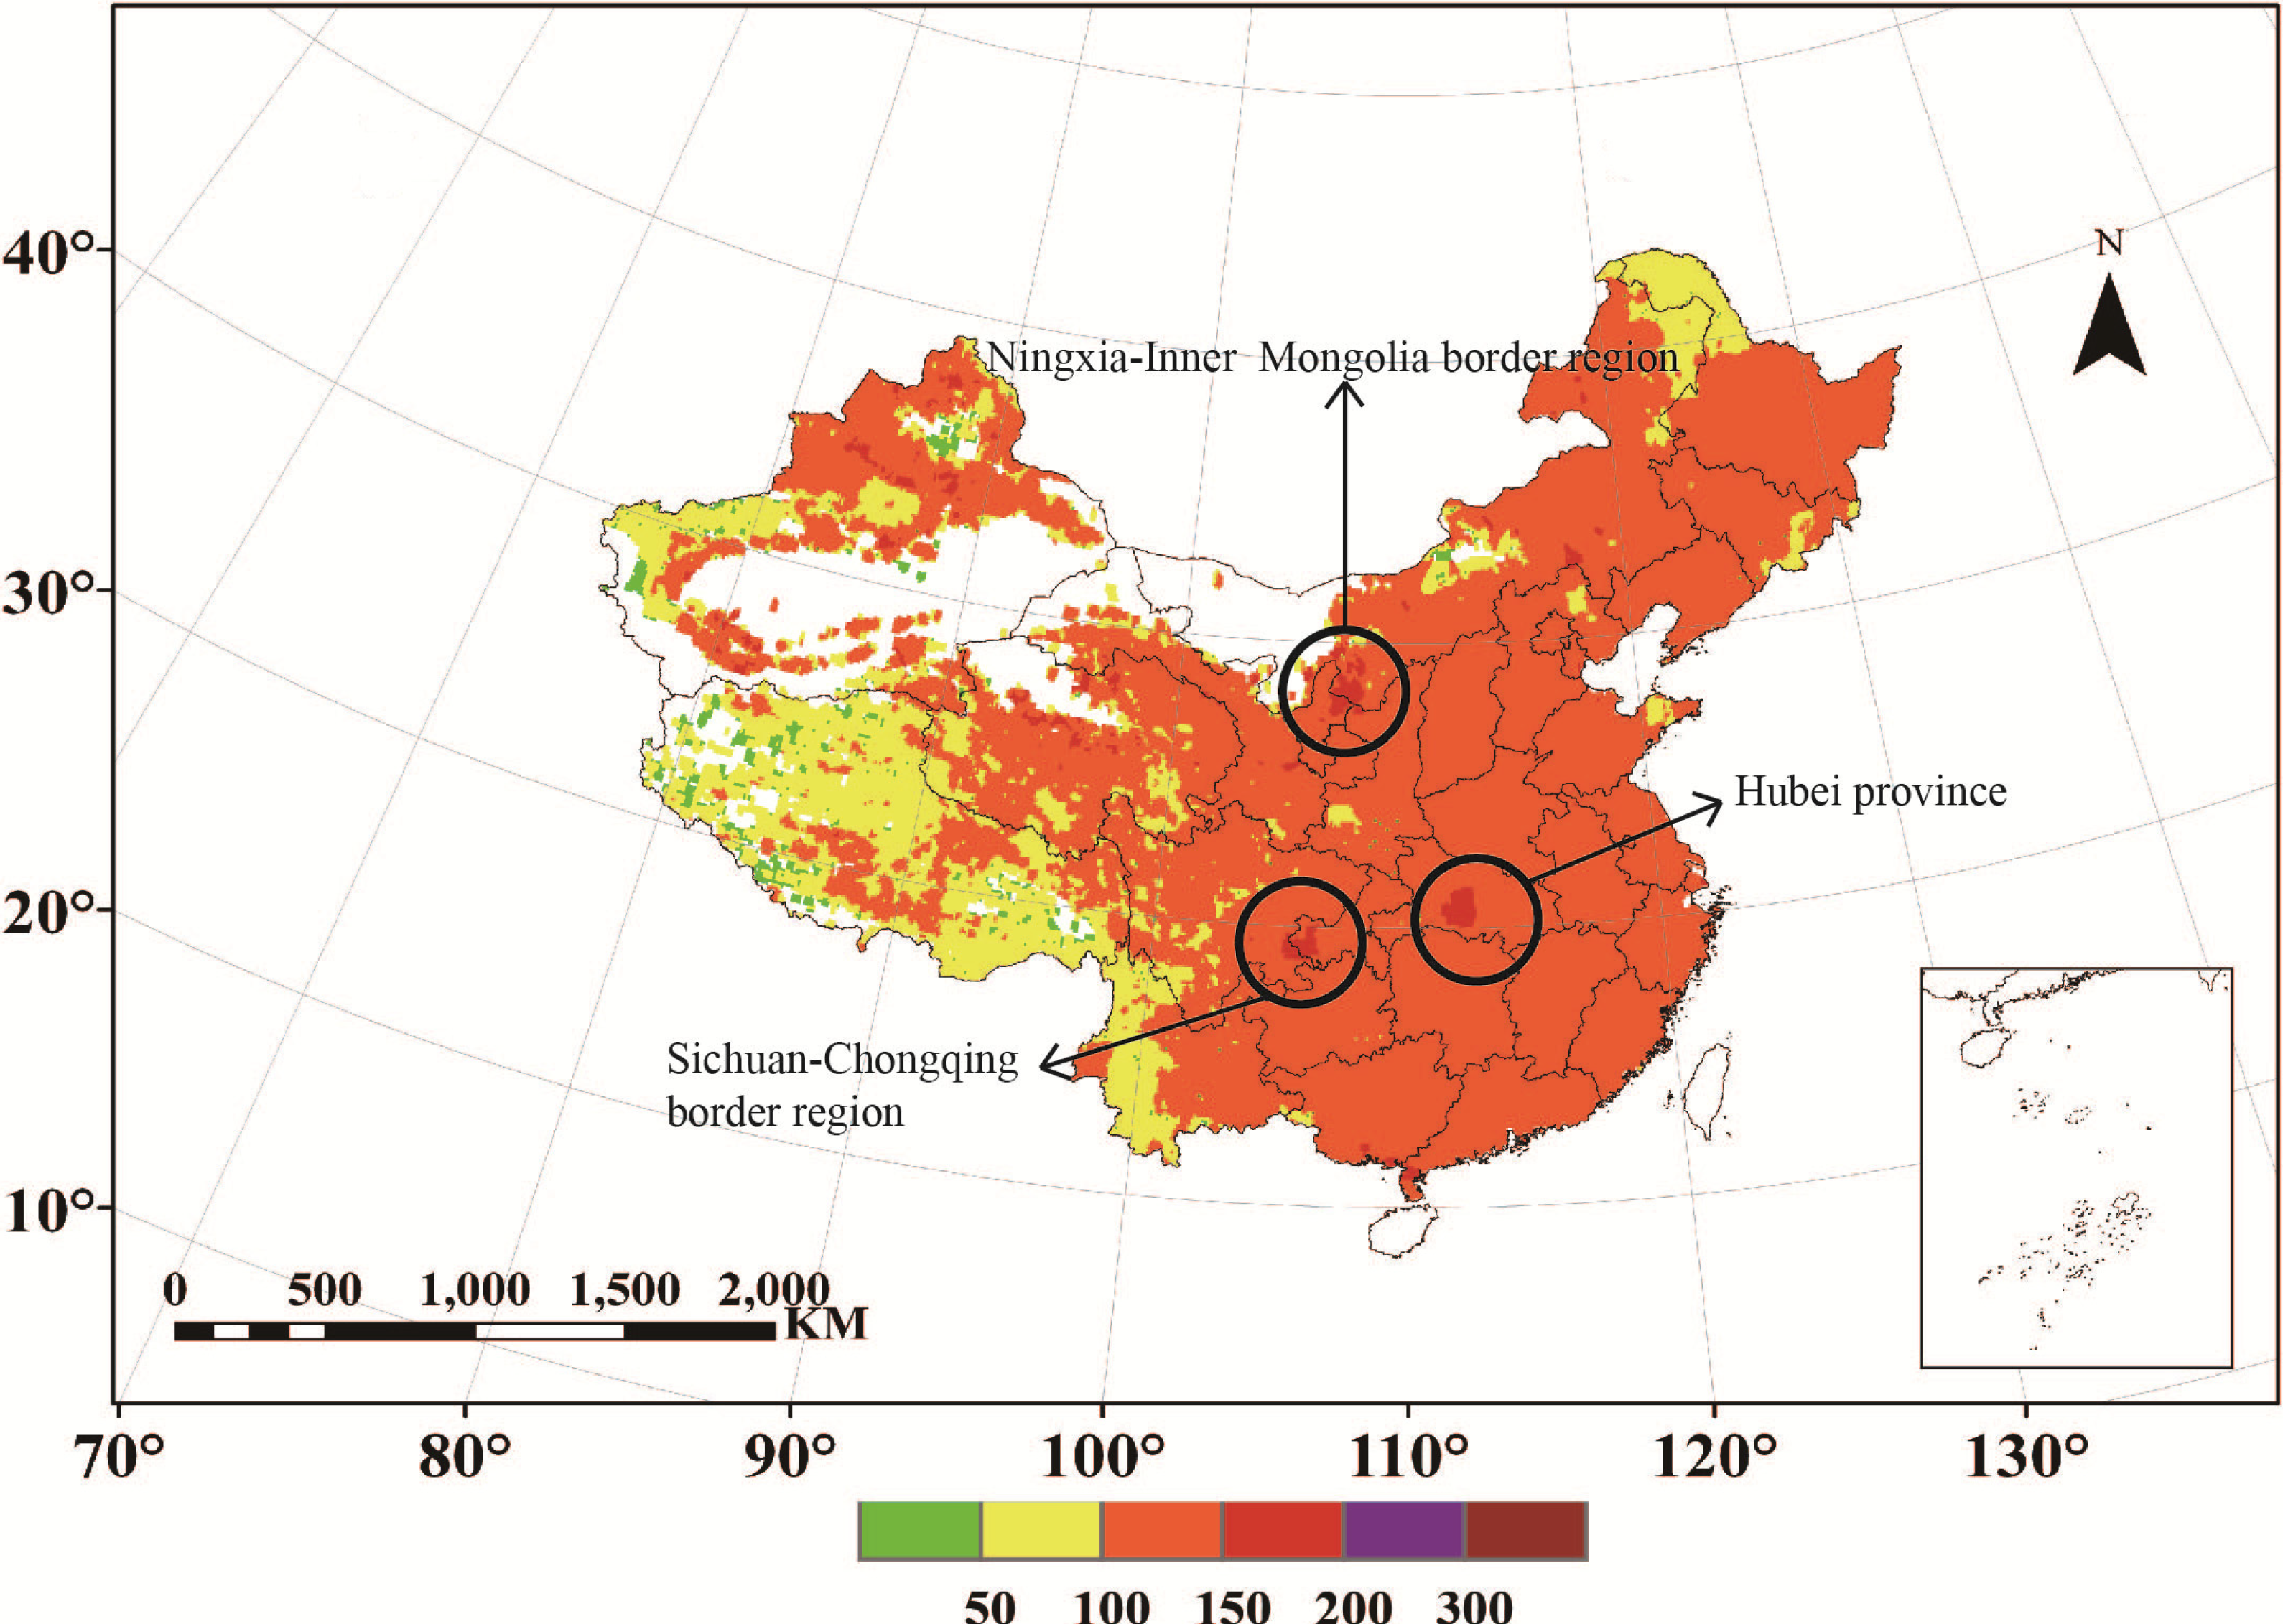
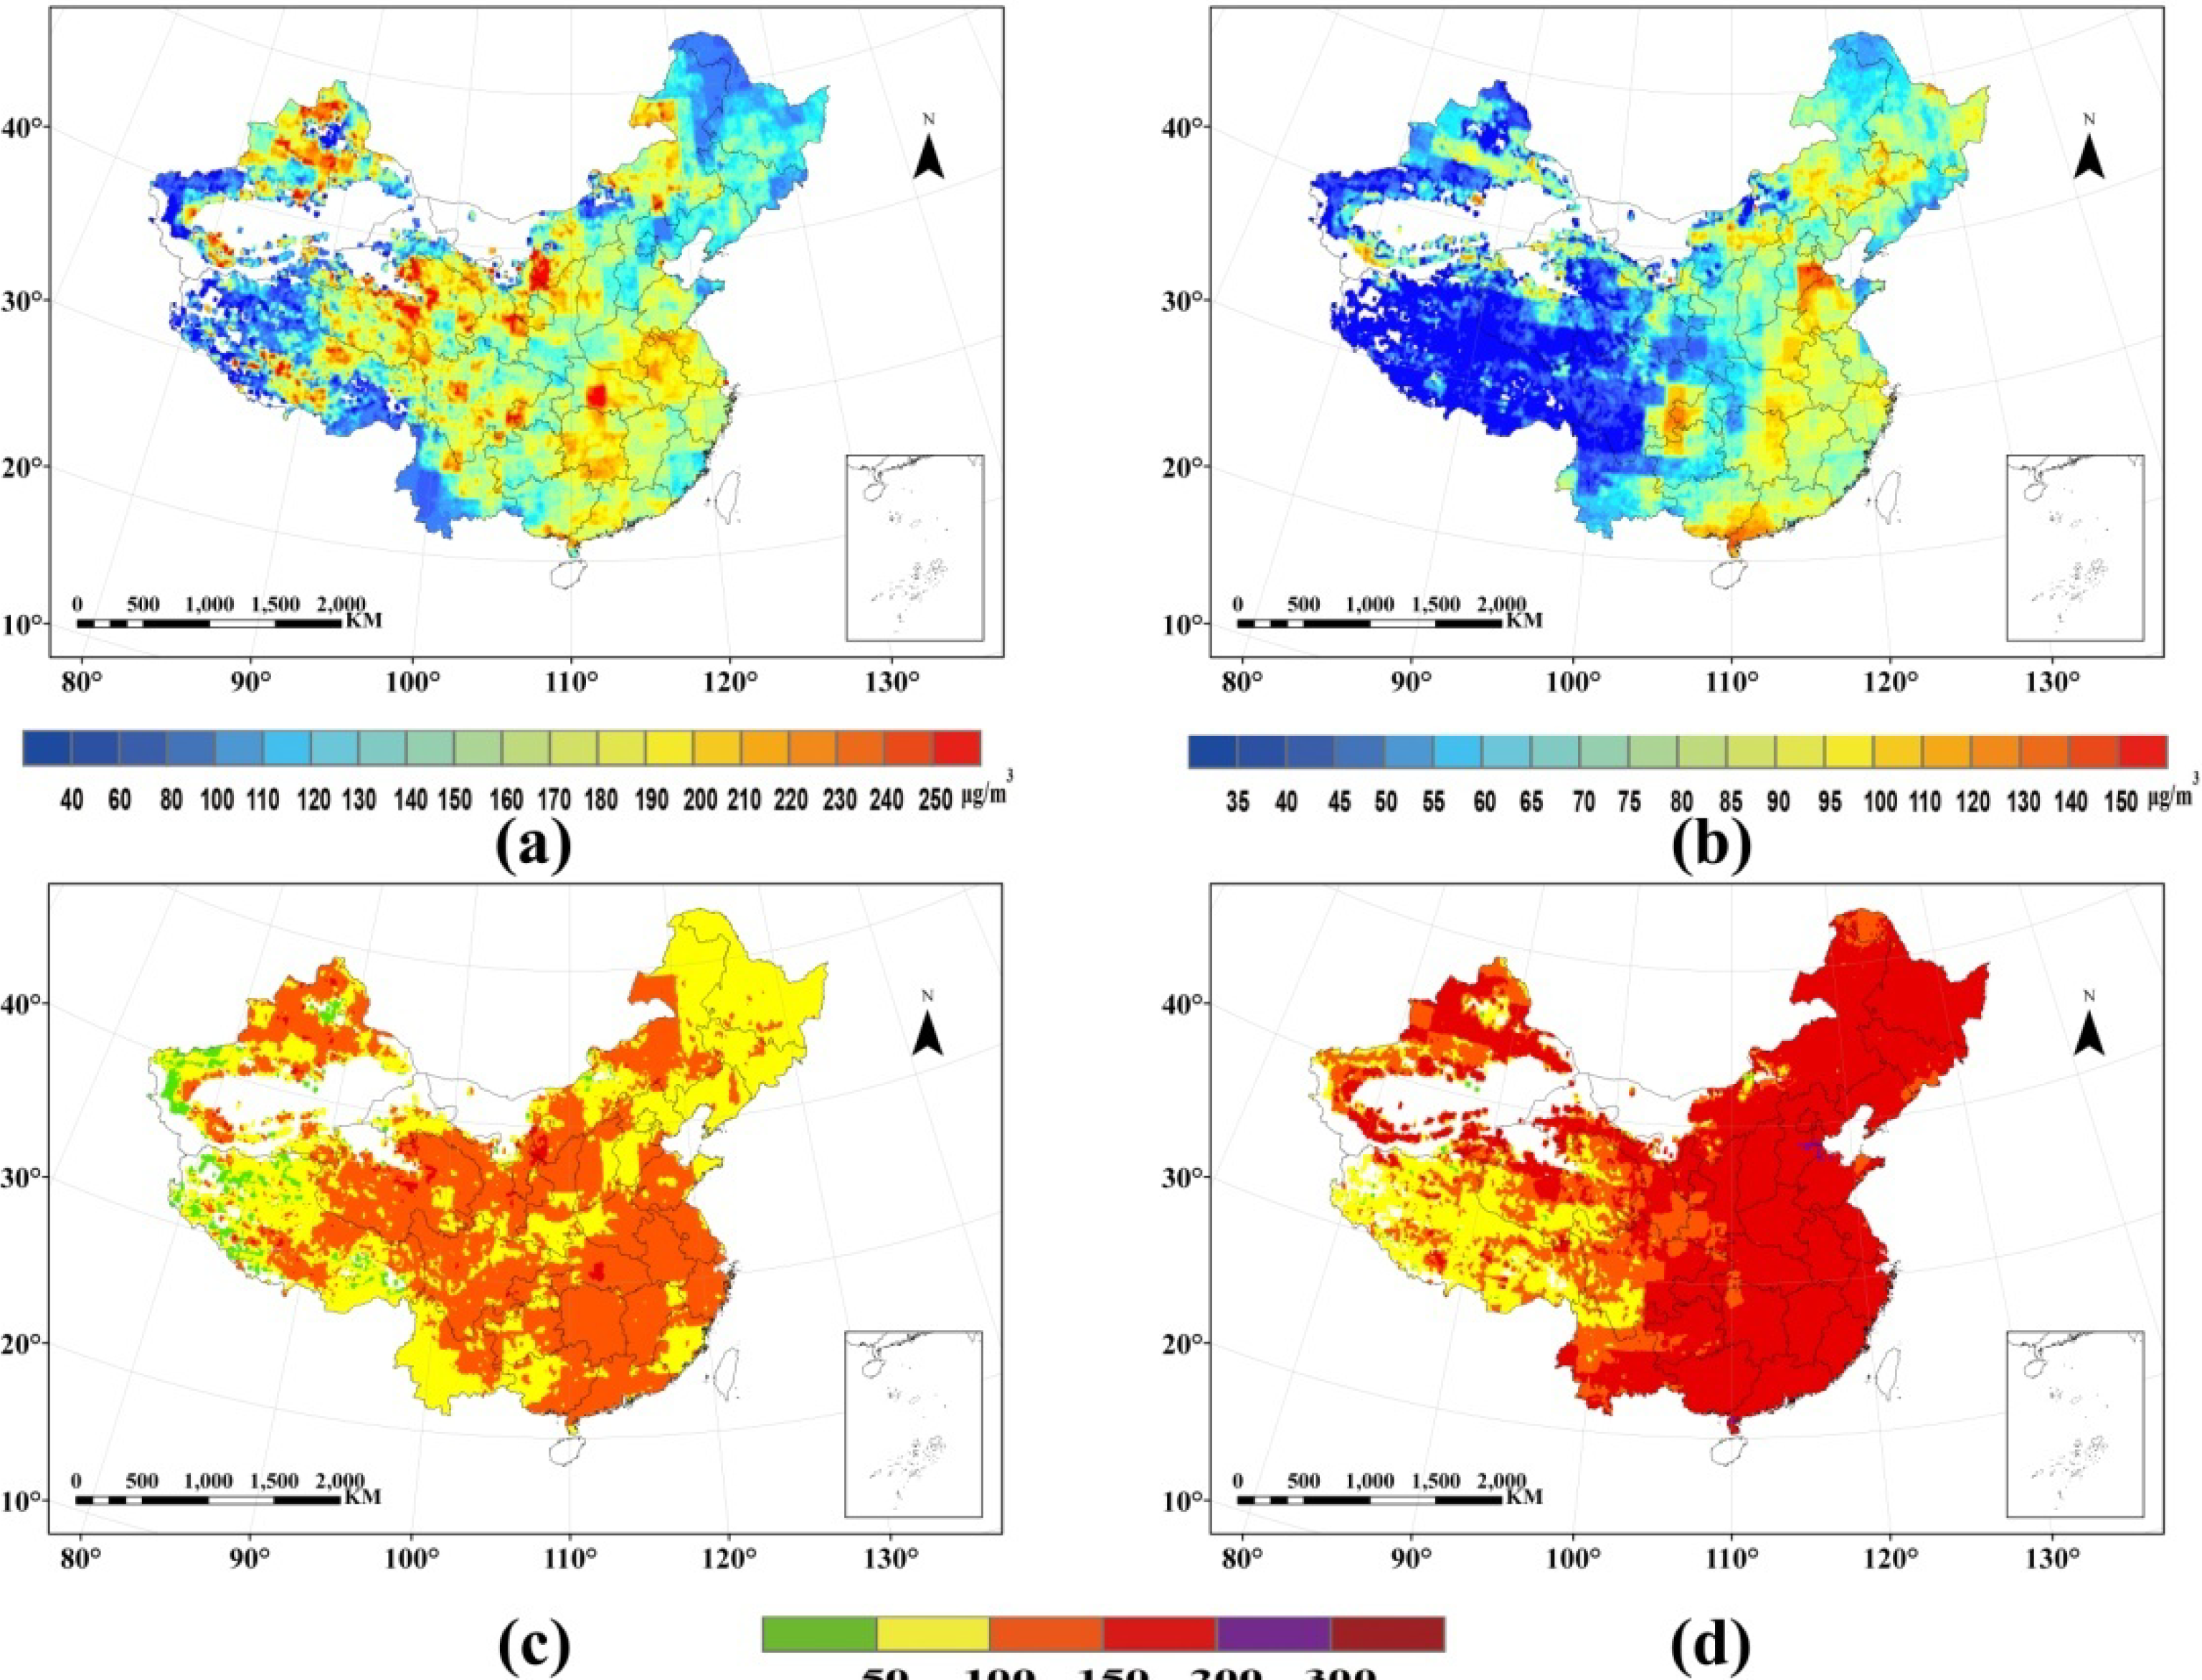
3.1. Spatial Distribution of PM Pollution

Comparing the estimation result with the PM observation data, the comparative analysis consists of two parts: accuracies and absolute percentage errors (APE) [19], the correlation coefficients of estimated PM10 and PM2.5 are respectively 0.85 and 0.82 (Figure 2), while the absolute percentage errors are about 29% and 25%. These results demonstrate the feasibility of the estimation model:
Ijerph 11 05241 i006
where, Yest is the estimated concentration and Yobs is the observed concentration in validation data set.
Figure 2. Accuracy of particulate estimation concentrations. (a) The accuracy of PM2.5 estimation; (b) The accuracy of PM10 estimation.
Ijerph 11 05241 g002
The spatial distributions of particulate matter pollution over China 2010 are shown in Figure 3. The direct comparison between PM10 and PM2.5 concentration is meaningless due to the different threshold standards, hence IPM10 and IPM2.5 are calculated according to the Chinese AQI standard. Figure 3c,d reveal an obvious spatial differentiation. As to IPM10, it presents a good or light pollution state, while IPM2.5 shows a moderate pollution situation in the eastern China, and a particularly heavy pollution in Hebei Province. Overall, China suffered relatively more serious PM2.5 pollution than PM10 pollution in 2010.
Figure 3. (a) Spatial distribution of PM10 concentration. (b) Spatial distribution of PM2.5 concentration. (c) Spatial distribution of IAQIPM10 concentration. (d) Spatial distribution of IAQIPM2.5 concentration.
Ijerph 11 05241 g003
Owing to the spatial differentiation between IPM10 and IPM2.5, when evaluating particulate pollution level of a certain area or doing research on particulate health effects, both PM10 and PM2.5 should be taken into account at the same time. That’s why PAQI is needed. With the PAQI calculation method described in Section 3, the spatial distribution of PAQI over mainland China in 2010 is calculated (Figure 4). The classification criterion here for PAQI follows the Chinese AQI standard.
Figure 4. The spatial distribution of calculated PAQI over mainland China in 2010.
Ijerph 11 05241 g004
Compared with the two individual air quality indexes, PAQI shows an entirely different situation. PAQI over mainland China in 2010 is overall less than 200 (threshold of moderate pollution). There are three regions obviously in a moderate-pollution situation—Hubei Province, the Sichuan-Chongqing border region and the Ningxia-Inner Mongolia border region.
One possible explanation for this phenomenon is that the high value of Hubei Province appeared in Jingmen City and its neighboring region may be associated with coal burning and the construction dust; the Sichuan Basin is affected by the meteorological conditions, which are not conductive to the dilution of atmospheric particulate matter concentration; the high value in the Ningxia-Inner Mongolia border region (Shizuishan City, Wuhai City and Dengkou City, China) has a certain relation to the development of industry, it suffers from the most serious pollution in the Yellow River Basin because many mining industries are grouped on this region.

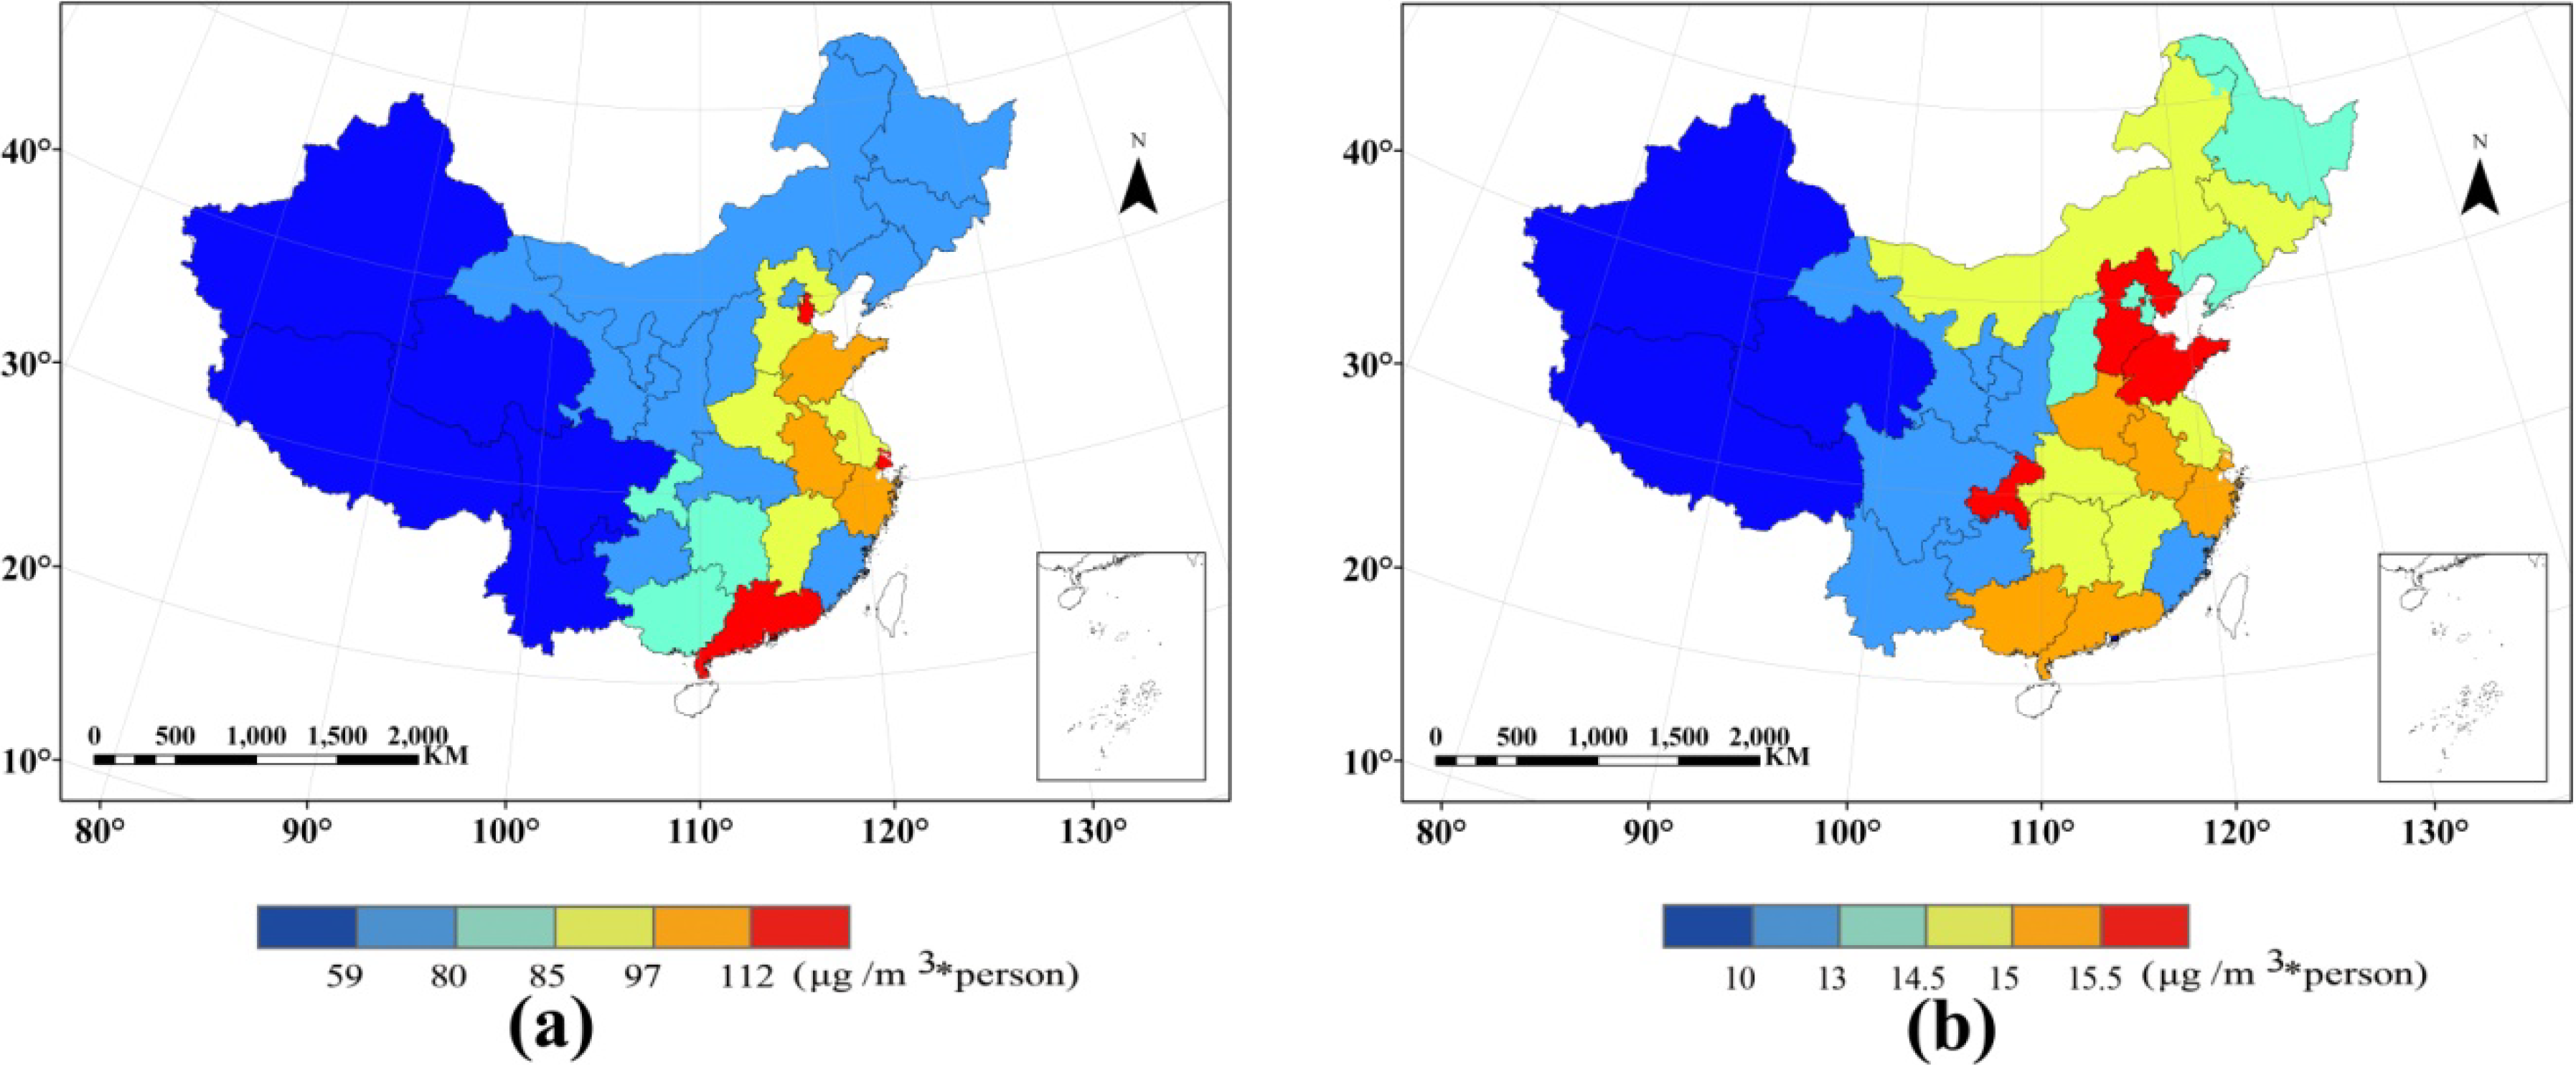
3.2. Population Exposure Assessment

PC-PM2.5 and PW-PM2.5 of China in 2010 are shown in Figure 5. The spatial distribution of the results is illustrated in the province-level. The distribution of PC-PM2.5 and PW-PM2.5 is apparently different. The high-level of PC-PM2.5 of China in 2010 is concentrated in the Eastern area. The provinces with highest PC-PM2.5 are Guangdong, Shanghai, and Tianjin. The 2nd highest places are Shandong, Anhui, and Zhejiang. The high-level areas of PW-PM2.5 are Hebei, Chongqing, and Shandong, and followed by Henan, Anhui, Zhejiang, Guangdong, and Guangxi. That is, PC-PM2.5 in Guangdong, Shanghai, and Tianjin is high in total, but the potential high pollution area is sparsely populated. Although PC-PM2.5 in Hebei and Chongqing is lower than in the high-level area, the population in the potential high pollution area is denser. Shandong Province is a special case, as it is not only located in the high-level concentration area, but also the population in the potential high pollution area is dense. The comparison between two indicators of PM2.5 population exposure level indicates the effect of population distribution on the regional PM2.5 exposure statics.
Figure 5. (a) Spatial distribution of per capita PM2.5 concentration (provincial statistical). (b) Spatial distribution of population-weighted PM2.5 concentration (provincial statistical).
Ijerph 11 05241 g005

4. Conclusions

In this study, PM10 and PM2.5 concentrations of mainland China in 2010 are estimated with an ANN model, and then IPM10 and IPM2.5 are calculated based on grid computing, The spatial distribution of IPM10 demonstrates obvious differences with IPM2.5. IPM10 presents a good or light pollution state while IPM2.5 shows a moderate-pollution situation in eastern China, with a particularly heavily polluted region in Hebei Province.
On the basis of the two individual indexes, we develop a new particulate air quality index (PAQI) based on a weighting method. It is shown that the PAQI over mainland China in 2010 shows overall a light pollution state, while some regions suffer a moderate-pollution situation.
As to the population exposure to PM2.5, the provinces with highest per capita PM2.5 concentration are Guangdong, Shanghai, and Tianjin, while the high-level areas of population-weighted PM2.5 concentration are Hebei, Chongqing, and Shandong. By comparison, the results demonstrate that the population-weighted PM2.5 concentration is more in accord with the actual situation and suitable for human health risk assessment. In future research, more attention can be paid to improving the spatial resolution of PAQI and discussion of its effects on human health.

Acknowledgments

This research is financially supported by the National Natural Science Foundation of China (Grants No. 41301380 and 41371016), Research on PM2.5 remote sensing monitoring key technology and operational method in central-eastern China (Grant No. 201309011).

Author Contributions

Ning Lu principally conceived the idea for the study and was responsible for the design of the study, Ling Yao was responsible for setting up experiments, completing the experiments and retrieving data and he also wrote the initial draft of the manuscript. Both authors participated in some form in the concept, experimentation, writing and/or editing of this manuscript.

Conflicts of Interest

The authors declare no conflict of interest.

References

  1. Li, H.; Zeng, F.G.; Shao, L.Y. Current status of study on the human health effects of inhalable particulates. J. Environ. Health 2002, 19, 85–87. [Google Scholar]
  2. Hu, H.; Dailey, A.B.; Kan, H.; Xu, X. The effect of atmospheric particulate matter on survival of breast cancer among USA females. Breast Cancer Res. Treat. 2013, 139, 217–226. [Google Scholar] [CrossRef]
  3. Pope, C.A., III; Dockery, D.W. Epidemiology of particle effects. Air Pollut. Health 1999, 31, 673–705. [Google Scholar] [CrossRef]
  4. Zhang, A.; Qi, Q.; Jiang, L.; Zhou, F.; Wang, J. Population exposure to PM2.5 in the urban area of Beijing. PLoS One 2013, 8. [Google Scholar] [CrossRef]
  5. Avasn, M.Y.; Kaizar, H.; Priya, B.P.; Neelakanta, R.L. Dust pollution: A case study in old town area, Visakhapatnam. Res. J. Chem. Environ. 2009, 13, 96–98. [Google Scholar]
  6. Lin, G.; Fu, J.; Jiang, D.; Hu, W.; Dong, D.; Huang, Y.; Zhao, M. Spatio-temporal variation of PM2.5 concentrations and their relationship with geographic and socioeconomic factors in China. Int. J. Environ. Res. Public Health 2013, 11, 173–186. [Google Scholar] [CrossRef]
  7. Cheng, W.L.; Chen, Y.S.; Zhang, J.; Lyons, T.J.; Pai, J.L.; Chang, S.H. Comparison of the revised air quality index with the PSI and AQI indices. Sci. Total Environ. 2007, 382, 191–198. [Google Scholar] [CrossRef]
  8. Sowlat, M.H.; Gharibi, H.; Yunesian, M.; Maryam, T.M.; Lotfi, S. A novel, fuzzy-based air quality index (FAQI) for air quality assessment. Atmos. Environ. 2011, 45, 2050–2059. [Google Scholar] [CrossRef]
  9. Gupta, P.; Christopher, S.A. Particulate matter air quality assessment using integrated surface, satellite, and meteorological products: 2. A neural network approach. J. Geophys. Res. 2009, 10. [Google Scholar] [CrossRef]
  10. Zhang, M.S.; Song, Y.; Cai, X.H. A health-based assessment of particulate air pollution in urban areas of Beijing in 2000–2004. Sci. Total Environ. 2007, 376, 100–108. [Google Scholar] [CrossRef]
  11. Xu, X.; Dockery, D.W.; Christiani, D.C.; Li, B.; Huang, H. Association of air pollution with hospital outpatient visits in Beijing. Arch. Environ. Health 1995, 50, 214–220. [Google Scholar] [CrossRef]
  12. Kan, H.D.; Chen, B.H. A case-crossover analysis of air pollution and daily mortality in Shanghai. J. Occup. Health 2003, 45, 119–124. [Google Scholar] [CrossRef]
  13. Qian, Z.; He, Q.; Lin, H.M.; Kong, L.; Liao, D.; Dan, J.; Bentley, C.M.; Wang, B. Association of daily cause-specific mortality with ambient particle air pollution in Wuhan, China. Environ. Res. 2007, 105, 380–389. [Google Scholar] [CrossRef]
  14. Sun, Z.B.; An, X.Q.; Tao, Y.; Hou, Q. Assessment of population exposure to PM10 for respiratory disease in Lanzhou (China) and its health-related economic costs based on GIS. BMC Public Health 2013, 13. [Google Scholar] [CrossRef]
  15. Wong, T.W.; Lau, T.S.; Yu, T.S.; Neller, A.; Wong, S.L.; Tam, W.; Pang, S.W. Air pollution and hospital admissions for respiratory and cardiovascular diseases in Hong Kong. Occup. Environ. Med. 1999, 56, 679–683. [Google Scholar] [CrossRef]
  16. Remer, L.A.; Kaufman, Y.J.; Tanre, D.; Mattoo, S.; Chu, D.A.; Martins, J.V.; Li, R.R.; Ichoku, C.; Levy, R.C.; Kleidman, R.G.; Eck, T.F.; Vermote, E.; Holben, B.N. The MODIS aerosol algorithm, products, and validation. J. Atmos. Sci. 2005, 62, 947–973. [Google Scholar] [CrossRef]
  17. Levy, R.C.; Remer, L.A.; Mattoo, S.; Vermote, E.F.; Kaufman, Y.J. Second-generation operational algorithm: Retrieval of aerosol properties over land from inversion of Moderate Resolution Imaging Spectroradiometer spectral reflectance. J. Geophys. Res. 2007, 112. [Google Scholar] [CrossRef]
  18. Dee, D.P.; Uppala, S.M.; Simmons, A.J.; Berrisford, P.; Poli, P.; Kobayashi, S. The ERA-interim reanalysis: Configuration and performance of the data assimilation system. Quart. J. Roy. Meteorol. Soc. 2011, 137, 553–597. [Google Scholar] [CrossRef]
  19. Gupta, P.; Christopher, S.A. Particulate matter air quality assessment using integrated surface, satellite, and meteorological products: Multiple regression approach. J. Geophys. Res. 2009, 7. [Google Scholar] [CrossRef]
  20. Yao, L.; Lu, N.; Jiang, S. Artificial Neural Network (ANN) for Multi-source PM2.5 Estimation using Surface, MODIS, and Meteorological Data. In Proceedings of International Conference of Biomedical Engineering and Biotechnology (ICBEB), Macau, China, 28 May 2012; pp. 1228–1231.
  21. Blackwell, W.J.; Chen, F.W.B. Neural Networks in Atmospheric Remote Sensing, 1st ed.; Artech House: Boston, MA, USA, 2009; pp. 100–104. [Google Scholar]
  22. People’s Republic of China Ministry of Environmental Protection Standard: Technical Regulation on Ambient Air Quality Index. (in Chinese). Available online: http://kjs.mep.gov.cn/hjbhbz/bzwb/dqhjbh/jcgfffbz/201203/W020120410332725219541.pdf (accessed on 9 May 2014).
  23. Pu, Y.J.; Wang, L.B. Discussion on comprehensive index assessment method of environmental air quality. (in Chinese). Environ Sci. Surv. 2010, 29, 93–94. [Google Scholar]
  24. Bishoi, B.; Prakash, A.; Jain, V.K. A comparative study of air quality index based on factor analysis and USA—EPA methods for an urban environment. Aerosol Air Qual. Res. 2009, 9, 1–17. [Google Scholar]

