
Exploration of Pedestrian Head Injuries—Collision Parameter Relationships through a Combination of Retrospective Analysis and Finite Element Method

Abstract
:1. Introduction
2. Materials and Methods
2.1. Selection and Analysis of Injury Data
2.2. Finite Element Model of Car
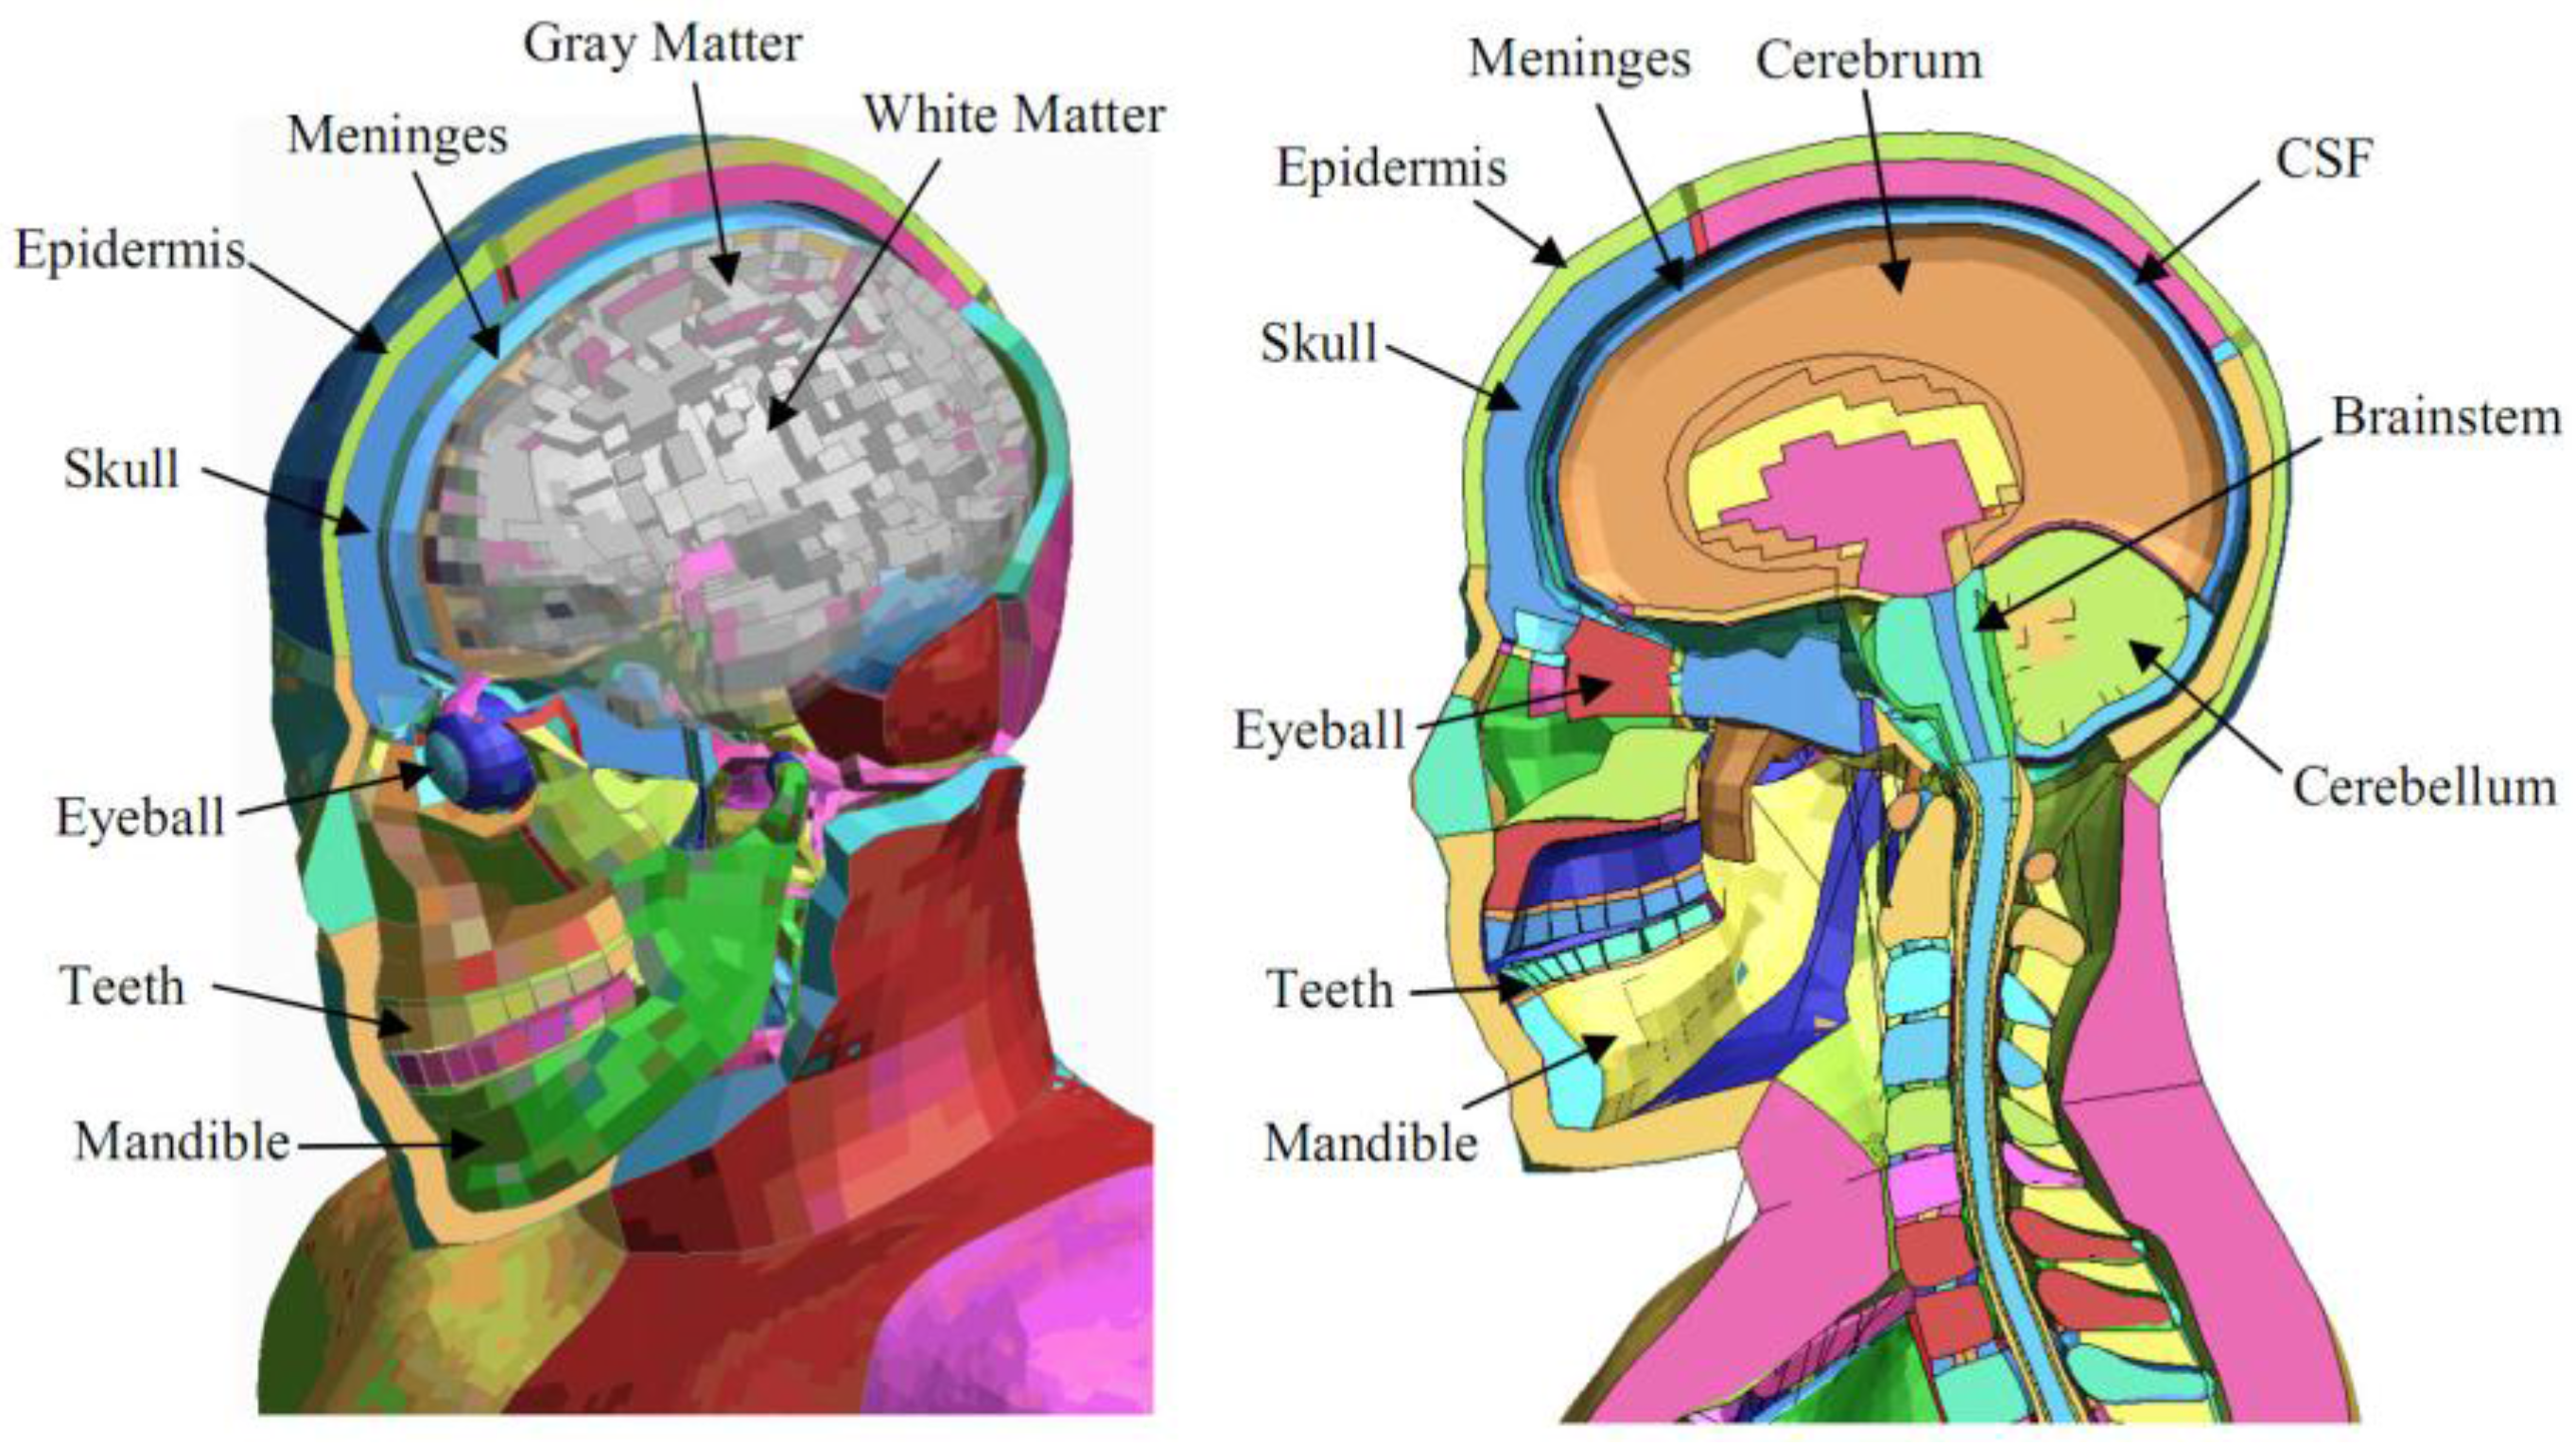
2.3. Finite Element Model of Pedestrian Head
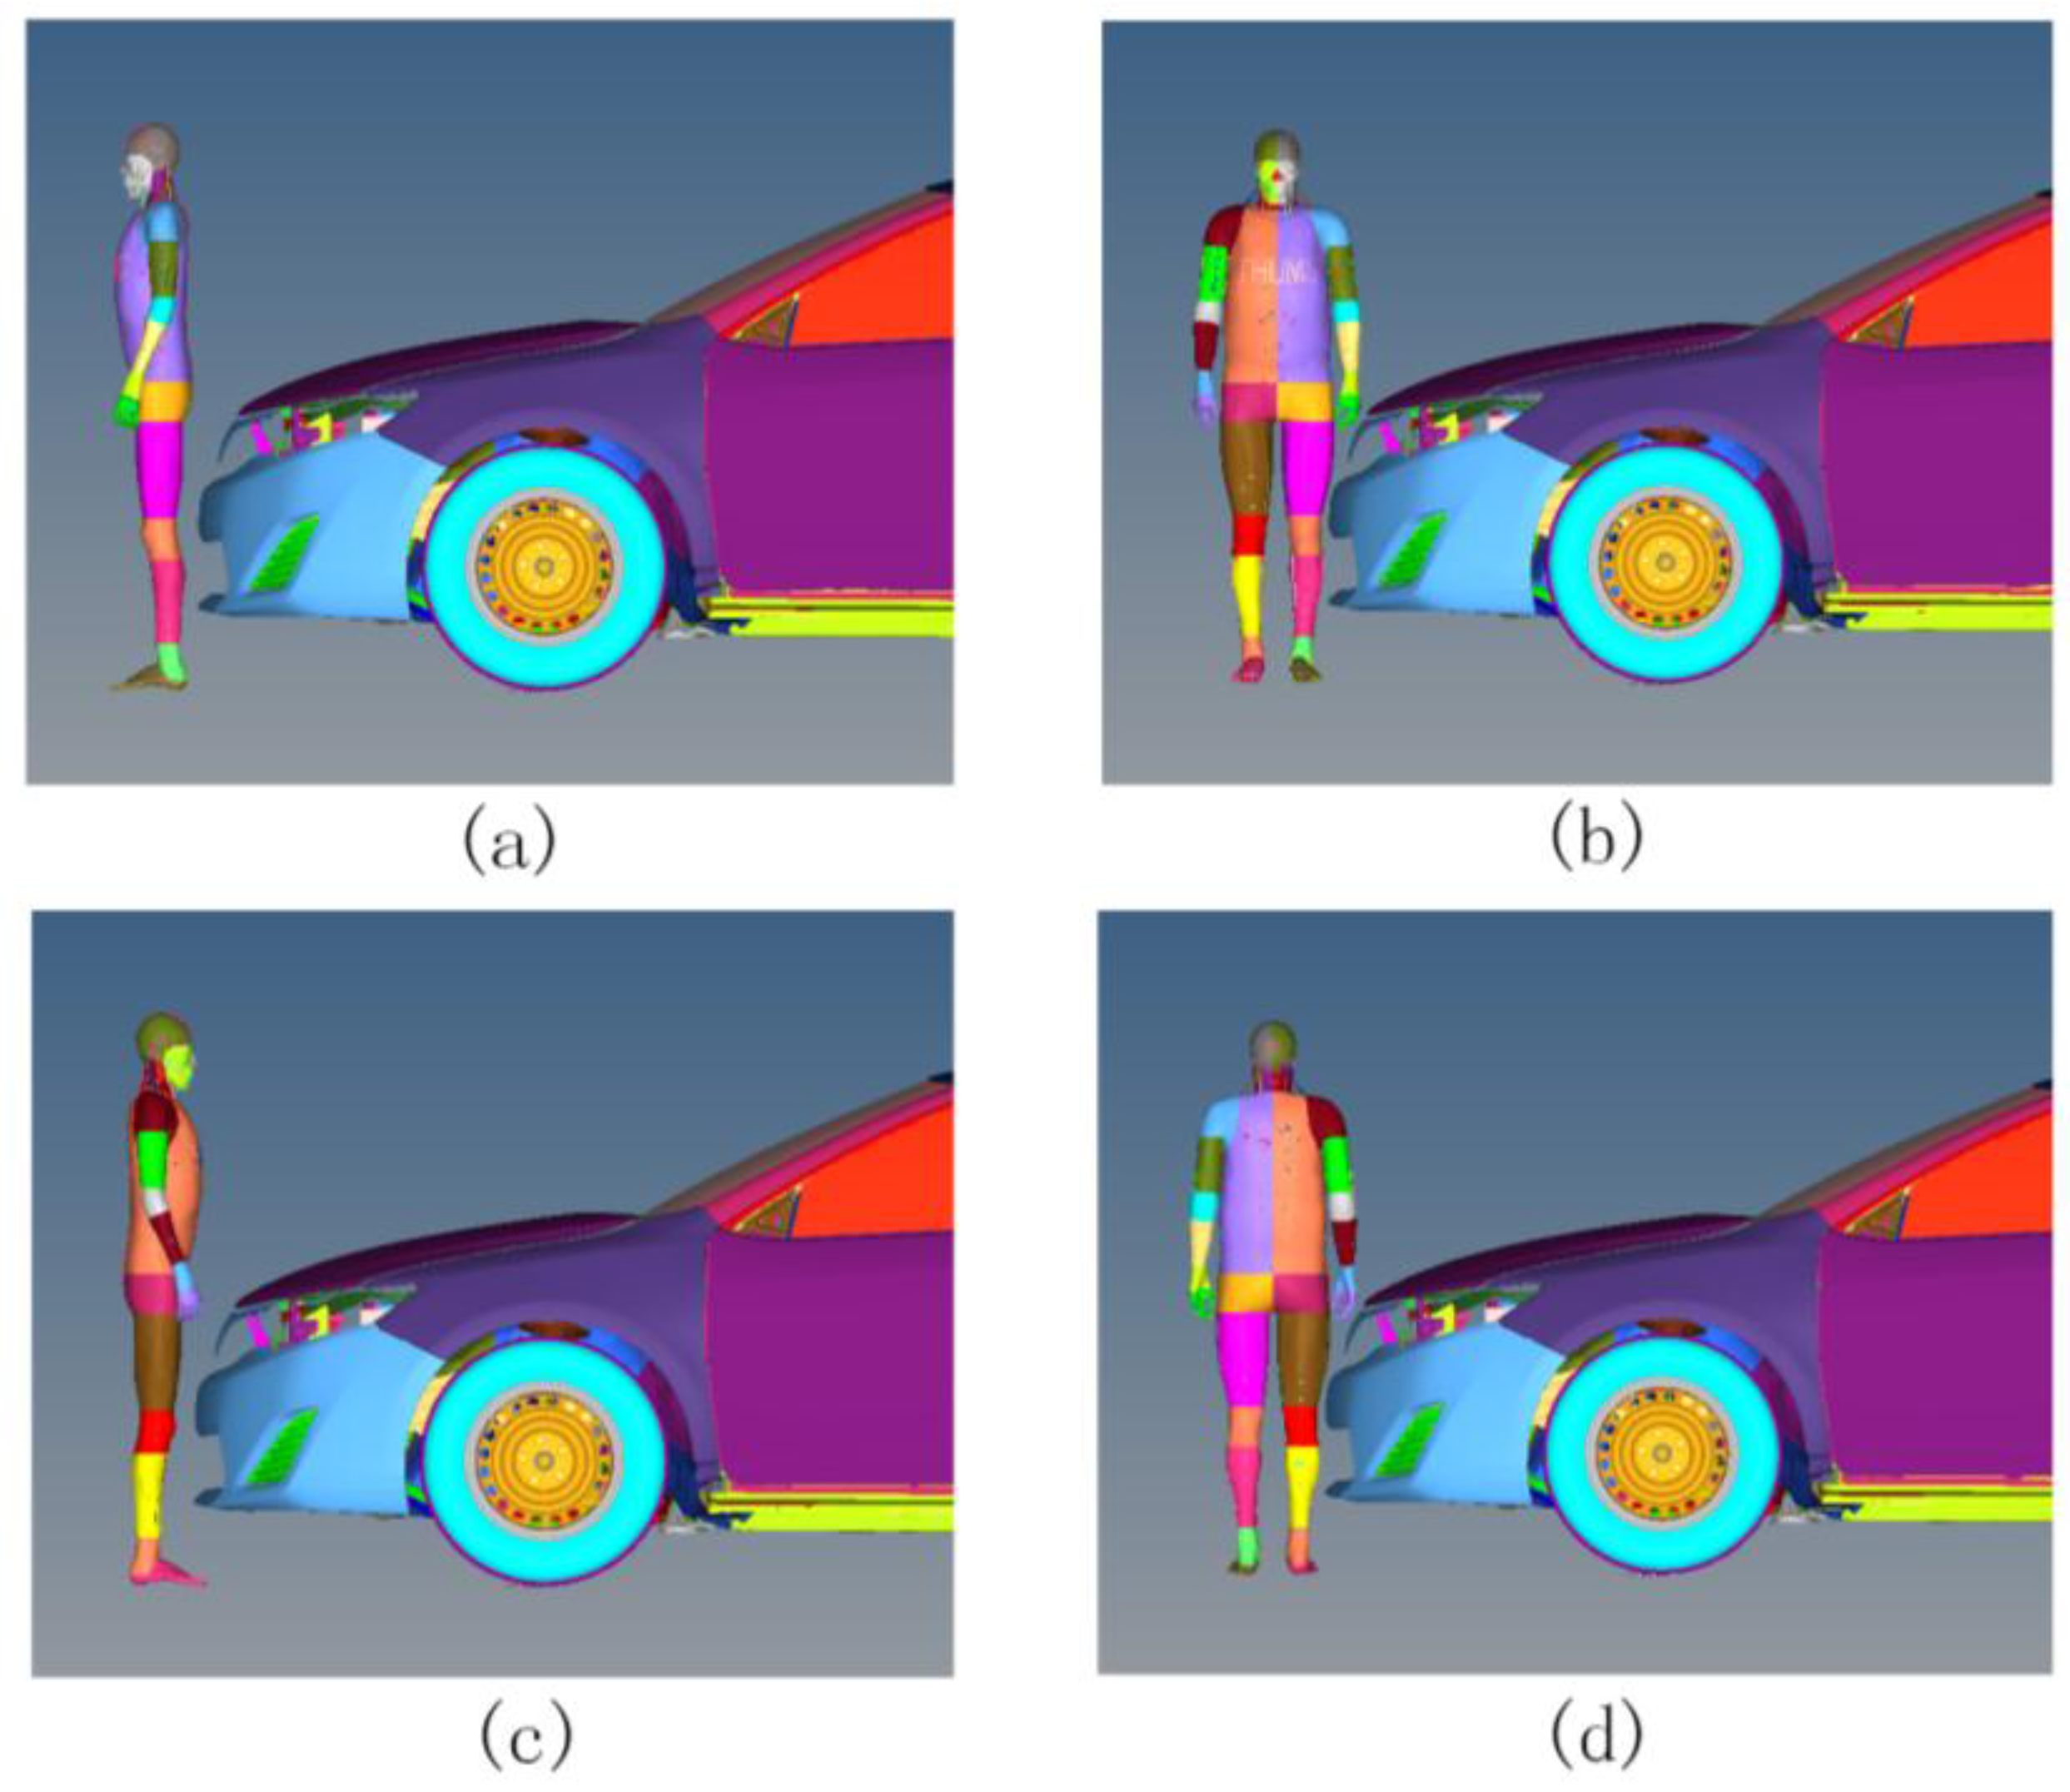
2.4. Crash Simulation Design and Injury Assessment Indicators
2.5. Cases Descriptions
3. Results
3.1. Statistical Analysis of Pedestrian Head Injuries
3.2. Finite Element Analysis of Pedestrian Head Injuries
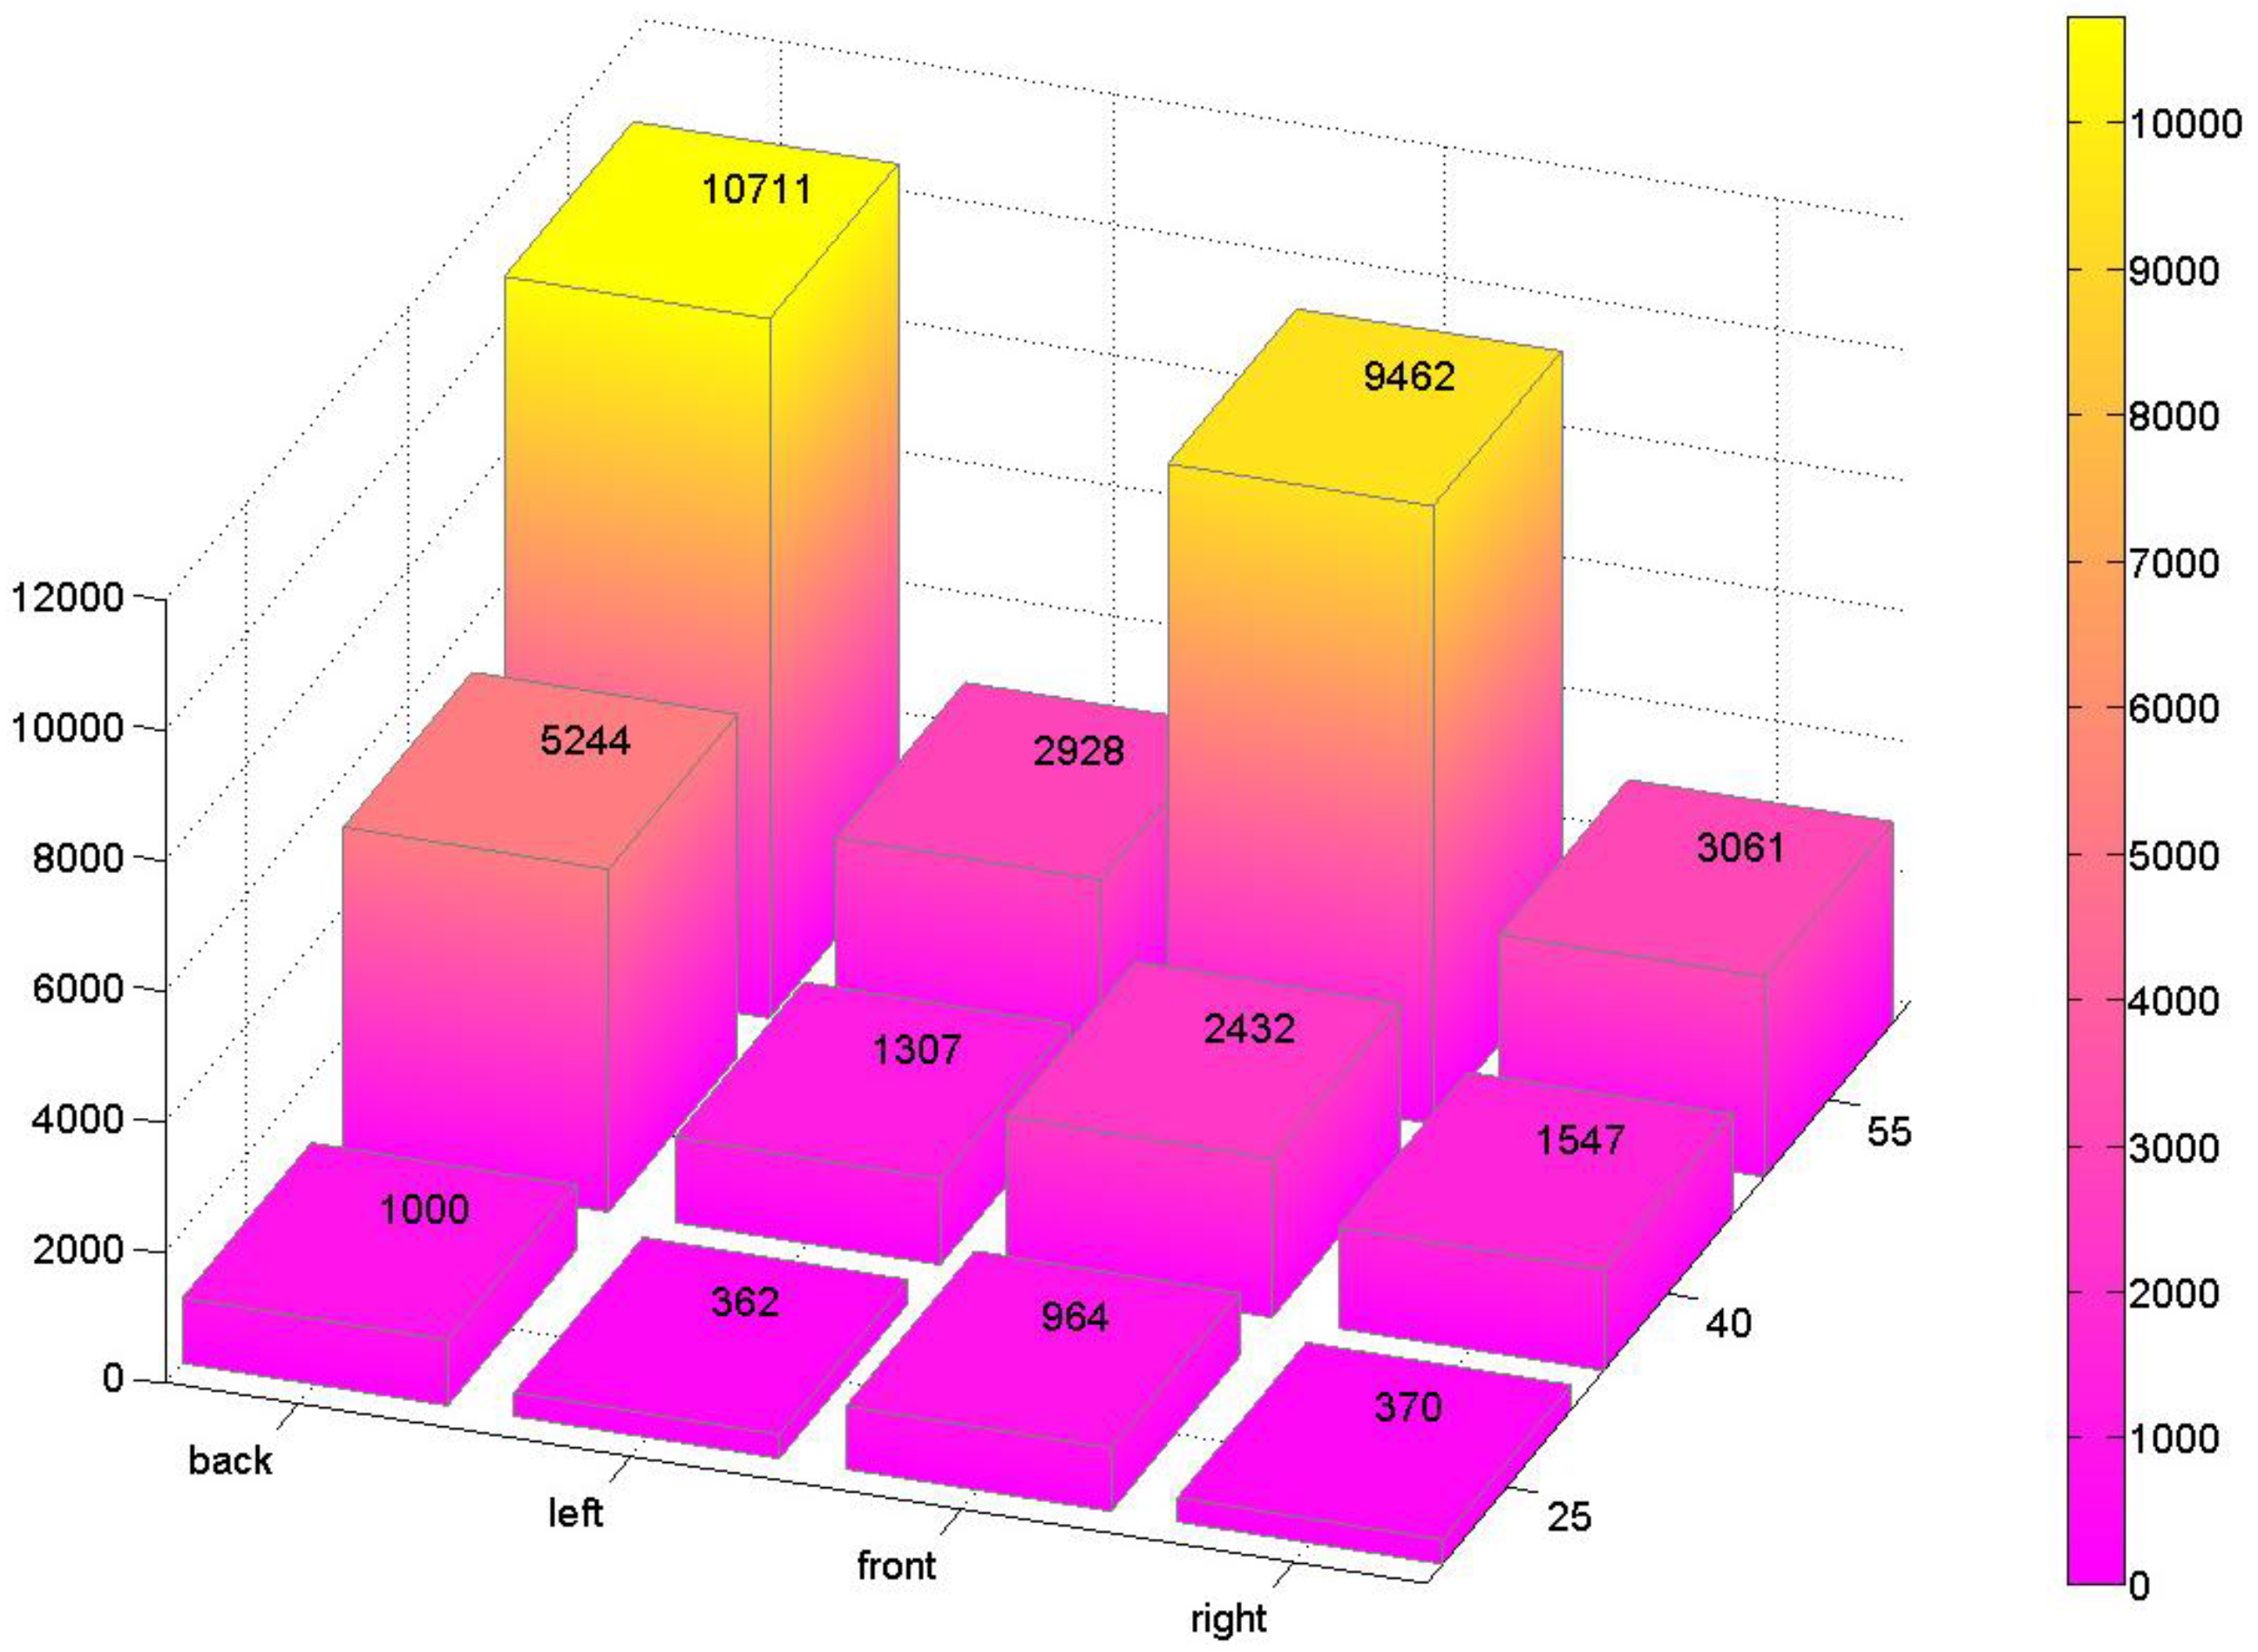
3.2.1. HIC
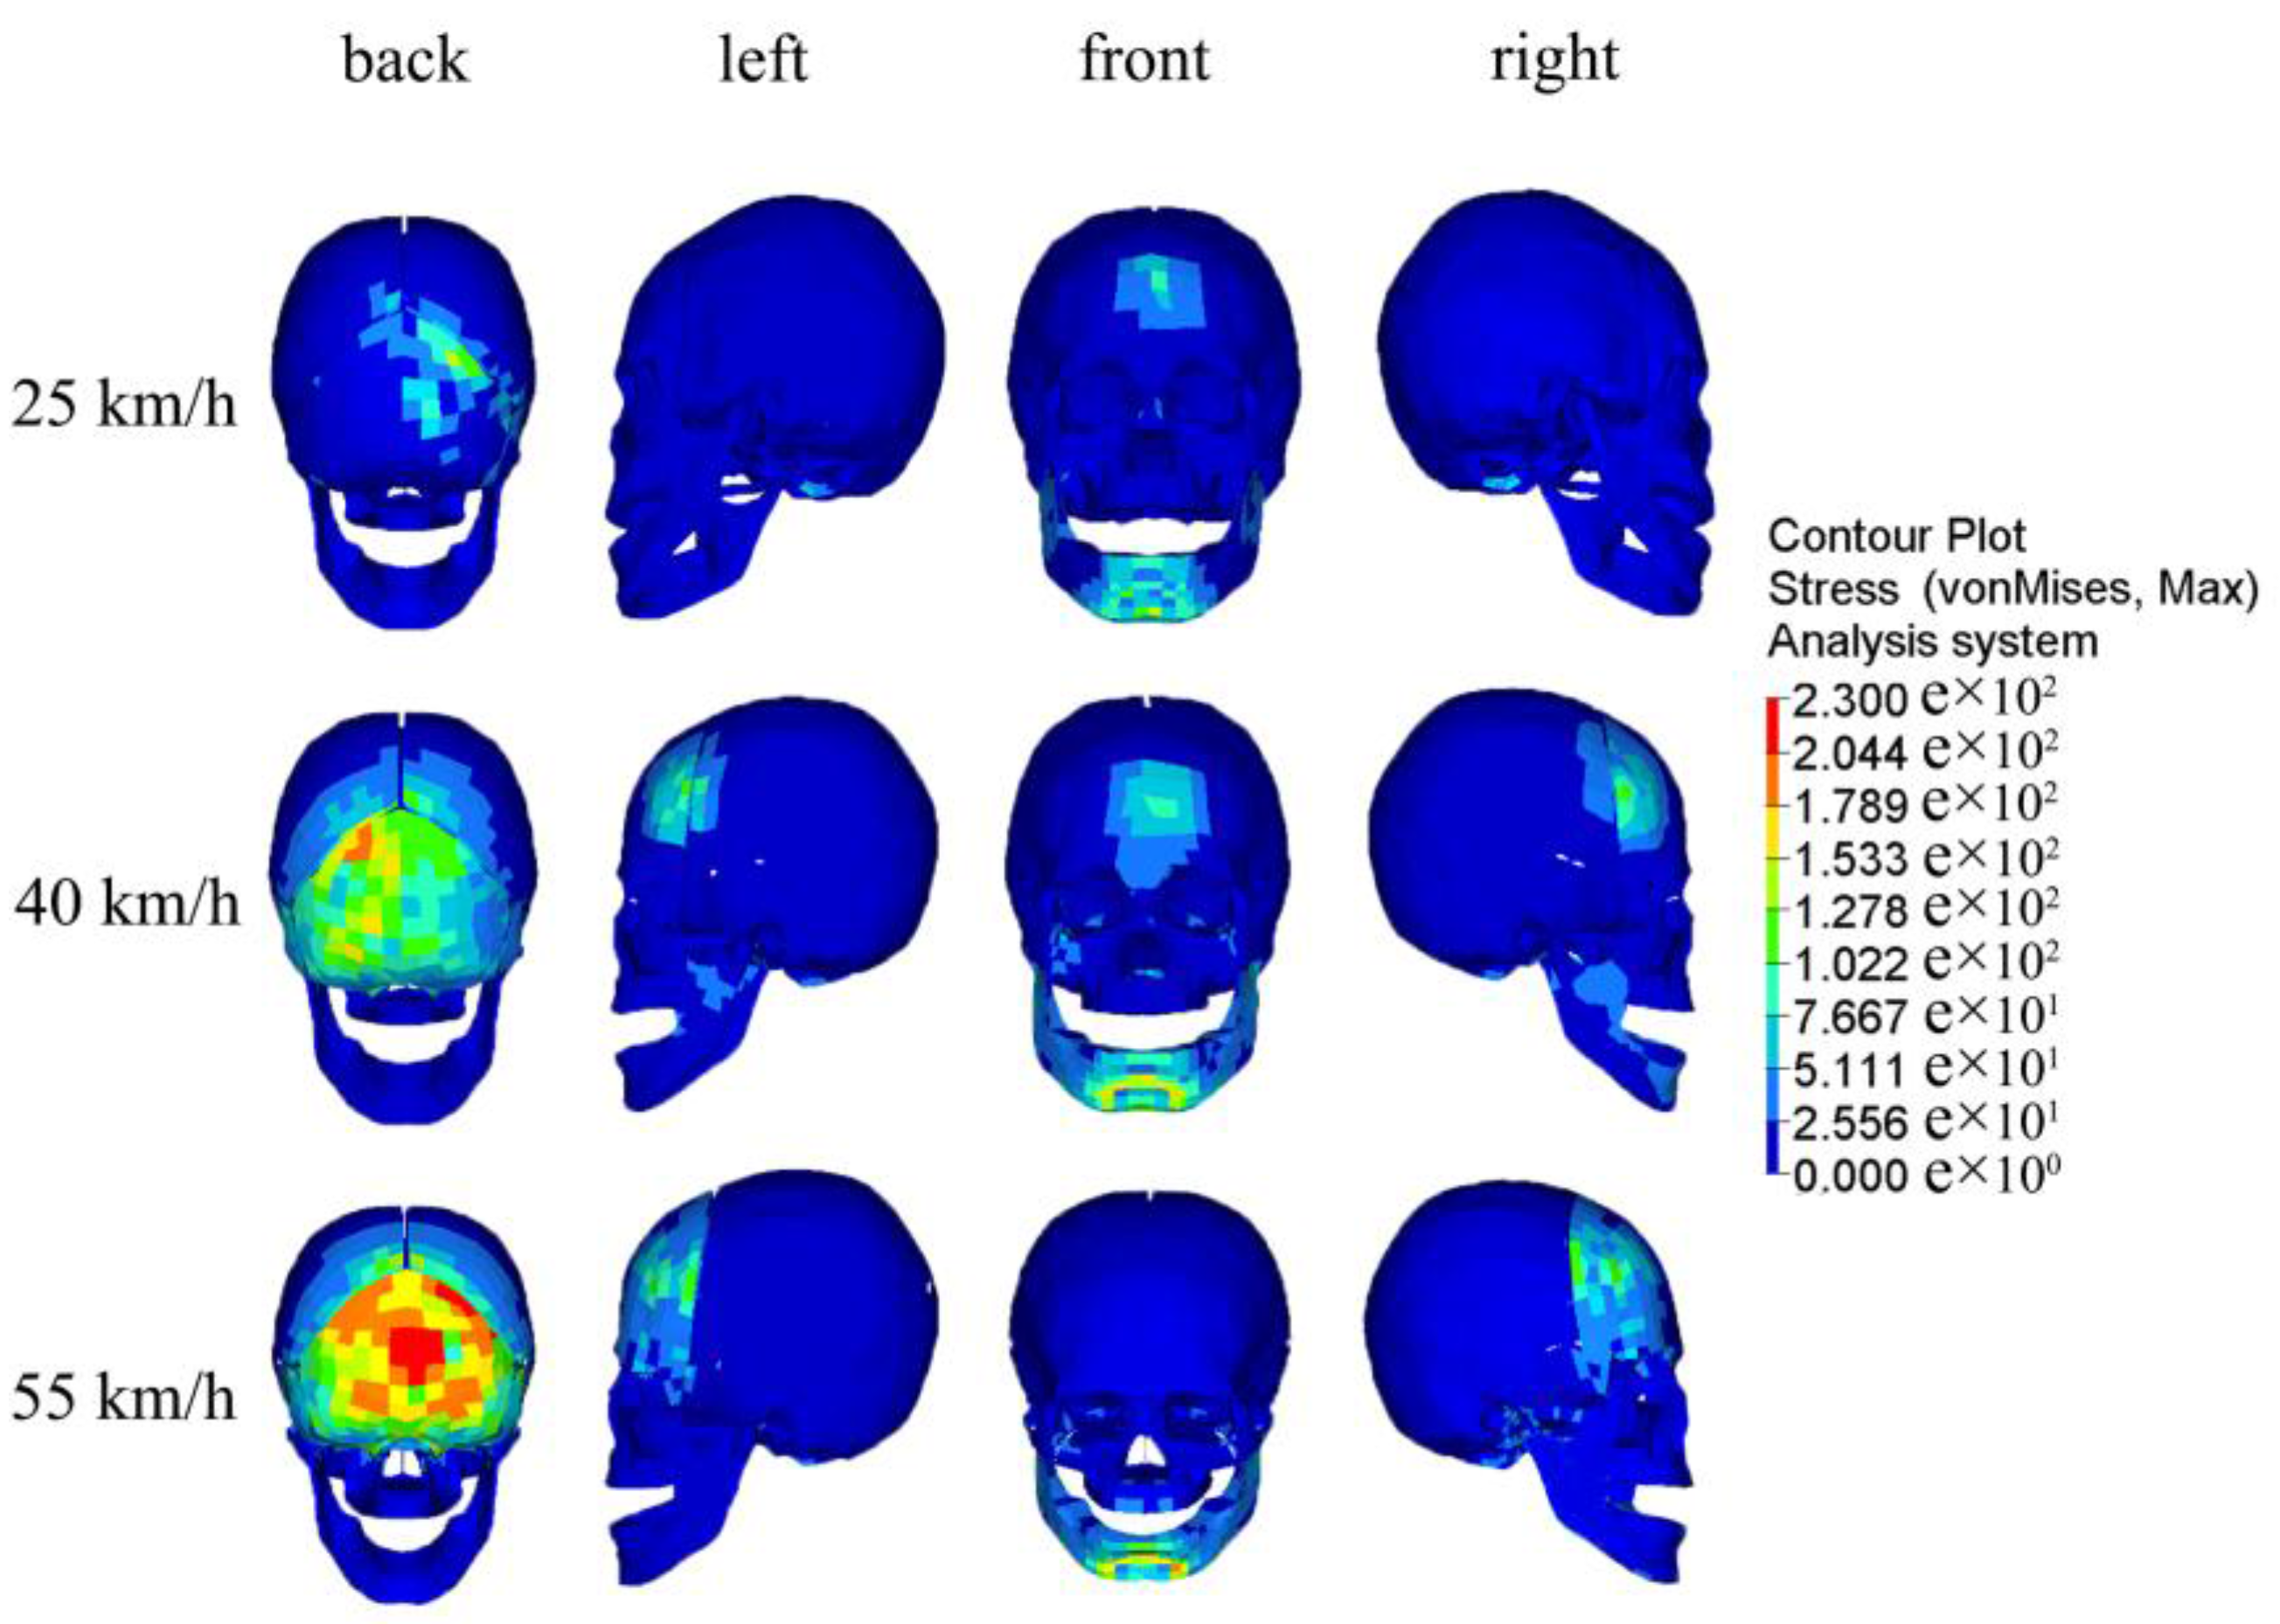
3.2.2. Skull Stress
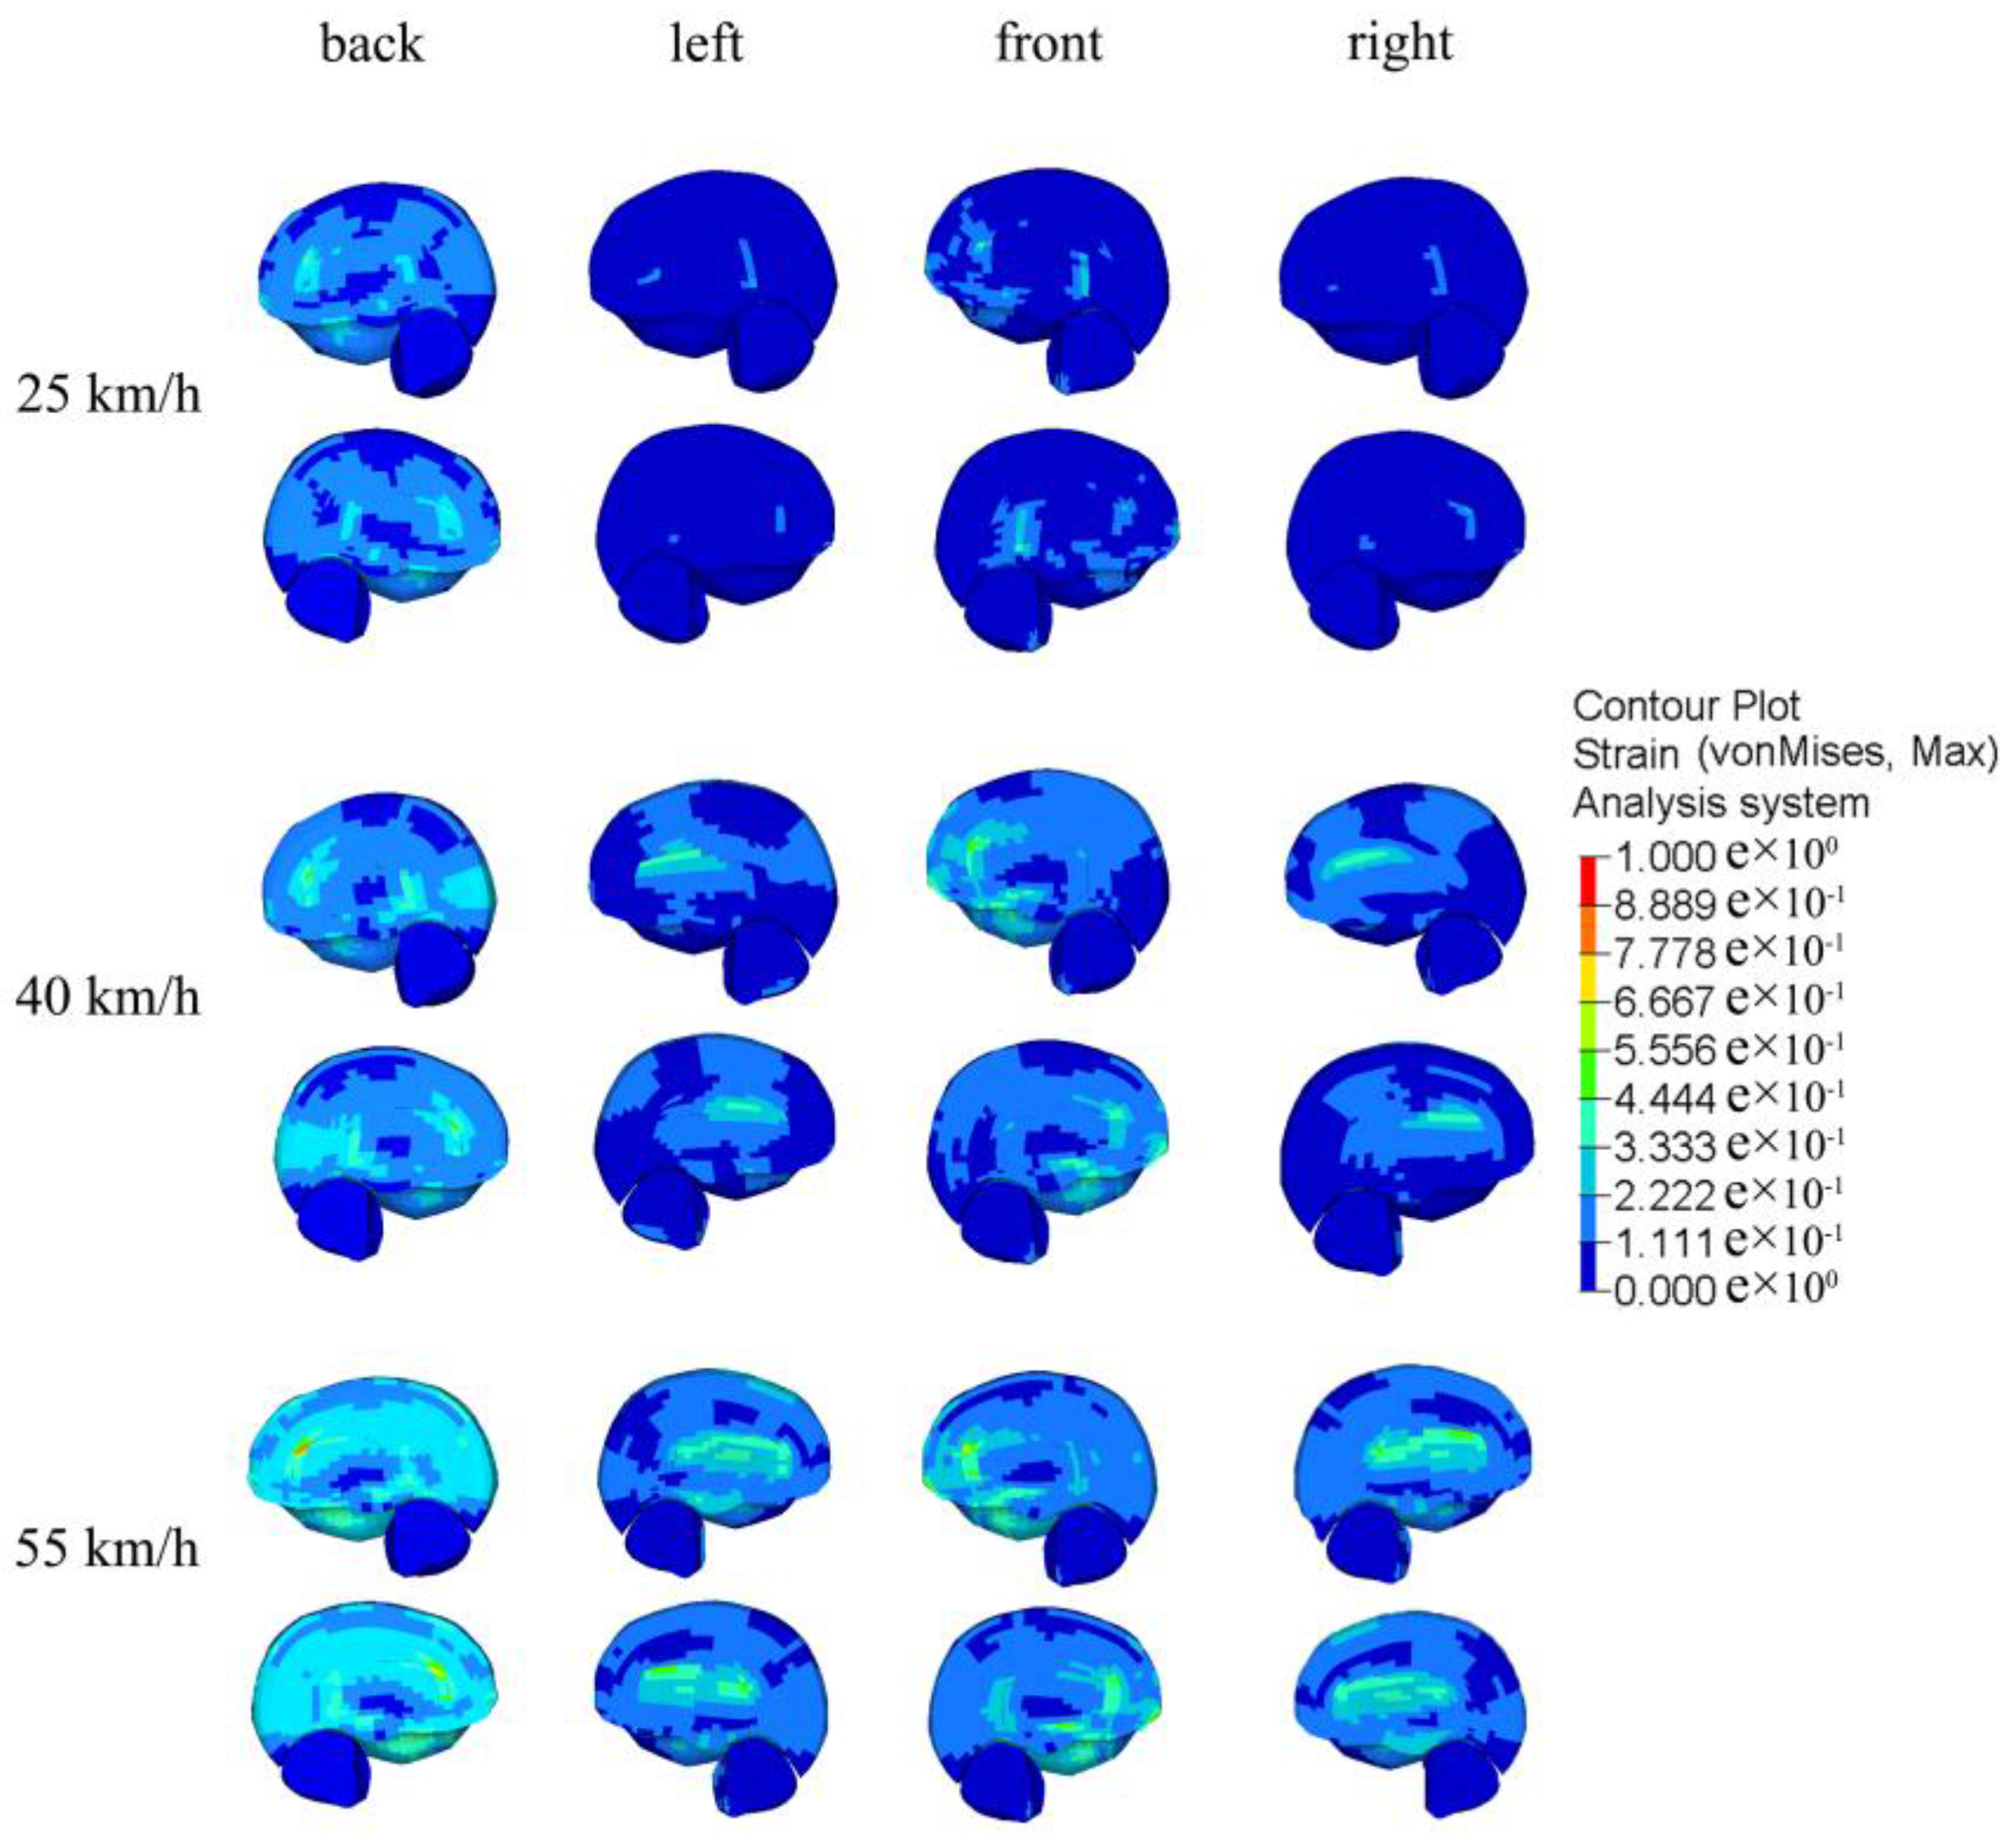
3.2.3. Brain Strain
3.2.4. Injury Reconstruction and Prediction
4. Discussion
5. Conclusions
Acknowledgments
Author Contributions
Conflicts of Interest
References
- Simms, C.K.; Wood, D.P. Effects of pre-impact pedestrian position and motion on kinematics and injuries from vehicle and ground contact. Int. J. Crashworth. 2006, 11, 345–355. [Google Scholar] [CrossRef]
- Simms, C.K.; Wood, D.P. Pedestrian risk from cars and sport utility vehicles—A comparative analytical study. Proc. Inst. Mech. Eng. Part D J. Automob. Eng. 2006, 220, 1085–1100. [Google Scholar] [CrossRef]
- Untaroiu, C.D.; Meissner, M.U.; Crandall, J.R.; Takahashi, Y.; Okamoto, M.; Ito, O. Crash reconstruction of pedestrian accidents using optimization techniques. Int. J. Impact Eng. 2009, 36, 210–219. [Google Scholar] [CrossRef]
- Lan, F.C.; Cai, Z.H.; Chen, J.Q.; Ma, Z.W. Biomechanical responses and injury evaluation of human thorax and abdomen during vehicle collision. J. South China Univ. Technol. 2012, 40, 70–78. [Google Scholar]
- Cao, L.B.; Zhou, Z.; Jiang, B.H.; Zhang, G.J. Development and validation of the FE model for a 10-year-old child head. Chin. J. Biomed. Eng. 2014, 33, 63–70. [Google Scholar]
- Wei, Z. Development of human head finite element model on biomechanical research. Chin. J. Biomed. Eng. 2011, 30, 110–119. [Google Scholar]
- Liu, W.F.; Wang, F.; Wang, D.B.; Chen, X.J.; Wang, Y.; Surgery, D.O.; Amp, E.; Group, E. The present application of finite element method in craniocerebral injury. Med. Recapitul. 2013, 21, 3926–3928. [Google Scholar]
- Ruan, S.J.; He, P.; Lu, J.P.; Li, H.Y.; Li, X.; Zhang, H.Z. Simulation based investigation on injury biomechanics of the human head by finite element method. Chin. J. Biomed. Eng. 2007, 26, 99–104. [Google Scholar]
- Liu, W.; Hui, Z.; Li, K.; Su, S.; Fan, X.; Yin, Z. Study on pedestrian thorax injury in vehicle-to-pedestrian collisions using finite element analysis. Chin. J. Traumatol. 2015, 18, 74–80. [Google Scholar] [CrossRef] [PubMed]
- Jingwen, H.U.; Jonathan, D.; Matthew, P. Focusing on vulnerable populations in crashes: Recent advances in finite element human models for injury biomechanics research. J. Automot. Saf. Energy 2012, 3, 295–307. [Google Scholar]
- Mordaka, J.; Kleiven, S.; Schijndel-De, N.V.; Lange, R.D.; Guerra, C.L.; Carter, E.; Holst, H.V. The Importance of Rotational Kinematics in Pedestrian Head to Windshield Impacts. In Proceedings of the 2007 International IRCOBI Conference on the Biomechanics of Injury, Maastricht, The Netherlands, 19–21 September 2007.
- Watanabe, R.; Katsuhara, T.; Miyazaki, H.; Kitagawa, Y.; Yasuki, T. Research of the relationship of pedestrian injury to collision speed, car-type, impact location and pedestrian sizes using human FE model (THUMS version 4). Stapp Car Crash J. 2012, 56, 269–321. [Google Scholar] [PubMed]
- Alvarez, V.S.; Halldin, P.; Kleiven, S. The influence of neck muscle tonus and posture on brain tissue strain in pedestrian head impacts. Stapp Car Crash J. 2014, 58, 63–101. [Google Scholar] [PubMed]
- Fahlstedt, M.; Halldin, P.; Kleiven, S. Comparison of multibody and finite element human body models in pedestrian accidents with the focus on head kinematics. Traffic Inj. Prev. 2016, 17, 320–327. [Google Scholar] [CrossRef] [PubMed]
- Nilsson, G. Traffic Safety Dimensions and the Power Model to Describe the Effect of Speed on Safety; Swedish National Road and Transport Research Institute: Linköping, Sweden, 2004. [Google Scholar]
- Elvik, R. A re-parameterisation of the power model of the relationship between the speed of traffic and the number of accidents and accident victims. Accid. Anal. Prev. 2013, 50, 854–860. [Google Scholar] [CrossRef] [PubMed]
- Tefft, B.C. Impact speed and a pedestrian's risk of severe injury or death. Accid. Anal. Prev. 2013, 50, 871–878. [Google Scholar] [CrossRef] [PubMed]
- Jurewicz, C.; Sobhani, A.; Woolley, J.; Dutschke, J.; Corben, B. Exploration of Vehicle Impact Speed—Injury Severity Relationships for Application in Safer Road Design. In Proceedings of the Transport Research Arena, Warsaw, Poland, 18–21 April 2016; pp. 4247–4256.
- Elliott, J.R.; Simms, C.K.; Wood, D.P. Pedestrian head translation, rotation and impact velocity: The influence of vehicle speed, pedestrian speed and pedestrian gait. Accid. Anal. Prev. 2012, 45, 342–353. [Google Scholar] [CrossRef] [PubMed]
- Richards, D.; Carroll, J. Relationship between types of head injury and age of pedestrian. Accid. Anal. Prev. 2012, 47, 16–23. [Google Scholar] [CrossRef] [PubMed]
- Hu, J.; Klinich, K.D. Toward designing pedestrian-friendly vehicles. Int. J. Veh. Saf. 2012, 8, 102873. [Google Scholar] [CrossRef]
- Mizuno, Y.; Ishikawa, H. Summary of IHRA Pedestrian Safety Working Group Activities Proposed Test Methods to Evaluate Pedestrian Protection Afforded by Passenger Cars. In Proceedings of the 19th International Technical Conference on the Enhanced Safety of Vehicles (ESV), Washington, DC, USA, 6–9 June 2005.
- Fredriksson, R.; Zhang, L.; Boström, O.; Yang, K. Influence of impact speed on head and brain injury outcome in vulnerable road user impacts to the car hood. Stapp Car Crash J. 2007, 51, 155–167. [Google Scholar] [PubMed]
- Zhang, G.; Cao, L.; Hu, J.; Yang, K.H. A field data analysis of risk factors affecting the injury risks in vehicle-to-pedestrian crashes. Ann. Adv. Automot. Med. 2008, 52, 199–214. [Google Scholar] [PubMed]
- McLean, J.; Robinson, G.K. Adelaide In-Depth Accident Study 1975–1979. Part 1: An Overview; Road Accident Research Unit: Adelaide, Australia, 1979. [Google Scholar]
- Alshammari, N.; Bendak, S.; Algadhi, S. In-depth analysis of pedestrian crashes in Riyadh. Traff. Inj. Prev. 2009, 10, 552–559. [Google Scholar] [CrossRef] [PubMed]
- Kong, C.; Yang, J. Logistic regression analysis of pedestrian casualty risk in passenger vehicle collisions in China. Accid. Anal. Prev. 2010, 42, 987–993. [Google Scholar] [CrossRef] [PubMed]
- Zhao, H.; Yin, Z.; Chen, R.; Chen, H.; Song, C.; Yang, G.; Wang, Z. Investigation of 184 passenger car–pedestrian accidents. Int. J. Crashworth. 2010, 15, 313–320. [Google Scholar] [CrossRef]
- Chen, H.; Fu, L.; Zheng, H. A comparative study between China and IHRA for the vehicle–pedestrian impact. SAE Int. J. Passeng. Cars Mech. Syst. 2009, 2, 1108–1115. [Google Scholar]
- Zheng, H.; Liu, J.Y.; Song, F.J.; Chen, K.X. An investigation on the head injuries of adult pedestrians by passenger cars in China. Traff. Inj. Prev. 2013, 14, 712–717. [Google Scholar]
- Civil, I.D.; Schwab, C.W. The abbreviated injury scale, 1985 revision: A condensed chart for clinical use. J. Trauma 1988, 28, 87–90. [Google Scholar] [CrossRef] [PubMed]
- Zou, T.; Yu, Z.; Cai, M.; Liu, J. Analysis and application of relationship between post-braking-distance and throw distance in vehicle–pedestrian accident reconstruction. Forensic Sci. Int. 2011, 207, 135–144. [Google Scholar] [CrossRef] [PubMed]
- Xu, S.; Yang, S.; Chen, C.; Wu, G. Speed Identification Based on Surveillance Video in Traffic Accidents. In Proceedings of the International Conference on Intelligent Control and Computer Application (ICCA 2016), Zhengzhou, China, 16–17 January 2016.
- Su, S.; Liu, W.J.; Wang, F.P.; Li, K.; Yin, Z.Y. Comparison of different means to determine postcrash velocity in a real-world vehicle–pedestrian accident. Appl. Mech. Mater. 2014, 496–500, 3031–3033. [Google Scholar] [CrossRef]
- Thole, C.A. Advanced Mode Analysis for Crash Simulation Results. In Proceedings of the 11th International LS-DYNA Conference, Dearborn, MI, USA, 6–8 June 2010.
- Iza-Teran, R. Enabling the analysis of finite element simulation bundles. Int. J. Uncertain. Quantif. 2014, 4, 95–110. [Google Scholar] [CrossRef]
- Hou, S.; Dong, D.; Ren, L.; Han, X. Multivariable crashworthiness optimization of vehicle body by unreplicated saturated factorial design. Struct. Multidiscip. Optim. 2012, 46, 891–905. [Google Scholar] [CrossRef]
- NCAC. Available online: http://www.ncac.gwu.edu/vml/models.html (accessed on 1 March 2014).
- Marzougui, D.; Brown, D.; Park, H.K.; Kan, C.D.; Opiela, K.S. Development & Validation of a Finite Element Model for a Mid-Sized Passenger Sedan. In Proceedings of the 13th International LS-DYNA Users Conference, Dearborn, MI, USA, 8–10 June 2014.
- TMC. THUMS User Manual, am50 Pedestrian/Occupant Model, Academic Version 4.0_20111003; Toyota Motor Corporation: Aichi, Japan, 2011. [Google Scholar]
- Watanabe, R.; Miyazaki, H.; Kitagawa, Y.; Yasuki, T. Research of collision speed dependency of pedestrian head and chest injuries using human FE model (THUMS version 4). Accid. Reconstr. J. 2012, 22, 31–40. [Google Scholar]
- Total Human Model for Safety—THUMS. Available online: http://www.lstc.com/thums (accessed on 1 March 2014).
- Yang, J. Overview of research on injury biomechanics in car–pedestrian collisions. Chin. J. Automot. Eng. 2011, 1, 81–93. [Google Scholar]
- Paas, R.; Östh, J.; Davidsson, J. Which Pragmatic Finite Element Human Body Model Scaling Technique Can Most Accurately Predict Head Impact Conditions in Pedestrian–Car Crashes? In Proceedings of the 2015 IRCOBI conference Proceedings, Lyon, France, 9–11 September 2015.
- Mackay, M. The increasing importance of the biomechanics of impact trauma. Sadhana 2007, 32, 397–408. [Google Scholar] [CrossRef]
- Mcelhaney, J.H.; Fogle, J.L.; Melvin, J.W.; Haynes, R.R.; Roberts, V.L.; Alem, N.M. Mechanical properties on cranial bone. J. Biomech. 1970, 3, 495–511. [Google Scholar] [CrossRef]
- Thibault, L.E.; Gennarelli, T.A.; Margulies, S.S.; Marcus, J.; Eppinger, R. The Strain Dependent Pathophysiological Consequences of Inertial Loading on Central Nervous System tissue. In Proceedings of the International IRCOBI Conference on the Biomechanics of Impacts, Bron, France, 12–14 September 1990.
- Rd, M.B.; Cater, H.L.; Wang, C.C.; Thomas, F.C.; Hung, C.T.; Ateshian, G.A.; Sundstrom, L.E. A tissue level tolerance criterion for living brain developed with an in vitro model of traumatic mechanical loading. Stapp Car Crash J. 2003, 47, 93–105. [Google Scholar]
- Shijie, R. A new exploration of the applicability of the head injury criterion. J. Biomed. Eng. 2007, 24, 1373–1377. [Google Scholar]
- Hertz, E. A Note on the Head Injury Criterion (HIC) as a Predictor of the Risk of Skull Fracture. In Proceedings of the 37th Annual Conference Association for the Advancement of Automotive Medicine, San Antonio, TX, USA, 4–6 November 1993.
- Niebuhr, T.; Junge, M.; Rosén, E. Pedestrian injury risk and the effect of age. Accid. Anal. Prev. 2016, 86, 121–128. [Google Scholar] [CrossRef] [PubMed]


| Age, Gender | Impact Velocity, Contact Angle | Injury Description | Impacted Structure | |
|---|---|---|---|---|
| Case 1 | 59, female | 51 km/h, left | Superficial scalp injury (5.0 cm × 4.0 cm, right side), Scalp hematoma in temporal and parietal area (8.0 cm × 8.0 cm, left side), Subdural hematomas in temporal area (left side), Skull fracture (left side) | Car engine hood |
| Case 2 | 50, female | 55 km/h, back | Superficial scalp injury (5.5 cm × 4.4 cm, back side), Scalp hematoma in temporal area (2.4 cm × 1.5 cm, left side), Foramen magnum puncture site bleeding, Skull fracture (back side) | Car engine hood |
| Velocities (km/h) | Contusion and Laceration of Scalp 1 | Skull Fractures 2 | Contusion and Laceration of Brain 3 | Head Injuries AIS 4 | ||||||||
|---|---|---|---|---|---|---|---|---|---|---|---|---|
| No Contusion or Laceration | Unilateral | Bilateral | No Fracture | Unilateral | Bilateral | No Contusion or Laceration | Unilateral | Bilateral | (6, 5) | (4, 3) | (2, 1) | |
| 25–39 | 3 | 8 | 1 | 9 | 2 | 1 | 11 | 1 | 0 | 0 | 7 | 5 |
| 40–55 | 7 | 11 | 3 | 6 | 11 | 4 | 19 | 2 | 0 | 2 | 17 | 2 |
| >55 | 10 | 14 | 4 | 3 | 19 | 6 | 14 | 6 | 8 | 12 | 16 | 0 |
| Contact Angles | Contusion and Laceration of Scalp 1 | Skull Fractures 2 | Contusion and Laceration of Brain 3 | Head Injuries AIS 4 | |||||||||||
|---|---|---|---|---|---|---|---|---|---|---|---|---|---|---|---|
| No Contusion or Laceration | Left | Right | Bilateral | No Fracture | Left | Right | Bilateral | No Contusion or Laceration | Left | Right | Bilateral | (6, 5) | (4, 3) | (2, 1) | |
| Left | 10 | 2 | 18 | 3 | 9 | 19 | 1 | 4 | 25 | 5 | 0 | 3 | 3 | 25 | 5 |
| Right | 8 | 8 | 4 | 1 | 7 | 0 | 11 | 3 | 15 | 0 | 3 | 3 | 12 | 7 | 2 |
| Back | 2 | 0 | 1 | 4 | 2 | 0 | 1 | 4 | 4 | 0 | 1 | 2 | 4 | 3 | 0 |
| Real Injury | Injury Reconstruction | Injury Prediction | |||||||
|---|---|---|---|---|---|---|---|---|---|
| Head Injury Severity | Skull Fracture | Traumatic Brain Injuries | HIC | Peak Stress on the Skull | Maximal Principal Strain for the Brain | Head Injury Severity | Skull Fracture | Traumatic Brain Injuries | |
| Case 1 | fatal | yes | yes | 1909 | 185 MPa | 0.45 | fatal | yes | yes |
| Case 2 | fatal | yes | yes | 10711 | 230 MPa | 0.79 | fatal | yes | yes |
© 2016 by the authors; licensee MDPI, Basel, Switzerland. This article is an open access article distributed under the terms and conditions of the Creative Commons Attribution (CC-BY) license (http://creativecommons.org/licenses/by/4.0/).
Share and Cite
Liu, W.; Su, S.; Qiu, J.; Zhang, Y.; Yin, Z. Exploration of Pedestrian Head Injuries—Collision Parameter Relationships through a Combination of Retrospective Analysis and Finite Element Method. Int. J. Environ. Res. Public Health 2016, 13, 1250. https://doi.org/10.3390/ijerph13121250
Liu W, Su S, Qiu J, Zhang Y, Yin Z. Exploration of Pedestrian Head Injuries—Collision Parameter Relationships through a Combination of Retrospective Analysis and Finite Element Method. International Journal of Environmental Research and Public Health. 2016; 13(12):1250. https://doi.org/10.3390/ijerph13121250
Chicago/Turabian StyleLiu, Wenjun, Sen Su, Jinlong Qiu, Yongyong Zhang, and Zhiyong Yin. 2016. "Exploration of Pedestrian Head Injuries—Collision Parameter Relationships through a Combination of Retrospective Analysis and Finite Element Method" International Journal of Environmental Research and Public Health 13, no. 12: 1250. https://doi.org/10.3390/ijerph13121250