
Impact of Calcium and Magnesium in Groundwater and Drinking Water on the Health of Inhabitants of the Slovak Republic

Abstract
:1. Introduction
2. Materials and Methods
2.1. Environmental Indicators
2.2. Health Indicators
2.3. Statistical Analysis
2.4. Neural Network Analysis
2.5. Comparison of Health According to Geological Structure
- Paleogene Flysch: mainly sandstones, shales, and claystones
- Carbonate-Silicate Mesozoic and Paleogene: mainly marl, marly limestones, dolomites, sandstones, and shales
- Carbonate Mesozoic and Basal Paleogene: mainly limestones, dolomites, and carboniferous conglomerates
- Neogene: mainly clays, claystones, conglomerates, sands, and gravels
- Quaternary: mainly gravel, sand, clay, and rock fragments
- Crystalline: mostly granites, gneisses, and migmatites
- Paleozoic: mostly metasediments, and metavolcanics
- Neovolcanic rocks: mainly andesites, basalts, and their volcanoclastics
3. Results
4. Discussion
4.1. Statistical Analysis
4.2. Neural Networks
4.3. Comparison of Health Regarding Geological Structure
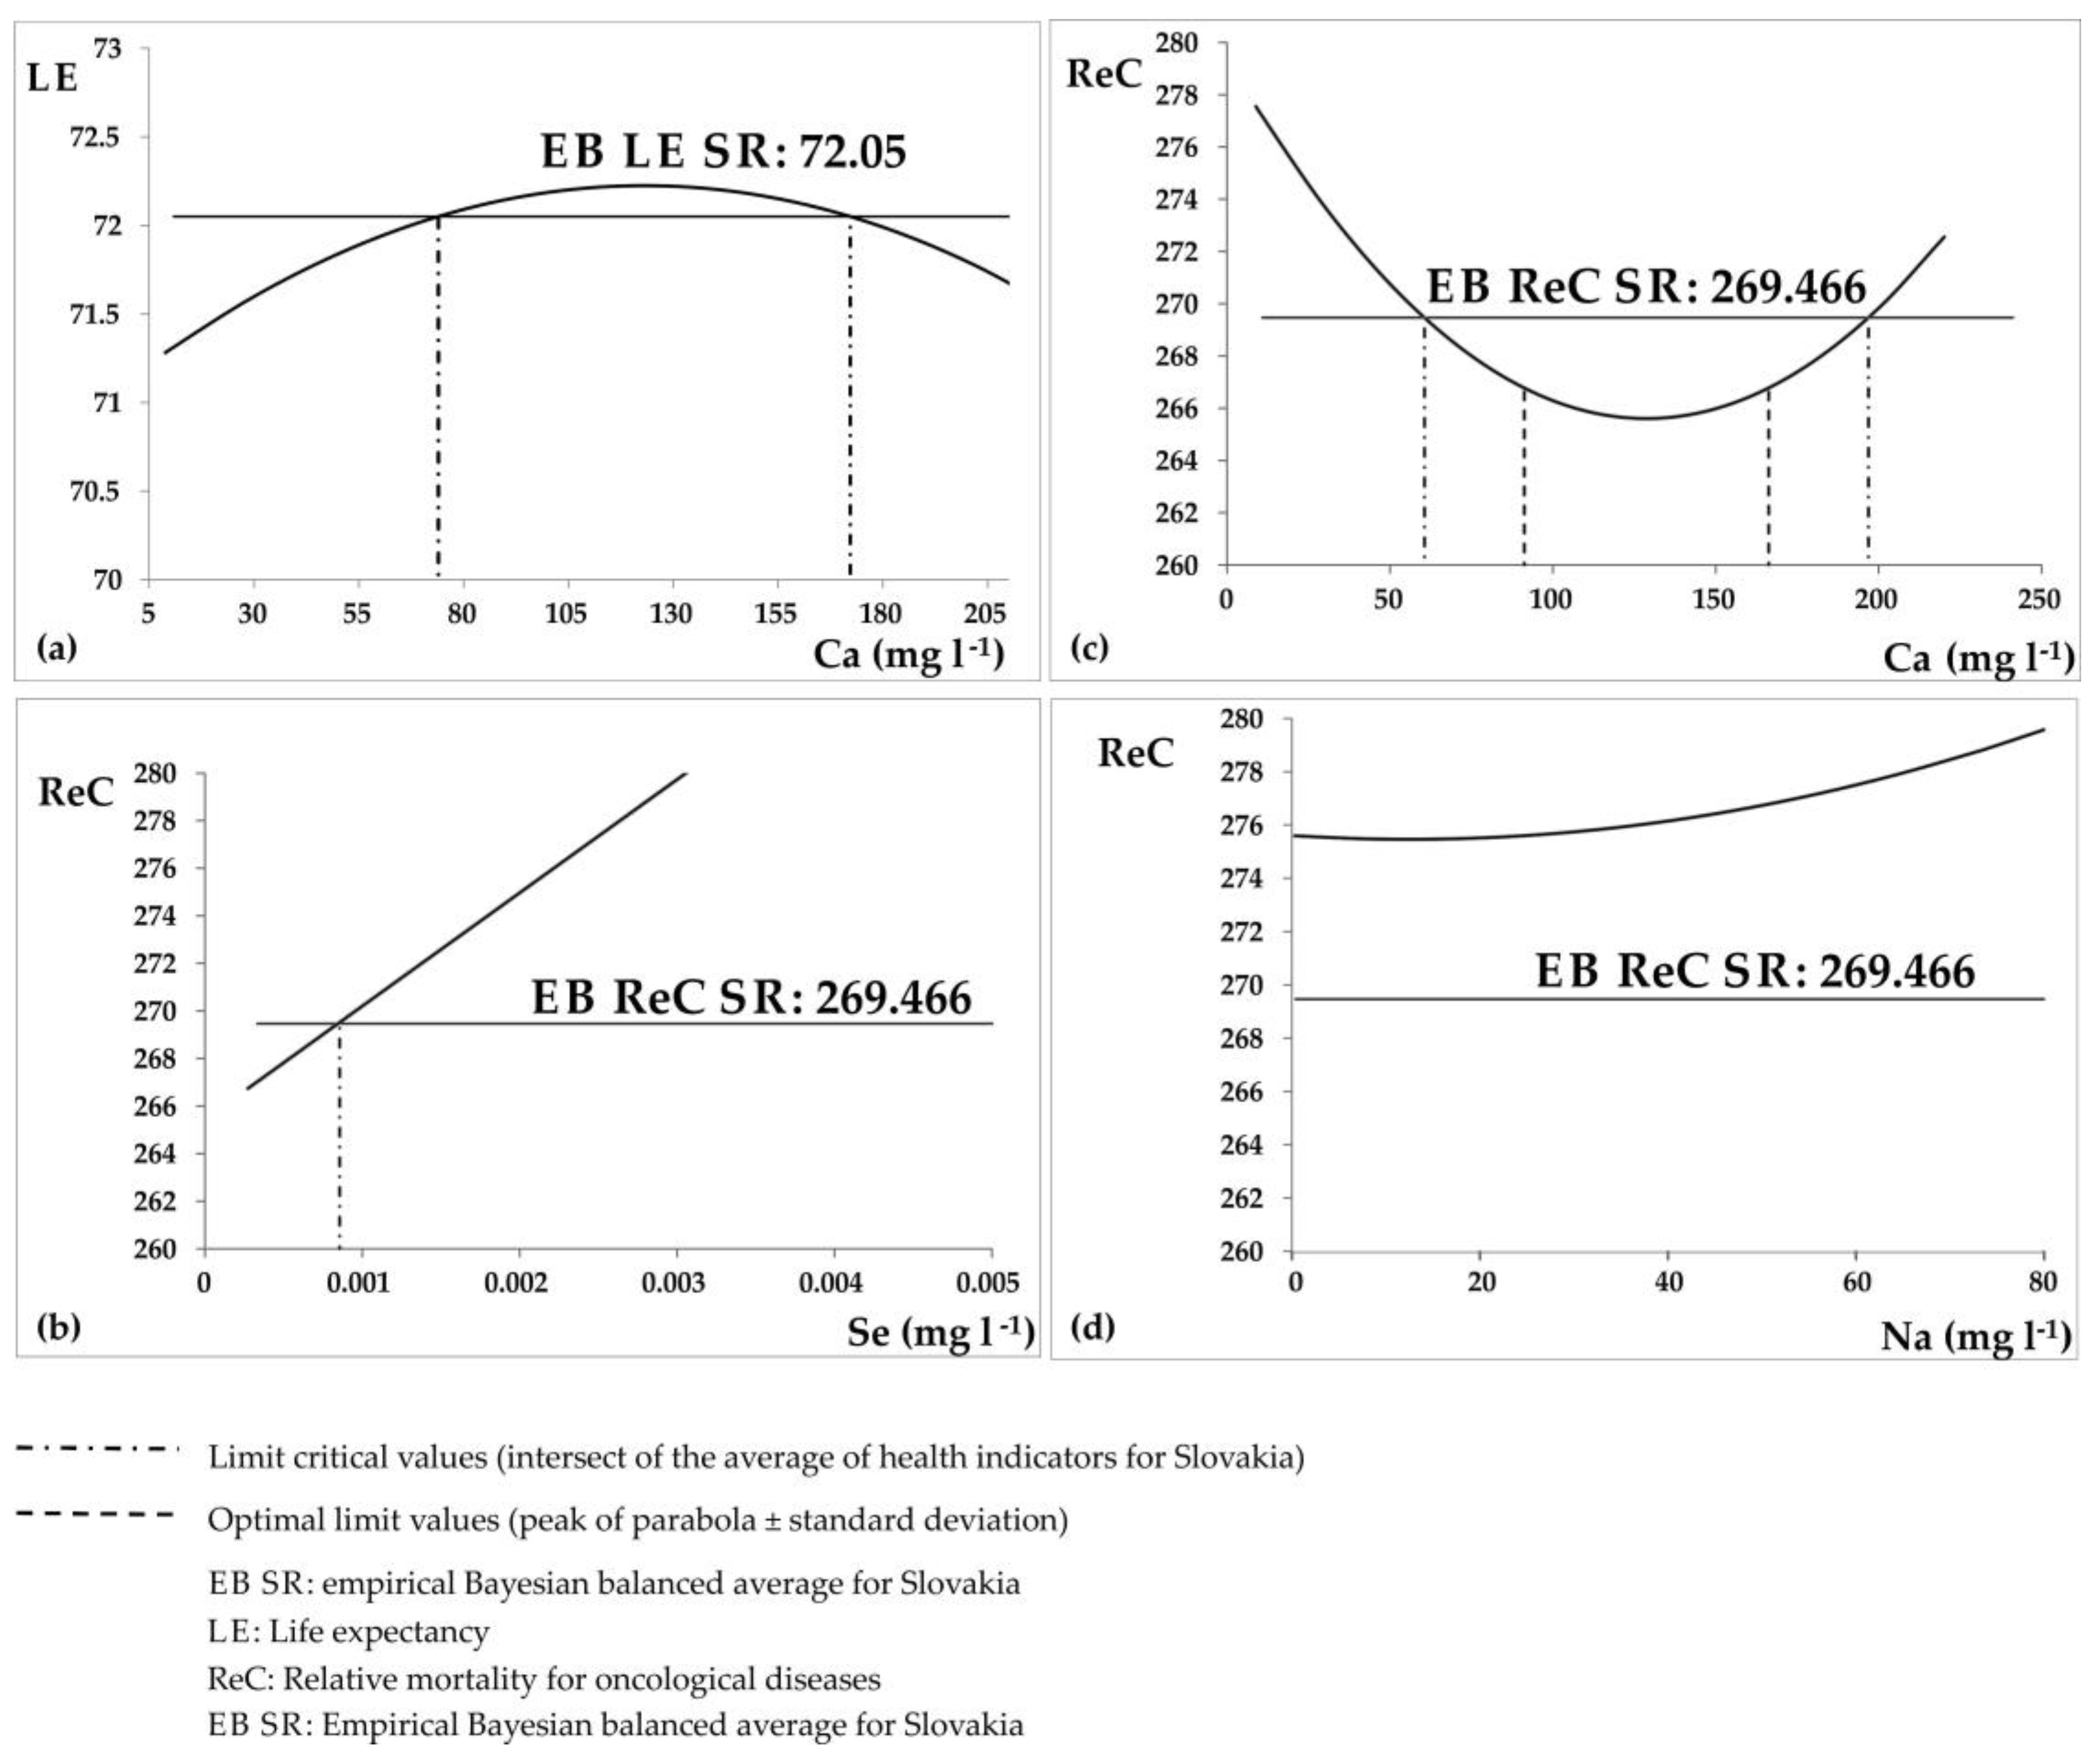
4.4. Proposed Limit Values
4.5. Other Impacts Besides Environmental Factors
5. Conclusions
Acknowledgments
Author Contributions
Conflicts of Interest
References
- Selinus, O.; Alloway, B.J.; Centeno, J.A.; Finkelman, R.B.; Fuge, R.; Lindh, U.; Smedley, P. Essentials of Medical Geology, Impacts of the Natural Environment on Public Health, 1st ed.; Elsevier: Amsterdam, The Netherlands; Academic Press: Cambridge, MA, USA, 2005; p. 832. [Google Scholar]
- Brümmer, G.W. Heavy metal species, mobility and availability. In The Importance of Chemical Speciation in Environmental Processes; Bernhard, M., Brinkman, F.E., Sadler, P.J., Eds.; Springer: Berlin, Germany, 1986; pp. 169–192. [Google Scholar]
- National Research Council (NRC). Bioavailability of Contaminants in Soils and Sediments, Processes, Tools, and Applications; Committee on Bioavailability of Contaminants in Soils and Sediments, Water Science and Technology Board, Division on Earth and Life Studies, National Research Council, National Academies Press: Washington, DC, USA, 2003; p. 432. [Google Scholar]
- Kabata-Pendias, A.; Mukherjee, A.B. Trace Elements from Soil to Human; Springer: Berlin, Germany; New York, NY, USA, 2007; p. 550. [Google Scholar]
- McGeer, J.; Henningsen, G.; Lanno, R.; Fisher, N.; Sappington, K.; Drexler, J. Issue Paper on the Bioavailability and Bioaccumulation of Metals; U.S. Environmental Protection Agency, Risk Assessment Forum: Washington, DC, USA, 2004; p. 122.
- Chojnacka, K.; Chojnacki, A.; Górecka, H.; Górecki, H. Bioavailability of heavy metals from polluted soils to plants. Sci. Total Environ. 2005, 337, 175–182. [Google Scholar] [CrossRef] [PubMed]
- Peralta-Videa, J.R.; Lopez, M.L.; Narayan, M.; Saupe, G.; Gardea-Torresdey, J. The biochemistry of environmental heavy metal uptake by plants: Implications for the food chain. Int. J. Biochem. Cell Biol. 2009, 41, 1665–1677. [Google Scholar] [CrossRef] [PubMed]
- Rubenowitz, E.; Axelsson, G.; Rylander, R. Magnesium in drinking water and death from acute myocardial infarction. Am. J. Epidemiol. 1996, 143, 456–462. [Google Scholar] [CrossRef] [PubMed]
- Rosborg, I. (Ed.) Drinking Water Minerals and Mineral Balance Importance, Health Significance, Safety Precautions; Springer: Cham, Switzerland, 2015; p. 140.
- Smith, A.H.; Hopenhayn-Rich, C.; Bates, M.N.; Goeden, H.M.; Hertz-Picciotto, I.; Duggan, H.M.; Wood, R.; Kosnett, M.J.; Smith, M.T. Cancer risks from arsenic in drinking water. Environ. Health Perspect. 1992, 97, 259–267. [Google Scholar] [CrossRef] [PubMed]
- Morales-Suarez-Varela, M.M.; Llopi-Gonzales, A.; Tejerizo-Perez, M.L. Impact of nitrates in drinking water on cancer mortality in Valencia, Spain. Eur. J. Epidemiol. 1995, 11, 15–21. [Google Scholar] [CrossRef] [PubMed]
- Järup, L.; Berglund, M.; Elinder, C.G.; Nordberg, G.; Vahter, M. Health effects of cadmium exposure—A review of the literature and a risk estimate. Scand. J. Work Environ. Health 1998, 24, 1–52. [Google Scholar] [PubMed]
- Fryzek, J.P.; Mumma, M.T.; McLaughlin, J.K.; Henderson, B.E.; Blot, W.J. Cancer mortality in relation to environmental chromium exposure. J. Occup. Environ. Med. 2001, 43, 635–640. [Google Scholar] [CrossRef] [PubMed]
- World Health Organization (WHO). Nitrate and Nitrite in Drinking-Water; Background Document for Development of WHO Guidelines for Drinking-Water Quality; World Health Organization: Geneva, Switzerland, 2011; p. 23. [Google Scholar]
- Mitchell, E.; Frisbie, S.; Sarkar, B. Exposure to multiple metals from groundwater—A global crisis: Geology, climate change, health effects, testing, and mitigation. Metallomics 2011, 3, 874–908. [Google Scholar] [CrossRef] [PubMed]
- World Health Organization (WHO). Guidelines for Drinking Water Quality, 4th ed.; World Health Organization: Geneva, Switzerland, 2011; p. 541. [Google Scholar]
- Anon. Government regulation of the Slovak Republic No. 496/2010 of Coll. On Quality Requirements on Water Used for Human Consumption and Water Quality Control. 2010. (In Slovak)Available online: https://www.slov-lex.sk/pravne-predpisy/SK/ZZ/2010/496/20110101 (accessed on 10 December 2016).
- Catling, L.A.; Abubakar, I.; Lake, I.R.; Swift, L.; Hunter, P.R. A systematic review of analytical observational studies investigating the association between cardiovascular disease and drinking water hardness. J. Water Health 2008, 6, 433–442. [Google Scholar] [CrossRef] [PubMed]
- Rylander, R.; Bonevik, H.; Rubenowitz, E. Magnesium and calcium in drinking water and cardiovascular mortality. Scand. J. Work Environ. Health 1991, 17, 91–94. [Google Scholar] [CrossRef] [PubMed]
- Yang, C.Y.; Chiu, H.F.; Chiu, J.F.; Wang, T.N.; Cheng, M.F. Magnesium and calcium in drinking water and cerebrovascular mortality in Taiwan. Magnes. Res. 1997, 10, 51–57. [Google Scholar] [PubMed]
- Rubenowitz, E.; Axelsson, G.; Rylander, R. Magnesium and calcium in drinking water and death from acute myocardial infarction in women. Am. Epidemiol. 1999, 10, 31–36. [Google Scholar] [CrossRef]
- Nerbrand, C.; Agréus, L.; Lenner, R.A.; Nyberg, P.; Svärdsudd, K. The influence of calcium and magnesium in drinking water and diet on cardiovascular risk factors in individuals living in hard and soft areas with differences in cardiovascular mortality. BMC Public Health 2003, 3, 1–9. [Google Scholar] [CrossRef] [PubMed] [Green Version]
- Kousa, A.; Havulinna, A.S.; Moltchanova, E.; Taskinen, O.; Nikkarinen, M.; Karvonen, J.; Karvonen, M. Calcium: Magnesium ratio in local groundwater and incidence of acute myocardial infarction among males in rural Finland. Environ. Health Perspect. 2006, 114, 730–734. [Google Scholar] [CrossRef] [PubMed]
- Maksimović, Z.; Ršumović, M.; Djordjević, M. Magnesium and calcium in drinking water in relation to cardiovascular mortality in Serbia. Bull. T CXL Acad. Serbe Sci. Arts 2010, 46, 131–140. [Google Scholar]
- Yang, C.H.Y.; Chiu, H.F.; Chiu, J.F.; Tsai, S.S.; Cheng, M.F. Calcium and magnesium in drinking water and risk of death from colon cancer. Jpn. J. Cancer Res. 1997, 88, 928–933. [Google Scholar] [CrossRef] [PubMed]
- Yang, C.H.Y.; Chiu, H.F.; Cheng, M.F.; Tsai, S.S.; Hung, C.H.F.; Lin, M.C.H. Esophageal cancer mortality and total hardness levels in Taiwan’s drinking water. Environ. Res. Sect. A 1999, 81, 302–308. [Google Scholar] [CrossRef] [PubMed]
- Yang, C.H.Y.; Chiu, H.F.; Cheng, M.F.; Tsai, S.S.; Hung, C.H.F.; Tseng, Y.T. Pancreatic cancer mortality and total hardness levels in Taiwan’s drinking water. J. Toxicol. Environ. Health A 1999, 56, 361–369. [Google Scholar] [CrossRef] [PubMed]
- Yang, C.H.Y.; Tsai, S.S.; Lai, T.C.H.; Hung, C.H.F.; Chiu, H.F. Rectal cancer mortality and total hardness in Taiwan’s drinking water. Environ. Res. Sect. A 1999, 80, 311–316. [Google Scholar] [CrossRef] [PubMed]
- Yang, C.-Y.; Chiu, H.-F.; Cheng, B.-H.; Hsu, T.-Y.; Cheng, M.-F.; Wu, T.-N. Calcium and magnesium in drinking water and the risk of death from breast cancer. J. Toxicol. Environ. Health Part A Curr. Issues 2000, 60, 231–241. [Google Scholar]
- Rapant, S.; Cvečková, V.; Fajčíková, K.; Dietzová, Z.; Stehlíková, B. Chemical composition of groundwater/drinking water and oncological disease mortality, Slovak Republic. Environ. Geochem. Health 2016, 39, 191–208. [Google Scholar] [CrossRef] [PubMed]
- Rapant, S.; Letkovičová, M.; Cvečková, V.; Fajčíková, K.; Galbavý, J.; Letkovič, M. Environmentálne a Zdravotné Indikátory Slovenskej Republiky (Environmental and Health Indicators of the Slovak Republic); ŠGÚDŠ: Bratislava, Slovak Republic, 2010; p. 279. (In Slovak) [Google Scholar]
- Rapant, S.; Vrana, K.; Bodiš, D. Geochemical Atlas of Slovakia-Part I. Groundwater; Monograph, Ministry of the Environment of the Slovak Republic, Geological Survey of Slovak Republic: Bratislava, Slovak Republic, 1996; p. 127. [Google Scholar]
- Rapant, S.; Cvečková, V.; Dietzová, Z.; Fajčíková, K.; Hiller, E.; Finkelman, R.B.; Škultétyová, S. The potential impact of geological environment on health status of residents of the Slovak Republic. Environ. Geochem. Health 2014, 36, 543–561. [Google Scholar] [CrossRef] [PubMed]
- Klinda, J.; Lieskovská, Z. State of the Environment Report of the Slovak Republic; Ministry of Environment of the Slovak Republic: Bratislava, Slovak Republic, 2010; p. 192. [Google Scholar]
- Asociácia Výrobcov Nealkoholických Nápojov a Minerálnych vôd na Slovensku/Slovak Soft Drinks and Mineral Waters Association. Available online: http://www.jsworks.sk/nealko/sk/ (accessed on 31 January 2017).
- Geohealth. Available online: www.geology.sk/geohealth (accessed on 15 November 2016). (In Slovak)
- Last, J.M. A Dictionary of Epidemiology; Oxford University Press: Oxford, UK, 2001. [Google Scholar]
- World Health Organization. Available online: www.who.int/classifications/icd/en/ (accessed on 29 November 2016).
- Štatistický Úrad Slovenskej Republiky/Statistical Office of the Slovak Republic. Available online: https://slovak.statistics.sk/wps/portal/ext/home/!ut/p/ (accessed on 6 December 2016).
- Beaglehole, R.; Bonita, R.; Kjellstrom, T. Basic Epidemiology; World Health Organization: Geneva, Switzerland, 1993; p. 174. [Google Scholar]
- Jeníček, M. Epidemiology, the Logic of Modern Medicine; Epimed International: Montreal, QC, Canada, 1995; p. 335. [Google Scholar]
- Bencko, V.; Hrach, K.; Malý, H.; Pikhart, J.; Reissigová, Š.; Svačina, Š.; Tomečková, M.; Zvárová, J. Biomedical Statistics III, Statistical Methods in Epidemiology. Part 1; Charles University: Prague, Czech Republic, 2003; p. 236. (In Czech) [Google Scholar]
- Bencko, V.; Hrach, K.; Malý, H.; Pikhart, J.; Reissigová, Š.; Svačina, Š.; Tomečková, M.; Zvárová, J. Biomedical Statistics III, Statistical Methods in Epidemiology. Part 2; Charles University: Prague, Czech Republic, 2003; p. 505. (In Czech) [Google Scholar]
- Rapant, S.; Fajčíková, K.; Cvečková, V.; Ďurža, A.; Stehlíková, B.; Sedláková, D.; Ženišová, Z. Chemical composition of groundwater and relative mortality for cardiovascular diseases in the Slovak Republic. Environ. Geochem. Health 2015, 37, 745–756. [Google Scholar] [CrossRef] [PubMed]
- Opitz, D.W.; Shavlik, J.W. Actively searching for an effective neural network ensemble. Connect. Sci. 1996, 8, 337–354. [Google Scholar] [CrossRef]
- Han, S.; Liu, Y.; Yan, J. Neural network ensemble method study for wind power prediction. In Proceedings of the Asia-Pacific Power and Energy Engineering Conference (APPEEC ’11), Wuhan, China, 25–28 March 2011; pp. 1–4.
- Kourentzes, N.; Barrow, D.K.; Crone, S.F. Neural network ensemble operators for time series forecasting. Expert Syst. Appl. 2014, 41, 4235–4244. [Google Scholar] [CrossRef] [Green Version]
- Chaikaew, N.; Tripathi, N.K.; Souris, M. Exploring spatial patterns and hotspots of diarrhea in Chiang Mai, Thailand. Int. J. Health Geogr. 2009, 8, 26. [Google Scholar] [CrossRef] [PubMed]
- Chen, J.; Roth, R.E.; Naito, A.T.; Lengerich, E.J.; MacEachren, A.M. Geovisual analytics to enhance spatial scan statistic interpretation: An analysis of US cervical cancer mortality. Int. J. Health Geogr. 2008, 7, 57. [Google Scholar] [CrossRef] [PubMed]
- Kohút, M.; Kovach, V.P.; Kotov, A.B.; Salnikova, E.B.; Savatenkov, V.M. Sr and Nd isotope geochemistry of Hercynian granitic rocks from the Western Carpathians—Implications for granite genesis and crustal evolution. Geol. Carpath. 1999, 50, 477–487. [Google Scholar]
- Rapant, S.; Cvečková, V.; Fajčíková, K.; Kohút, M.; Sedláková, D. Historical mining areas and their influence on human health. Eur. J. Biomed. Inf. 2014, 10, 24–34. [Google Scholar]
- Bencko, V.; Novák, J.; Suk, M. Health and Natural Conditions. (Medicine and Geology); DOLIN, s.r.o.: Prague, Czech Republic, 2011; p. 389. (In Czech) [Google Scholar]
- Sakamoto, N.; Shimizu, M.; Wakabayashi, I.; Satamoko, K. Relationship between mortality rate of stomach cancer and cerebrovascular disease and concentrations of magnesium and calcium in well water in Hyogo prefecture. Magnes. Res. 1997, 10, 215–223. [Google Scholar] [PubMed]
- Nriagu, J.; Darroudi, F.; Shomar, B. Health effects of desalinated water: Role of electrolyte disturbance in cancer development. Environ. Res. 2016, 150, 191–204. [Google Scholar] [CrossRef] [PubMed]
- Rodriguez, C.; McCullough, M.L.; Modul, A.M.; Jacobs, E.J.; Fakhrabadi-Shokoohi, D.; Giovannucci, E.L.; Thun, M.J.; Calle, E.E. Calcium, dairy products, and risk of prostate cancer in a prospective cohort of United States men. Cancer Epidemiol. Biomark. Prev. 2003, 12, 597–603. [Google Scholar]
- Larsson, S.C.; Bergkvist, L.; Rutergard, J.; Giovannucci, E.; Wolk, A. Calcium and dairy food intakes are inversely associated with colorectal cancer risk in the Cohort of Swedish Men. Am. J. Clin. Nutr. 2006, 83, 667–673. [Google Scholar] [PubMed]
- Ahn, J.; Albanes, D.; Peters, U.; Schatzkin, A.; Lim, U.; Freedman, M.; Chatterjeen, N.; Andriole, G.L.; Leitzmann, M.F.; Hayes, R.B.; et al. Dairy products, calcium intake, and risk of prostate cancer in the prostate, lung, colorectal and ovarian cancer screening trial. Cancer Epidemiol. Biomark. Prev. 2007, 16, 2623–2630. [Google Scholar] [CrossRef] [PubMed]
- Lin, J.; Manson, J.E.; Lee, I.M.; Cook, N.R.; Buring, J.E.; Zhang, S.M. Intakes of calcium and vitamin D and breast cancer risk in women. Arch. Int. Med. 2007, 167, 1050–1059. [Google Scholar] [CrossRef] [PubMed]
- Butler, L.M.; Wong, A.S.; Koh, W.P.; Wang, R.; Yuan, J.M.; Yu, M.C. Calcium intake increases risk of prostate cancer among Singapore Chinese. Cancer Res. 2010, 70, 4941–4948. [Google Scholar] [CrossRef] [PubMed]
- Kožíšek, F. Health Significance of Drinking Water Calcium and Magnesium; National Institute of Public Health: Prague, Czech Republic, 2003; p. 29. [Google Scholar]
- National Health Information Center (NHIC). Zdravotníctvo Slovenskej Republiky v Číslach 2014 (Public Health in the Slovak Republic in Numbers); National Health Information Center: Bratislava, Slovak Republic, 2015; p. 14. [Google Scholar]
- Singh, P.P.; Kiran, R. Are we overstressing water quality in urinary stone disease? Int. Urol. Nephrol. 1993, 25, 29–36. [Google Scholar] [CrossRef] [PubMed]
- Kohri, K.; Ishikawa, Y.; Iguchi, M.; Kurita, T.; Okada, Y.; Yoshida, O. Relationship between the incidence infection stones and the magnesium-calcium ratio of tap water. Urol. Res. 1993, 21, 269–272. [Google Scholar] [CrossRef] [PubMed]
- Catling, L.; Abubakar, I.; Lake, I.; Swift, L.; Hunter, P. Review of Evidence for of Relationship between Incidence Cardiovascular Disease and Water Hardness; University of East Anglia and Drinking Water Inspectorate: Norwich, UK, 2005; p. 142. [Google Scholar]
- Anon. Air Pollution in the Slovak Republic 2013; Slovak Hydrometeorological Institute, Ministry of Environment of the Slovak Republic, Manuscript: Bratislava, Slovak Republic, 2015. [Google Scholar]
- Rapant, S.; Vrana, K.; Čurlík, J. Environmentálne Riziko z Kontaminácie Geologických Zložiek Životného Prostredia Slovenskej Republiky/Environmental Risk from the Contamination of Geological Components of the Environment of the Slovak Republic, 1st ed.; SGIDŠ: Bratislava, Slovak Republic, 2004; p. 80. [Google Scholar]
- Rapant, S.; Salminen, R.; Tarvainen, T.; Krčmová, K.; Cvečková, V. Application of a risk assessment method on European wide geochemical baseline data. Geochem. Explor. Environ. Anal. 2008, 8, 291–299. [Google Scholar] [CrossRef]
- NHIC. Health Statistics Year Book of the Slovak Republic 2012; National Health Information Center: Bratislava, Slovak Republic, 2013; p. 241. (In Slovak) [Google Scholar]
- Kosmovský, V.; Michalcová, J.; Belláková, D. Hodnotenie životného štýlu obyvateľov okresu Krupina (Evaluation of lifestyle of residents in the Krupina district). In Životné Podmienky a Zdravie (Environmental Conditions and Health); Book of Conference Proceedings; Štefániková, Z., Jurkovičová, J., Eds.; Public Health Office of the Slovak Republic: Bratislava, Slovak Republic, 2015; p. 424. (In Slovak) [Google Scholar]
- European Health Examination Survey (EHES). European Health Examination Survey. Available online: www.ehes.info (accessed on 2 December 2016).


| Groundwater (n = 20,339) | ||||||||||||
|---|---|---|---|---|---|---|---|---|---|---|---|---|
| pH | TDS | CODMn | Ca + Mg | Li | Na | K | Ca | Mg | Sr | Fe | Mn | NH4 |
| 7.33 | 629.75 | 2.18 | 3.5 | 0.019 | 20.34 | 11.10 | 93.56 | 28.29 | 0.36 | 0.17 | 0.12 | 0.10 |
| F | Cl | SO4 | NO2 | NO3 | PO4 | HCO3 | SiO2 | Cr | Cu | Zn | As | Cd |
| 0.13 | 32.96 | 79.32 | 0.11 | 38.76 | 0.20 | 303.85 | 18.21 | 0.0013 | 0.0026 | 0.2673 | 0.0019 | 0.0010 |
| Se | Pb | Hg | Ba | Al | Sb | 222Rn | 226Ra | |||||
| 0.0010 | 0.0014 | 0.0001 | 0.0747 | 0.0297 | 0.0009 | 14.46 | 0.053 | |||||
| Health Indicator | Description of Indicator | Method of Calculation | Units | Mean SR * |
|---|---|---|---|---|
| Demographic indicators describing age structure of municipalities | ||||
| LE | life expectancy at birth—population | cumulative calculation of all years of life during lifetime/No. of living persons at the beginning of the year | years | 72.60 |
| Premature mortality | ||||
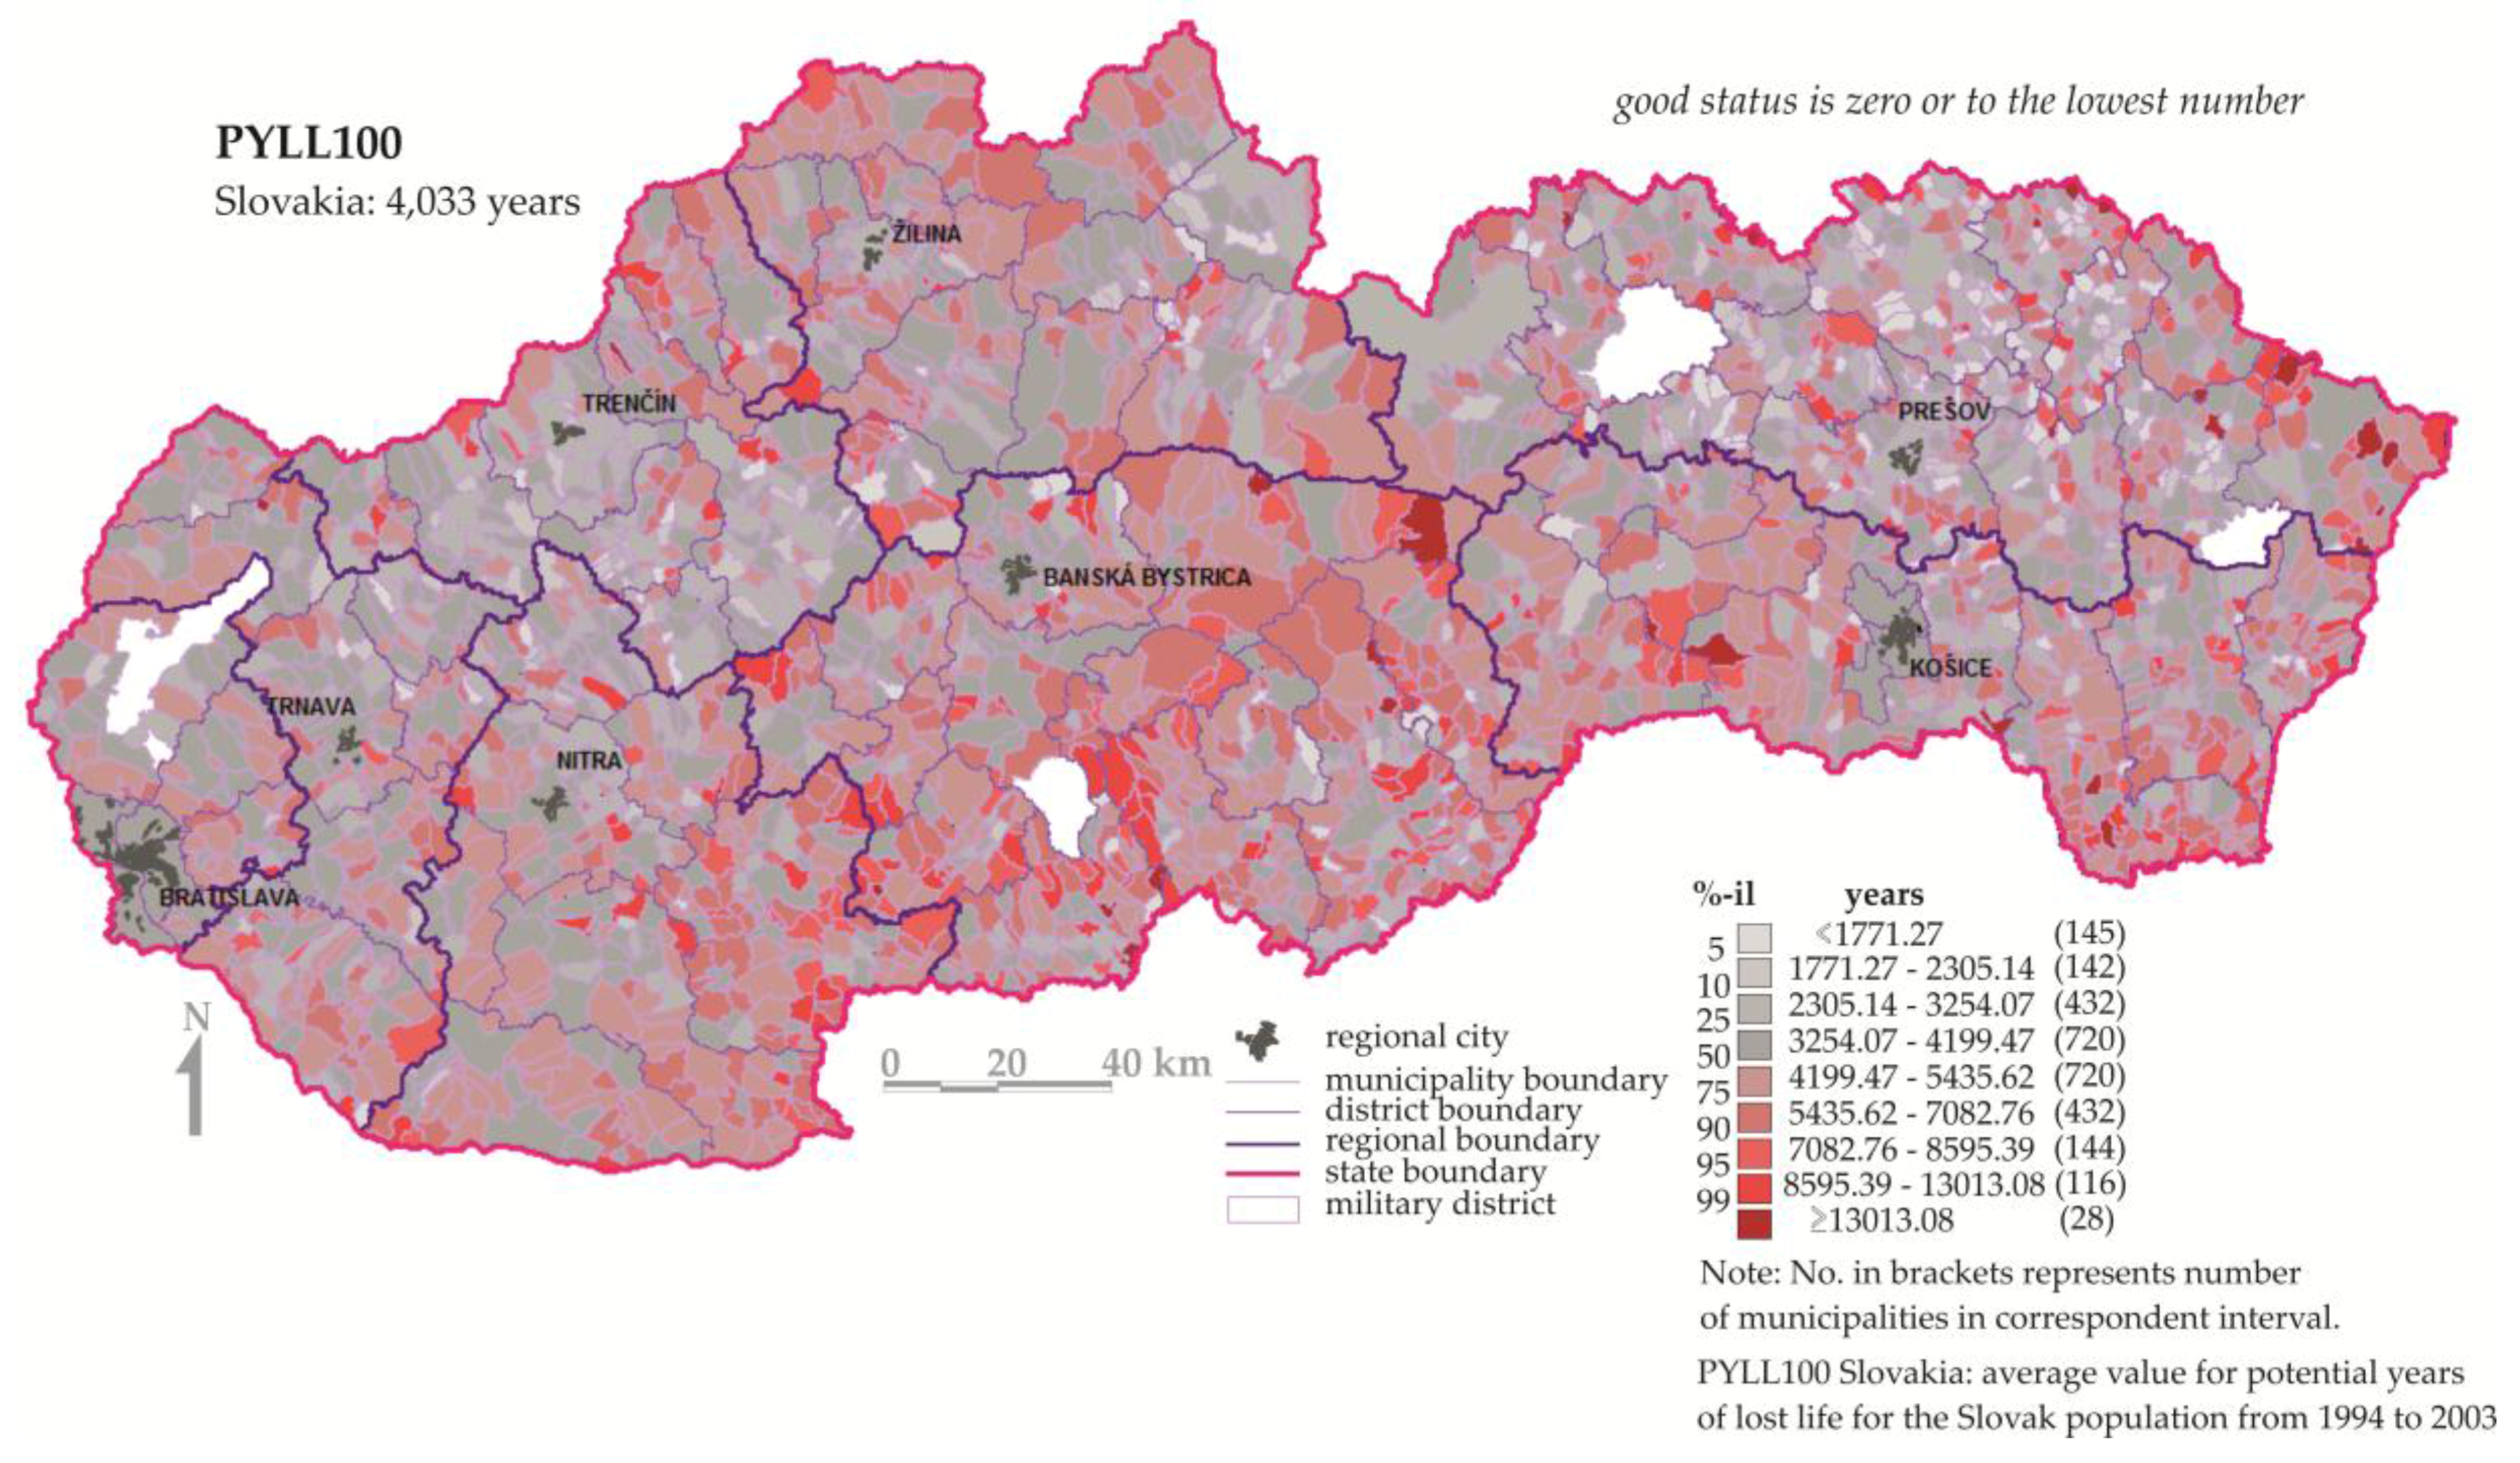
| PYLL100 | potential years of lost life | 100,000 × (the sum of the years of people up to the age of nearly 65 years (deaths at age between 1 and 64 years)/number of inhabitants) | years | 4033.00 |
| Relative mortality for selected cause of death | ||||
| ReC00-C97 | malignant neoplasms | 100,000 × (No. of deaths for selected cause/number of inhabitants) | No. of deaths per 100,000 inhabitants | 212.79 |
| ReI00-I99 | diseases of the circulatory system | 531.05 | ||
| ReJ00-J99 | diseases of respiratory system | 58.08 | ||
| ReK00-K93 | diseases of the digestive system | 45.83 | ||
| Standardized mortality for selected cause of death | ||||
| SMRC00-C97 | malignant neoplasms | indirect age-standardized mortality rate of inhabitants to the Slovak standard (19 age groups) | % | 100 |
| SMRI00-I99 | diseases of the circulatory system | 100 | ||
| SMRJ00-J99 | diseases of respiratory system | 100 | ||
| SMRK00-K93 | diseases of the digestive system | 100 | ||
| Potential years of lost life for selected cause of death | ||||
| PYLLC00-C97 | malignant neoplasms | 100,000 × (the sum of the years of people up to the age of nearly 65 years (deaths at age between 1 and 64 years)/number of inhabitants) | years | 1005.20 |
| PYLLI00-I99 | diseases of the circulatory system | 866.19 | ||
| PYLLJ00-J99 | diseases of respiratory system | 172.69 | ||
| PYLLK00-K93 | diseases of the digestive system | 334.80 | ||
| Parameter | Linear Correlation | Spearman Correlation | ||||
|---|---|---|---|---|---|---|
| r | p | Significance | R | p | Significance | |
| Ca + Mg and LE | 0.140 | 0.000 | +++ | 0.181 | 0.000 | +++ |
| NO3 and LE | −0.021 | 0.392 | − | 0.069 | 0.005 | ++ |
| As and LE | 0.020 | 0.411 | − | −0.078 | 0.001 | ++ |
| Ca + Mg and PYLL100 | −0.130 | 0.000 | +++ | −0.187 | 0.000 | +++ |
| NO3 and PYLL100 | −0.001 | 0.960 | − | −0.077 | 0.002 | ++ |
| As and PYLL100 | −0.017 | 0.484 | − | 0.083 | 0.001 | +++ |
| Ca + Mg and ReC00-C97 | −0.085 | 0.000 | +++ | −0.134 | 0.000 | +++ |
| NO3 and ReC00-C97 | −0.050 | 0.043 | + | −0.112 | 0.000 | +++ |
| As and ReC00-C97 | −0.001 | 0.960 | − | 0.080 | 0.001 | ++ |
| Ca + Mg and SMRC00-C97 | −0.033 | 0.175 | − | −0.038 | 0.119 | − |
| NO3 and SMRC00-C97 | 0.012 | 0.618 | − | −0.004 | 0.861 | − |
| As and SMRC00-C97 | 0.006 | 0.798 | − | 0.086 | 0.000 | +++ |
| Ca + Mg and PYLLC00-C97 | −0.079 | 0.001 | ++ | −0.095 | 0.000 | +++ |
| NO3 and PYLLC00-C97 | −0.028 | 0.258 | − | −0.042 | 0.086 | − |
| As and PYLLC00-C97 | −0.001 | 0.971 | − | 0.106 | 0.000 | +++ |
| Ca + Mg and ReI00-I99 | −0.083 | 0.001 | +++ | −0.151 | 0.000 | +++ |
| NO3 and ReI00-I99 | −0.031 | 0.198 | − | −0.092 | 0.000 | +++ |
| As and ReI00-I99 | −0.013 | 0.586 | − | 0.030 | 0.224 | − |
| Ca + Mg and SMRI00-I99 | −0.023 | 0.351 | − | −0.046 | 0.061 | − |
| NO3 and SMRI00-I99 | 0.077 | 0.002 | ++ | 0.052 | 0.034 | + |
| As and SMRI00-I99 | −0.014 | 0.578 | − | 0.039 | 0.112 | − |
| Ca + Mg and PYLLI00-I99 | −0.084 | 0.001 | +++ | −0.121 | 0.000 | +++ |
| NO3 and PYLLI00-I99 | 0.042 | 0.083 | − | 0.002 | 0.929 | − |
| As and PYLLI00-I99 | −0.020 | 0.421 | − | 0.091 | 0.000 | +++ |
| Ca + Mg and ReJ00-J99 | −0.108 | 0.000 | +++ | −0.138 | 0.000 | +++ |
| NO3 and ReJ00-J99 | −0.057 | 0.020 | + | −0.111 | 0.000 | +++ |
| As and ReJ00-J99 | −0.003 | 0.912 | − | 0.090 | 0.000 | +++ |
| Ca + Mg and SMRJ00-J99 | −0.066 | 0.007 | ++ | −0.084 | 0.001 | +++ |
| NO3 and SMRJ00-J99 | −0.010 | 0.693 | − | −0.056 | 0.023 | + |
| As and SMRJ00-J99 | 0.004 | 0.871 | − | 0.081 | 0.001 | +++ |
| Ca + Mg and PYLLJ00-J99 | −0.025 | 0.302 | − | −0.079 | 0.001 | ++ |
| NO3 and PYLLJ00-J99 | 0.009 | 0.715 | − | 0.004 | 0.856 | − |
| As and PYLLJ00-J99 | −0.006 | 0.806 | − | 0.058 | 0.018 | + |
| Ca + Mg and ReK00-K93 | −0.049 | 0.047 | + | −0.119 | 0.000 | +++ |
| NO3 and ReK00-K93 | 0.075 | 0.002 | ++ | −0.038 | 0.116 | − |
| As and ReK00-K93 | 0.001 | 0.959 | − | 0.171 | 0.000 | +++ |
| Ca + Mg and SMRK00-K93 | −0.039 | 0.112 | − | −0.088 | 0.000 | +++ |
| NO3 and SMRK00-K93 | 0.105 | 0.000 | +++ | 0.007 | 0.780 | − |
| As and SMRK00-K93 | 0.018 | 0.456 | − | 0.168 | 0.000 | +++ |
| Ca + Mg and PYLLK00-K93 | −0.041 | 0.092 | − | −0.079 | 0.001 | ++ |
| NO3 and PYLLK00-K93 | 0.079 | 0.001 | ++ | 0.006 | 0.800 | − |
| As and PYLLK00-K93 | 0.028 | 0.248 | − | 0.156 | 0.000 | +++ |
| Parameter | 1 | 2 | 3 | 4 | 5 | 6 | 7 | 8 | 9 | 10 | 11 | 12 | 13 | 14 | xP | ||||||||||||||
|---|---|---|---|---|---|---|---|---|---|---|---|---|---|---|---|---|---|---|---|---|---|---|---|---|---|---|---|---|---|
| sr | P | sr | P | sr | P | sr | P | sr | P | sr | P | sr | P | sr | P | sr | P | sr | P | sr | P | sr | P | sr | P | sr | P | ||
| Ca + Mg | 1.419 | 1 | 1.115 | 1 | 1.027 | 3 | 1.370 | 1 | 1.590 | 1 | 1.057 | 1 | 1.003 | 3 | 1.677 | 1 | 1.001 | 6 | 1.180 | 1 | 1.044 | 1 | 1.046 | 1 | 1.003 | 4 | 1.169 | 1 | 1.92 |
| Mg | 1.153 | 3 | 1.027 | 3 | 1.005 | 8 | 1.150 | 3 | 1.255 | 3 | 1.009 | 7 | 1.004 | 1 | 1.291 | 3 | 1.002 | 4 | 1.065 | 3 | 1.004 | 4 | 1.002 | 6 | 1.004 | 3 | 1.063 | 3 | 3.92 |
| Ca | 1.246 | 2 | 1.048 | 2 | 1.013 | 4 | 1.211 | 2 | 1.346 | 2 | 1.015 | 5 | 1.003 | 2 | 1.387 | 2 | 1.003 | 3 | 1.108 | 2 | 1.008 | 3 | 1.006 | 3 | 1.004 | 2 | 1.100 | 2 | 2.62 |
| TDS | 1.086 | 4 | 1.003 | 5 | 1.074 | 1 | 1.053 | 4 | 1.008 | 4 | 1.015 | 6 | 1.001 | 8 | 1.018 | 4 | 1.016 | 1 | 1.051 | 4 | 1.016 | 2 | 1.002 | 7 | 1.010 | 1 | 1.028 | 4 | 3.92 |
| HCO3 | 1.012 | 8 | 1.013 | 4 | 1.034 | 2 | 1.026 | 5 | 1.005 | 5 | 1.023 | 4 | 1.002 | 4 | 1.006 | 5 | 1.005 | 2 | 1.028 | 5 | 1.002 | 5 | 1.010 | 2 | 1.003 | 6 | 1.012 | 5 | 4.38 |
| SO4 | 1.004 | 9 | 1.002 | 7 | 1.0094 | 5 | 1.009 | 7 | 1.001 | 8 | 1.006 | 8 | 1.001 | 10 | 1.001 | 10 | 1.001 | 5 | 1.006 | 8 | 1.001 | 10 | 1.003 | 5 | 1.001 | 7 | 1.003 | 9 | 7.77 |
| Cl | 1.003 | 11 | 1.002 | 9 | 1.007 | 6 | 1.027 | 6 | 1.001 | 9 | 1.029 | 2 | 1.001 | 5 | 1.001 | 11 | 1.000 | 13 | 1.021 | 6 | 1.002 | 6 | 1.002 | 8 | 1.001 | 8 | 1.003 | 8 | 7.85 |
| NO3 | 1.003 | 10 | 1.001 | 11 | 1.006 | 7 | 1.004 | 8 | 1.001 | 10 | 1.003 | 9 | 1.001 | 11 | 1.002 | 6 | 1.001 | 8 | 1.004 | 9 | 1.001 | 8 | 1.001 | 11 | 1.001 | 11 | 1.001 | 10 | 9.31 |
| SiO2 | 1.002 | 13 | 1.002 | 8 | 1.001 | 12 | 1.003 | 10 | 1.000 | 17 | 1.027 | 3 | 1.001 | 6 | 1.001 | 14 | 1.000 | 11 | 1.014 | 7 | 1.000 | 13 | 1.001 | 9 | 1.000 | 21 | 1.008 | 6 | 10.77 |
| Na | 1.0434 | 7 | 1.001 | 12 | 1.003 | 9 | 1.002 | 9 | 1.000 | 16 | 1.002 | 12 | 1.001 | 12 | 1.001 | 13 | 1.000 | 14 | 1.001 | 13 | 1.001 | 7 | 1.003 | 4 | 1.001 | 9 | 1.000 | 19 | 11.31 |
| K | 1.0732 | 6 | 1.000 | 15 | 1.000 | 17 | 1.001 | 12 | 1.000 | 20 | 1.000 | 17 | 1.001 | 20 | 1.001 | 15 | 1.000 | 16 | 1.000 | 17 | 1.000 | 14 | 1.001 | 10 | 1.000 | 13 | 1.000 | 28 | 16.00 |
| Order | Parameter | sr | R2 | Limit Content | Optimal Content | Evaluated Function of Dependence | Contents * | |||
|---|---|---|---|---|---|---|---|---|---|---|
| LL | UL | LL | UL | Min | Max | |||||
| 1 | Ca + Mg | 1.419 | 0.997 | 2.98 | does not exist | not defined | does not exist | concave parabola | 0.35 | 7.97 |
| 2 | Ca | 1.246 | 0.975 | 73.95 | 172.21 | not defined | not defined | concave parabola | 9.83 | 201.01 |
| 3 | Mg | 1.152 | 0.975 | 18.13 | does not exist | not defined | does not exist | concave parabola | 2.45 | 97.75 |
| 4 | TDS | 1.086 | 0.899 | 358.46 | does not exist | does not exist | does not exist | concave parabola | 87.30 | 1412.30 |
| 5 | CODMn | 1.081 | 0.994 | does not exist | 2.27 | does not exist | does not exist | concave parabola | 0.75 | 7.48 |
| 6 | K | 1.073 | 0.964 | does not exist | 9.85 | does not exist | does not exist | concave parabola | 0.27 | 153.15 |
| 7 | Na | 1.043 | 0.977 | does not exist | 24.07 | does not exist | does not exist | concave parabola | 0.71 | 119.69 |
| 8 | HCO3 | 1.012 | 0.993 | 250.79 | does not exist | does not exist | does not exist | concave parabola | 16.57 | 592.05 |
| 9 | SO4 | 1.003 | 0.522 | 31.42 | 185.32 | does not exist | does not exist | concave parabola | 9.38 | 319.50 |
| 10 | NO3 | 1.003 | 0.832 | does not exist | 71.45 | does not exist | does not exist | concave parabola | 1.33 | 227.09 |
| Geological Unit/District | 1 | 8 | Krupina | Bardejov | SR |
|---|---|---|---|---|---|
| Health Indicator | n = 727 | n = 309 | n = 36 | n = 86 | |
| LE | 73.69 | 71.11 | 69.95 | 74.07 | 72.60 |
| PYLL100 | 3874.38 | 4586.18 | 5609.07 | 3140.73 | 4033.00 |
| ReC00-C97 | 177.99 | 236.28 | 243.23 | 175.32 | 212.79 |
| ReI00-I99 | 463.32 | 638.78 | 889.20 | 492.82 | 531.05 |
| ReJ00-J99 | 54.42 | 81.98 | 81.11 | 26.62 | 58.08 |
| ReK00-K93 | 34.22 | 66.88 | 75.68 | 25.39 | 45.83 |
| SMRC00-97 | 95.03 | 102.91 | 99.73 | 91.20 | 100 |
| SMRI00-I99 | 100.03 | 108.50 | 131.06 | 100.71 | 100 |
| SMRJ00-J99 | 109.39 | 126.34 | 116.33 | 50.50 | 100 |
| SMRK00-K93 | 84.31 | 130.61 | 150.20 | 62.63 | 100 |
| PYLLC00-C97 | 909.88 | 1097.32 | 1121.6 | 808.8 | 1005.20 |
| PYLLI00-I99 | 831.99 | 1050.95 | 1518.2 | 779.9 | 866.19 |
| PYLLJ00-J99 | 229.74 | 202.67 | 259.2 | 231.1 | 172.69 |
| PYLLK00-K93 | 287.97 | 491.26 | 693.29 | 211.84 | 334.8 |
| Geological Unit/District | 1 | 8 | Krupina | Bardejov | SR |
|---|---|---|---|---|---|
| Parameter | n = 727 | n = 309 | n = 36 | n = 86 | |
| TDS (mg·L−1) | 524.64 | 439.73 | 362.34 | 484.79 | 629.75 |
| Ca + Mg (mmol·L−1) | 3.02 | 2.11 | 1.58 | 2.75 | 3.50 |
| Na (mg·L−1) | 12.74 | 16.09 | 13.12 | 10.34 | 20.34 |
| Ca (mg·L−1) | 88.53 | 56.13 | 42.01 | 80.75 | 93.56 |
| Mg (mg·L−1) | 19.67 | 17.14 | 12.96 | 17.98 | 28.29 |
| Cl (mg·L−1) | 17.14 | 21.66 | 13.81 | 13.77 | 32.96 |
| SO4 (mg·L−1) | 62.72 | 49.70 | 22.42 | 44.96 | 79.32 |
| NO3 (mg·L−1) | 16.19 | 26.44 | 16.49 | 14.84 | 38.76 |
| HCO3 (mg·L−1) | 287.65 | 191.51 | 174.23 | 282.12 | 303.85 |
| As (mg·L−1) | 0.00079 | 0.00241 | 0.0018 | 0.00114 | 0.00192 |
| Se (mg·L−1) | 0.00068 | 0.00086 | 0.0006 | 0.00068 | 0.00097 |
| Pb (mg·L−1) | 0.00125 | 0.00134 | 0.0018 | 0.00094 | 0.00136 |
| Health Indicator | Order | Element | Limit Content | Optimal Content | Contents * | |||
|---|---|---|---|---|---|---|---|---|
| LL | UL | LL | UL | Min | Max | |||
| LE | 1 | Ca + Mg | 2.98 | does not exist | not defined | does not exist | 0.35 | 7.97 |
| 2 | Ca | 73.95 | 172.21 | not defined | not defined | 9.83 | 201.01 | |
| 3 | Mg | 18.13 | does not exist | not defined | does not exist | 2.45 | 97.75 | |
| PYLL100 | 1 | Ca + Mg | 2.87 | 6.67 | 3.21 | 6.33 | 0.35 | 7.97 |
| 2 | Ca | 79.40 | 169.74 | 87.05 | 162.09 | 9.83 | 201.01 | |
| 3 | Mg | 20.44 | 83.24 | 33.82 | 69.87 | 2.45 | 97.75 | |
| ReC00-C97 | 3 | Ca + Mg | 1.73 | 5.85 | 2.23 | 5.34 | 0.35 | 7.97 |
| 4 | Ca | 60.56 | 196.84 | 91.18 | 166.21 | 9.83 | 201.01 | |
| 8 | Mg | 25.66 | 35.83 | 12.72 | 48.77 | 2.45 | 97.75 | |
| SMRC00-C97 | 2 | Ca + Mg | does not exist | 4.17 | does not exist | does not exist | 0.35 | 7.97 |
| 3 | Ca | 104.07 | does not exist | does not exist | does not exist | 9.83 | 201.01 | |
| 1 | Mg | does not exist | 33.50 | does not exist | does not exist | 2.45 | 97.75 | |
| PYLLC00-C97 | 1 | Ca + Mg | not defined | not defined | not defined | not defined | 0.35 | 7.97 |
| 3 | Ca | 93.17 | 194.91 | 106.52 | 181.56 | 9.83 | 201.01 | |
| 4 | Mg | not defined | not defined | not defined | not defined | 2.45 | 97.75 | |
| ReI00-I99 | 1 | Ca + Mg | 2.90 | 9.10 | 4.40 | 7.60 | 0.35 | 7.97 |
| 2 | Ca | does not exist | 89.40 | does not exist | does not exist | 9.83 | 201.01 | |
| 3 | Mg | 24.30 | 95.80 | 42.00 | 78.10 | 2.45 | 97.75 | |
| SMRI00-I99 | 1 | Ca + Mg | not defined | not defined | not defined | not defined | 0.35 | 7.97 |
| 2 | Ca | not defined | not defined | not defined | not defined | 9.83 | 201.01 | |
| 3 | Mg | does not exist | 65.85 | does not exist | does not exist | 2.45 | 97.75 | |
| PYLLI00-I99 | 1 | Ca + Mg | 5.70 | 8.88 | 5.73 | 8.85 | 0.35 | 7.97 |
| 3 | Ca | 150.76 | does not exist | 164.04 | does not exist | 9.83 | 201.01 | |
| 3 | Mg | 56.20 | 82.78 | 56.20 | 82.78 | 2.45 | 97.75 | |
| ReJ00-J99 | 1 | Ca + Mg | 3.20 | 11.67 | 5.88 | 8.99 | 0.35 | 7.97 |
| 2 | Ca | 93.08 | does not exist | does not exist | does not exist | 9.83 | 201.01 | |
| 3 | Mg | 28.63 | does not exist | 83.99 | 120.05 | 2.45 | 97.75 | |
| SMRJ00-J99 | 6 | Ca + Mg | 3.27 | does not exist | does not exist | does not exist | 0.35 | 7.97 |
| 3 | Ca | 90.03 | does not exist | does not exist | does not exist | 9.83 | 201.01 | |
| 4 | Mg | 25.81 | does not exist | does not exist | does not exist | 2.45 | 97.75 | |
| PYLLJ00-J99 | 4 | Ca + Mg | does not exist | 4.06 | does not exist | does not exist | 0.35 | 7.97 |
| 2 | Ca | does not exist | 121.18 | does not exist | does not exist | 9.83 | 201.01 | |
| 3 | Mg | does not exist | 47.63 | does not exist | does not exist | 2.45 | 97.75 | |
| ReK00-K93 | 1 | Ca + Mg | does not exist | 4.08 | 0.41 | 3.53 | 0.35 | 7.97 |
| 4 | Ca | 17.74 | 127.58 | 35.14 | 110.18 | 9.83 | 201.01 | |
| 7 | Mg | does not exist | 33.54 | does not exist | 10.65 | 2.45 | 97.75 | |
| SMRK00-K93 | 1 | Ca + Mg | 0.99 | 2.16 | 0.99 | 2.16 | 0.35 | 7.97 |
| 2 | Ca | not defined | not defined | not defined | not defined | 9.83 | 201.01 | |
| 3 | Mg | does not exist | 29.67 | does not exist | does not exist | 2.45 | 97.75 | |
| PYLLK00-K93 | 1 | Ca + Mg | does not exist | 4.84 | 0.73 | 3.84 | 0.35 | 7.97 |
| 2 | Ca | 17.58 | 173.05 | 57.80 | 132.83 | 9.83 | 201.01 | |
| 3 | Mg | does not exist | 37.27 | does not exist | does not exist | 2.45 | 97.75 | |
| Mean values | Ca + Mg | 2.95 | 6.15 | 2.95 | 5.83 | 0.35 | 7.97 | |
| Ca | 78.03 | 155.61 | 89.61 | 152.29 | 9.83 | 201.01 | ||
| Mg | 28.45 | 54.51 | 48.33 | 79.91 | 2.45 | 97.75 | ||
| Limit values defined by Slovak guideline for drinking water [15] | Ca > 30 mg·L−1 | Mg 10–30 mg·L−1 | Ca + Mg 1.1–5.0 mmol·L−1 | |||||
| Parameter | Recommended Levels |
|---|---|
| Ca + Mg | 2–5 mmol·L−1 |
| Ca | 50–180 mg·L−1 |
| Mg | 25–50 mg·L−1 |
| Socio-Economic Characteristics a | Krupina | Bardejov | SR |
|---|---|---|---|
| Level of registered unemployment (% of population) | 16.95 | 19.6 | 12.29 |
| Average nominal monthly salary in Euro | 694 | 614 | 957 |
| Rate of gypsy nationality (% of population) | 2.1–4 | 4.1–8 | 2 |
| Health-care characteristics b | |||
| No. of physicians posts per 10,000 population—adults (age 18+ years) | 4.36 | 3.40 | 4.32 |
| No. of physicians posts per 10,000 population—children and adolescents (age 0–17 years) | 6.86 | 7.44 | 9.87 |
| No. of vaccinated children and adolescents (age 0–17 years) | 98.23 | 98.1 | 97.9 |
| Lifestyle characteristics c,d | |||
| Regular physical activity in average (% of population) | 45 | 39.5 | 58.5 |
| Regular eating habits (% of population) | 75 | 49 | 68 |
| Smoking (% of population) | 25 | 43 | 19.5 |
| Excessive alcohol intake (% of population) | 9.8 | 11 | 6.8 |
© 2017 by the authors. Licensee MDPI, Basel, Switzerland. This article is an open access article distributed under the terms and conditions of the Creative Commons Attribution (CC BY) license ( http://creativecommons.org/licenses/by/4.0/).
Share and Cite
Rapant, S.; Cvečková, V.; Fajčíková, K.; Sedláková, D.; Stehlíková, B. Impact of Calcium and Magnesium in Groundwater and Drinking Water on the Health of Inhabitants of the Slovak Republic. Int. J. Environ. Res. Public Health 2017, 14, 278. https://doi.org/10.3390/ijerph14030278
Rapant S, Cvečková V, Fajčíková K, Sedláková D, Stehlíková B. Impact of Calcium and Magnesium in Groundwater and Drinking Water on the Health of Inhabitants of the Slovak Republic. International Journal of Environmental Research and Public Health. 2017; 14(3):278. https://doi.org/10.3390/ijerph14030278
Chicago/Turabian StyleRapant, Stanislav, Veronika Cvečková, Katarína Fajčíková, Darina Sedláková, and Beáta Stehlíková. 2017. "Impact of Calcium and Magnesium in Groundwater and Drinking Water on the Health of Inhabitants of the Slovak Republic" International Journal of Environmental Research and Public Health 14, no. 3: 278. https://doi.org/10.3390/ijerph14030278