A Mixed-Methods Examination of Physical Activity and Sedentary Time in Overweight and Obese South Asian Men Living in the United Kingdom


Abstract
:1. Introduction
2. Materials and Methods
2.1. Study Design and Participants
2.2. Demographic Data
2.3. Anthropometric Data, Blood Pressure, and Handgrip Strength
2.4. Self-Reported Physical Activity and Sedentary Time
2.5. Objectively Measured Physical Activity and Sedentary Time
2.6. Semi-Structured Interviews
2.7. Data Reduction and Analysis
2.7.1. Quantitative Data Analysis
2.7.2. Qualitative Data Analysis
3. Results
3.1. Quantitative Results
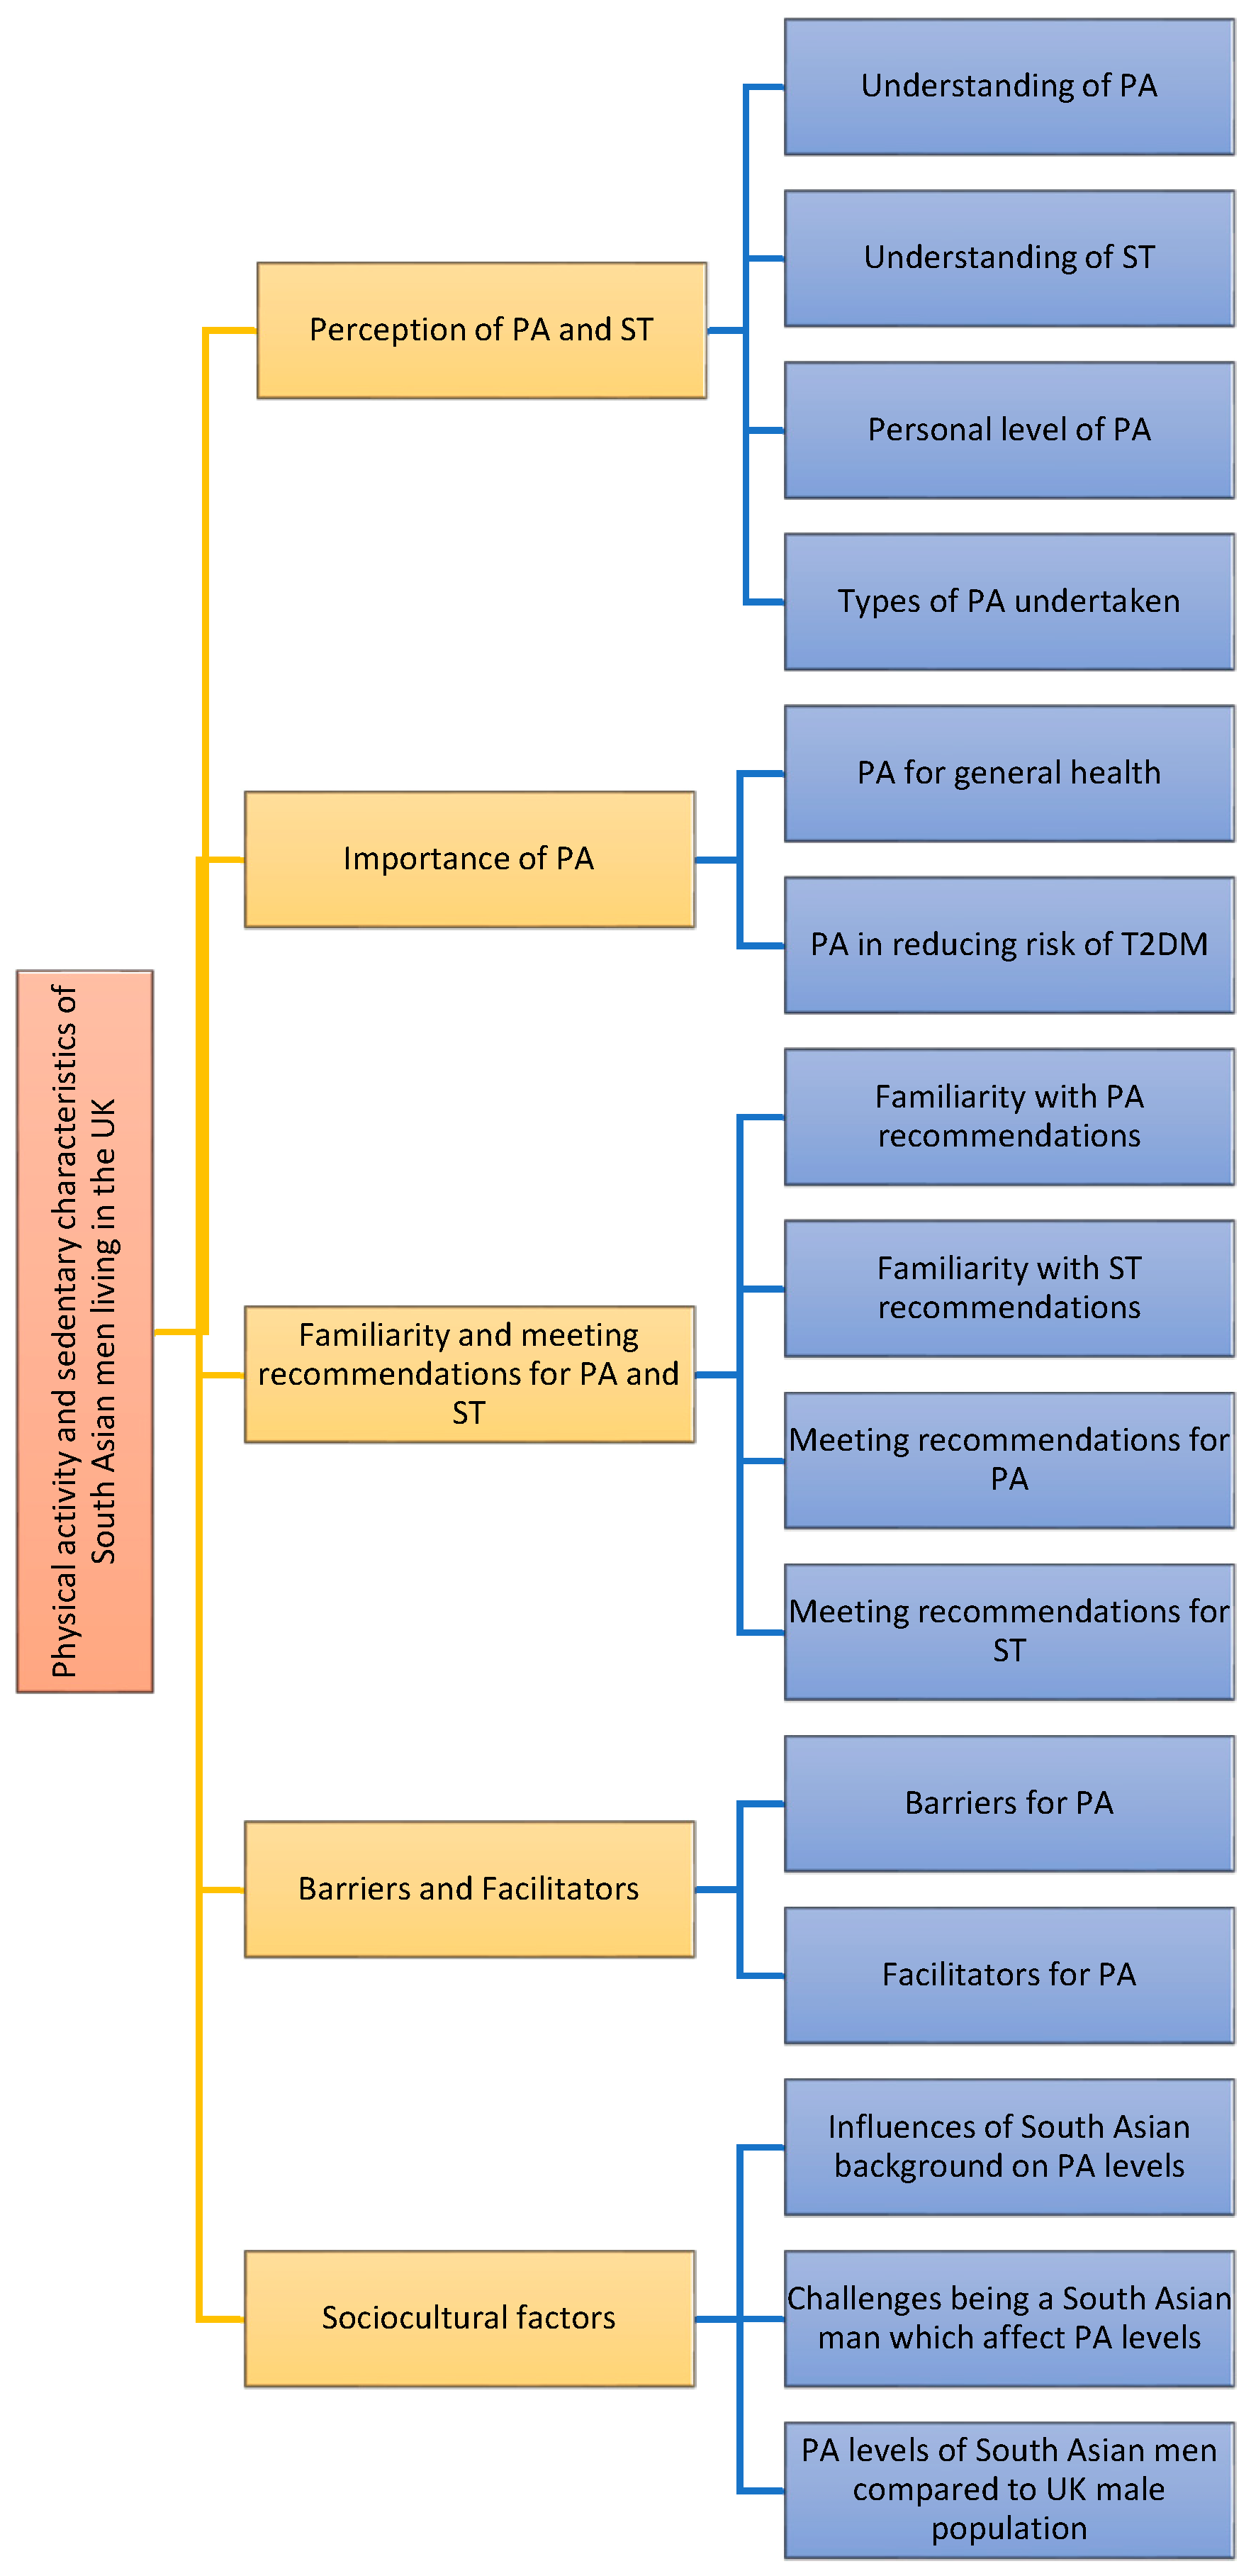
3.2. Qualitative Results
3.2.1. Understanding of Physical Activity
You just keeping moving. I would say walking, cycling, any household chores, any games or extracurricular activities. I guess even walking, standing up and sitting down is also considered physical activity.47 years, Indian, Hindu, living in the UK for 17 years
Physical activity for me, I think is more than just walking or sitting down would be to do some extra physical activity like exercise or… something out of your comfort zone.30 years, Indian, Sikh, living in the UK for 5 years
3.2.2. Understanding of Sedentary Time
It’s just like sitting on a chair reading or watching tele [television] or something like that. Sedentary…that is just stationary. Your body is stationary. Maybe [a] little hand movement may be there, otherwise that is, that also could be considered as sedentary.63 years, Indian, Hindu, living in the UK for 19 years
3.2.3. Personal Level of Physical Activity
When I’m at work then I’ll say I’m not very active that’s just the way that my lifestyle is at work, because most of the time I am behind my desk.25 years, Indian, Sikh, living in the UK for 25 years
3.2.4. Types of Physical Activity Undertaken
[I] walk, very fast, as fast as I can, right, so that, that’s what I try to do. Me and my wife both, both are very similar thinking; we try to do that.42 years, Indian, Hindu, living in the UK for 11 years
And over the weekend I do make a point to go for badminton for like an hour or an hour and a half, or sometimes two hours. So for example, this Sunday I played for two hours.37 years, Indian, Hindu, living in the UK for 5 years
3.2.5. Physical Activity for General Health
Well, because it... physical activity helps me to bring down my fat. That’s what I’m trying to do actively and then it helps in pumping the heart, which in turn helps in the blood circulation which in turn helps reducing the fat deposits and cholesterol and everything.45 years, Indian, Hindu, living in the UK for 11 years
I think (it’s) very important. Not even [just for] your physical health but your mental health leaves a lot of stress, but with regards to physical health, yes.27 years, Indian, Sikh, living in the UK for 27 years
Because as you go along with your age, you get old, you’ve got more chances to get any kind of disease. So you need to be having more physical activities, to keep fit yourself, so you can stay away from this type of disease…49 years, Indian, Sikh, living in the UK for 30 years
3.2.6. Physical Activity in Reducing Risk of Type 2 Diabetes Mellitus
Yes, definitely. Well, first of all it would help me lose my weight, and that I think should have an impact on everything on my health overall and including diabetes.47 years, Indian, Hindu, living in the UK for 17 years
Because you are basically, burning all the calories, so you’re not, accumulating any, cholesterol or fat in the body, so by doing more (physical activity), you know, burning the energy out, you need less insulin to digest, yeah, otherwise, you need more insulin in the body to get rid of the sugar to compensate.47 years, Indian, Hindu, living in the UK for 15 years
3.2.7. Familiarity with Recommendations
3.2.8. Meeting Recommendations
3.2.9. Barriers to Physical Activity
Barriers to me, yeah, it’s my work. I have to be in my office and have to be available because I work with, ah, overseas customers, so they expect me to be there, and then I just can’t, you know, make time to get out.51 years, Indian, Hindu, living in the UK for 23 years
Yeah, just now is the timings you know, dropping the kids you know, at various locations cause my daughter started school now, recently in September and my son’s going nursery so my wife’s got to drop my daughter and I have to drop my son. So that’s taking too much time and by the time I finish there’s no time to do exercise.30 years, Indian, Sikh, living in the UK for 5 years
Also because of the climate I can’t walk as often as I would like to here.41 years, Indian, Hindu, living in the UK for 10 years
3.2.10. Facilitators of Physical Activity
Also in a group level, I find that very, very helpful. Obviously when there’s other people around, that helps, and it has a kind of a knock-on positive effect as well.58 years, Indian, Hindu, living in the UK for 54 years
But I think it is very, very personal driven. As an individual, I know what good it is, and I know what I should be doing.37 years, Indian, Hindu, living in the UK for 5 years
3.2.11. Influence of South Asian Background
Because it is not embedded from the childhood that physical activity is, kind of, a must. We are being programmed and attuned to be academic, more academic, and then doing either valid business or in the career path or kind of thing, so it’s more about academic, not much emphasis about physical activity. You know, when I grew up, sports was seen as a waste of time—I can’t earn money [engaging in sports]. So it’s all about keeping yourself, you know, ahead, for survival.(47 years, Indian, Hindu, living in the UK for 15 years)
But of course, it’s more of the socio-economic structure at that time, we're talking about the ‘70s and ‘80s. So then it was completely different [In India]. But whereas now, when I see the [UK] population in comparison, I think people are equally aware, of the importance [of physical activity]…whereas I take my kid for a particular thing or for different lessons, he goes for cricket, for badminton, swimming, football, so I encourage him to go for many more activities.47 years, Indian, Hindu, living in the UK for 16 years
Mostly family responsibilities, like, here, people here [in the UK] are very independent, whereas in South Asia they’re more family oriented. Like, they live with their parents, so they live with their families, so they will have more get-togethers, gatherings, so... and they tend to, go in the cars every time so they don’t tend to walk a lot, I mean, not do any kind of physical activities.40 years, Indian, Hindu, living in the UK for 2 years
3.2.12. Physical Activity Levels of South Asian Men Compared to UK Men
They’re [Asian men] different, again, it all comes down to their, sort of professional lifestyle a lot of Asian men are you know, if in finance or business you’re sitting down a lot, but then a lot of them are in construction or property that do work very vigorously you know, physical work and, no nothing like that, it comes out all down to your routine and your job.30 years, Indian, Sikh, living in the UK for 5 years
4. Discussion
5. Conclusions
Acknowledgments
Author Contributions
Conflicts of Interest
References
- World Health Organization (WHO). Available online: http://www.who.int/mediacentre/factsheets/fs385/en/ (accessed on 25 March 2017).
- Sedentary Behaviour Research Network. Standardized use of the terms ‘sedentary’ and ‘sedentary behaviours’. Ann Behav Med. 2012, 37, 540–542. [Google Scholar]
- Colberg, S.R.; Sigal, R.J.; Fernhall, B.; Regensteiner, J.G.; Blissmer, B.J.; Rubin, R.R.; Sigal, R.I. Exercise and type 2 diabetes: The American College of Sports Medicine and the American Diabetes Association: Joint position statement. Diabetes Care 2010, 33, e147–e167. [Google Scholar] [CrossRef] [PubMed]
- World Health Organization (WHO). Review of Physical Activity Surveillance Data Sources in European Union Member States; WHO Regional Office for Europe: Copenhagen, Denmark, 2010. [Google Scholar]
- UK Department of Health. Physical Activity Guideline for Adults (19–64 years) 2011. Available online: http://www.dh.gov.uk/en/Publicationsandstatistics/Publications/PublicationsPolicyAndGuidance/DH_127931 (accessed on 15 July 2015).
- Hu, F.B.; Li, T.Y.; Colditz, G.A.; Willett, W.C.; Manson, J.E. Television watching and other sedentary behaviors in relation to risk of obesity and type 2 diabetes mellitus in women. JAMA 2003, 289, 1785–1791. [Google Scholar] [CrossRef] [PubMed]
- Edwardson, C.L.; Gorely, T.; Davies, M.J.; Gray, L.J.; Khunti, K.; Wilmot, E.G.; Yates, T.; Biddle, S.J.H. Association of sedentary behaviour with metabolic syndrome: A meta-analysis. PLoS ONE 2012, 7, e34916. [Google Scholar] [CrossRef] [PubMed]
- Diabetes UK. Diabetes in the UK 2011–12 Key Statistics on Diabetes. 2011. Available online: http://www.diabetes.org.uk/Professionals/Publications-reports-and-resources/Reports-statistics-and-case-studies/Reports/Diabetes-in-the-UK-2011 (accessed on 17 October 2016).
- Fischbacher, C.M.; Hunt, S.; Alexander, L. How physically active are South Asians in the United Kingdom? A literature review. J. Public Health 2004, 26, 250–258. [Google Scholar] [CrossRef] [PubMed]
- Williams, E.D.; Stamatakis, E.; Chandola, T.; Hamer, M. Assessment of physical activity levels in South Asians in the UK: Findings from the Health Survey for England. J. Epidemiol. Community Health 2010. [Google Scholar] [CrossRef] [PubMed]
- Shephard, R.J.; Aoyagi, Y. Measurement of human energy expenditure, with particular reference to field studies: An historical perspective. Eur. J. Appl. Physiol. 2012, 112, 2785–2815. [Google Scholar] [CrossRef] [PubMed]
- National Obesity Observatory (NOO). Physical Activity Surveillance in England: What Is Measured and Where Are the Gaps? 2009. Available online: http://www.noo.org.uk/uploads/doc5102NOO (accessed on 1 October 2015).
- Spittaels, H.; Van Cauwenberghe, E.; Verbestel, V.; De Meester, F.; Van Dyck, D.; Verloigne, M.; Haerens, L.; Deforche, B.; Cardon, G.; De Bourdeaudhuij, I. Objectively measured sedentary time and physical activity time across the lifespan: A cross-sectional study in four age groups. Int. J. Behav. Nutr. Phys. Act. 2012, 9, 1–12. [Google Scholar] [CrossRef] [PubMed]
- Babakus, W.S.; Thompson, J.L. Physical activity among South Asian women: A systematic, mixed-methods review. Int. J. Behav. Nutr. Phys. Act. 2012, 9, 150. [Google Scholar] [CrossRef] [PubMed]
- WHO Expert Consultation. Appropriate body-mass index for Asian populations and its implications for policy and intervention strategies. Lancet 2004, 363, 157–163. [Google Scholar]
- UK Government. Available online: https://www.gov.uk/government/statistics/english-indices-ofdeprivation-2015 (accessed on 17 October 2016).
- Craig, C.L.; Marshall, A.L.; Sjostrom, M.; Bauman, A.E.; Booth, M.L.; Ainsworth, B.E.; Pratt, M.; Ekelund, U.; Yngve, A.; Sall, J.F.; et al. International physical activity questionnaire: 12-country reliability and validity. Med. Sci. Sports Exerc. 2003, 35, 1381–1395. [Google Scholar] [CrossRef] [PubMed]
- Dinesh, J.; Tyo, B.; Bassett, D.R. Comparison of four ActiGraph accelerometers during walking and running. Med. Sci. Sports Exerc. 2010, 42, 368–374. [Google Scholar]
- Santos-Lozano, A.; Santin-Medeiros, F.; Cardon, G.; Torres-Luque, G.; Bailon, R.; Bergmeir, C.; Ruiz, J.R.; Lucia, A.; Garatachea, N. Actigraph GT3X: Validation and determination of physical activity intensity cut points. Int. J. Sports Med. 2013, 34, 975–982. [Google Scholar] [CrossRef] [PubMed]
- Troiano, R.P.; Berrigan, D.; Dodd, K.W.; Masse, L.C.; Tilert, T.; McDowell, M. Physical activity in the United States measured by accelerometer. Med. Sci. Sports Exerc. 2008, 40, 181–188. [Google Scholar] [CrossRef] [PubMed]
- Freedson, P.S.; Melanson, E.; Sirard, J. Calibration of the Computer Science and Applications, Inc. accelerometer. Med. Sci. Sports Exerc. 1998, 30, 777–781. [Google Scholar] [CrossRef] [PubMed]
- Celis-Morales, C.A.; Ghouri, N.; Bailey, M.E.; Sattar, N.; Gill, J.M. Should physical activity recommendations be ethnicity-specific? Evidence from a cross-sectional study of South Asian and European men. PLoS ONE 2013, 8, e82568. [Google Scholar] [CrossRef] [PubMed]
- Curry, W.B.; Thompson, J.L. Comparability of accelerometer-and IPAQ-derived physical activity and sedentary time in South Asian women: A cross-sectional study. Eur. J. Sport Sci. 2015, 15, 655–662. [Google Scholar] [CrossRef] [PubMed]
- Templeton, G.F. A two-step approach for transforming continuous variables to normal: Implications and recommendations for IS research. Commun. Assoc. Inform. Syst. 2011, 28, 41–58. [Google Scholar]
- Hsieh, H.; Shannon, S.E. Three approaches to qualitative content analysis. Qual. Health Res. 2005, 15, 1277–1290. [Google Scholar] [CrossRef] [PubMed]
- Jepson, R.; Harris, F.M.; Bowes, A.; Robertson, R.; Avan, G.; Sheikh, A. Physical activity in South Asians: An in-depth qualitative study to explore motivations and facilitators. PLoS ONE 2012, 7, e45333. [Google Scholar] [CrossRef] [PubMed]
- Cross-Bardell, L.; George, T.; Bhoday, M.; Tuomainen, H.; Qureshi, N.; Kai, J. Perspectives on enhancing physical activity and diet for health promotion among at-risk urban UK South Asian communities: A qualitative study. BMJ Open 2015, 5, e007317. [Google Scholar] [CrossRef] [PubMed]
- Yates, T.; Henson, J.; Edwardson, C.; Bodicoat, D.H.; Davies, M.J.; Khunti, K. Differences in levels of physical activity between White and South Asian populations within a healthcare setting: Impact of measurement type in a cross-sectional study. BMJ Open 2015, 5, e006181. [Google Scholar] [CrossRef] [PubMed]
- Thorp, A.A.; Healy, G.N.; Winkler, E.; Clark, B.K.; Gardiner, P.A.; Owen, N.; Dunstan, D.W. Prolonged sedentary time and physical activity in workplace and non-work contexts: A cross-sectional study of office, customer service and call centre employees. Int. J. Behav. Nutr. Phys. Activity 2012, 9, 1. [Google Scholar] [CrossRef] [PubMed]
- Health & Social Care Information Centre (HSCIC) 2015. Available online: http://content.digital.nhs.uk/catalogue/pub16988/obes-phys-acti-diet-eng-2015.pdf (accessed on 17 October 2016).
- Hallal, P.C.; Victora, C.G.; Wells, J.C.; Lima, R.D.; Valle, N.J. Comparison of short and full-length international physical activity questionnaires. J. Phys. Act. Health 2004, 1, 227–234. [Google Scholar] [CrossRef]
- Parry, S.; Straker, L. The contribution of office work to sedentary behaviour associated risk. BMC Public Health 2013, 13, 296. [Google Scholar] [CrossRef] [PubMed]
- Withall, J.; Jago, R.; Fox, K.R. Why some do but most don’t. Barriers and enablers to engaging low-income groups in physical activity programmes: A mixed methods study. BMC Public Health 2011, 11, 1. [Google Scholar] [CrossRef] [PubMed]
- Lawton, J.; Ahmad, N.; Hanna, L.; Douglas, M.; Hallowell, N. ‘I can’t do any serious exercise’: Barriers to physical activity amongst people of Pakistani and Indian origin with type 2 diabetes. Health Educ. Res. 2006, 21, 43–54. [Google Scholar] [CrossRef] [PubMed]
- Abbott, S.; Riga, M. Delivering services to the Bangladeshi community: The views of healthcare professionals in East London. Public Health 2007, 121, 935–941. [Google Scholar] [CrossRef] [PubMed]
- Darr, A.; Astin, F.; Atkin, K. Causal attributions, lifestyle change, and coronary heart disease: Illness beliefs of patients of South Asian and European origin living in the United Kingdom. Heart Lung 2008, 37, 91–104. [Google Scholar] [CrossRef] [PubMed]
- Oliffe, J.L.; Grewal, S.; Bottorff, J.L.; Hislop, T.G.; Phillips, M.J.; Dhesi, J.; Kang, H.B. Connecting masculinities and physical activity among senior South Asian Canadian immigrant men. Crit. Public Health 2009, 19, 383–397. [Google Scholar] [CrossRef]
- Belza, B.; Walwick, J.; Shiu-Thornton, S.; Schwartz, S.; Taylor, M.; LoGerfo, J. Older adult perspectives on physical activity and exercise: Voices from multiple cultures. Prev. Chronic Dis. 2004, 1, A09. [Google Scholar] [PubMed]
- Wieland, M.L.; Tiedje, K.; Meiers, S.J.; Mohamed, A.A.; Formea, C.M.; Ridgeway, J.L.; Asiedu, G.B.; Boyum, G.; Weis, J.A.; Nigon, J.A.; et al. Perspectives on physical activity among immigrants and refugees to a small urban community in Minnesota. J. Immigr. Minor. Health 2015, 17, 263–275. [Google Scholar] [CrossRef] [PubMed]
- Allender, S.; Cowburn, G.; Foster, C. Understanding participation in sport and physical activity among children and adults: A review of qualitative studies. Health Educ. Res. 2006, 21, 826–835. [Google Scholar] [CrossRef] [PubMed]
- Tammelin, R.; Yang, X.; Leskinen, E.; Kankaanpaa, A.; Hirvensalo, M.; Tammelin, T. Tracking of Physical Activity from Early Childhood through Youth into Adulthood. Med. Sci. Sports Exerc. 2014, 46, 955–962. [Google Scholar]
- Hallal, P.C.; Victora, C.G.; Azevedo, M.R.; Wells, J.C. Adolescent physical activity and health. Sports Med. 2006, 36, 1019–1030. [Google Scholar] [CrossRef] [PubMed]
- Gordon-Larsen, P.; Nelson, M.C.; Popkin, B.M. Longitudinal physical activity and sedentary behavior trends: Adolescence to adulthood. Am. J. Prev. Med. 2004, 27, 277–283. [Google Scholar] [CrossRef] [PubMed]
- Bhatnagar, P.; Shaw, A.; Foster, C. Generational differences in the physical activity of UK South Asians: A systematic review. Int. J. Behav. Nutr. Phys. Act. 2015, 12, 1. [Google Scholar] [CrossRef] [PubMed]
- Iliodromiti, S.; Ghouri, N.; Celis-Morales, C.A.; Sattar, N.; Lumsden, M.A.; Gill, J.M. Should Physical Activity Recommendations for South Asian Adults Be Ethnicity-Specific? Evidence from a Cross-Sectional Study of South Asian and White European Men and Women. PLoS ONE 2016, 11, e0160024. [Google Scholar] [CrossRef] [PubMed]
- Tackey, N.D.; Barnes, H.; Khambhaita, P. Poverty, Ethnicity and Education. JRF Programme Paper: Poverty and Ethnicity. 2011; Joseph Rowntree Foundation. Available online: https://www.jrf.org.uk/sites/default/files/jrf/migrated/files/poverty-ethnicity-education-full.pdf (accessed on 7 January 2017).


| Full Study Sample (A) (N = 63) | Sample with Valid Data Included in Analyses (B) (n = 54) | Sub-Sample Participating in Qualitative Interview (C) (n = 31) | p-Value Differences between A and B | p-Value Differences between A and C | p-Value Differences between B and C | |
|---|---|---|---|---|---|---|
| Age (years) | 44.8 ± 9.9 | 45.0 ± 9.79 | 43.9 ± 10.4 | 0.449 | 0.728 | 0.569 |
| BMI (kg/m2) | 28.1 ± 4.2 | 27.5 ± 3.1 | 27.8 ± 3.7 | 0.816 | 0.618 | 0.619 |
| Weight (kg) | 82.0 ± 13.0 | 80.1 ± 10.7 | 80.8 ± 11.9 | 0.910 | 0.354 | 0.674 |
| Height (cm) | 170.8 ± 6.1 | 170.7 ± 6.1 | 170.3 ± 6.6 | 0.715 | 0.605 | 0.960 |
| Waist Circumference (cm) | 99.7 ± 10.4 | 98.2 ± 8.6 | 99.2 ± 9.4 | 0.242 | 0.758 | 0.810 |
| Systolic Blood Pressure (mmHg) | 128.2 ± 15.2 | 128.2 ± 15.9 | 128.4 ± 16.1 | 0.687 | 0.581 | 0.777 |
| Diastolic Blood Pressure (mmHg) | 84.8 ± 9.4 | 84.7 ± 9.8 | 84.4 ± 10.4 | 0.502 | 0.524 | 0.786 |
| HGS (kg) | 29.9 ± 6.6 | 29.7 ± 6.9 | 30.4 ± 7.3 | 0.890 | 0.504 | 0.766 |
| IMD rank | 16,661.5 ± 9470.8 | 16,907.3 ± 9642.3 | 19,818.5 ± 8281.2 | 0.102 | 0.147 | 0.298 |
| Characteristic | Number (%) |
|---|---|
| Country of birth | |
| UK | 9 (16.7) |
| India | 39 (72.2) |
| Pakistan | 1 (1.9) |
| Bangladesh | 5 (9.3) |
| Ethnicity | |
| Indian | 48 (88.9) |
| Pakistani | 1 (1.9) |
| Bangladeshi | 5 (9.3) |
| Faith | |
| Hindu | 26 (48.1) |
| Sikh | 17 (31.5) |
| Muslim | 7 (13.0) |
| Hare Krishna | 2 (3.7) |
| Buddhist | 2 (3.7) |
| Education | |
| University/Higher Education | 44 (81.5) |
| College | 6 (11.1) |
| Secondary School | 3 (5.6) |
| Primary School | 1 (1.9) |
| Self-Reported English Literacy | |
| Excellent | 31 (57.4) |
| Good | 16 (29.6) |
| Fair | 6 (11.1) |
| Poor | 1 (1.9) |
| Self-Reported Health | |
| Excellent | 8 (14.8) |
| Good | 31 (57.4) |
| Fair | 14 (25.9) |
| Poor | 1 (1.9) |
| Taking Prescribed Medication | |
| Yes | 23 (42.6) |
| No | 31 (57.4) |
| Taking Blood Pressure Medication | |
| Yes | 14 (25.9) |
| No | 40 (74.1) |
| Variables | Mean ± SD |
|---|---|
| Moderate Intensity PA (min/week) | 284.6 ±183.9 |
| Vigorous Intensity PA (min/week) | 14.2 ± 26.1 |
| Very Vigorous Intensity PA (min/week) | 0.1 ± 0.5 |
| Total MVPA (min/week) | 298.9 ± 186.6 |
| Sedentary Time (min/week) | 551.4 ± 95.0 |
| % Time Spent Sedentary | 65.3 ± 8.6 |
| n (%) | |
| Participants achieving 150 min of MVPA | 33 (61.1) |
| Participants achieving 150 min of MVPA in 10 or more minute bouts | 13 (24.1) |
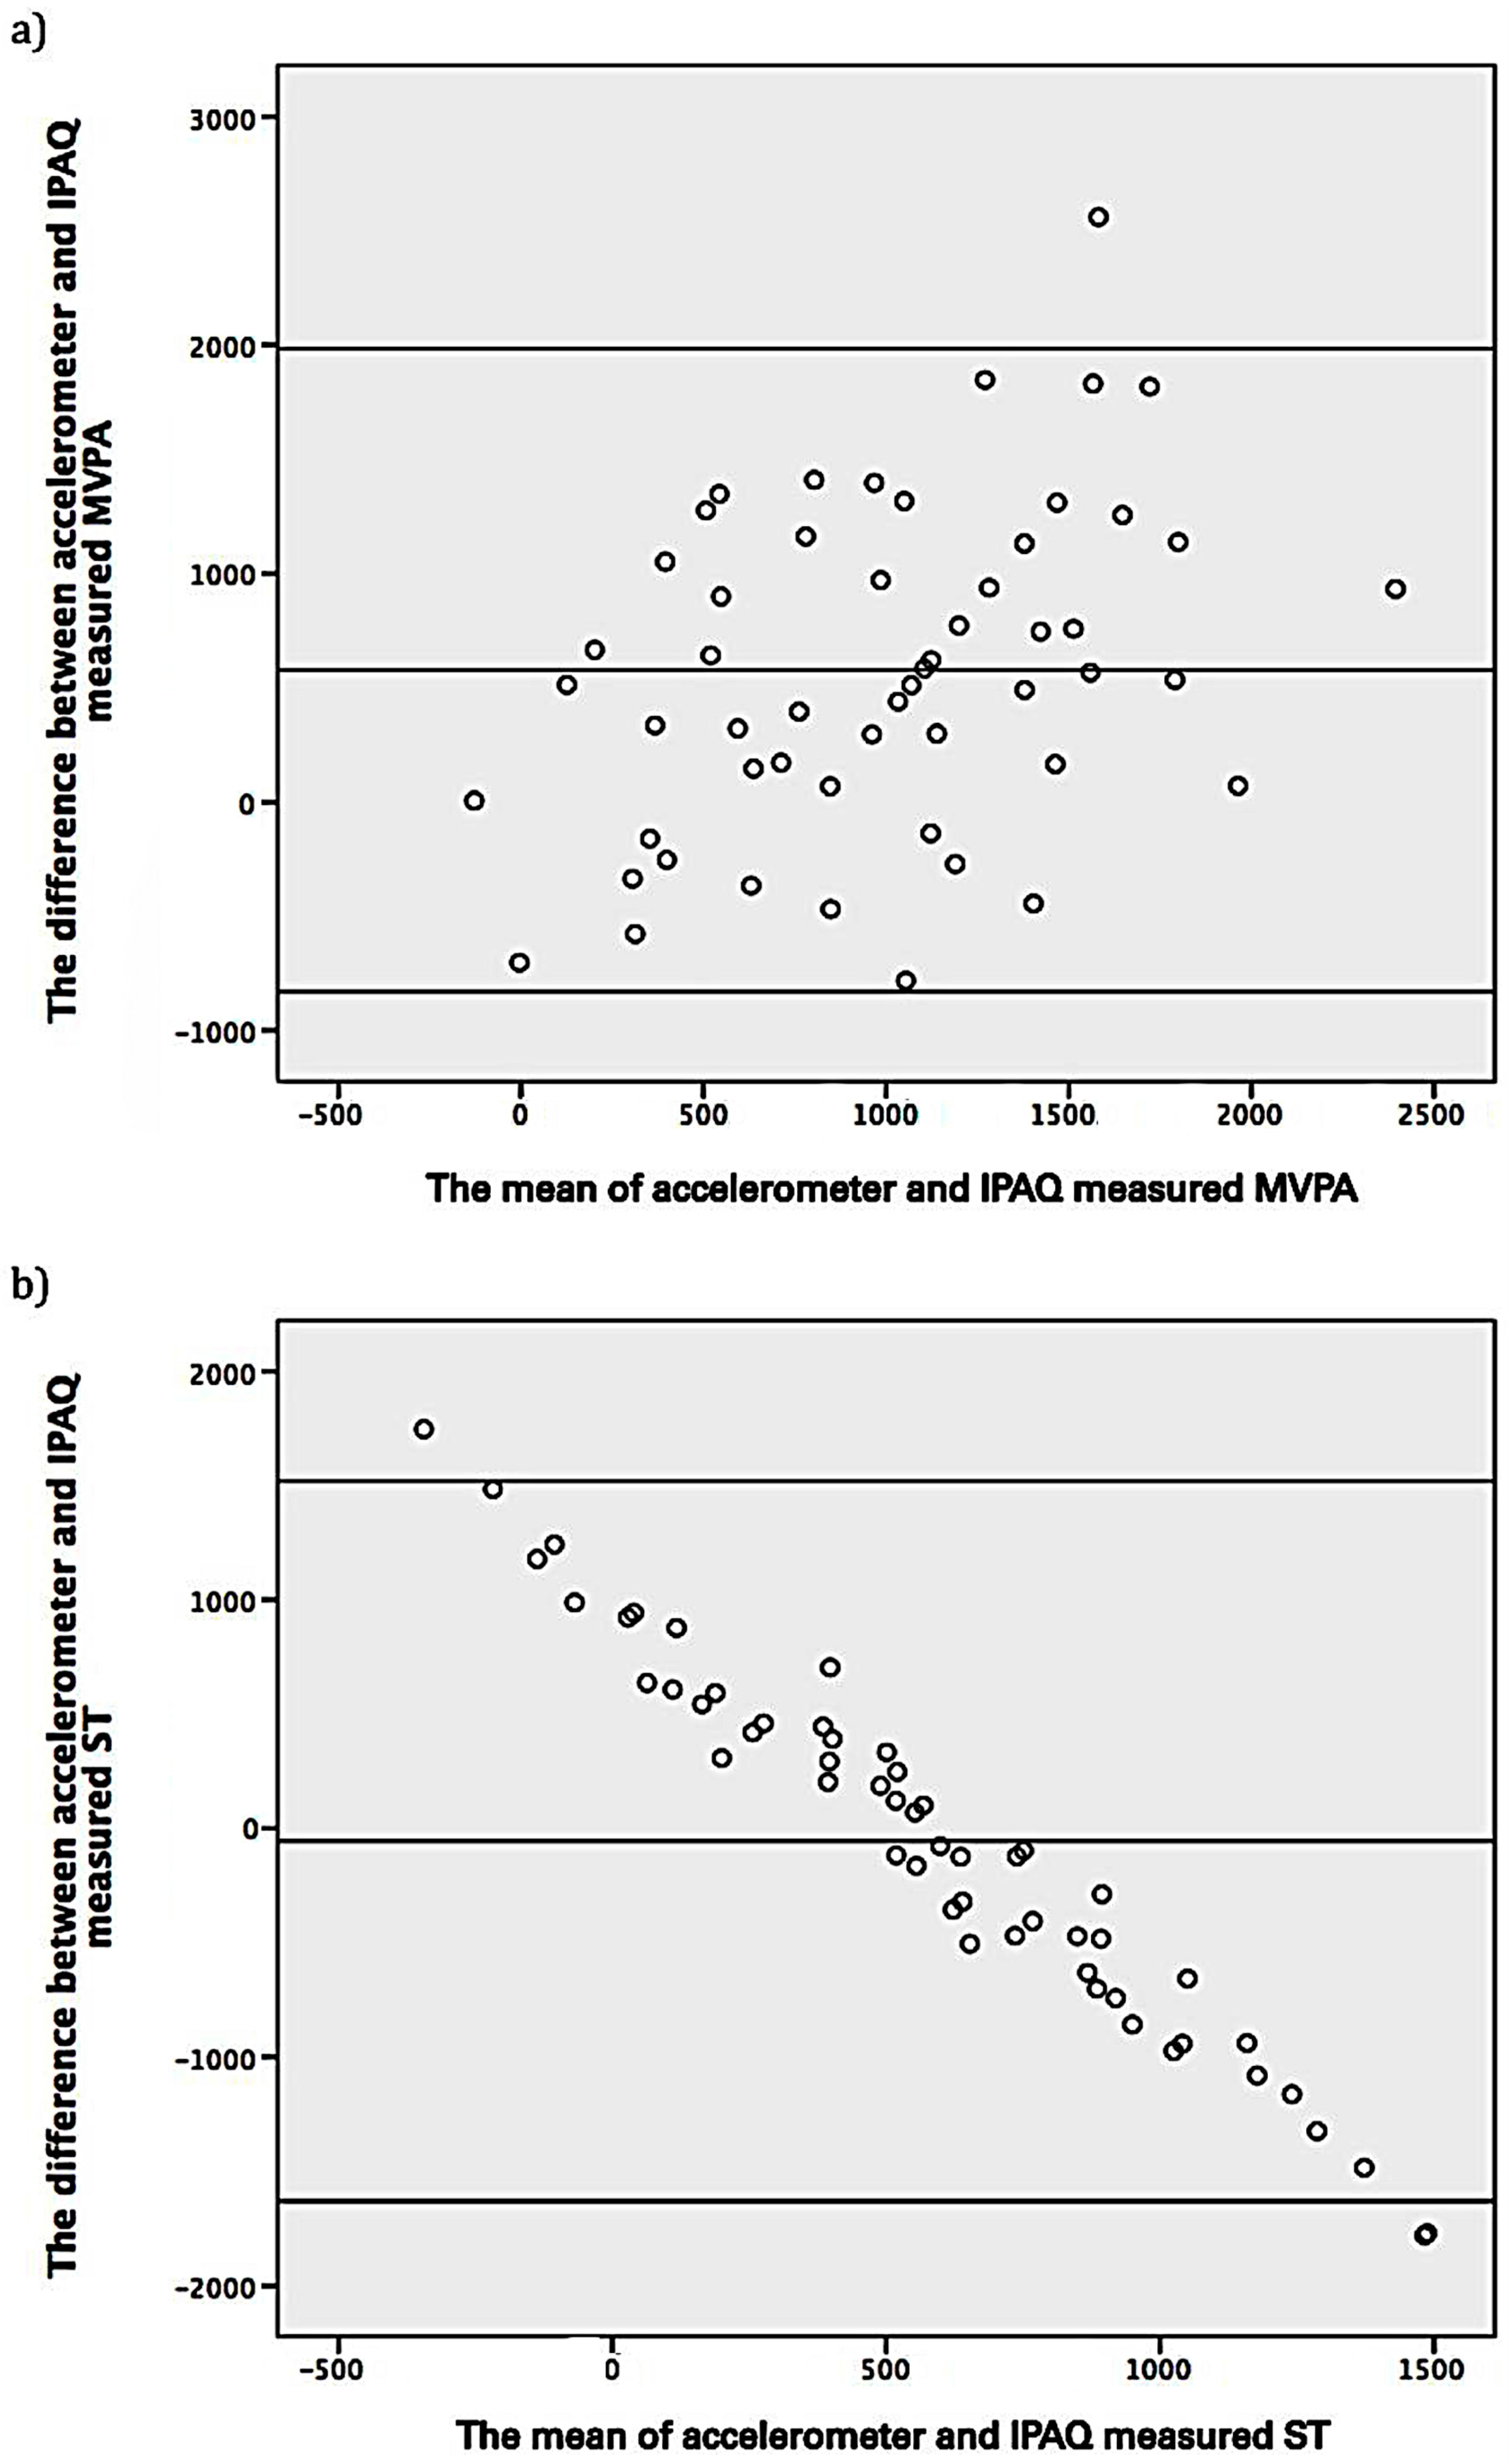
| Variables | All (n = 54) | Sub-Sample (n = 31) | p-Value from T-Test Comparison between All Participants and the Sub-Sample | p-Value from T-Test Comparison between Accelerometer and IPAQ |
|---|---|---|---|---|
| IPAQ MVPA (MET–min/week) | 675.7 ± 532.0 | 764.5 ± 549.9 | p = 0.211 | p < 0.001 |
| IPAQ ST (min/day) | 577.8 ± 860.7 | 723.6 ± 1155.0 | p = 0.205 | p < 0.001 |
| Accelerometery MVPA (MET min/week) | 1253.0 ±771.2 | 1409.3 ± 909.9 | p = 0.195 | |
| Accelerometery ST (min/day) | 551.4 ± 95.0 | 566.7 ± 95.4 | p = 0.314 |
© 2017 by the authors. Licensee MDPI, Basel, Switzerland. This article is an open access article distributed under the terms and conditions of the Creative Commons Attribution (CC BY) license (http://creativecommons.org/licenses/by/4.0/).
Share and Cite
Emadian, A.; Thompson, J. A Mixed-Methods Examination of Physical Activity and Sedentary Time in Overweight and Obese South Asian Men Living in the United Kingdom. Int. J. Environ. Res. Public Health 2017, 14, 348. https://doi.org/10.3390/ijerph14040348
Emadian A, Thompson J. A Mixed-Methods Examination of Physical Activity and Sedentary Time in Overweight and Obese South Asian Men Living in the United Kingdom. International Journal of Environmental Research and Public Health. 2017; 14(4):348. https://doi.org/10.3390/ijerph14040348
Chicago/Turabian StyleEmadian, Amir, and Janice Thompson. 2017. "A Mixed-Methods Examination of Physical Activity and Sedentary Time in Overweight and Obese South Asian Men Living in the United Kingdom" International Journal of Environmental Research and Public Health 14, no. 4: 348. https://doi.org/10.3390/ijerph14040348