Article

Spatiotemporal Variation in Environmental Vibrio cholerae in an Estuary in Southern Coastal Ecuador

1
Quantitative Disease Ecology and Conservation Lab, Department of Geography, University of Florida, Gainesville, FL 32610 USA
2
Emerging Pathogens Institute, University of Florida, Gainesville, FL 32610, USA
3
Center for Global Health and Translational Science, SUNY Upstate Medical University, Syracuse, NY 13210, USA
4
Laboratorio para Investigaciones Biomédicas, FCV, Escuela Superior Politécnica del Litoral, Guayaquil 090101, Ecuador
5
Division of Nutritional Sciences, Cornell University, Ithaca, NY 14850, USA
6
Department of Microbiology and Immunology, SUNY Upstate Medical University, Syracuse, NY 13210, USA
7
Department of Fish and Wildlife Conservation, Virginia Tech, Blacksburg, VA 24061, USA
*
Author to whom correspondence should be addressed.
Int. J. Environ. Res. Public Health 2018, 15(3), 486; https://doi.org/10.3390/ijerph15030486
Submission received: 29 January 2018 / Revised: 4 March 2018 / Accepted: 5 March 2018 / Published: 10 March 2018
(This article belongs to the Section Global Health)

Abstract

:
Cholera emergence is strongly linked to local environmental and ecological context. The 1991–2004 pandemic emerged in Perú and spread north into Ecuador’s El Oro province, making this a key site for potential re-emergence. Machala, El Oro, is a port city of 250,000 inhabitants, near the Peruvian border. Many livelihoods depend on the estuarine system, from fishing for subsistence and trade, to domestic water use. In 2014, we conducted biweekly sampling for 10 months in five estuarine locations, across a gradient of human use, and ranging from inland to ocean. We measured water-specific environmental variables implicated in cholera growth and persistence: pH, temperature, salinity, and algal concentration, and evaluated samples in five months for pathogenic and non-pathogenic Vibrio cholerae, by polymerase chain reaction (PCR). We found environmental persistence of pandemic strains O1 and O139, but no evidence for toxigenic strains. Vibrio cholerae presence was coupled to algal and salinity concentration, and sites exhibited considerable seasonal and spatial heterogeneity. This study indicates that environmental conditions in Machala are optimal for cholera re-emergence, with risk peaking during September, and higher risk near urban periphery low-income communities. This highlights a need for surveillance of this coupled cholera–estuarine system to anticipate potential future cholera outbreaks.

1. Introduction

Cholera, a disease caused by the Gram-negative bacteria Vibrio cholerae, remains a severe global threat to public health and development efforts [1]. A 2015 study estimated the global burden at 2.86 million cases, with 95,000 deaths, and 1.3 billion people at risk of cholera infection [2]. An analysis of global cholera pandemics indicated that cholera outbreaks originate in coastal regions, often during flooding events, before spreading inland [3]. Studies suggest outbreaks of V. cholerae can be explained by oceanographic variables (e.g., sea surface temperature, pH, salinity) and phytoplankton blooms, indicating the potential to predict disease outbreaks [3,4]. Blue-green algae (BGA, cyanobacteria) has been described as a reservoir for environmental cholera [5], in part because its growth raises pH, encouraging Vibrio growth, but also as the major food source for zooplankton. The association between V. cholerae and zooplankton, wherein Vibrio are highly concentrated on their carapaces and internally, makes untreated water consumption in coupled zooplankton-phytoplankton hotspots a major potential point of infection [6]. Our previous work suggests that both predicted current and future coastal hotspots of cholera transmission are far larger than current epidemiological surveillance efforts can capture [7]. Indeed, the links between climate change and cholera brings the role of environmental V. cholerae persistence into sharp relief [8], highlighting the importance of local surveillance efforts in vulnerable areas.
Estuarine systems are a natural intersection of coastal oceanographic conditions and human use; as productive systems for fisheries, port locations for transport, and rich riparian soils, they are a highly-exposed interface. Coastal estuarine systems often represent subsistence-level dependence on the interface, in terms of artisanal fisheries, a higher likelihood of direct water use, and simply greater physical exposure by proximity. This renders them the most vulnerable of populations, most likely to be exposed to pathogens, and in the most flooding-prone areas in the world [9,10,11,12,13,14]. The causative agent of cholera, V. cholerae, originates from estuarine waters. Evidence for this includes phylogenetic information and the physiological requirements for growth and persistence [15,16]. V. cholerae is environmentally persistent in the Bay of Bengal (Bangladesh and India), along coastal areas in Latin America [6,17], and in riverine, estuarine, and coastal waters around the world [6]. Cholera epidemics have historically followed coastlines [18], and V. cholerae can be transmitted to humans via a wide range of marine organisms, including zooplankton, aquatic plants, shellfish, and fish [19].
Ecuador is a critical location to understand cholera and other climate and water-sensitive diseases due to its: (1) high potential for cholera outbreaks, and the high incidence of other climate-sensitive infectious diseases (e.g., leptospirosis, dengue); and (2) the strong influence of oceanographic conditions on local climate and flooding during El Niño events [9,10,14,20,21]. In January 1991, cholera re-emerged in Latin America after more than a century without cases [22]. In Ecuador, the 1991 cholera epidemic emerged in the south of the country from a small fishing village in El Oro Province, and it is suspected that a fisherman introduced the index case was traveling north from Perú [12]. From 1991 to 2004 over 90,000 cases of cholera were reported in Ecuador, with most cases from coastal provinces. El Oro and Guayas provinces, located in southern coastal Ecuador, collectively represented one of two disease epicenters in the country. Recent studies indicate a high risk of a second epidemic in Ecuador due to the presence of important risk factors including the growth of vulnerable urban populations, decreased investment in cholera surveillance and prevention programs, increased flood risk associated with climate change, and a street food culture that includes eating raw shellfish (ceviche) [23]. In addition, Guayaquil (Guayas Province), the largest city in Ecuador, has been identified as the third most vulnerable city in the world to future flood risk [9]. Furthermore, it has been found that in populations with a high prevalence of blood group O, such as in Latin America, illness from cholera is more severe, and the requirements for rehydration and hospitalization of infected individuals are considerably higher [24,25]. Given these conditions, there is compelling evidence that people in the southern coast of Ecuador are a high-risk population and there is a critical need for active cholera surveillance in this region.
To address this, local variability in the presence of V. cholerae was evaluated in the estuarine environment surrounding the city of Machala, El Oro province, a site identified as a current and future coastal cholera hotspot [7]. Five sampling sites were selected, associated with estuarine water access in Machala, Ecuador, representing a range of economic and human activity conditions, in addition to different proximity to the ocean. Using water sampling methodology, coupled with laboratory identification of V. cholerae bacteria, the local environmental and pathogenic conditions were assessed for a period of ten months. Strengthening climate and water-sensitive infectious disease surveillance systems [26,27] and further understanding of the role of environmental factors in disease outbreak and transmission over time and space [28,29] are urgently needed to target cholera and other climate and water sensitive diseases.

2. Materials and Methods
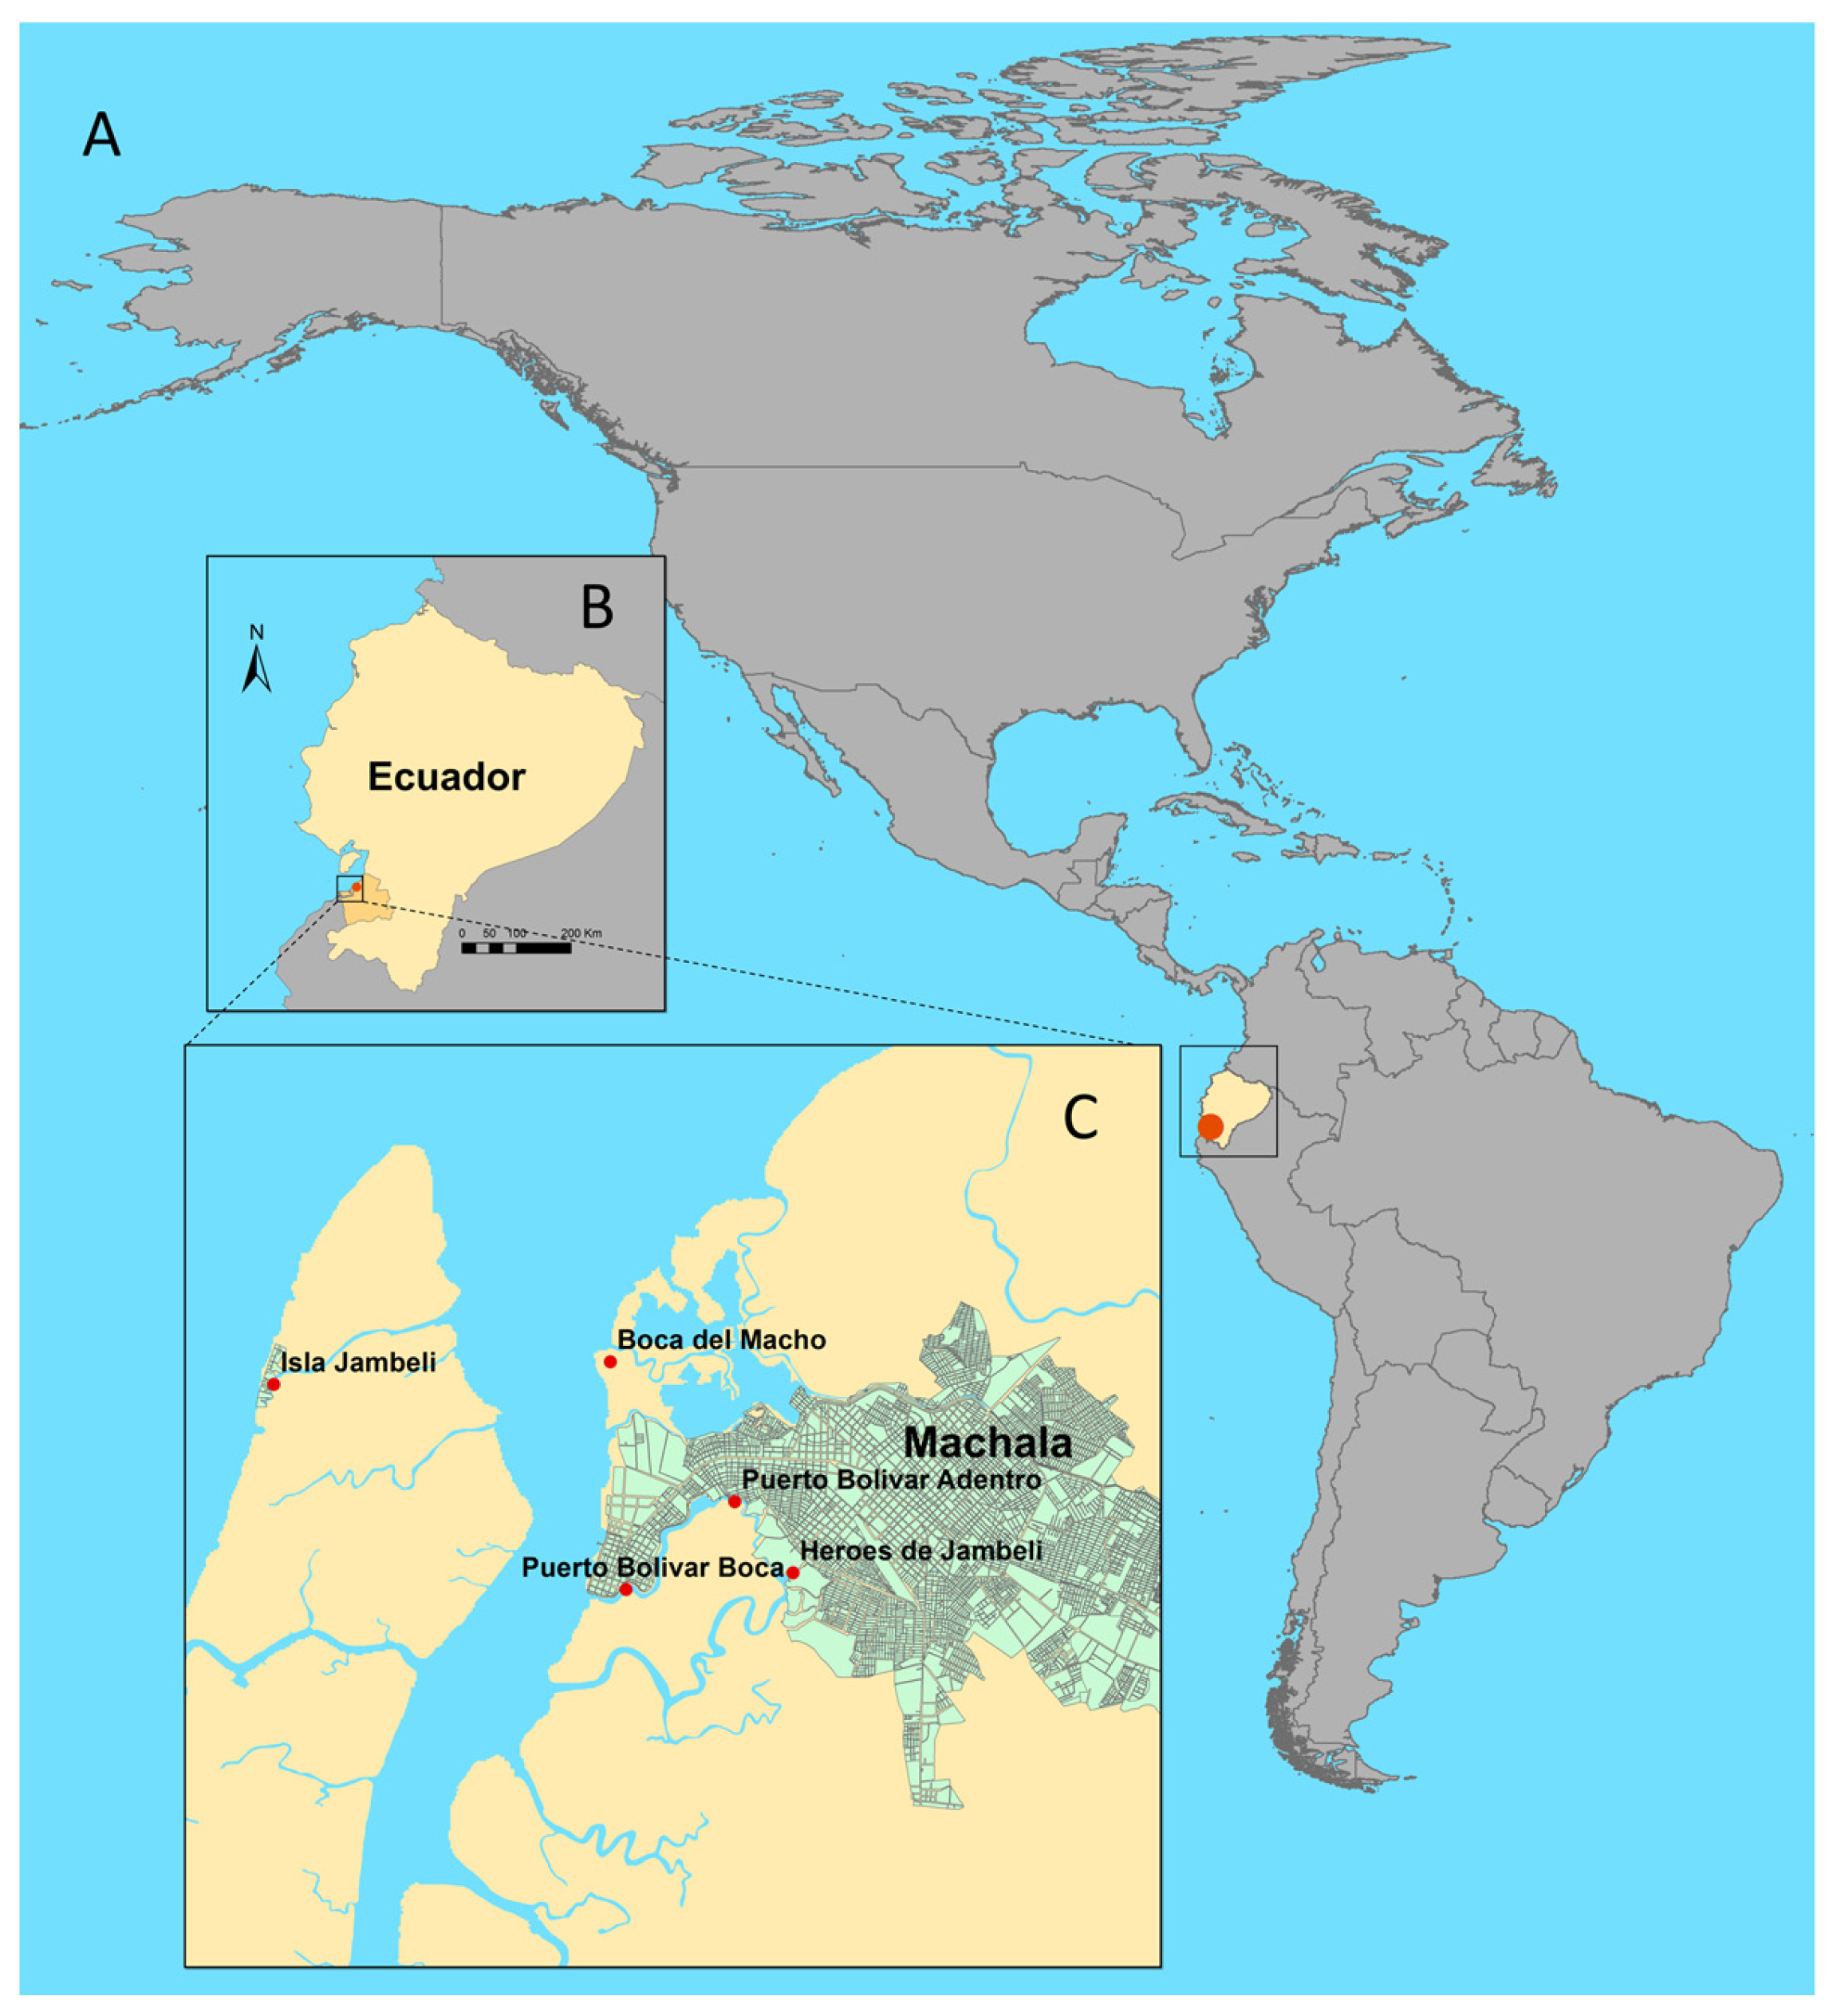
2.1. Study Site

Machala is a port city of approximately 250,000 inhabitants, with major economic activities stemming from agriculture (bananas), aquaculture (shrimp farming), and fishing/shellfish collection, both small-scale and semi-industrial scale. Five sampling sites (Isla Jambelí, Boca del Macho, Puerto Bolívar Boca, Puerto Bolívar Adentro, and Héroes de Jambelí) were established within the Machala estuarine system (Figure 1), selected for maximum heterogeneity, to include highly built urban areas, ports, mangrove, and coastal areas. Isla Jambelí is on the outer edge of the coastal draining estuary, and the entrance to Jambelí is interspersed with mangroves and shrimp farms. Boca del Macho is the open edge of the inner estuary, in open water on shallow sand, with mangroves. Puerto Bolívar Boca is near the mouth of the open harbor, characterized by heavy boat traffic, commercial fishing, and residences lining the waterway, with mangroves and shrimp farming on the far side of the waterway. Puerto Bolívar Adentro is within the city, on the estuary, in an area characterized by residential low-income housing, with shrimp farms and mangroves across the Héroes waterway. Héroes de Jambelí is the most inland site, characterized by low income and poor-quality housing built along mangroves at the edge of the city; outflow from the houses visibly drains directly into the water (Figure 1). The port city of Machala is an important sentinel surveillance site, due to its location along the Pan American highway, approximately 80 km north of the Peruvian border, facilitating significant movement of people and potential pathogens by land and sea.

2.2. Collection of Water Samples and Environmental Measurements

At each of the five study sites (Figure 1), water sampling was conducted at high tide, twice monthly along a transect with three sub-sites spaced 250 m apart, and three replicates per sub-site. Three 1 L surface water samples per sub-site were collected in sterile polypropylene bottles, and placed in coolers with ice for transport to the laboratory. Biological, chemical, and physical water characteristics were sampled using a YSI water probe* (600 XLM V2 Sonde, Yellow Springs Incorporated (YSI), Yellow Springs, OH, USA). Surface temperature (°C), conductivity, pH, salinity, and Optic-T BGA PE (Phycoerythrin) (blue-green algae) (cells/mL, which we converted to cells/µL for ease of visualization) were recorded, at each end of the transect.

2.3. Laboratory Analyses

Water samples were transferred to the laboratory in coolers for V. cholerae testing and were processed within 24 h of collection. For laboratory analysis, a 1 L water sample was filtered through a No. 1 Whatman membrane (11 μm pore size) and 0.22 μm membrane (Millipore, Darmstadt, Germany) by vacuum. Then, 10 mL of phosphate-buffered saline (PBS) (pH 7.4) was pipetted onto the retained contents on the membrane and gently washed by pipette 15x. The PBS was left on the membrane to incubate at room temperature for 15 min prior to collection in a 50 mL conical tube. Three milliliters of membrane-washed PBS was enriched in 27 mL alkaline peptone water (APW) (1% peptone, 1% NaCl, pH 8.6) and incubated for 24 h at room temperature. Ambient room temperature in the laboratory was recorded daily. Five milliliters of bacteria enriched with APW was then centrifuged at 4500 rpm for 10 min at 4 °C, the supernatant was decanted, and the pellet was frozen at −80 °C for DNA isolation.

2.4. DNA Isolation and PCR

Genomic DNA was extracted from bacterial pellet of the previous step with a QIAamp DNA mini kit (Qiagen, Hilden, Germany), following manufacture instructions. Multiplex PCR was used for identification of Vibrio cholerae serogroups and the detection of toxigenic genes. Table 1 describes the primer sets used to amplify the rfb (O antigen biosynthesis encoding) region of O1 and O139 serogroups and the toxin subunit A (ctxA) and toxin coregulated pilus (tcpA) genes. For both duplex PCRs, master mix was as follows: 0.05 U/uL of JumpStart REDTaq DNA Polymerase (Sigma, Darmstadt, Germany), 1X buffer, 0.2 mM dNTPs, 0.2 mM of each primer set, 1 µL of template and ultrapure water to a final volume of 25 µL. The amplification program for diagnosis of serogroups was adapted from Hoshino et al. [30] using the following conditions: 5 min at 94 °C, 35 cycles of 94 °C for 1 min, 55 °C for 1 min, and 72 °C for 1 min and final extension of 72 °C for 7 min. Positive samples for either or both serogroups were subjected to toxigenic genes duplex PCR. The amplification program was according to conditions described in Kumar et al. [31]: 3 min at 94 °C, 30 cycles of 94 °C for 30 s, 59 °C for 30 s, and 72 °C for 1.2 min, and final extension of 72 °C for 10 min. PCR products were resolved in a 2% agarose gel. Our positive extraction control was a strain of the V. cholerae O1 serogroup, kindly provided by the National Institute of Public Health Research (INSPI). As negative control we used an isolate of Escherichia coli DH5 alpha. Moreover, to validate our multiplex PCR methods, some positive O1 and O139 amplicons were cloned into a pGEM®-T plasmid vector (Promega, Madison, WI, USA) and then sent for sequencing to Genewiz Company (South Plainfield, NJ, USA). Sequences can be provided on request.

2.5. Statistical Analyses

As the data were not normally distributed, we conducted non-parametric tests to explore differences between sites. Each water environmental variable: temperature, pH, salinity, and BGA, was examined using the Kruskal-Wallis rank sum tests on site means, and on monthly means. To explore the relationships between environmental variables and V. cholerae prevalence, and the separate strains (i.e., O1, O139), we used a generalized linear mixed model (GLMM), allowing us to control for site differences. We used the lme4 package in R [33], with prevalence specified as a ‘binomial’ distribution family, setting site (n = 5) as the random effect, and environmental variables (four variables, n = 25 observations) as fixed effects.

3. Results

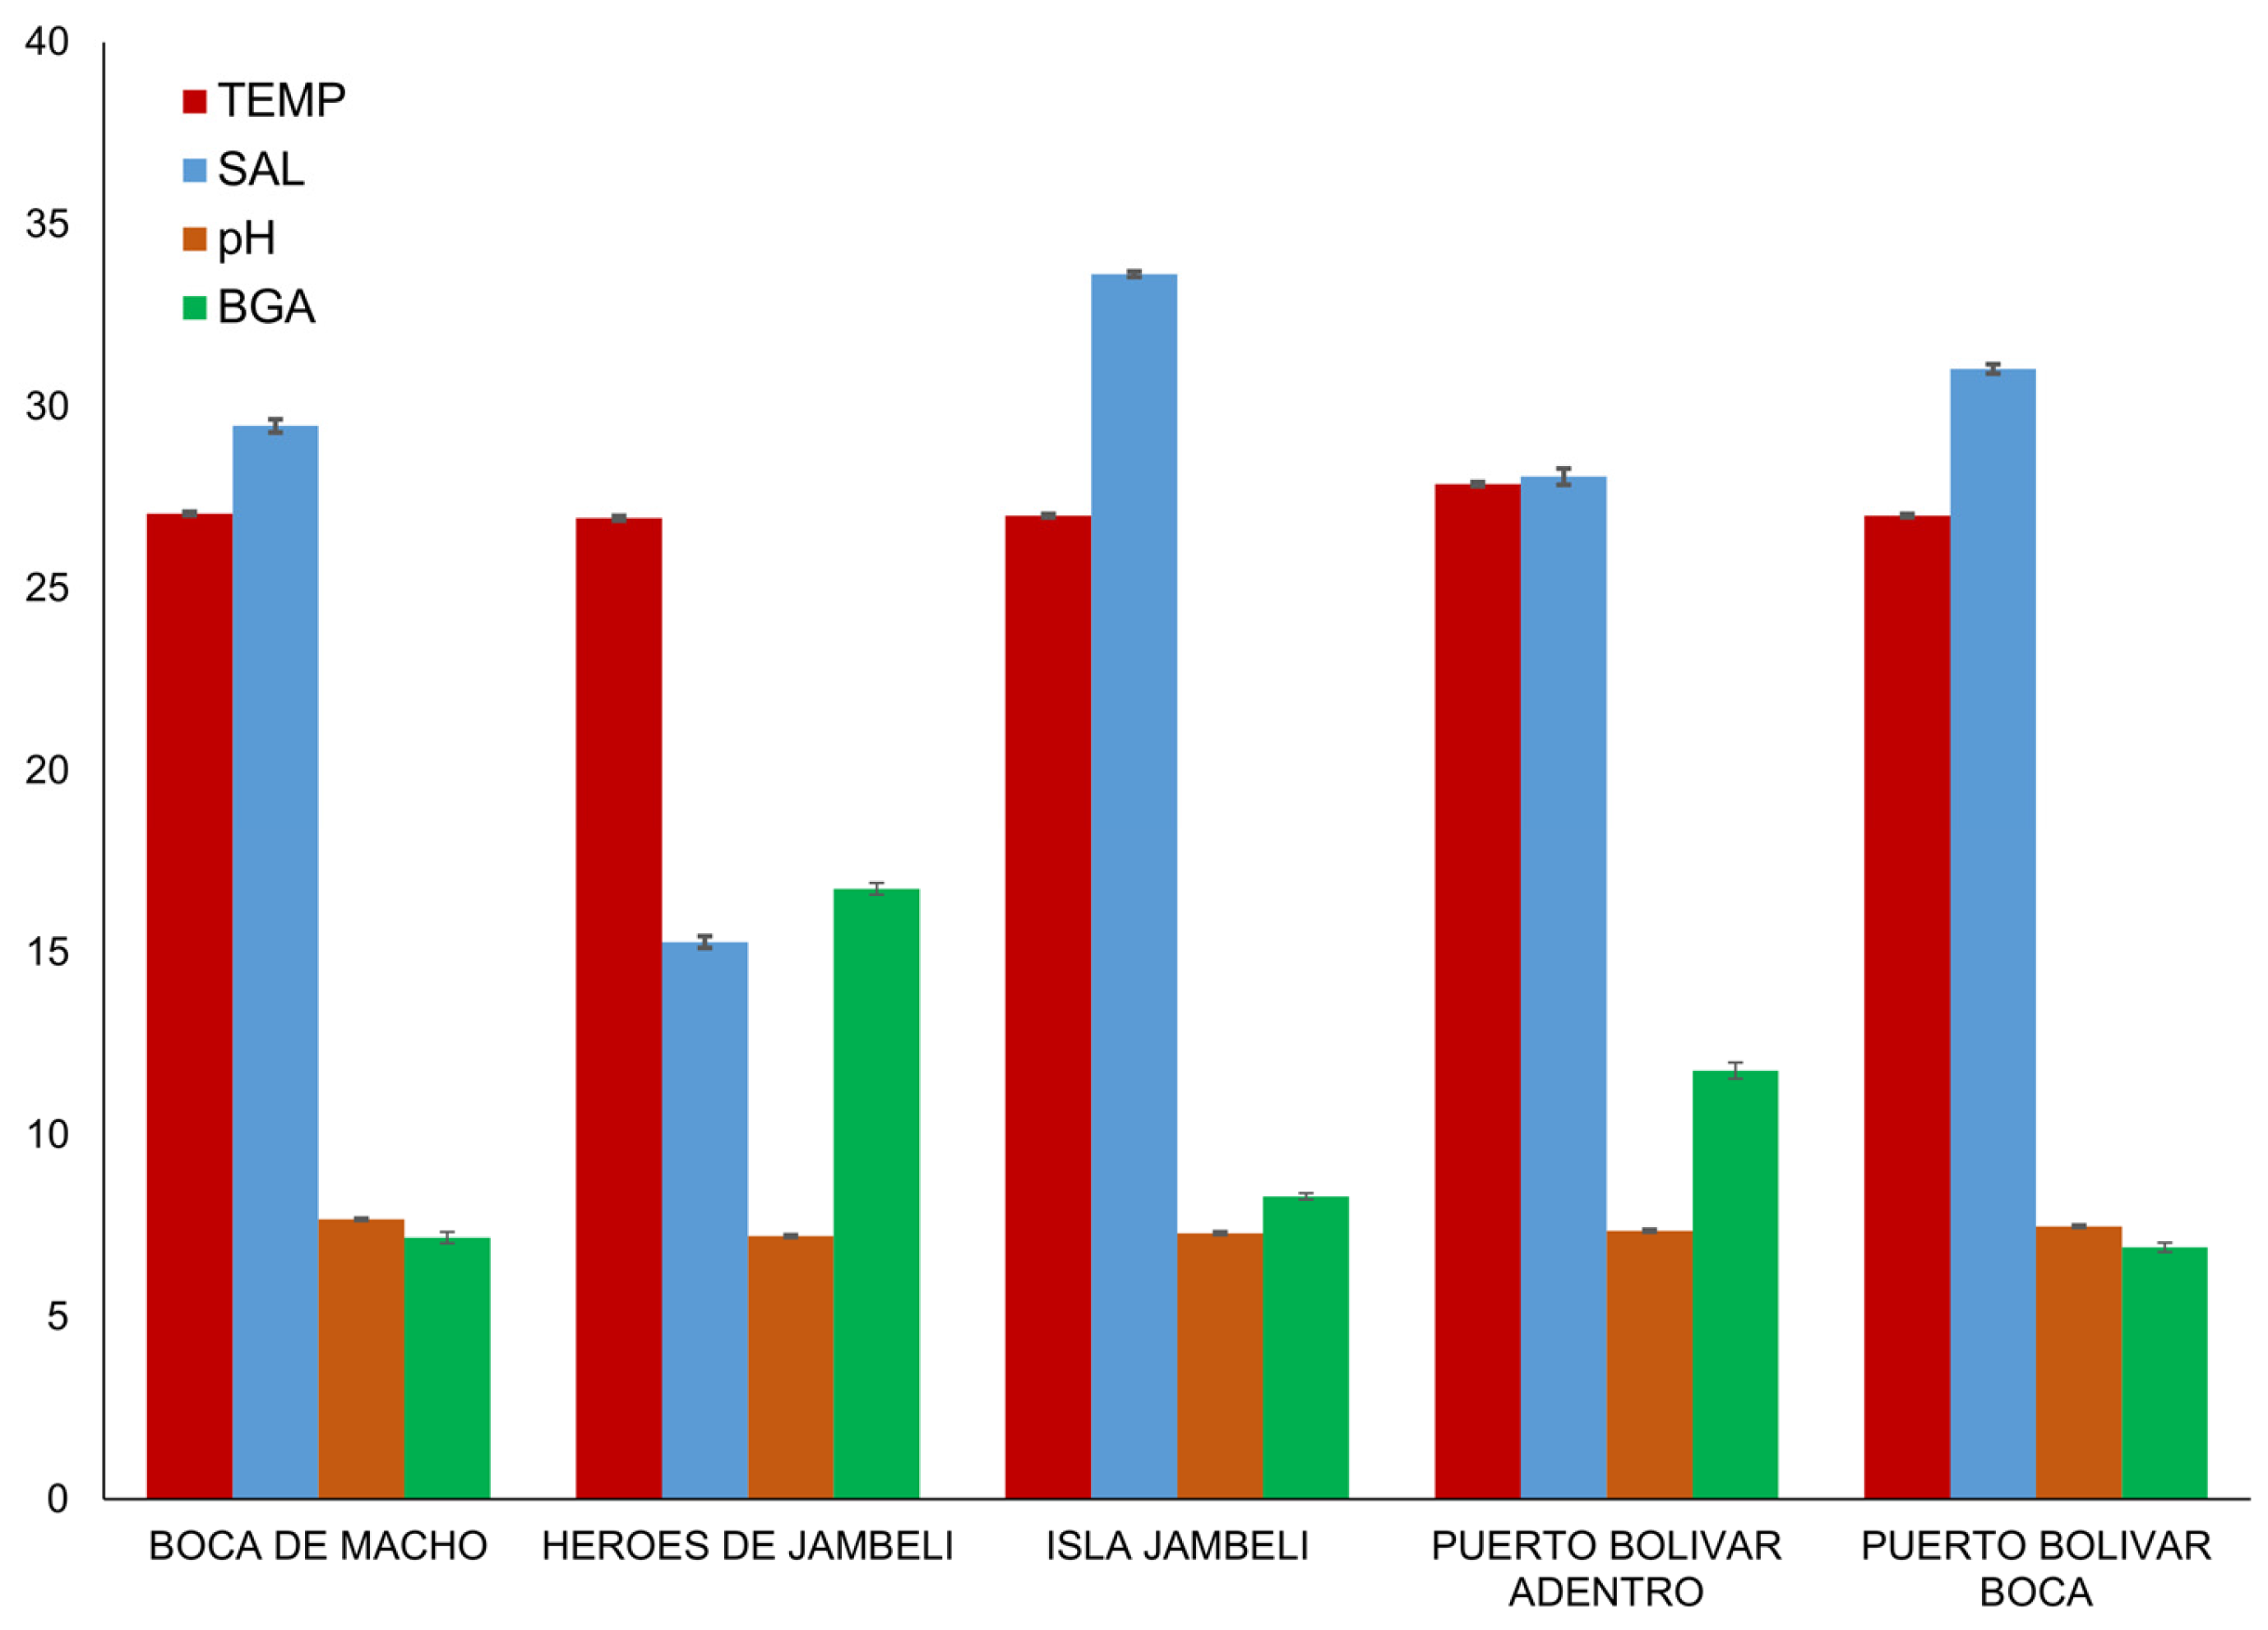
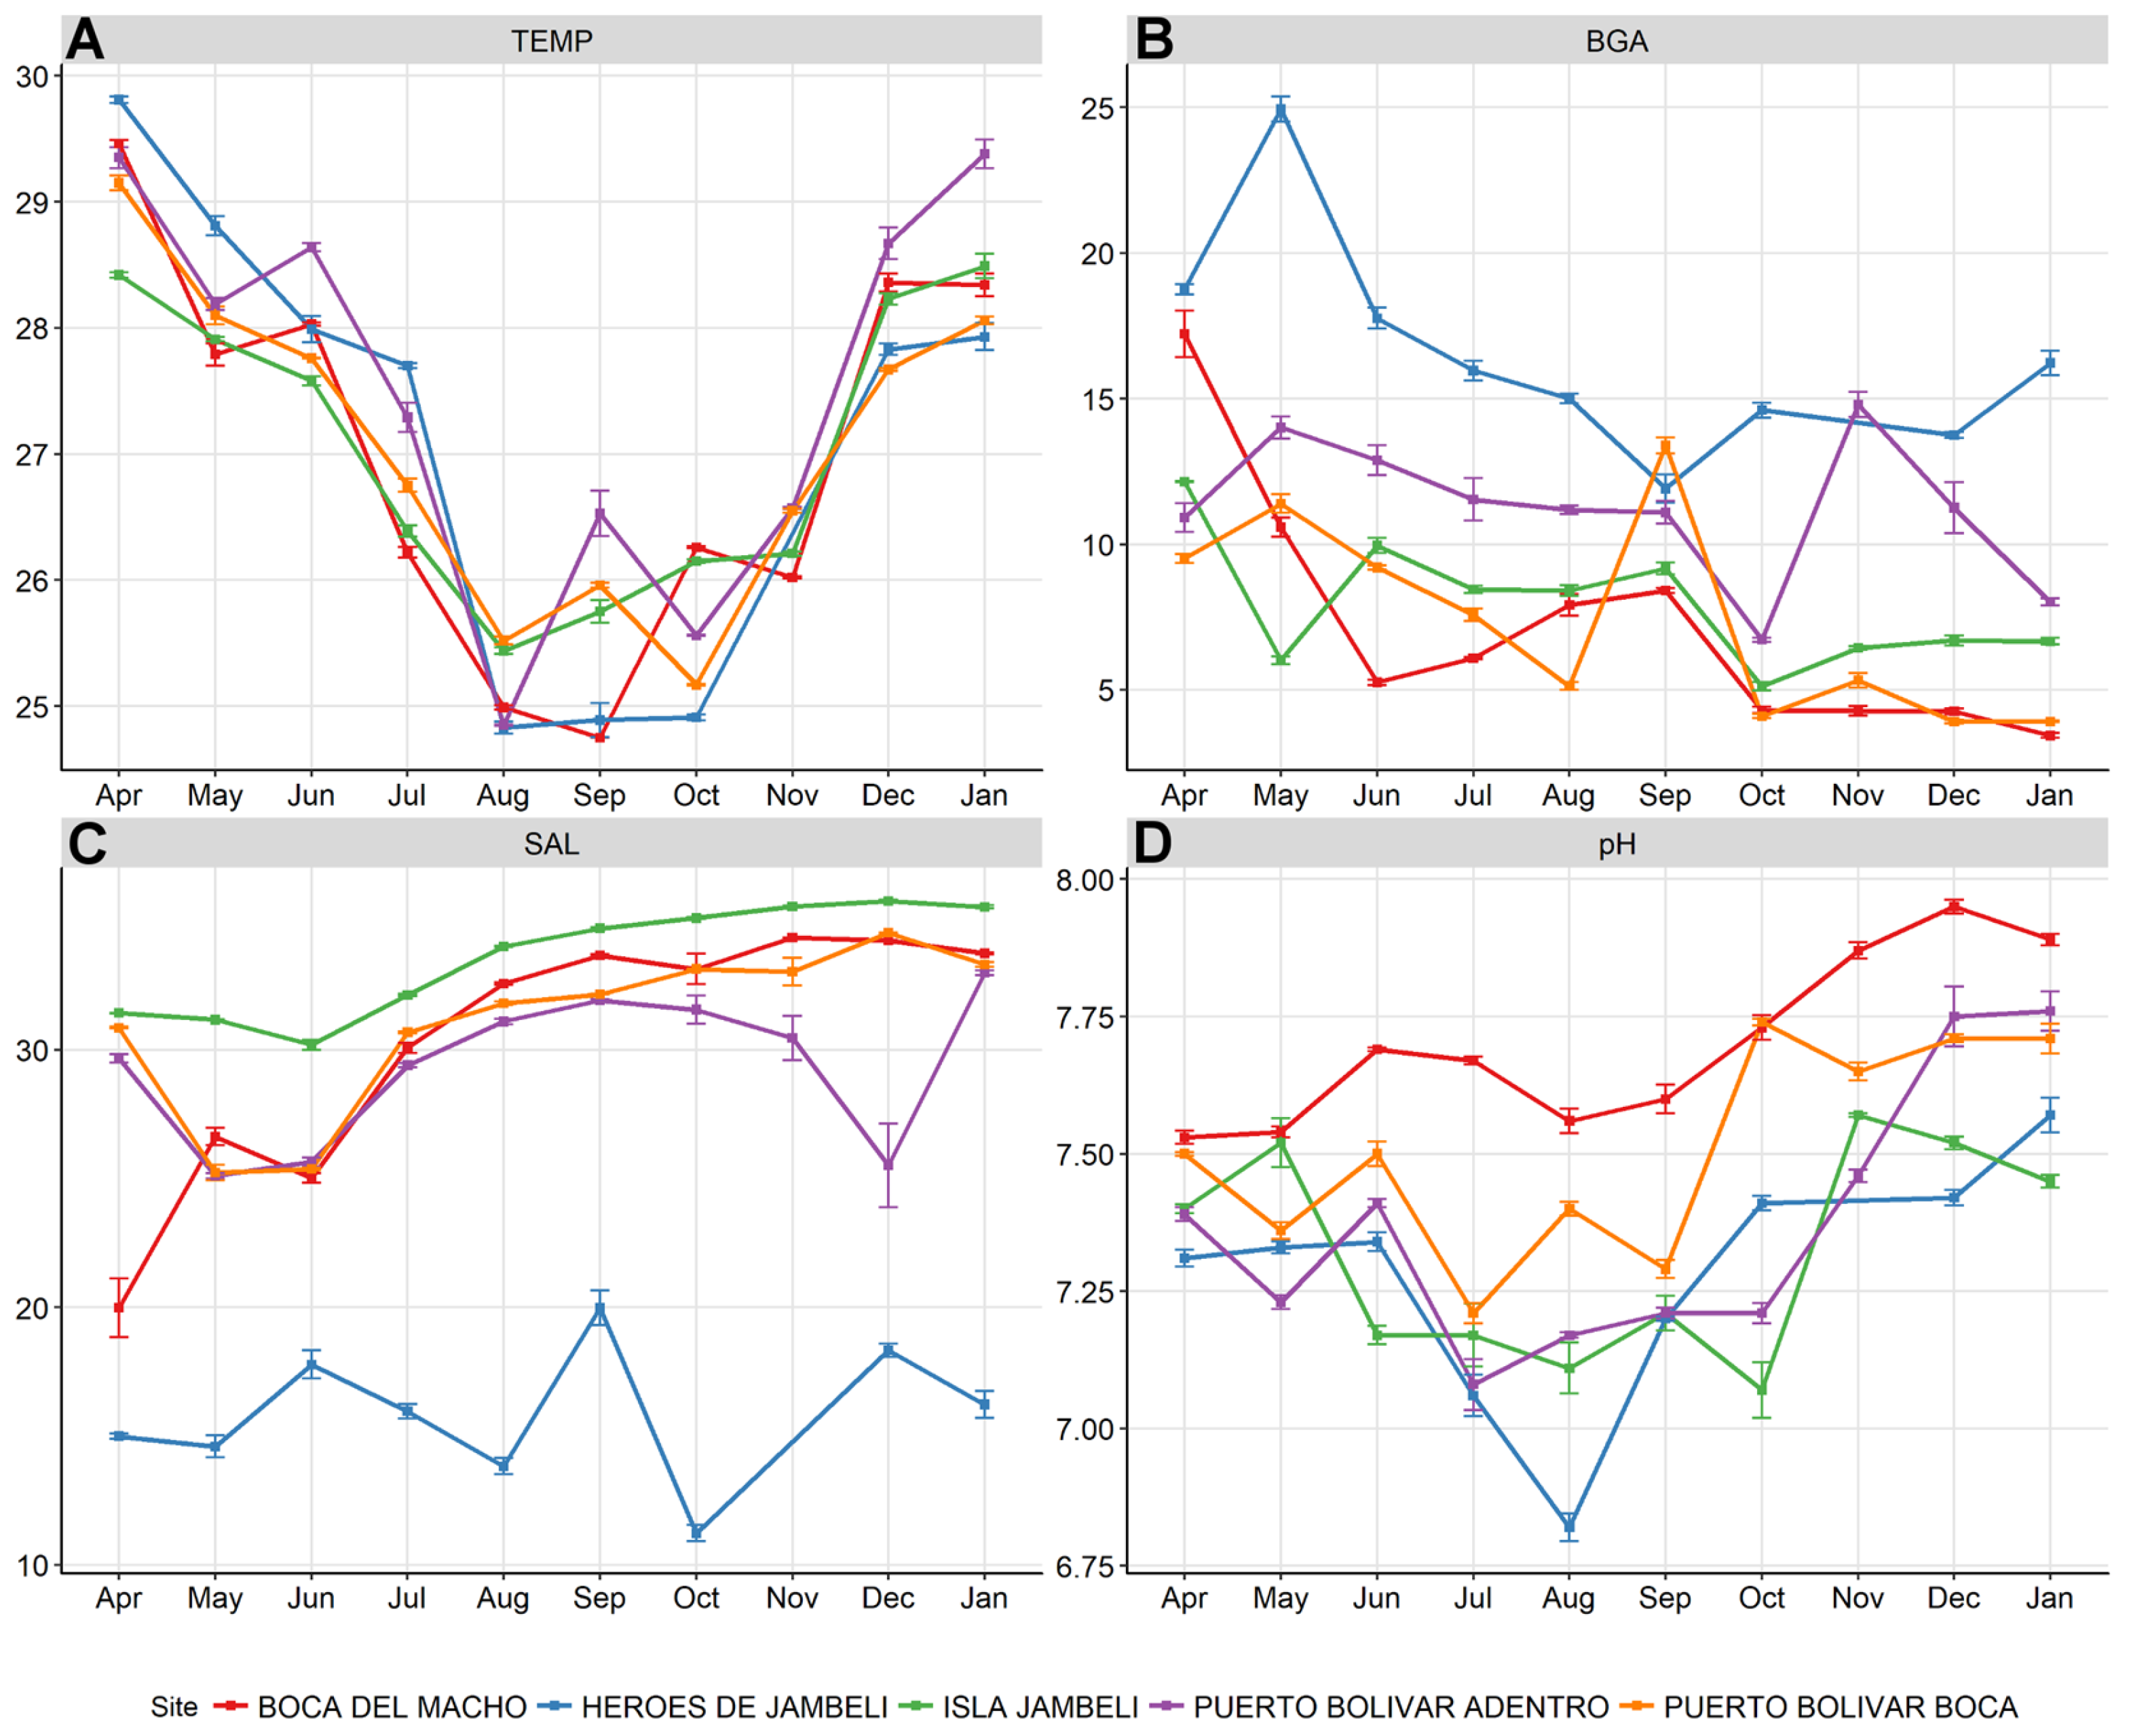
3.1. Water Sample Environmental Measurements

The probe recorded a range of 9–104 readings at each sub-site biweekly for 10 months. All readings were pooled to month for analyses. The sites differed significantly in environmental characteristics (Figure 2), as shown by a series of Kruskal-Wallis rank sum tests (temperature: χ2 = 206.19, df = 4, p < 0.0001; salinity: χ2 = 2257.5, df = 4, p < 0.0001; pH: χ2 = 1347.3, df = 4, p < 0.0001; BGA χ2 = 1824.8, df = 4, p < 0.0001). Héroes de Jambelí, the most inland site, had the highest recorded BGA, and Isla de Jambelí, the most coastal site, had the highest recorded salinity; while there were statistical differences between all sites in all characteristics, there were no clear outliers in pH or temperature.
The sites exhibited significant change in water characteristics across months (Figure 3), as shown by a series of Kruskal-Wallis rank sum tests (Table 2). Temperature was lowest in August for all sites—likely reflecting Pacific upwelling, which cools the water, regardless of air temperature. Salinity at the most inland site, Héroes de Jambelí, was consistently lowest, and showed the smallest change across months, while the other sites had a decrease in salinity in May, then a rise from July–December. Isla de Jambelí had the highest salinity, reflecting its location on the most coastal site. BGA was highest at the most inland site, Héroes de Jambelí, peaking in May, lagging temperature by a month. BGA shows the least temporal or spatial clustered pattern and has no obvious seasonality across the year. Héroes de Jambelí, however, registered the highest BGA values during the study (~25,000). pH appears to peak in December–January across all sites, with a decrease in July–August; the coastal and inland sites showed low pH values across seasons, while Boca del Macho registered consistently high pH values across months.

3.2. Laboratory Analyses

Of a total of 405 individual water samples, collected between May–September, 382 were diagnosed by multiplex PCR. There were 139 (36%) samples positive for V. cholerae, and 243 (64%) that were negative. Both O1 and O139 serogroups of V. cholerae were present in the estuarine system studied in Machala, Ecuador. Serogroup O139 was predominant; 118 (83.5%) samples were O139 and 51 (35.3%) were O1 (30 samples contained both). It was possible to detect V. cholerae during every one of the five months sampled; nevertheless, we found that prevalence decreased sharply in July (Figure 4). Positive and negative controls resulted as we expected. We confirmed the O1 positive strain provided by INSPI, however, we also found that this sample was positive for the ctxA toxigenic gene. By sequencing some randomly-chosen samples, it was confirmed that the PCR protocol applied was appropriate for the detection of V. cholerae serogroup O1 and O139 strains. Results from the toxin subunit A (ctxA) and toxin coregulated pilus (tcpA) analyses were all negative. There was no evidence found for persistent environmental toxigenic V. cholerae in these samples.

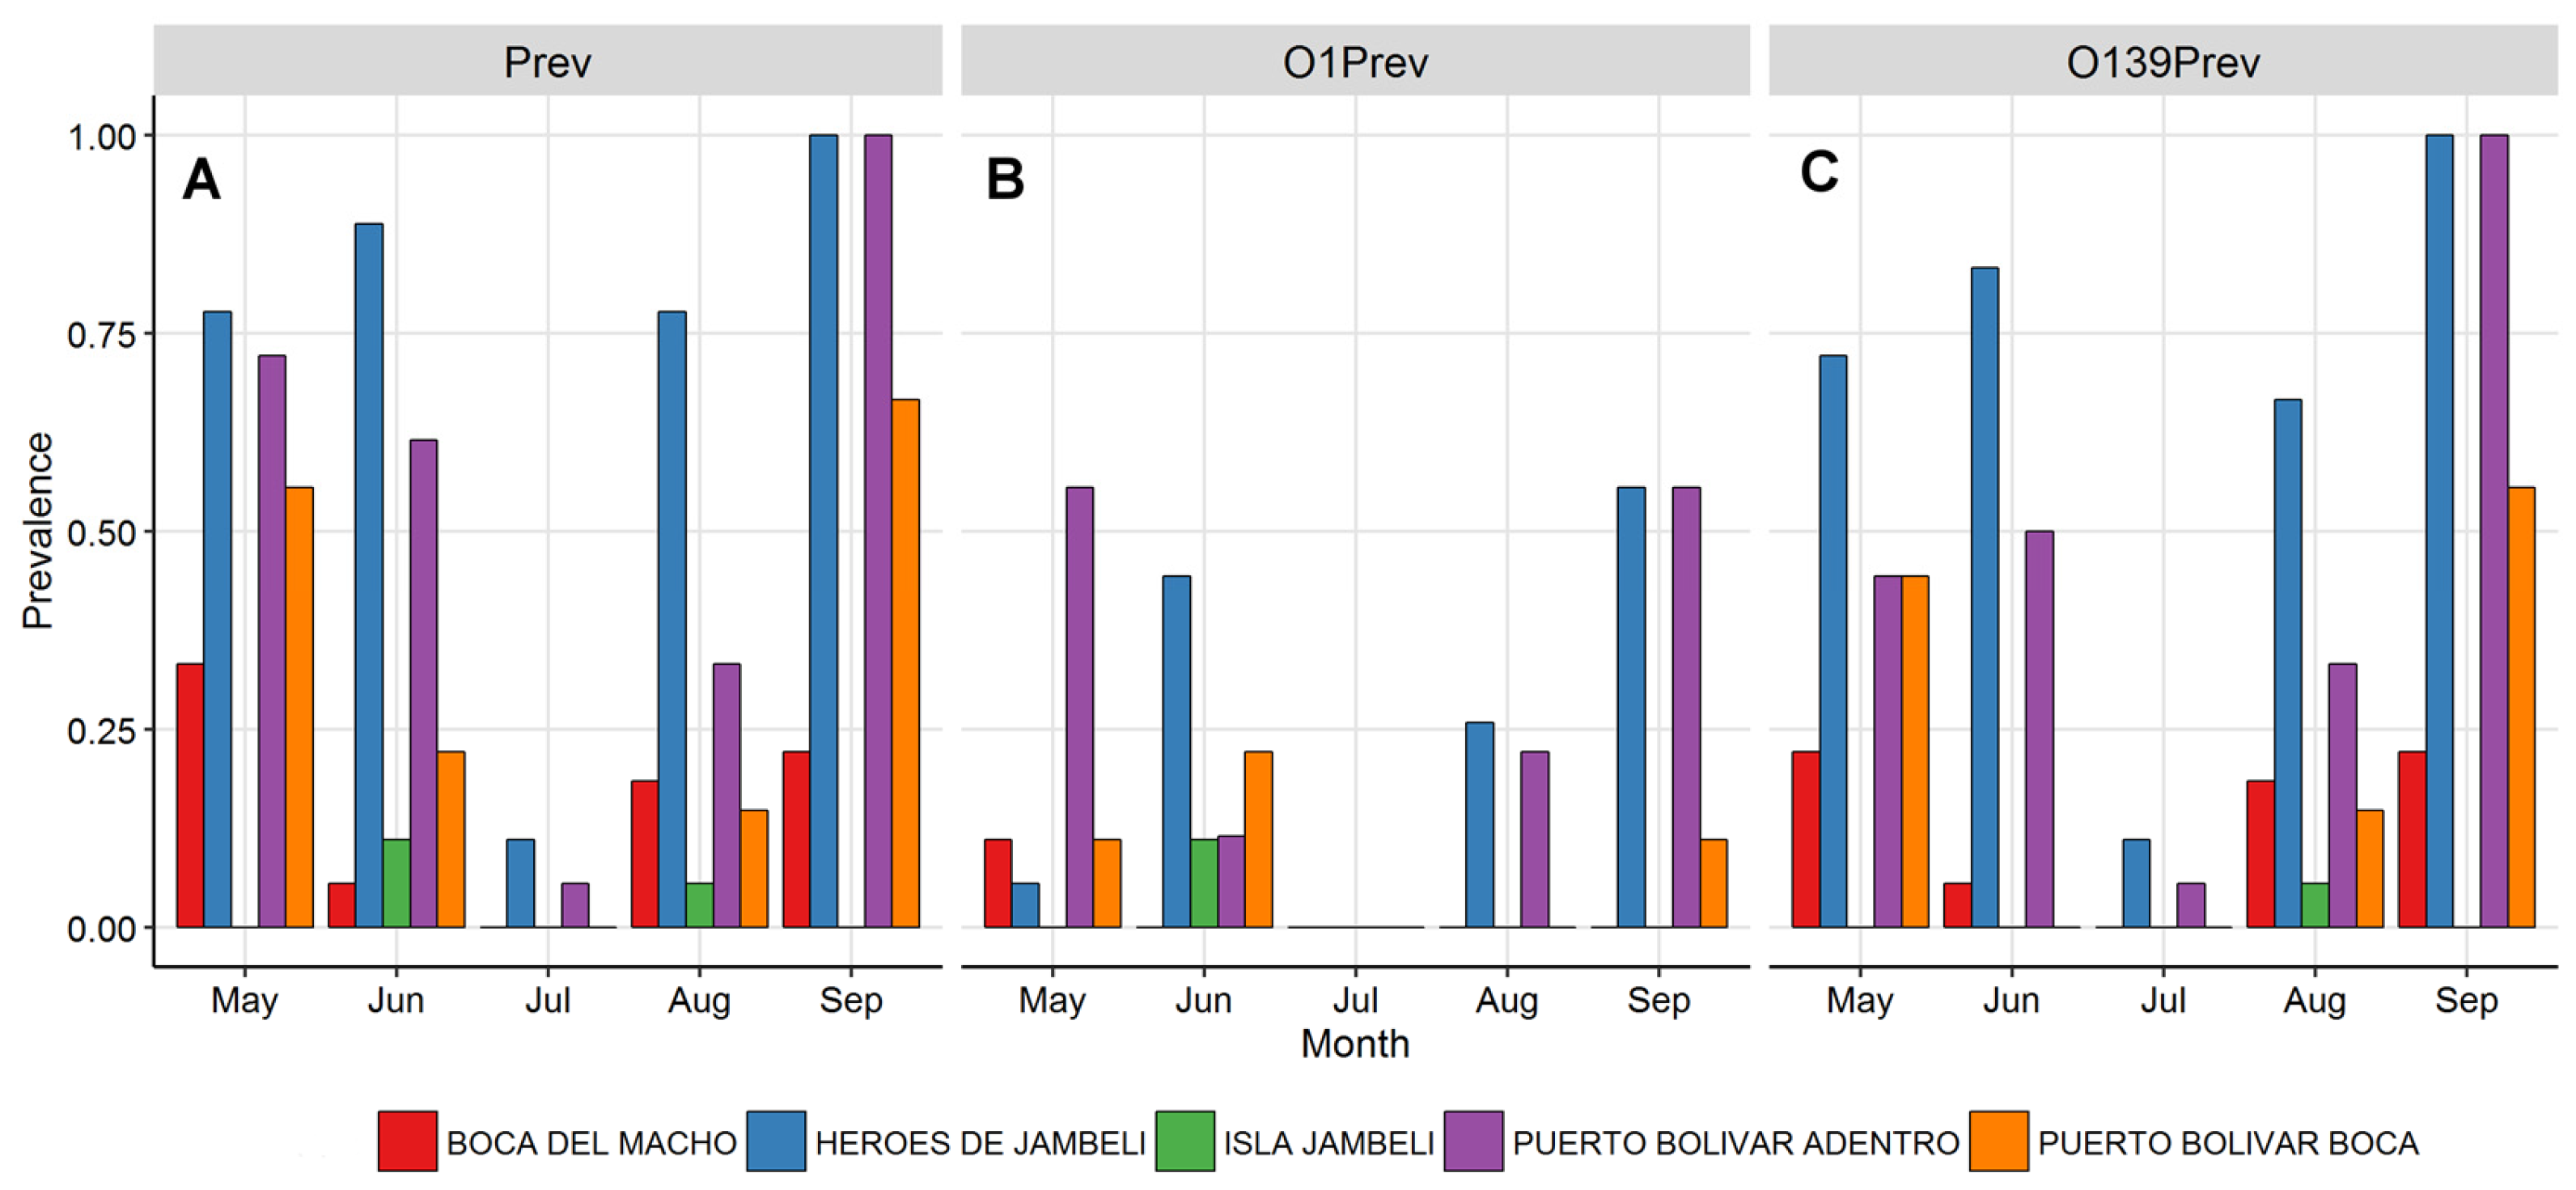
3.3. Vibrio cholerae Prevalence

Water samples were pooled within sites to derive monthly V. cholerae prevalences across and within sites (prevalence = positive/total samples tested). Overall monthly prevalence of V. cholerae ranged from 0.3 (n = 68) in July to 0.58 (n = 45) in September, with site prevalence ranging from 0 to 1, with a mean monthly site prevalence of 0.35 (Figure 4A). Individual strain prevalence was generally higher for O139 than O1, but Puerto Bolívar Adentro and Héroes de Jambelí were V. cholerae positive in every month, and also had higher prevalences than the other sites (Figure 4B,C). When controlling for site differences, we saw a significant association between the environmental variables and all V. cholerae prevalence, but associations only held for temperature, BGA (blue-green algae densities), and pH, for strain O139 alone, and none were significant for the O1 strain. We report fixed effect coefficient estimates, with Wald tests for significance (Table 3).

4. Discussion

Evidence for a persistent environmental reservoir of V. cholerae in the estuarine waters of Machala, Ecuador, in 2014 was found. The presence of V. cholerae, including pandemic strains O1 and O139 was confirmed. Ongoing toxigenic presence cannot be ruled out, but it was not detected in this study. Prior to 1961, epidemics of cholera were associated only with O1 strain, both Classic, and later, El Tor type, with the pathogenic O139 strain appearing in the 1992 pandemic in the Bay of Bengal, arising from genetic exchange with O1 El Tor [6]. Other pathogenic O1 strains are thought to have evolved and emerged independently, such as the U.S. Gulf Coast O1 strain, and the Australian clone [34], and there is evidence that toxigenic strains can arise from nontoxigenic environmental strains [35], including the toxigenic O139 strain. Without further investigation, the ongoing environmental V. cholerae presence in Machala cannot be attributed distinctly to a residual persistent reservoir since 1992, or repeated introduction of environmental strains from ballast water exchange at the port. However, there is persistence of the two strains most commonly associated with epidemics around the world.
The sampling sites exhibited considerable seasonal and spatial heterogeneity in environmental characteristics and V. cholerae prevalence, with clear peaks (and troughs) during specific months. For example, there was peak V. cholerae prevalence in September, with highest values in two sites: Héroes de Jambelí and Puerto Bolívar Adentro (Figure 1). These sites are characterized by low-income housing on the edge of the city, while being inland sites, facing mangroves and shrimp farms. They were found to have V. cholerae present in every month sampled. The lowest V. cholerae prevalence occurred in July, in which only the two most inland sites had detectable V. cholerae. Water temperature had the clearest temporal pattern, falling rapidly through July, likely corresponding to Pacific upwelling, cooling the waters, and increasing nutrients in the system [36]. Unsurprisingly, the lowest salinity was recorded in the most inland site, Héroes de Jambelí, with a higher concentration of BGA than in other sites. This is in contrast to Isla Jambelí, a small island community furthest from the mainland and closest to the ocean, with high salinity due to its coastal location; however, it did not have significantly lower BGA than other sites.
The timing of V. cholerae prevalence was coupled to the measured environmental water characteristics. For example, temperature, BGA, and pH decreased in most sites through July/August, as did the prevalence of V. cholerae, and statistically significant associations were found between prevalence and site- and month-specific temperature, salinity, pH, and BGA. However, we saw that these associations did not hold for both strains of V. cholera—specifically, none of the environmental variables were significantly associated with O1 strain alone, and salinity was no longer significantly associated with O139 strain prevalence when controlling for sites. Average ocean salinity is around 35 ppt, while freshwater rivers average around 0.5 ppt; this estuarine system is a mixed or brackish system, ranging from the lower average of around 15 ppt at the most inland site, to a high approaching 34 ppt at the coastal site. The most inland site represents optimal salinity for V. cholerae growth [37]. There was V. cholerae detected at a range of salinities, revealing an overall negative correlation with increasing salinity, indicating that lower salinity permits a suitable environment for the growth of V. cholerae. However, higher salinities approaching oceanic concentrations do not appear to completely prohibit growth. This finding is consistent with previous work demonstrating the suitability of coastal oceans for V. cholerae [36], but reveals a finer scale relationship with salinity in an estuarine system, up the gradient to fresh water.
Blue-green algal density (BGA, also known as cyanobacteria), are photosynthetic prokaryotes found in freshwater, marine, and terrestrial environments [38]. The photosynthetic pigments of cyanobacteria include chlorophyll-a and the phycobiliproteins phycocyanin and phycoerythrin. Here BGA values were used to characterize water features, and because BGA has previously been associated with V. cholerae persistence [39]. Temperature increase, coupled with high nutrient load, low flow, and thermal stratification, generally results in increased growth rates of cyanobacteria, and its dominance in the phytoplankton community [40,41,42]. This could explain the high BGA values early in the year (Figure 3). In addition, warm temperatures promote increases in the number of days where BGA biomass exceeds warning thresholds established by WHO [40,43]. High temperature also influences water column stability and mixing depth, producing favorable conditions for BGA blooms [44,45]. This association of temperature increase with BGA blooms is consistent across coastal, estuarine, and inland waters [46], illustrating the suitability of tropical estuarine waters for environmental V. cholerae growth and persistence. Long-term monitoring to measure BGA biomass is recommended, and should be considered at a minimum in Héroes de Jambelí and Puerto Bolivar, the sites reporting the highest BGA values (Figure 2). This is particularly important, looking to the future, considering that a rise in water temperature—which we expect with global climate change—is associated with BGA emergence [47,48,49]. Given the strength of association between BGA and V. cholerae presence found in this study, compounded by the impact of temperature and pH, and a link to planktonic associations with environmental bacterial growth, this seems like a useful sentinel for surveillance.
This study was conducted in an average climate year, providing a preliminary framework for monitoring coupled V. cholera—estuarine dynamics for potential emergence of cholera outbreaks in the region. This is a preliminary study, and with limited sample size, precluding larger conclusions or significant predictive power for the future. We note that this sample size may limit our capacity to fully elicit signals in our modeling approach, simply due to low number of V. cholerae findings (particularly O1 strain), within a highly variable system. Due to sample enrichment and multiplex PCR with specific primers sets, our procedure was sensitive to detecting cultivable V. cholerae from estuarine water samples. Nevertheless, for future studies we also suggest performing DNA isolation from viable but non-culturable V. cholerae (VBNC) directly from water samples. Moreover, we suggest that analysis of cholera incidence associated with plankton is also key to estimate the prevalence of the vibrio and its toxigenic genes. As the first study of this type in the region, and as a prototype for small-scale epidemic surveillance platforms, evidence is provided of the presence of these persistent environmental V. cholerae strains, and of the capacity to conduct such monitoring. This is particularly useful baseline information for anticipating El Niño years, extreme climate events associated with warming temperatures of surface ocean water, and increased rainfall and flooding events. In the year following the study, an El Niño year, there was severe urban flooding throughout Machala. Climate change projections indicate that the frequency of extreme El Niño events will increase in the future [14], increasing the risk of water-borne diseases endemic in the region, such as cholera, typhoid, and leptospirosis. This study provides valuable information, and our recommendation is to add V. cholerae back into the public health agenda, to consider infectious diseases beyond the already important vector-borne diseases, such as dengue fever, chikungunya, zika, and malaria.
Indeed, in May 2016, two years after the initiation of this study, a case of cholera was reported in Machala, after approximately 12 years with no case reports in Ecuador [50]. An immuno-compromised individual was confirmed positive for V. cholerae serotype O1 non-toxigenic, by the National Public Health Research Institute of the Ministry of Health. Coauthors on this study diagnosed the patient using the same PCR assays described here, as the only lab in the region with this capacity. Although the source of the infection was not confirmed, this study report suggests a worrisome link to environmental transmission, underscoring the importance of our results.

5. Conclusions

This study highlights the urgency for active epidemiological and environmental waterborne pathogen surveys and the need for public health interventions to reduce the risk of water-borne pathogen transmission in this vulnerable population. The community Héroes de Jambelí is a low-income peri-urban settlement with less than 50 families, established informally in 2002. The community continues to lack adequate access to piped water, sewerage, and garbage collection due to their status as an illegal settlement. Simple bamboo homes have been built over the mangrove system, with direct discharge of wastewater into the estuary. At the same time, this community’s livelihood depends on artisanal fisheries (e.g., crabs, mollusks) from these same estuaries. Given the findings of environmental V. cholerae across the whole gradient of estuarine surface water, the full socio-economic spectrum of this port city is at risk. This vulnerable coupled human-natural system results in a high potential risk of emerging epidemics from water-borne pathogens. Furthermore, limited in sample size and duration, this study serves as a baseline from which to build, and draws attention to the gaps in surveillance in a region that has previously sourced pandemic cholera, and could again.

Acknowledgments

We would like to thank the citizens and authorities of Machala, Ecuador, for their continued support of our research infectious diseases epidemiology and monitoring. We thank Carlos Enriquez for his hard work in the field. This project was supported under a grant from DOD-GEIS P0435_14_UN.

Author Contributions

Sadie J. Ryan, Anna M. Stewart-Ibarra, Julia L. Finkelstein, Christine A. King, and Mark Polhemus designed the study; Eunice Ordóñez-Enireb, Washington B. Cárdenas, Christina Lupone, and Christine A. King, developed the protocols and conducted diagnostics; Winnie Chu, Froilan Heras, Erica Tauzer, and Egan Waggoner conducted water sampling and data recording; and Sadie J. Ryan, Anna M. Stewart-Ibarra, Luis E. Escobar, and Tyler G. James conducted statistical analyses. All authors contributed to writing and editing of the manuscript.

Conflicts of Interest

The authors declare no conflict of interest.

References

  1. WHO. Cholera Annual Report. Wkly. Epidemiol. Rec. 2013, 88, 321–336. [Google Scholar]
  2. Ali, M.; Nelson, A.R.; Lopez, A.L.; Sack, D.A. Updated global burden of cholera in endemic countries. PLoS Negl. Trop. Dis. 2015, 9, E0003832. [Google Scholar] [CrossRef] [PubMed]
  3. Jutla, A.S.; Akanda, A.S.; Islam, S. Tracking Cholera in Coastal Regions Using Satellite Observations1. J. Am. Water Resour. Assoc. 2010, 46, 651–662. [Google Scholar] [CrossRef] [PubMed]
  4. Jutla, A.; Akanda, A.S.; Huq, A.; Faruque, A.S.G.; Colwell, R.R.; Islam, S. A water marker monitored by satellites to predict seasonal endemic cholera. Remote Sens. Lett. 2013, 4, 822–831. [Google Scholar] [CrossRef] [PubMed]
  5. Islam, M.S.; Islam, M.S.; Mahmud, Z.H.; Cairncross, S.; Clemens, J.D.; Collins, A.E. Role of phytoplankton in maintaining endemicity and seasonality of cholera in Bangladesh. Trans. R. Soc. Trop. Med. Hyg. 2015, 109, 572–578. [Google Scholar] [CrossRef] [PubMed]
  6. Lipp, E.K.; Huq, A.; Colwell, R.R. Effects of global climate on infectious disease: The cholera model. Clin. Microbiol. Rev. 2002, 15, 757–770. [Google Scholar] [CrossRef] [PubMed]
  7. Escobar, L.E.; Ryan, S.J.; Stewart-Ibarra, A.M.; Finkelstein, J.L.; King, C.A.; Qiao, H.; Polhemus, M.E. A global map of suitability for coastal Vibrio cholerae under current and future climate conditions. Acta Trop. 2015, 149, 202–211. [Google Scholar] [CrossRef] [PubMed]
  8. Chowdhury, F.R.; Nur, Z.; Hassan, N.; von Seidlein, L.; Dunachie, S. Pandemics, pathogenicity and changing molecular epidemiology of cholera in the era of global warming. Ann. Clin. Microbiol. Antimicrob. 2017, 16, 10. [Google Scholar] [CrossRef] [PubMed]
  9. Hallegatte, S.; Green, C.; Nicholls, R.J.; Corfee-Morlot, J. Future flood losses in major coastal cities. Nat. Clim. Chang. 2013, 3, 802–806. [Google Scholar] [CrossRef]
  10. Hanson, S.; Nicholls, R.; Ranger, N.; Hallegatte, S.; Corfee-Morlot, J.; Herweijer, C.; Chateau, J. A global ranking of port cities with high exposure to climate extremes. Clim. Chang. 2011, 104, 89–111. [Google Scholar] [CrossRef] [Green Version]
  11. De Sherbinin, A.; Schiller, A.; Pulsipher, A. The vulnerability of global cities to climate hazards. Environ. Urban. 2007, 19, 39–64. [Google Scholar] [CrossRef]
  12. Dixon, T.H.; Amelung, F.; Ferretti, A.; Novali, F.; Rocca, F.; Dokka, R.; Sella, G.; Kim, S.-W.; Wdowinski, S.; Whitman, D. Space geodesy: Subsidence and flooding in New Orleans. Nature 2006, 441, 587–588. [Google Scholar] [CrossRef] [PubMed]
  13. Nicholls, R.J. Coastal megacities and climate change. GeoJournal 1995, 37, 369–379. [Google Scholar] [CrossRef]
  14. Cai, W.; Borlace, S.; Lengaigne, M.; Van Rensch, P.; Collins, M.; Vecchi, G.; Timmermann, A.; Santoso, A.; McPhaden, M.J.; Wu, L.; et al. Increasing frequency of extreme El Niño events due to greenhouse warming. Nat. Clim. Chang. 2014, 4, 111–116. [Google Scholar] [CrossRef] [Green Version]
  15. Colwell, R.R. Infectious disease and environment: Cholera as a paradigm for waterborne disease. Int. Microbiol. 2004, 7, 285–289. [Google Scholar] [PubMed]
  16. Colwell, R.R.; Huq, A. Environmental reservoir of Vibrio cholerae the causative agent of cholera. Ann. N. Y. Acad. Sci. 1994, 740, 44–54. [Google Scholar] [CrossRef] [PubMed]
  17. Mutreja, A.; Kim, D.W.; Thomson, N.R.; Connor, T.R.; Lee, J.H.; Kariuki, S.; Croucher, N.J.; Choi, S.Y.; Harris, S.R.; Lebens, M.; et al. Evidence for several waves of global transmission in the seventh cholera pandemic. Nature 2011, 477, 462–465. [Google Scholar] [CrossRef] [PubMed]
  18. Colwell, R.R. Global climate and infectious disease: The cholera paradigm. Science 1996, 274, 2025–2031. [Google Scholar] [CrossRef] [PubMed]
  19. Vezzulli, L.; Pruzzo, C.; Huq, A.; Colwell, R.R. Environmental reservoirs of Vibrio cholerae and their role in cholera. Environ. Microbiol. Rep. 2010, 2, 27–33. [Google Scholar] [CrossRef] [PubMed]
  20. Rossel, F.; Cadier, E.; Gómez, G. Las inundaciones en la zona costera ecuatoriana: Causas—Obras de protección existentes y previstas. Bull. Inst. Fr. Ét. Andines 1996, 25, 399–420. [Google Scholar]
  21. Rossel, F.; Cadier, E. El Niño and prediction of anomalous monthly rainfalls in Ecuador. Hydrol. Process. 2009, 23, 3253–3260. [Google Scholar] [CrossRef]
  22. Lacey, S.W. Cholera: Calamitous past, ominous future. Clin. Infect. Dis. 1995, 20, 1409–1419. [Google Scholar] [CrossRef] [PubMed]
  23. Malavade, S.S.; Narvaez, A.; Mitra, A.; Ochoa, T.; Naik, E.; Sharma, M.; Galwankar, S.; Breglia, M.; Izurieta, R. Cholera in Ecuador: Current relevance of past lessons learnt. J. Glob. Infect. Dis. 2011, 3, 189–194. [Google Scholar] [PubMed]
  24. Swerdlow, D.L.; Mintz, E.D.; Rodriguez, M.; Tejada, E.; Ocampo, C.; Espejo, L.; Barrett, T.J.; Petzelt, J.; Bean, N.H.; Seminario, L.; et al. Severe life-threatening cholera associated with blood group 0 in Peru: Implications for the Latin American epidemic. J. Infect. Dis. 1994, 170, 468–472. [Google Scholar] [CrossRef] [PubMed]
  25. Nelson, E.J.; Harris, J.B.; Morris, J.G.; Calderwood, S.B.; Camilli, A. Cholera transmission: The host, pathogen and bacteriophage dynamic. Nat. Rev. Microbiol. 2009, 7, 693–702. [Google Scholar] [CrossRef] [PubMed]
  26. Zuckerman, J.N.; Rombo, L.; Fisch, A. The true burden and risk of cholera: Implications for prevention and control. Lancet Infect. Dis. 2007, 7, 521–530. [Google Scholar] [CrossRef]
  27. WHO. Cholera Unveiled; Global Task Force on Cholera Control, World Health Organization: Geneva, Switzerland, 2003. [Google Scholar]
  28. Sedas, V.T.P. Influence of environmental factors on the presence of Vibrio cholerae in the marine environment: A climate link. J. Infect. Dev. Ctries. 2007, 1, 224–241. [Google Scholar] [PubMed]
  29. Akanda, A.S.; Jutla, A.S.; Gute, D.M.; Sack, R.B.; Alam, M.; Huq, A.; Colwell, R.R.; Islam, S. Population vulnerability to biannual cholera outbreaks and associated macro-scale drivers in the Bengal delta. Am. J. Trop. Med. Hyg. 2013, 89, 950–959. [Google Scholar] [CrossRef] [PubMed]
  30. Hoshino, K.; Yamasaki, S.; Mukhopadhyay, A.K.; Chakraborty, S.; Basu, A.; Bhattacharya, S.K.; Nair, G.B.; Shimada, T.; Takeda, Y. Development and evaluation of a multiplex PCR assay for rapid detection of toxigenic Vibrio cholerae O1 and O139. FEMS Immunol. Med. Microbiol. 1998, 20, 201–207. [Google Scholar] [CrossRef] [PubMed]
  31. Kumar, P.; Peter, W.A.; Thomas, S. Rapid detection of virulence-associated genes in environmental strains of Vibrio cholerae by multiplex PCR. Curr. Microbiol. 2010, 60, 199–202. [Google Scholar] [CrossRef] [PubMed]
  32. Singh, D.V.; Isac, S.R.; Colwell, R.R. Development of a hexaplex PCR assay for rapid detection of virulence and regulatory genes in Vibrio cholerae and Vibrio mimicus. J. Clin. Microbiol. 2002, 40, 4321–43224. [Google Scholar] [CrossRef] [PubMed]
  33. Bates, D.; Maechler, M.; Bolker, B.M. lme4: Linear Mixed-Effects Models Using S4 Classes (R Package Version 0.99999-0). 2012. Available online: http://cran.r-project.org/package=lme4 (accessed on 29 January 2018).
  34. Faruque, S.M.; Ahmed, K.M.; Abdul, A.R.A.; Qadri, F.; Siddique, A.K.; Albert, M.J. Emergence of a new clone of toxigenic Vibrio cholerae O1 biotype ElTor displacing V. cholerae O139 Bengal in Bangladesh. J. Clin. Microbiol. 1997, 35, 624–630. [Google Scholar] [PubMed]
  35. Jiang, S.C.; Matte, M.; Matte, G.; Huq, A.; Colwell, R.R. Genetic diversity of clinical and environmental isolates of Vibrio cholerae determined by amplified fragment length polymorphism fingerprinting. Appl. Environ. Microbiol. 2000, 66, 148–153. [Google Scholar] [CrossRef] [PubMed]
  36. Strutton, P.G.; Ryan, J.P.; Chavez, F.P. Enhanced chlorophyll associated with tropical instability waves in the equatorial Pacific. Geophys. Res. Lett. 2001, 28, 2005–2008. [Google Scholar] [CrossRef]
  37. Montilla, R.; Chowdhury, M.; Huq, A.; Xu, B.; Colwell, R.R. Serogroup conversion of Vibrio cholerae non-O1 to Vibrio cholerae O1: Effect of growth state of cells, temperature, and salinity. Can. J. Microbiol. 1996, 42, 87–93. [Google Scholar] [CrossRef] [PubMed]
  38. Stanier, R.; Bazine, G. Phototrophic prokaryotes: The cyanobacteria. Annu. Rev. Microbiol. 1977, 31, 225–274. [Google Scholar] [CrossRef] [PubMed]
  39. Epstein, P.R. Algal blooms in the spread and persistence of cholera. Biosystems 1993, 31, 209–221. [Google Scholar] [CrossRef]
  40. Davis, T.W.; Berry, D.L.; Boyer, G.L.; Gobler, C.J. The effects of temperature and nutrients on the growth and dynamics of toxic and non-toxic strains of Microcystis during cyanobacteria blooms. Harmful Algae 2009, 8, 715–725. [Google Scholar] [CrossRef]
  41. Elliott, J. The seasonal sensitivity of cyanobacteria and other phytoplankton to changes in flushing rate and water temperature. Glob. Chang. Biol. 2010, 16, 864–876. [Google Scholar] [CrossRef]
  42. Huber, V.; Wagner, C.; Gerten, D.; Adrian, R. To bloom or not to bloom: Contrasting responses of cyanobacteria to recent heat waves explained by critical thresholds of abiotic drivers. Oecologia 2012, 169, 245–256. [Google Scholar] [CrossRef] [PubMed]
  43. Elliott, A. Predicting the impact of changing nutrient load and temperature on the phytoplankton of England’s largest lake, Windermere. Freshw. Biol. 2012, 57, 400–413. [Google Scholar] [CrossRef] [Green Version]
  44. Robarts, R.D.; Zohary, T. Temperature effects on photosynthetic capacity, respiration, and growth rates of bloom-forming cyanobacteria. N. Z. J. Mar. Freshw. Res. 1987, 21, 391–399. [Google Scholar] [CrossRef]
  45. Stal, L.J.; Albertano, P.; Bergman, B.; von Bröckel, K.; Gallon, J.R.; Hayes, P.K.; Sivonen, K.; Walsby, A.E. BASIC: Baltic Sea cyanobacteria. An investigation of the structure and dynamics of water blooms of cyanobacteria in the Baltic Sea—responses to a changing environment. Cont. Shelf Res. 2003, 23, 1695–1714. [Google Scholar] [CrossRef]
  46. Paerl, H.W. Nuisance phytoplankton blooms in coastal, estuarine, and inland waters. Limnol. Oceanogr. 1988, 33, 823–843. [Google Scholar] [CrossRef]
  47. Kanoshina, I.; Lips, U.; Leppänen, J.-M. The influence of weather conditions (temperature and wind) on cyanobacterial bloom development in the Gulf of Finland (Baltic Sea). Harmful Algae 2003, 2, 29–41. [Google Scholar] [CrossRef]
  48. Suikkanen, S.; Laamanen, M.; Huttunen, M. Long-term changes in summer phytoplankton communities of the open northern Baltic Sea. Estuar. Coast. Shelf Sci. 2007, 71, 580–592. [Google Scholar] [CrossRef]
  49. Wasmund, N. Occurrence of cyanobacterial blooms in the Baltic Sea in relation to environmental conditions. Int. Rev. Gesamten. Hydrobiol. Hydrogr. 1997, 82, 169–184. [Google Scholar] [CrossRef]
  50. Pan American Health Organization/World Health Organization. Epidemiological Update: Cholera; PAHO/WHO: Washington, DC, USA, 2016. [Google Scholar]
Figure 1. Location of sampling sites. (A) Ecuador (in yellow) in South America, indicating the location of Machala (red point); (B) the location of Machala on the southern coast of Ecuador (red point); and (C) the location of the five sampling sites: Isla Jambelí, Boca del Macho, Puerto Bolívar Boca, Puerto Bolívar Adentro, and Héroes de Jambelí (red points), in and around Machala (green).
Ijerph 15 00486 g001
Figure 2. Water characteristics by site (means and standard errors temperature (TEMP, °C), salinity (SAL), pH, and measured total concentration of blue-green algae (BGA, cells/µL).
Ijerph 15 00486 g002
Figure 3. Environmental features in the study period. Water characteristics by month (means and standard errors) and sites: (A) temperature (TEMP, °C); (B) salinity (SAL); (C) measured total concentration of blue-green algae (BGA, cells/µL); and (D) pH.
Ijerph 15 00486 g003
Figure 4. Vibrio cholerae detection. Monthly site prevalence of (A) Vibrio cholerae as given by positive PCR test; (B) O1 strain; and (C) O139 strain.
Ijerph 15 00486 g004
Table 1. PCR primers set used in this study.
SetPrimerSequenceProductReference
1O1F2-1GTT TCA CTG AAC AGA TGG G192 bpHoshino et al. [30]
O1R2-2CGG TCA TCT GTA AGT ACA AC
2O139F2AGC CTC TTT ATT ACG GGT GG449 bp
O139R2GTC AAA CCC GAT CGT AAA GG
3tcpA-FATG CAA TTA TTA AAA CAG CTT TTT AAG675 bpKumar et al. [31]
tcpA-RTTA GCT GTT ACC AAA TGC AAC AG
4ctxA-FCGG GCA GAT TCT AGA CCT CCT G564 bpSingh et al. [32]
ctxA-RCGA TGA TCT TGG AGC ATT CCC AC
Table 2. Kruskal-Wallis rank sum tests for each site and environmental variable by month.
Environmental VariableSiteχ2DFp-Value
TemperatureBoca de Macho832.659<0.0001
Héroes de Jambelí643.858<0.0001
Isla de Jambelí622.859<0.0001
Puerto Bolívar Adentro445.999<0.0001
Puerto Bolívar Boca625.449<0.0001
Salinity
Boca de Macho837.169<0.0001
Héroes de Jambelí230.178<0.0001
Isla de Jambelí671.419<0.0001
Puerto Bolívar Adentro464.859<0.0001
Puerto Bolívar Boca619.219<0.0001
pH
Boca de Macho534.39<0.0001
Héroes de Jambelí431.668<0.0001
Isla de Jambelí245.919<0.0001
Puerto Bolívar Adentro378.539<0.0001
Puerto Bolívar Boca416.769<0.0001
BGA
Boca de Macho650.849<0.0001
Héroes de Jambelí309.28<0.0001
Isla de Jambelí469.759<0.0001
Puerto Bolívar Adentro219.789<0.0001
Puerto Bolívar Boca519.819<0.0001
DF = degrees of freedom.
Table 3. Fixed effects coefficient statistics for associations between prevalence of Vibrio cholerae and each strain separately, and environmental variables, when controlling for site effects.
Environmental VariablePrevalenceEstimate (SE)zp-Value
TemperatureV. cholerae−0.60 (0.19)−3.200.001
Strain O1 −0.21 (0.22)−0.930.35
Strain O139−0.68 (0.19)−3.67<0.001
SalinityV. cholerae−0.13 (0.06)−2.270.02
Strain O1 −0.10 (0.07)−1.470.14
Strain O139−0.09 (0.06)−1.450.15
pHV. cholerae3.45 (1.33)2.600.01
Strain O1 1.14 (1.65)0.680.49
Strain O1393.86 (1.35)2.860.004
BGAV. cholerae0.27 (0.06)4.24<0.0001
Strain O1 0.005 (0.07)0.070.94
Strain O1390.23 (0.06)3.70<0.0001

