How Long Are Cancer Patients Waiting for Oncological Therapy in Poland?


Abstract
:1. Introduction
2. Materials and Methods
Statistical Analysis
3. Results
4. Discussion
5. Conclusions
Acknowledgments
Author Contributions
Conflicts of Interest
References
- Didkowska, J.; Wojciechowska, U.; Zatonski, W. Malignant Neoplasms in Poland in 2011; Centrum Onkologii–Instytut im. M. Skłodowskiej–Curie: Warsaw, Poland, 2013. [Google Scholar]
- Kalbarczyk, W.P.; Gujski, M.; Brzozowski, S.; Tytko, Z.; Scibek, A. Walka z Nowotworami i Opieka Onkologiczna w Polsce Wobec Wyzwań Demograficznych i Epidemiologicznych—Propozycje Rozwiązań; Instytut Ochrony Zdrowia: Warsaw, Poland, 2015. [Google Scholar]
- Wojtyniak, B.; Gorynski, P.; Moskalewicz, B. Sytuacja Zdrowotna Ludności Polski i jej Uwarunkowania; Narodowy Instytut Zdrowia Publicznego—Państwowy Zakład Higieny: Warsaw, Poland, 2012.
- De Angelis, R.; Sant, M.; Coleman, M.P.; Francisci, S.; Baili, P.; Pierannunzio, D.; Trama, A.; Visser, O.; Brenner, H.; Ardanaz, E.; et al. Cancer survival in Europe 1999–2007 by country and age: Results of EUROCARE—5-a population-based study. Lancet Oncol. 2014, 15, 23–34. [Google Scholar] [CrossRef]
- Ogranisation for Economic Co-operation and Development (OECD). OECD Economic Surveys; OECD: Paris, France, 2012. [Google Scholar]
- Systemy Opieki Onkologicznej w Wybranych Krajach. Available online: https://www.google.ch/url?sa=t&rct=j&q=&esrc=s&source=web&cd=1&cad=rja&uact=8&ved=0ahUKEwiS6IONw4HaAhVBr6QKHSluAWEQFggnMAA&url=http%3A%2F%2Fwww.ey.com%2FPublication%2FvwLUAssets%2FRaport_EY%2F%24FILE%2FRaport_system_opieki_onkologicznej_2014.pdf&usg=AOvVaw05ymwYQawmLxmvvPIAo7es (accessed on 22 March 2018).
- Buchholz, T.A.; Austin-Seymour, M.M.; Moe, R.E.; Ellis, G.K.; Livingston, R.B.; Pelton, J.G.; Griffin, T.W. Effect of delay in radiation in combined modality treatment of breast cancer. Int. J. Radiat. Oncol. Biol. Phys. 1993, 26, 23–35. [Google Scholar] [CrossRef]
- Chen, Z.; King, W.; Pearcey, R.; Kerba, M.; Mackillop, W.J. The relationship between waiting time for radiotherapy and clinical outcomes: A systematic review of the literature. Radiother. Oncol. 2008, 87, 3–16. [Google Scholar] [CrossRef] [PubMed]
- Choan, E.; Dahrouge, S.; Samant, R.; Mirzaei, A.; Price, J. Radical radiotherapy for cervix cancer: The effect of waiting time on outcome. Int. J. Radiat. Oncol. Biol. Phys. 2005, 61, 1071–1077. [Google Scholar]
- Do, V.; Gebski, V.; Barton, M.B. The effect of waiting for radiotherapy for grade III/IV gliomas. Radiother. Oncol. 2000, 57, 131–136. [Google Scholar] [CrossRef]
- Montella, M.; Crispo, A.; Botti, G.; De Marco, M.; de Bellis, G.; Fabbrocini, G.; Pizzorusso, M.; Tamburini, M.; D’Aiuto, G. An assessment of delays in obtaining definitive breast cancer treatment in Southern Italy. Breast Cancer Res. Treat. 2001, 66, 209–215. [Google Scholar] [CrossRef] [PubMed]
- Murray, N.; Coy, P.; Pater, J.L.; Hodson, I.; Arnold, A.; Zee, B.C.; Payne, D.; Kostashuk, E.C.; Evans, W.K.; Dixon, P.; et al. Importance of timing for thoracic irradiation in the combined modality treatment of limited-stage small-cell lung cancer. The National Cancer Institute of Canada Clinical Trials Group. J. Clin. Oncol. 1993, 11, 336–344. [Google Scholar] [CrossRef] [PubMed]
- Richards, M.A.; Westcombe, A.M.; Love, S.B.; Littlejohns, P.; Ramirez, A.J. Influence of delay on survival in patients with breast cancer: A systematic review. Lancet 1999, 353, 1119–1126. [Google Scholar] [CrossRef]
- Van Harten, M.C.; Hoebers, F.J.P.; Kross, K.W.; van Werkhoven, E.D.; van den Brekel, M.W.M.; van Dijk, B.A.C. Determinants of treatment waiting times for head and neck cancer in the Netherlands and their relation to survival. Oral Oncol. 2015, 51, 272–278. [Google Scholar] [CrossRef] [PubMed]
- Barton, M.B.; Morgan, G.; Smee, R.; Tiver, K.W.; Hamilton, C.; Gebski, V. Does waiting time affect the outcome of larynx cancer treated by radiotherapy? Radiother. Oncol. 1997, 44, 137–141. [Google Scholar] [CrossRef]
- Bozcuk, H.; Martin, C. Does treatment delay affect survival in non-small cell lung cancer? A retrospective analysis from a single UK centre. Lung Cancer 2001, 34, 243–252. [Google Scholar] [CrossRef]
- Brouha, X.D.; Op De Coul, B.; Terhaard, C.H.; Hordijk, G.J. Does waiting time for radiotherapy affect local control of T1N0M0 glottic laryngeal carcinoma? Clin. Otolaryngol. Allied Sci. 2000, 25, 215–218. [Google Scholar] [CrossRef] [PubMed]
- Froud, P.J.; Mates, D.; Jackson, J.S.; Phillips, N.; Andersen, S.; Jackson, S.M.; Bryce, C.J.; Olivotto, I.A. Effect of time interval between breast-conserving surgery and radiation therapy on ipsilateral breast recurrence. Int. J. Radiat. Oncol. Biol. Phys. 2000, 46, 363–372. [Google Scholar] [CrossRef]
- Lee, A.W.; Chan, D.K.; Fowler, J.F.; Poon, Y.F.; Law, S.C.; Foo, W.; O, S.K.; Tung, S.Y.; Cheung, F.K.; Ho, J.H.; et al. T1 nasopharyngeal carcinoma: The effect of waiting time on tumor control. Int. J. Radiat. Oncol. Biol. Phys. 1994, 30, 1111–1117. [Google Scholar] [CrossRef]
- Murchie, P.; Raja, E.A.; Lee, A.J.; Brewster, D.H.; Campbell, N.C.; Gray, N.M.; Ritchie, L.D.; Robertson, R.; Samuel, L. Effect of longer health service provider delays on stage at diagnosis and mortality in symptomatic breast cancer. Breast 2015, 24, 248–255. [Google Scholar] [CrossRef] [PubMed]
- Nixon, A.J.; Recht, A.; Neuberg, D.; Connolly, J.L.; Schnitt, S.; Abner, A.; Harris, J.R. The relation between the surgery–radiotherapy interval and treatment outcome in patients treated with breast-conserving surgery and radiation therapy without systemic therapy. Int. J. Radiat. Oncol. Biol. Phys. 1994, 30, 17–21. [Google Scholar] [CrossRef]
- Salomaa, E.R.; Sällinen, S.; Hiekkanen, H.; Liippo, K. Delays in the diagnosis and treatment of lung cancer. Chest 2005, 128, 2282–2288. [Google Scholar] [CrossRef] [PubMed]
- Würschmidt, F.; Bünemann, H.; Ehnert, M.; Heilmann, H.P. Is the time interval between surgery and radiotherapy important in operable nonsmall cell lung cancer? A retrospective analysis of 340 cases. Int. J. Radiat. Oncol. Biol. Phys. 1997, 39, 553–559. [Google Scholar]
- Yorio, J.T.; Xie, Y.; Yan, J.; Gerber, D.E. Lung cancer diagnostic and treatment intervals in the United States: A health care disparity? J. Thorac. Oncol. 2009, 4, 1322–1330. [Google Scholar] [CrossRef] [PubMed]
- Johnston, G.M.; MacGarvie, V.L.; Elliott, D.; Dewar, R.A.; MacIntyre, M.M.; Nolan, M.C. Radiotherapy wait times for patients with diagnosis of invasive cancer, 1992–2000. Clin. Investig. Med. 2004, 27, 142–156. [Google Scholar]
- Poletajew, S.; Lisinski, J.; Moskal, K.; Ornat, J.; Renk, K.; Szlaga, M.; Tworkiewicz, J.; Wojtkowiak, D.; Wołyniec, P.; Woźniak, K.; et al. The time from diagnosis of bladder cancer to radical cystectomy in Polish urological centres—Results of CysTiming Poland study. Cent. Eur. J. Urol. 2014, 67, 329–332. [Google Scholar] [CrossRef] [PubMed]
- Stevens, C.; Bondy, S.J.; Loblaw, D.A. Wait times in prostate cancer diagnosis and radiation treatment. Can. Urol. Assoc. J. 2010, 4, 243–248. [Google Scholar] [CrossRef] [PubMed]
- Robertson, R.; Campbell, N.C.; Smith, S.; Donnan, P.T.; Sullivan, F.; Duffy, R.; Ritchie, L.D.; Millar, D.; Cassidy, J.; Munro, A. Factors influencing time from presentation to treatment of colorectal and breast cancer in urban and rural areas. Br. J. Cancer 2004, 90, 1479–1485. [Google Scholar] [CrossRef] [PubMed]
- Bardell, T.; Belliveau, P.; Kong, W.; Mackillop, W.J. Waiting times for cancer surgery in Ontario: 1984–2000. Clin. Oncol. 2006, 18, 401–409. [Google Scholar] [CrossRef]
- Robinson, D.; Massey, T.; Davies, E.; Jack, R.H.; Sehgal, A.; Møller, H. Waiting times for radiotherapy: Variation over time and between cancer networks in southeast England. Br. J. Cancer 2005, 92, 1201–1208. [Google Scholar] [CrossRef] [PubMed]
- Arndt, V.; Stürmer, T.; Stegmaier, C.; Ziegler, H.; Dhom, G.; Brenner, H. Patient delay and stage of diagnosis among breast cancer patients in Germany—A population based study. Br. J. Cancer 2002, 86, 1034–1040. [Google Scholar] [CrossRef] [PubMed]
- Wyatt, R.M.; Beddoe, A.H.; Dale, R.G. The effects of delays in radiotherapy treatment on tumour control. Phys. Med. Biol. 2003, 48, 139–155. [Google Scholar] [CrossRef]
- Maslach, D.; Krzyzak, M.; Szpak, A.; Owoc, A.; Bielska-Lasota, M. Waiting time for treatment of women with breast cancer in Podlaskie Voivodeship (Poland) in view of place of residence. A population study. Ann. Agric. Environ. Med. 2013, 20, 161–166. [Google Scholar] [PubMed]
- Sawicki, M.; Szczyrek, M.; Krawczyk, P.; Rybojad, P.; Jablonka, A.; Milanowski, J. Reasons for delay in diagnosis and treatment of lung cancer among patients in Lublin Voivodeship who were consulted in Thoracic Surgery Department. Ann. Agric. Environ. Med. 2013, 20, 72–76. [Google Scholar] [PubMed]


| Characteristic | Patients Included in Total Interval Analysis | Patients Included in Diagnostic and Treatment Interval Analysis | ||
|---|---|---|---|---|
| n | (%) | n | (%) | |
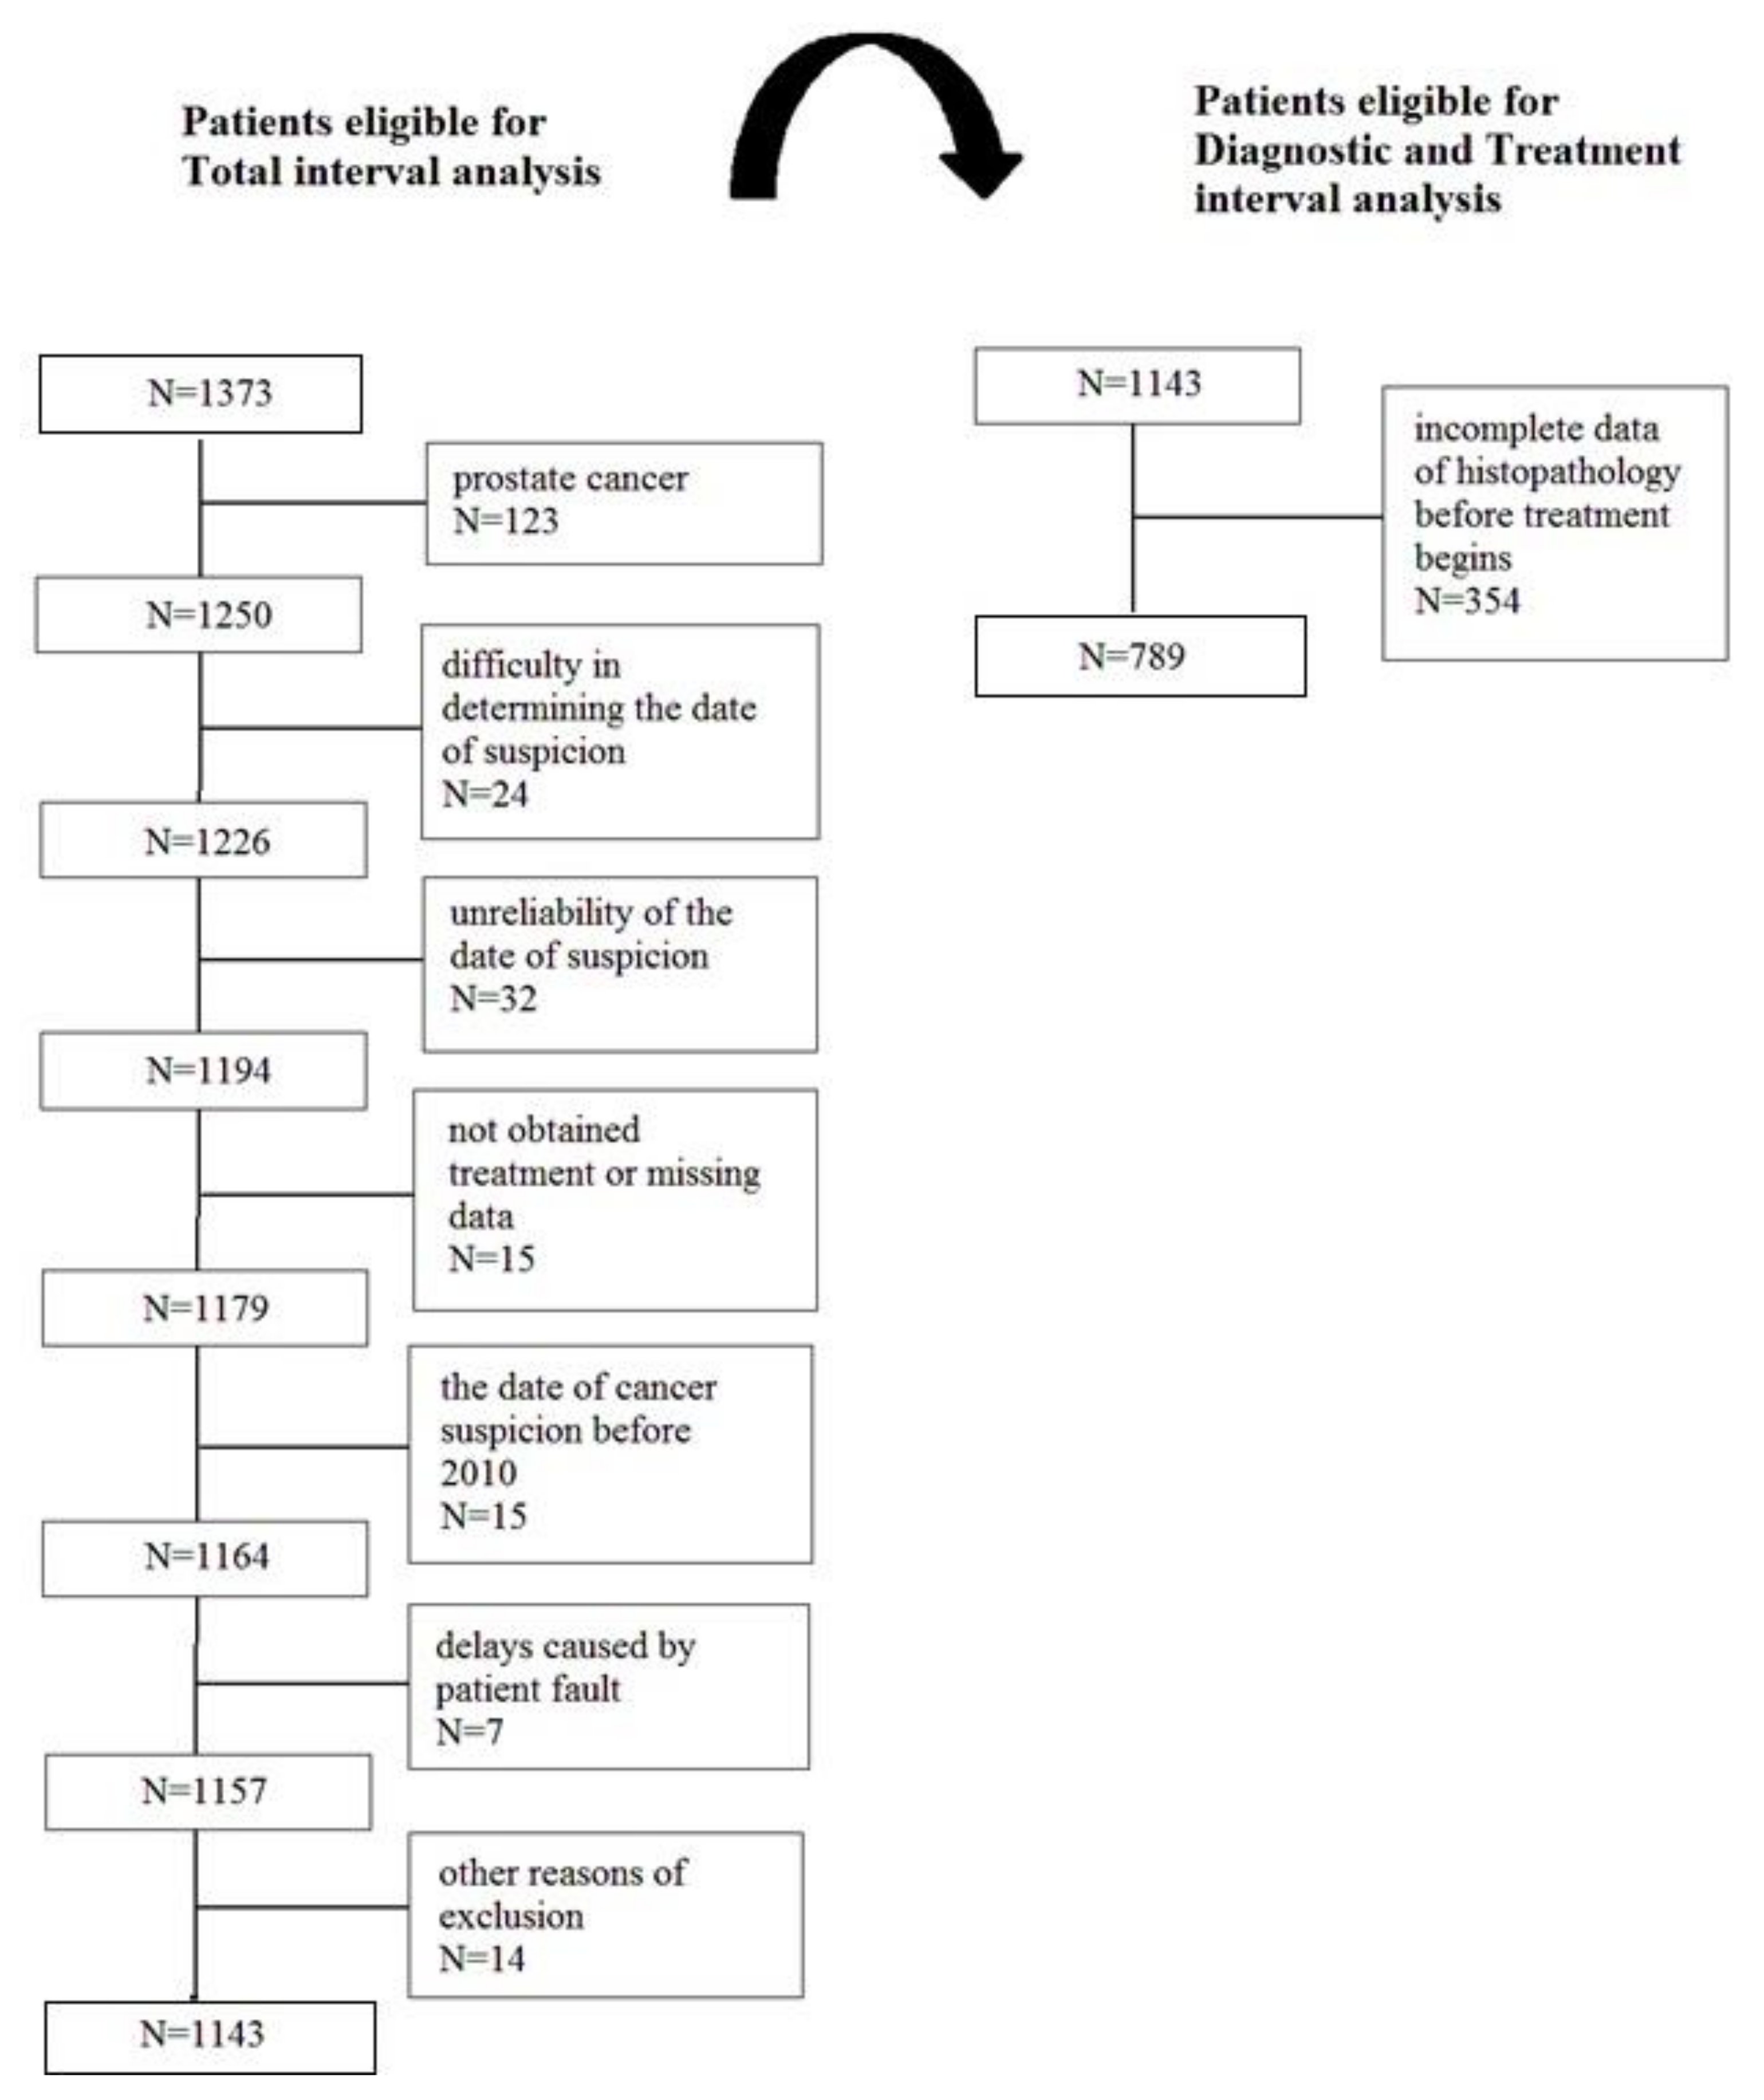
| All patients | 1143 | (100) | 789 | (100) |
| Age (years) | median 61; range 21–91 | median 60; range 21–91 | ||
| Gender | ||||
| Female | 683 | (60) | 477 | (60) |
| Male | 460 | (40) | 312 | (40) |
| Education | ||||
| Primary | 256 | (22) | 179 | (23) |
| Secondary | 729 | (64) | 503 | (64) |
| Higher | 158 | (14) | 107 | (13) |
| Place of residence | ||||
| City >500,000 | 65 | (6) | 43 | (5) |
| City 101,000–500,000 | 282 | (25) | 208 | (26) |
| City 50,000–100,000 | 118 | (10) | 78 | (10) |
| City <500,000 | 342 | (30) | 235 | (30) |
| Village | 336 | (29) | 225 | (29) |
| Professional activity | ||||
| Student | 2 | (0.2) | 2 | (0.3) |
| Active | 371 | (33) | 268 | (34) |
| Unemployed | 82 | (7) | 58 | (7) |
| Pensioner | 688 | (60) | 461 | (59) |
| Marital status | ||||
| Married | 781 | (68) | 536 | (68) |
| Single | 166 | (15) | 117 | (15) |
| Widow/er | 196 | (17) | 136 | (17) |
| Primary tumor localization | ||||
| Breast | 317 | (28) | 240 | (30) |
| Lung | 224 | (20) | 179 | (23) |
| Colon | 164 | (14) | 95 | (12) |
| Head and Neck | 123 | (11) | 98 | (13) |
| Female reproductive organs | 119 | (10) | 73 | (9) |
| Digestive system (upper section) | 60 | (5) | 41 | (5) |
| Urinary system (without prostate) | 40 | (4) | 20 | (3) |
| Brain | 35 | (3) | 9 | (1) |
| Others | 61 | (5) | 34 | (4) |
| Type of “patient route” starting points | ||||
| Symptoms | 917 | (80) | 655 | (83) |
| Privention/screening | 159 | (14) | 113 | (14) |
| Follow-up | 67 | (6) | 21 | (3) |
| Method of treatment beginning | ||||
| Surgery | 583 | (51) | 304 | (39) |
| Radiotherapy/radiochemotherapy | 316 | (28) | 277 | (35) |
| Chemotherapy | 241 | (21) | 205 | (26) |
| Hormonal therapy | 3 | (0.3) | 3 | (0.4) |
| Treatment intention | ||||
| Curative | 899 | (79) | 650 | (82) |
| Palliative | 240 | (21) | 138 | (18) |
| No data | 4 | (0.3) | 1 | (0.1) |
| Facilities | ||||
| IA | 368 | (32) | 270 | (34) |
| IB | 223 | (19) | 143 | (18) |
| IC | 147 | (13) | 89 | (11) |
| IIA | 155 | (14) | 88 | (11) |
| IIIA | 134 | (12) | 93 | (12) |
| IIIB | 116 | (10) | 106 | (14) |
| Private medical services | ||||
| Yes | 248 | (22) | 173 | (22) |
| No | 683 | (60) | 477 | (60) |
| No data | 212 | (18) | 139 | (18) |
| Variable Name | Total Interval (Weeks) | Diagnostic Interval (Weeks) | Treatment Interval (Weeks) | ||||||
|---|---|---|---|---|---|---|---|---|---|
| Median | (25–75% IQR) | p-Value | Median | (25–75% IQR) | p-Value | Median | (25–75% IQR) | p-Value | |
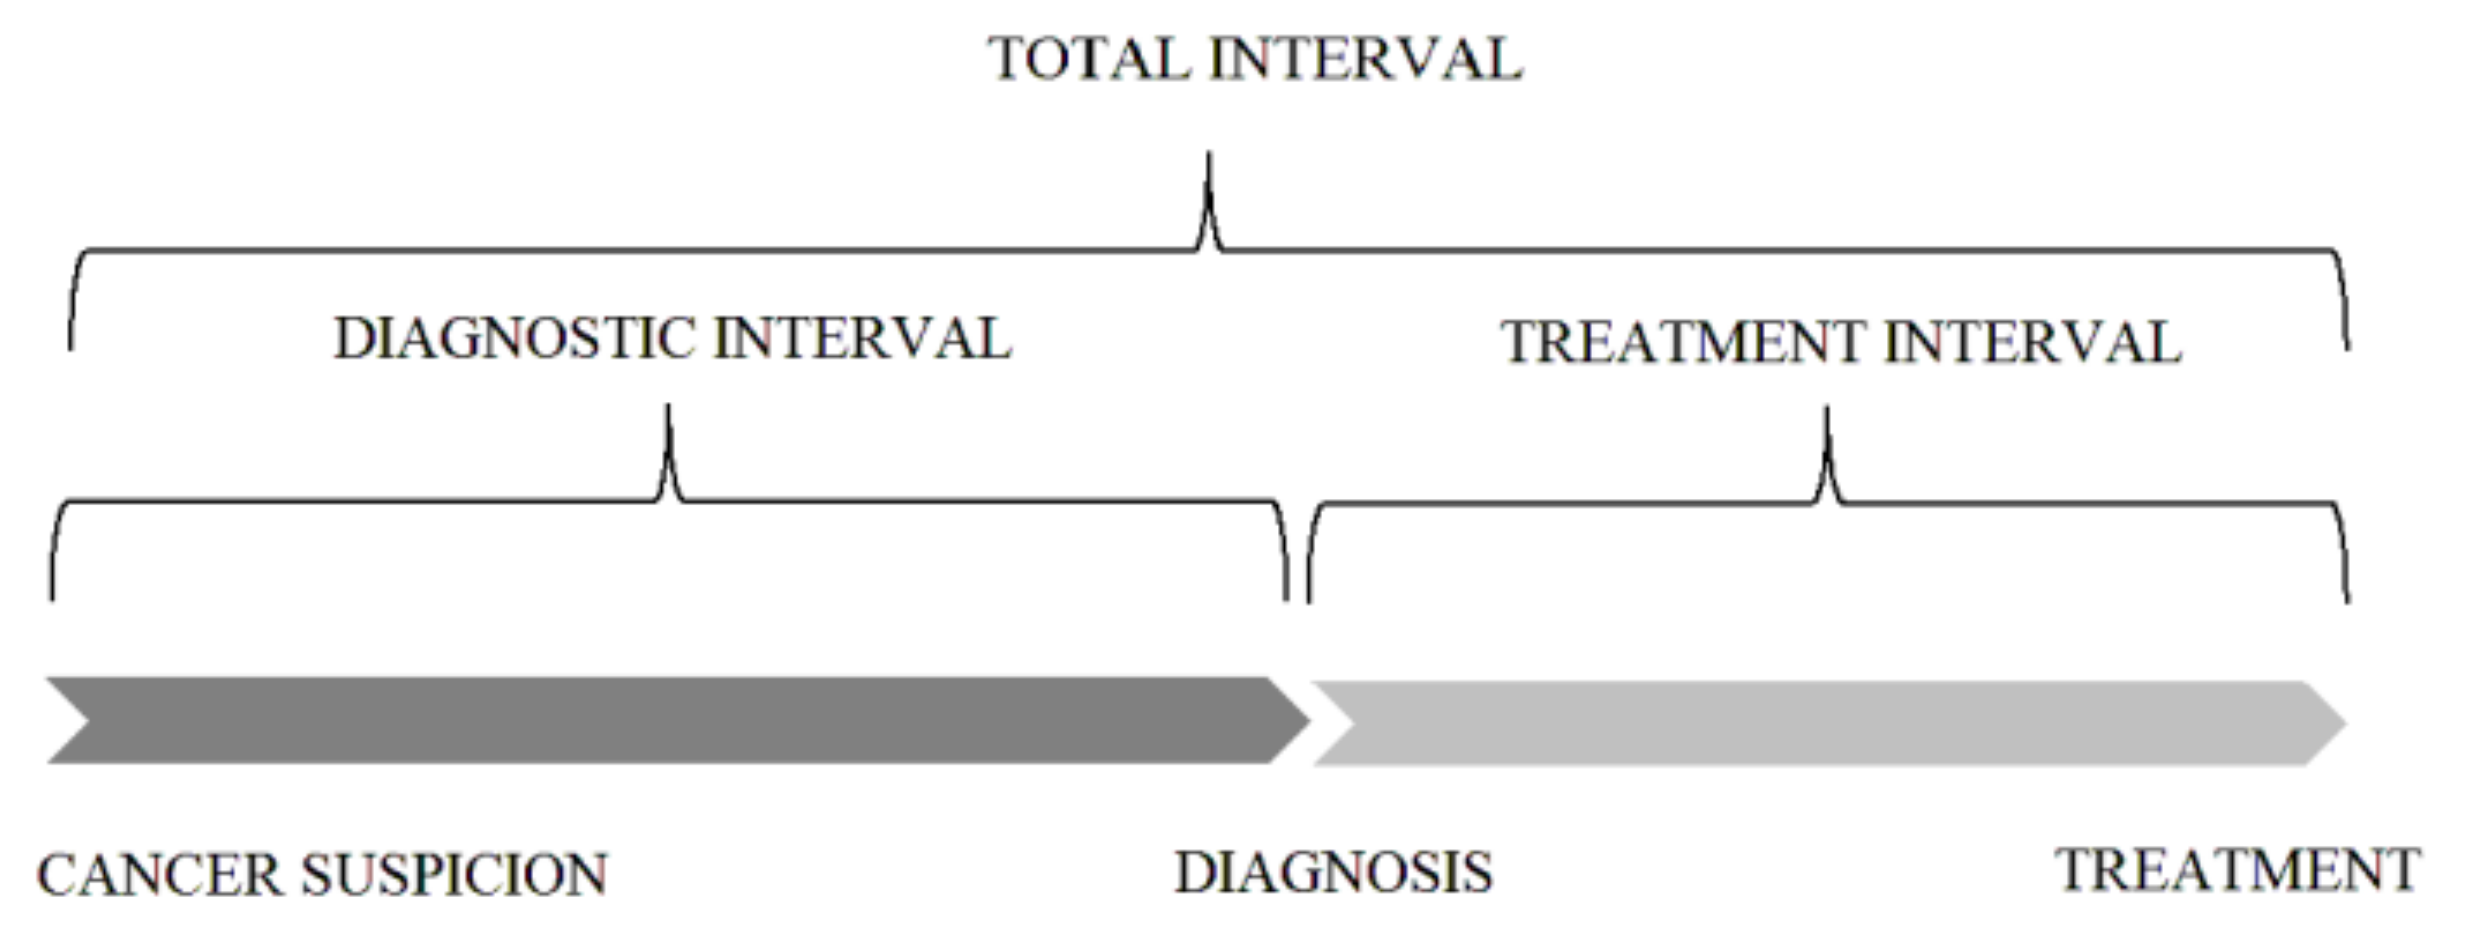
| All patients | 10.6 | (6.1–17.1) | 5.6 | (2.7–10.6) | 5.0 | (2.9–7.9) | |||
| Gender | 0.867 | 0.215 | 0.078 | ||||||
| Female | 10.6 | (6.1–17.0) | 5.4 | (2.4–10.4) | 4.9 | (2.9–7.4) | |||
| Male | 10.6 | (6.0–17.3) | 6.0 | (3.0–11.1) | 5.1 | (3.0–8.4) | |||
| Education | 0.076 | 0.383 | 0.019 | ||||||
| Primary (A) | 12.2 | (6.7–17.1) | 5.3 | (3.1–10.1) | 5.3 | (3.1–9.4) | |||
| Secondary (B) | 10.4 | (6.1–17.1) | 5.7 | (2.7–10.7) | 5.0 | (2.9–7.7) | |||
| Higher (C) | 9.2 | (5.4–16.0) | 5.3 | (2.0–11.1) | 4.1 | (2.9–6.4) | |||
| (p < 0.05 post hoc between A/C) | |||||||||
| Place of residence | 0.061 | 0.066 | 0.016 | ||||||
| City >500,000 (A) | 8.6 | (5.7–16.9) | 3.4 | (2.1–6.6) | 4.4 | (3.0–8.1) | |||
| City 101,000–500,000 (B) | 10.6 | (5.7–17.1) | 5.3 | (2.4–10.5) | 5.1 | (2.9–8.6) | |||
| City 50,000–100,0000 (C) | 8.6 | (5.4–17.6) | 6.4 | (2.6–11.0) | 3.6 | (2.0–6.4) | |||
| City <50,000 (D) | 11.7 | (7.0–17.9) | 6.4 | (2.6–11.3) | 5.1 | (3.0–7.7) | |||
| Village (E) | 10.8 | (6.2–16.9) | 5.7 | (3.3–11.0) | 5.0 | (3.0–7.6) | |||
| (p < 0.05 post hoc between B/C, C/D, C/E) | |||||||||
| Professional activity | 0.006 | <0.001 | 0.041 | ||||||
| Student * | 7.6 | (6.6–8.7) | 3.4 | (0.6–6.1) | 4.3 | (2.6–6.0) | |||
| Active (A) | 9.3 | (5.7–16.3) | 4.6 | (2.1–9.7) | 4.6 | (2.9–7.1) | |||
| Unemployed (B) | 9.4 | (6.1–14.6) | 4.4 | (2.0–8.6) | 5.8 | (3.0–8.3) | |||
| Pensioner (C) | 12.0 | (6.4–17.7) | 6.4 | (3.3–11.4) | 5.1 | (2.9–8.1) | |||
| (p < 0.05 post hoc between A/C) | (p < 0.05 post hoc between A/C) | ||||||||
| Marital status | 0.189 | 0.514 | 0.994 | ||||||
| Married | 10.9 | (6.0–17.3) | 5.7 | (2.7–11.2) | 5.0 | (2.9–7.6) | |||
| Single | 9.7 | (5.3–16.0) | 5.1 | (2.3–9.6) | 4.7 | (2.6–8.3) | |||
| Widow/er | 10.6 | (6.9–17.5) | 5.9 | (3.0–9.3) | 4.6 | (3.0–7.9) | |||
| Primary tumor localization | <0.001 | <0.001 | <0.001 | ||||||
| Breast (A) | 10.9 | (6.3–16.0) | 6.4 | (3.3–10.5) | 4.1 | (2.6–6.3) | |||
| Lung (B) | 12.3 | (7.7–19.0) | 6.3 | (3.3–9.7) | 5.0 | (2.4–8.7) | |||
| Colon (C) | 9.1 | (5.2–16.7) | 5.3 | (2.4–14.0) | 4.4 | (2.6–6.3) | |||
| Head and Neck (D) | 13.0 | (6.7–20.1) | 5.5 | (3.0–12.3) | 6.1 | (3.7–9.3) | |||
| Female reproductive organs (E) | 8.6 | (5.3–12.9) | 2.0 | (1.3–4.0) | 5.9 | (3.9–8.4) | |||
| Digestive system (upper section) (F) | 11.0 | (5.3–17.4) | 6.6 | (3.3–10.4) | 5.1 | (3.1–8.6) | |||
| Urinary system (without prostate) (G) | 9.7 | (5.2–21.6) | 4.9 | (2.9–9.5) | 7.4 | (6.0–11.9) | |||
| Brain (H) | 6.1 | (1.9–12.0) | 5.9 | (2.4–13.0) | 4.9 | (2.4–5.7) | |||
| Others (I) | 14.6 | (6.9–20.6) | 6.2 | (3.7–16.0) | 6.2 | (3.3–9.6) | |||
| (p < 0.05 post hoc between B/C, B/E, B/H, D/E, D/H, E/I, H/I) | (p < 0.05 post hoc between B/E, C/E, D/E, E/G, E/F, A/E, E/I) | (p < 0.05 post hoc between B/G, C/D, C/G, A/D, A/E, A/G) | |||||||
| Type of “patient route” starting points | 0.030 | 0.083 | 0.886 | ||||||
| Symptoms (A) | 10.1 | (6.0–17.0) | 5.3 | (2.6–10.4) | 5.0 | (2.9–8.0) | |||
| Prevention/screening (B) | 12.0 | (7.9–18.9) | 6.9 | (3.7–11.0) | 4.9 | (3.3–7.1) | |||
| Follow-up (C) | 10.1 | (4.6–18.7) | 4.3 | (1.9–13.0) | 4.1 | (2.9–7.0) | |||
| (p < 0.05 post hoc between A/B) | |||||||||
| Method of treatment beginning | <0.001 | 0.335 | <0.001 | ||||||
| Surgery (A) | 8.9 | (4.9–15.9) | 5.9 | (2.8–11.4) | 4.1 | (2.7–6.3) | |||
| Radiotherapy/ radiochemotherapy (B) | 12.7 | (8.0–19.6) | 5.0 | (2.6–10.1) | 6.3 | (4.0–9.6) | |||
| Chemotherapy (C) | 12.1 | (7.1–17.0) | 6.1 | (2.6–10.0) | 4.7 | (2.4–7.4) | |||
| Hormonal therapy * | 14.1 | (5.3–17.0) | 7.9 | (1.4–10.1) | 4.0 | (3.9–9.1) | |||
| (p < 0.05 post hoc between A/B) | (p < 0.05 post hoc between A/B, B/C) | ||||||||
| Treatment intention | 0.598 | 0.148 | 0.524 | ||||||
| Curative | 10.6 | (6.3–17.0) | 5.6 | (2.7–10.3) | 4.9 | (2.9–7.9) | |||
| Palliative | 10.5 | (5.2–18.1) | 6.5 | (3.0–12.4) | 5.1 | (2.4–7.4) | |||
| Facilities | <0.001 | <0.001 | 0.073 | ||||||
| IA (A) | 12.4 | (7.6–16.9) | 6.3 | (3.0–11.6) | 5.1 | (2.9–7.9) | |||
| IB (B) | 9.3 | (5.7–17.3) | 5.3 | (2.1–10.0) | 5.0 | (3.1–8.3) | |||
| IC (C) | 9.4 | (4.9–17.7) | 6.4 | (3.1–12.6) | 5.0 | (3.0–7.4) | |||
| IIA (D) | 10.7 | (5.7–19.0) | 7.4 | (3.6–12.6) | 3.6 | (2.4–6.3) | |||
| IIIA (E) | 8.6 | (4.9–13.0) | 3.3 | (2.1–5.6) | 4.1 | (2.4–7.9) | |||
| IIIB (F) | 12.1 | (7.9–19.9) | 6.2 | (3.4–11.4) | 5.5 | (3.3–8.4) | |||
| (p < 0.05 post hoc between A/E, E/F) | (p < 0.05 post hoc between A/E, B/E, C/E, D/E, E/F) | ||||||||
| Private medical services | 0.011 | 0.133 | 0.284 | ||||||
| Yes | 9.4 | (5.1–17.1) | 5.0 | (2.3–11.1) | 5.1 | (2.9–7.4) | |||
| No | 11.6 | (6.9–17.7) | 6.1 | (3.0–11.1) | 5.1 | (3.0–8.1) | |||
| Time | Variables | p-Value | Akaike Information Criterion (AIC) | Log-Max. Likelihood | p-Value |
|---|---|---|---|---|---|
| Total interval | Primary tumor localization | <0.001 | 6515.93 | 61.53 | <0.001 |
| Method of treatment beginning * | 0.003 | ||||
| Diagnostic interval | Primary tumor localization | <0.001 | 3959.99 | 129.51 | <0.001 |
| Facilities | <0.001 | ||||
| Place of residence | 0.019 | ||||
| Treatment interval | Primary tumor localization | <0.001 | 3416.75 | 122.48 | <0.001 |
| Method of treatment beginning * | <0.001 | ||||
| Facilities | <0.001 |
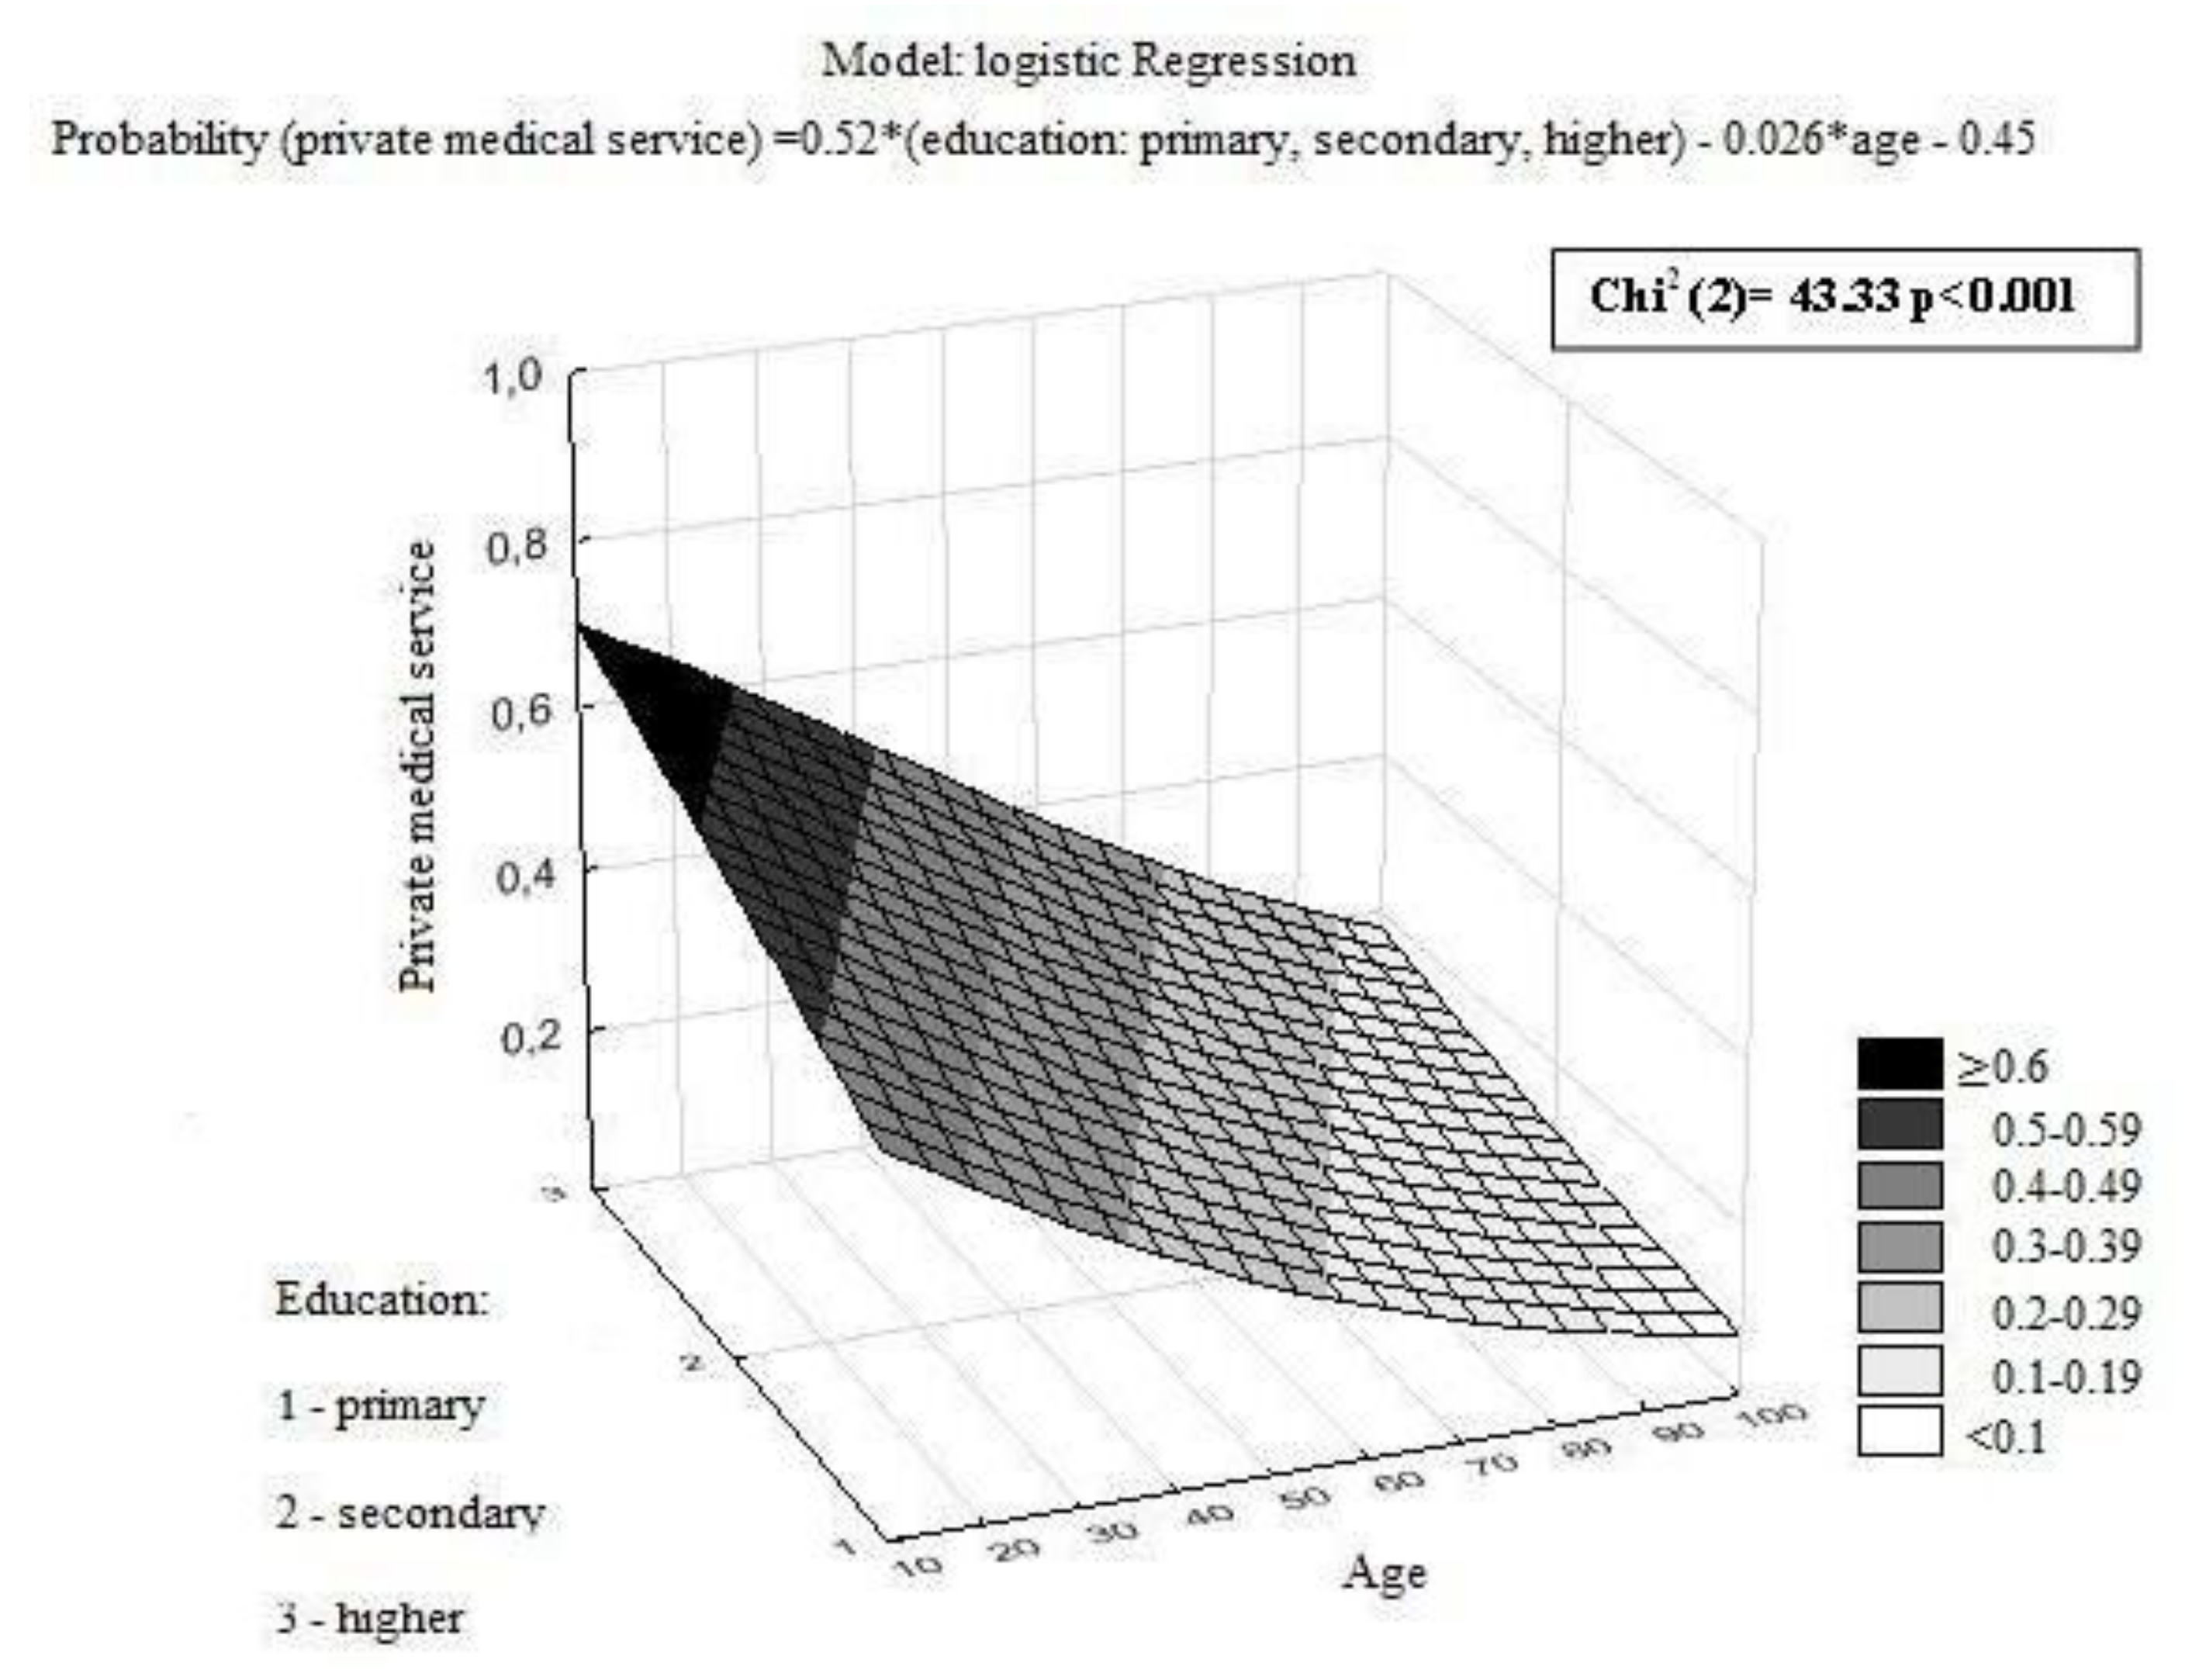
| Variable Name | Private Medical Service | Public Medical Service | p-Value | ||
|---|---|---|---|---|---|
| n | (%) | n | (%) | ||
| All patients | 248 | (27) | 683 | (73) | |
| Gender | 0.051 | ||||
| Female | 155 | (29) | 378 | (71) | |
| Male | 93 | (23) | 305 | (77) | |
| Education | <0.001 | ||||
| Primary | 34 | (16) | 174 | (84) | |
| Secondary | 160 | (27) | 433 | (73) | |
| Higher | 54 | (42) | 76 | (58) | |
| Place of residence | 0.106 | ||||
| City >500,000 | 10 | (22) | 35 | (78) | |
| City 101,000–500,000 | 67 | (32) | 141 | (68) | |
| City 50,000–100,000 | 26 | (29) | 65 | (71) | |
| City <50,000 | 67 | (22) | 239 | (78) | |
| Village | 78 | (28) | 203 | (72) | |
| Professional activity | <0.001 | ||||
| Student * | 1 | (50) | 1 | (50) | |
| Active | 125 | (39) | 192 | (61) | |
| Unemployed | 11 | (17) | 52 | (83) | |
| Pensioner | 111 | (20) | 438 | (80) | |
| Marital status | 0.007 | ||||
| Married | 185 | (29) | 463 | (71) | |
| Single | 37 | (29) | 89 | (71) | |
| Widow/er | 26 | (17) | 131 | (83) | |
| Primary tumor localization | <0.001 | ||||
| Breast | 73 | (32) | 158 | (68) | |
| Lung | 24 | (13) | 156 | (87) | |
| Colon | 43 | (32) | 93 | (68) | |
| Head and Neck | 20 | (18) | 90 | (82) | |
| Female reproductive organs | 29 | (31) | 66 | (69) | |
| Digestive system (upper section) | 18 | (32) | 38 | (68) | |
| Urinary system (without prostate) | 18 | (49) | 19 | (51) | |
| Brain | 11 | (33) | 22 | (67) | |
| Others | 12 | (23) | 41 | (77) | |
| Treatment intention | 0.113 | ||||
| Curative | 199 | (28) | 511 | (72) | |
| Palliative | 49 | (23) | 168 | (77) | |
| Facilities | <0.001 | ||||
| IA | 77 | (21) | 291 | (79) | |
| IB | 57 | (40) | 84 | (60) | |
| IC | 52 | (35) | 95 | (65) | |
| IIA | 22 | (29) | 55 | (71) | |
| IIIA | 20 | (24) | 62 | (76) | |
| IIIB | 20 | (17) | 96 | (83) | |
© 2018 by the authors. Licensee MDPI, Basel, Switzerland. This article is an open access article distributed under the terms and conditions of the Creative Commons Attribution (CC BY) license (http://creativecommons.org/licenses/by/4.0/).
Share and Cite
Osowiecka, K.; Rucinska, M.; Nowakowski, J.J.; Nawrocki, S. How Long Are Cancer Patients Waiting for Oncological Therapy in Poland? Int. J. Environ. Res. Public Health 2018, 15, 577. https://doi.org/10.3390/ijerph15040577
Osowiecka K, Rucinska M, Nowakowski JJ, Nawrocki S. How Long Are Cancer Patients Waiting for Oncological Therapy in Poland? International Journal of Environmental Research and Public Health. 2018; 15(4):577. https://doi.org/10.3390/ijerph15040577
Chicago/Turabian StyleOsowiecka, Karolina, Monika Rucinska, Jacek J. Nowakowski, and Sergiusz Nawrocki. 2018. "How Long Are Cancer Patients Waiting for Oncological Therapy in Poland?" International Journal of Environmental Research and Public Health 15, no. 4: 577. https://doi.org/10.3390/ijerph15040577